organic soil amendments and fertilizers
TRANSCRIPT

SOIL FERTILITY MANAGEMENT BASICSOrganic Soil Amendments and Fertilizers

What are Your Objectives for Soil and Crops?
• Increase soil organic matter
• Improve soil tilth
• Enhance nitrogen availability
• Increase nutrient holding capacity
• Build and maintain active microbial populations
• Suppress crop disease
• Create a ‘balanced soil’ environment

Soil Management Relies on a Biological ComplexThe main function of soil organisms is to break down the remains of plants and other organisms
This process releases energy, nutrients, and carbon dioxide, and creates soil organic matter
Bacteria
Fungi
Actinomycetes
Mycorrhizae
Insects
Nematodes
Clay-humus

Organic additions(manure, compost, crop residues)
Below ground(roots and poop)
Rapid Decay(Sugars, proteins)
Resistant SOM
Organic fertilizers(meals, emulsions)
Decomposition (microbes)
Soil
Slow Decay(Cellulose, lignin)
Slow SOM
Active SOM
MicrobesPlants
Decomposition (microbes)
Humus
Microbial
Nutrients (N,P,S)

• Soil texture, temperature, and moisture
• The ‘quality’ of organic matter additionsC:N ratio and lignin content (L:N ratio)
• Quantity of organic matter
• Placement of materials
• Tillage
Organic Matter Management Concepts
Critical factors that control the rate of decay, nutrient release, and conservation of OM in soil

Important Amendments are not Exclusively Organic
Limestone
Gypsum
Elemental Sulfur
Boron
Chilean nitrate
Mined Potassium
Processed macro- and micronutrients
Rock dusts and some BD preparations

Soil with Structure Soil without Structure
Granular
Blocky
Single Grain
Massive
Soil structure – Aeration, root penetration, water

Soil structure
• Aggregation is a natural process caused largely by biological activity
• Soil organic matter is an important binding agent for soil structure
• Some soils have inherent excellent structure due to clay types and OM

Organic Amendments - Disease Suppression
Basal plate end-rot (compost)
Sclerotinia (compost)
Verticillium (compost and cover crop)
Pythium (cover crop)
Nematodes (cover crop)
Powdery mildew (compost tea)

RAW and AGED MANURES
BenefitsOrganic Matter
NPK – Micronutrients
Nitrogen availability
Beneficial microbes
ChallengesSalinity – Ammonia toxicity
Moisture Content (Handling/Transport)
Microbial pathogens
Nutrient Runoff

SourceNitrogen Phosphorus Potassium
(as excreted) (after losses) (as excreted) (after losses) (as excreted) (after losses)
Beef Cows 10.95 3.3 3.79 3.23 8.25 7.44Milk Cows 10.69 4.3 1.92 1.65 6.7 6.04Heifers & Heifer Calves 6.06 1.82 1.3 1.1 5.03 4.53Steers, Calves, Bulls 10.98 3.3 3.37 2.86 7.87 7.08Breeding Hog & Pig 13.26 3.32 4.28 3.62 7.85 7.04Other Hog & Pig 11.3 2.82 3.29 2.8 7.95 7.16
Hens&Pullets - Laying Age 26.93 18.46 9.98 8.5 10.44 9.4Pullets under 3 Mo. 27.2 13.6 10.53 8.95 11.41 10.27Broiler 26.83 16.1 7.8 6.61 10.49 9.48Turkeys for Slaughter 32.36 16.18 11.83 10.06 11.61 10.44Turkey Hens for Breeding 22.41 11.2 13.21 11.23 7.6 6.84
Manures Vary in Composition and Quality
----------------------- lbs/dry ton ---------------------
Nitrogen and other Macronutrients

COMPOSTS
BenefitsOrganic Matter
Nitrogen availability
Slower nutrient release
Beneficial microbes
Microbial pathogen reduction
Reduced salinity/toxicity
Reduced moisture content
Decreased pollution risk ChallengesCosts
Reduced nutrient release
Quality Assurance

FACTORS AFFECTING COMPOST QUALITY
Raw organic feedstocks and proportions
Initial and final particle-size
Degree of initial blending
Desired production time
Size of piles/windrows
Moisture management
Aeration – Frequency and equipment
Curing

COMPARISON OF YARD WASTE AND MANURE COMPOSTS
____________________________________________________________________________________________
Sample OM Total N C/N NH3 -N pH Salts N+P+K Moisture < 2 mm----- % ----- [ppm] [mmhos] --------------- % --------------
____________________________________________________________________________________________
Yard 40.3 1.6 15 231 7.2 4.0 4.2 29.4 72.4
Blend 49.5 2.0 13 734 8.6 8.3 7.0 32.2 79.2
Poultry 40.0 3.9 7 5578 9.2 14.1 7.6 37.5 71.4
____________________________________________________________________________________________

Cover and Green Manure Crops
BenefitsOrganic Matter
Nitrogen and Phosphorus availability
Microbial activity
Selective pathogen reduction?
ChallengesReduced soil moisture content
Potential for nitrogen tie-up
Incorporation and decomposition
Stimulation of diseases (e.g. Pythium)

• Soil texture, temperature, and moisture
• The ‘quality’ of organic matter additionsC:N ratio, L:N ratio, and water-solubility
• Quantity of organic matter
• Placement of materials
• Tillage
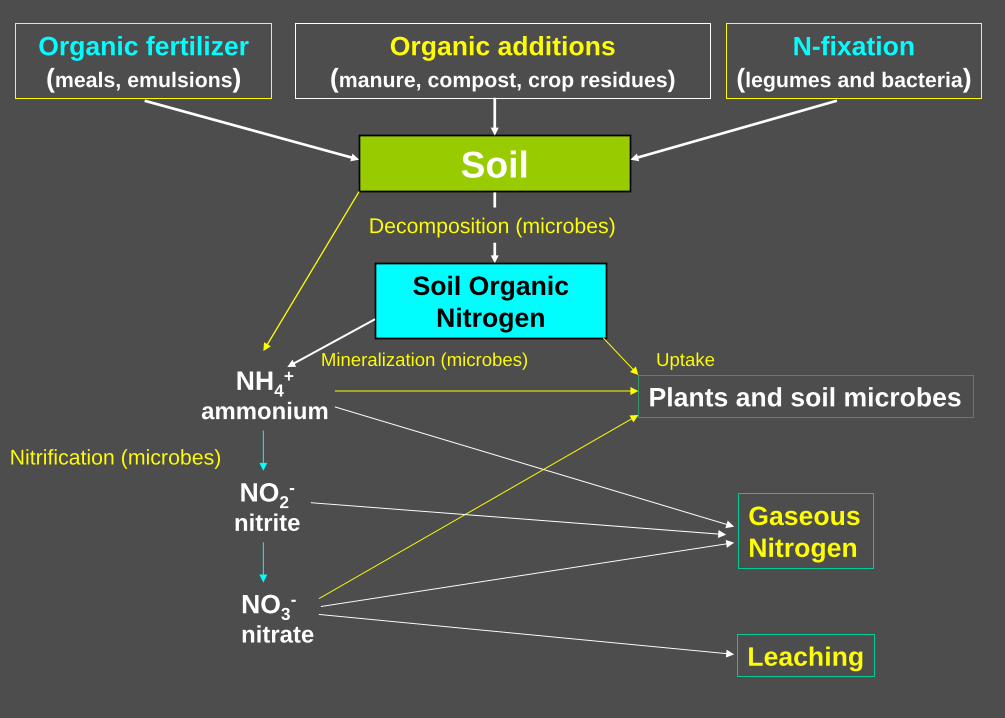
Nitrogen Management Concepts
Critical factors that control the rate of Nitrogen (N) release

Organic additions(manure, compost, crop residues)
N-fixation(legumes and bacteria)
Soil OrganicNitrogen
Plants and soil microbes
Organic fertilizer(meals, emulsions)
Soil

Organic additions(manure, compost, crop residues)
N-fixation(legumes and bacteria)
Soil OrganicNitrogen
Plants and soil microbes
Organic fertilizer(meals, emulsions)
NH4+
ammonium
SoilDecomposition (microbes)
Uptake

Organic additions(manure, compost, crop residues)
N-fixation(legumes and bacteria)
Soil OrganicNitrogen
Plants and soil microbes
GaseousNitrogen
Organic fertilizer(meals, emulsions)
NH4+
ammonium
NO2-
nitrite
Nitrification (microbes)
SoilDecomposition (microbes)
Mineralization (microbes) Uptake
Leaching
Organic additions(manure, compost, crop residues)
N-fixation(legumes and bacteria)
Soil OrganicNitrogen
Plants and soil microbes
GaseousNitrogen
Organic fertilizer(meals, emulsions)
NH4+
ammonium
NO2-
nitrite
NO3-
nitrate
Nitrification (microbes)
SoilDecomposition (microbes)
UptakeMineralization (microbes)
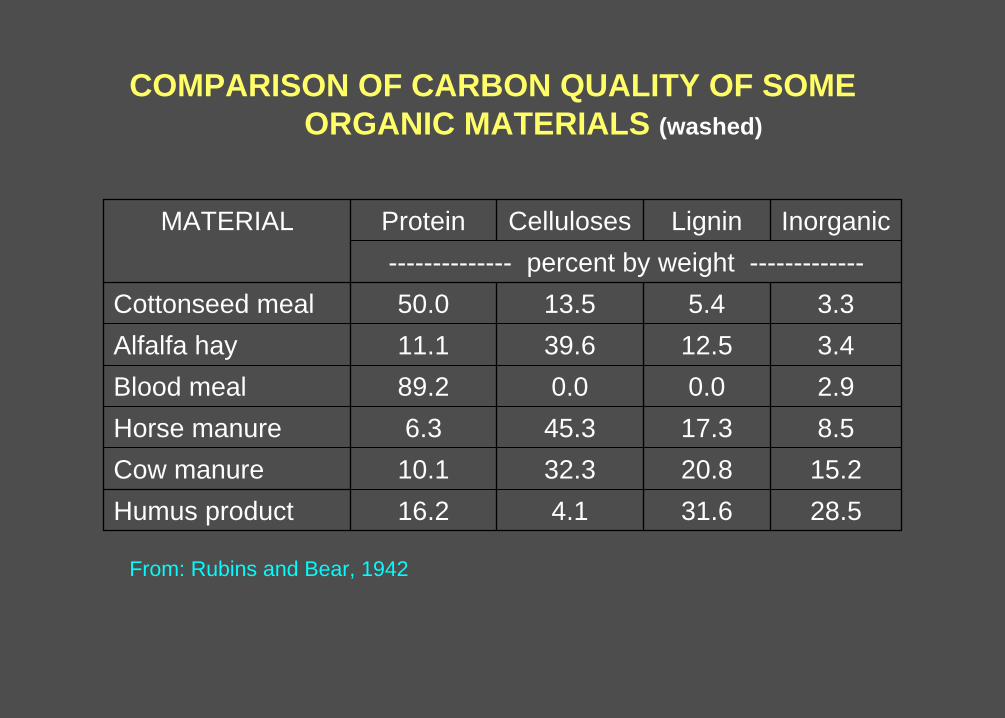
COMPARISON OF CARBON QUALITY OF SOME ORGANIC MATERIALS (washed)
MATERIAL Protein Celluloses Lignin Inorganic-------------- percent by weight -------------
Cottonseed meal 50.0 13.5 5.4 3.3Alfalfa hay 11.1 39.6 12.5 3.4Blood meal 89.2 0.0 0.0 2.9Horse manure 6.3 45.3 17.3 8.5Cow manure 10.1 32.3 20.8 15.2Humus product 16.2 4.1 31.6 28.5
From: Rubins and Bear, 1942

COMPARISON OF POTENTIAL N VALUE OF SOME ORGANIC MATERIALSMATERIAL UNWASHED WASHED
TotalNitrogen
Insoluble N
N Release
TotalNitrogen
C:N Ratio N Release
-------------------------- percent by weight -------------------------
Cottonseed meal 7.2 93.0 49 8.7 5.4 50Soybean meal 7.6 84.2 61 10.3 4.7 58
Alfalfa hay 2.8 52.5 28 2.2 20.8 4Wheat straw 0.3 61.7 -16 0.25 107 -16
Bone meal 4.2 99.8 7 4.3 3.5 6Blood meal 13.8 97.5 60 14.7 3.5 51Fish meal (acid) 8.5 68.1 56 8.4 5.3 33
Peruvian guano 14.0 43.9 80 14.4 1.3 67Chicken manure 2.3 32.9 30 1.0 36.4 -19Horse manure 1.5 80.0 -19 1.3 32.7 -19Cow manure 2.0 69.7 5 1.8 24.4 -10
Humus product 2.5 100.0 3 2.7 13.7 3

-20
-10
0
10
20
30
40
50
60
VIM MM MM M M M VM VIM VIM MM M M VM
COMPOST MATURITY
BLEND YARD
NITROGEN RELEASE POTENTIAL RELATED TO MATURITY OF COMPOSTS

___________________________________________________________________________________________________________Material 85 Days [planting] 190 Days [harvest] 240 Days [POST-harvest]
N released lbs/day N released lbs/day N released lbs/day ___________________________________________________________________________________________________________
Sandy loam soil 13 0.15 75 0.39 110 0.46
Yard compost [IM] 2 0.02 90 0.47 140 0.58
Blend compost [M] 45 0.53 110 0.59 188 0.78___________________________________________________________________________________________
____________________________________________Material Post-harvest [190 to 240 Days]
lbs/day % total release_____________________________________________
Sandy loam soil 0.84 38
Yard compost [IM] 1.16 41
Blend compost [M] 1.70 45_____________________________________________
TIMING OF N RELEASE IN RELATION TO SPRING LETTUCE SCHEDULE

WHAT MIGHT BE IMPORTANT TO KNOW ABOUT COMPOST BEFORE BUYING?
Constituents Analytical Values InterpretationOrganic Matter (%) 37.7 AverageTotal Nitrogen (%) 2.3 ExcellentAmmonium-Nitrogen (ppm) 170 OKNitrate-Nitrogen (ppm) 1400 HighTotal Phosphorus (%) 0.84 ExcellentTotal Potassium (%) 1.7 ExcellentBoron (ppm) 32 Good Lead (ppm) 36Zinc (ppm) 180pH 6.7 OKSalinity (EC) (mmhos) 7.2 Restricts some usesC:N Ratio 9.8 Good to excellentParticle Size Distribution (%) 38.9 > ¼ inch Restricts some usesMaturity Mature to very mature Restricts some usesE. coli – Salmonella (MPN) < 2 and <3 Very clean

What are Your Objectives for Soil and Crops?
• Increase soil organic matterHigh applications of bulky organics
Grass cover crops (root mass)
Higher C:N or L:N amendments
Reduce tillage
How much time do you have?

What are Your Objectives for Soil and Crops?
• Improve soil tilthAvoid working wet soil – reduce tillage
Encourage microbial activity
Grass cover crops (root mass)
Crop rotation

What are Your Objectives for Soil and Crops?
• Enhance nitrogen availabilityApply soluble fertilizers
Green manure cover crops
Early plowdownGreen, pre-flowering, low L:N
Exploit wet-dry cycles w/tillage
Build organic matter

What are Your Objectives for Soil and Crops?
• Increase nutrient holding capacityBe patient – Humus building is slow
- --++-----------+
+-----------+- --+
- +-
-
--
-
-
--
---
-
- +
++
++
++
+ +
+
+ + +++ + + - -
+++ +
+ +++
++
++
+
+++
++
+++
-
-
---
+
+
+++
- -- -
-
-
---
-- -
-
-
--
-
--
-
-
--
--
+
+
+
--
- -
-
-
--
- -
---
-
-
-
-
- -
-
--
-
-
- -
-
-
-
-
-
-
-
---
+
Clay- SOM

What are Your Objectives for Soil and Crops?
• Build and maintain active microbial populationsProvide regular and diverse food
Crop rotationGrass and legume cover cropsActive microbial composts
Avoid working wet soil
Avoid concentrating raw manures
Maintain uniform moisture

What are Your Objectives for Soil and Crops?
• Suppress crop diseaseManagement not control
Understand ecology of diseases
Practice ‘informed rotations’
Choose specific cover crops
Avoid planting soon behind heavy manure applications
Avoid old, mineralized composts
Avoid sole reliance on any input
Diversify, diversify

What are Your Objectives for Soil and Crops?
• Create a ‘balanced soil’ environmentObserve crop healthLearn what is ‘missing’Consider organic and inorganicKnow your materialsManage irrigationAvoid excessive applications

THANK YOU

Microbial Pathogens in ‘For-market’ Composts
Feedstocks:Yard wastesManuresFood and Process Wastes
11 of 31 samples [34%] had a negative pathogen index score
Fecal Coliform (MPN/g) 0 – 20,000,000 (42,000)
E. coli (MPN/g) 0 – 20,000,000 (37,000)
E. Coli strain 157 (Pos-Neg) 3 Positives
Salmonella (MPN/4g) all < 0.9 or zero
Fecal Streptococci (MPN/g) 0 – 23,000,000 (5,300,000)
Listeria (MPN/g) 0 – 430 (88)
Clostridium perfringens (MPN/g) 0 – 76,000 (3,400)