organic production organic production of ukraine
TRANSCRIPT
Organic Production of UkraineO
RGA
NIC
PRO
DUCT
ION
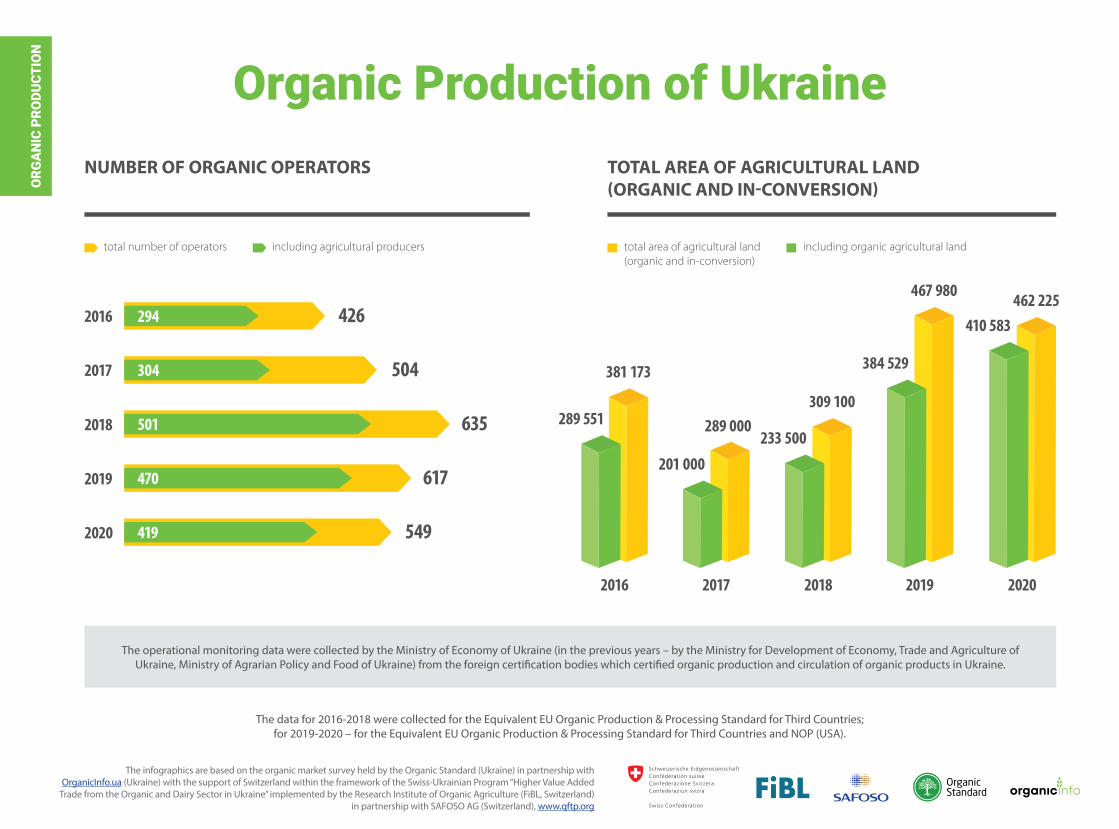
NUMBER OF ORGANIC OPERATORS
total number of operators
The data for 2016-2018 were collected for the Equivalent EU Organic Production & Processing Standard for Third Countries;for 2019-2020 – for the Equivalent EU Organic Production & Processing Standard for Third Countries and NOP (USA).
including agricultural producers
TOTAL AREA OF AGRICULTURAL LAND (ORGANIC AND IN-CONVERSION)
total area of agricultural land (organic and in-conversion)
including organic agricultural land
The operational monitoring data were collected by the Ministry of Economy of Ukraine (in the previous years – by the Ministry for Development of Economy, Trade and Agriculture of Ukraine, Ministry of Agrarian Policy and Food of Ukraine) from the foreign certification bodies which certified organic production and circulation of organic products in Ukraine.
The infographics are based on the organic market survey held by the Organic Standard (Ukraine) in partnership with OrganicInfo.ua (Ukraine) with the support of Switzerland within the framework of the Swiss-Ukrainian Program “Higher Value Added
Trade from the Organic and Dairy Sector in Ukraine” implemented by the Research Institute of Organic Agriculture (FiBL, Switzerland) in partnership with SAFOSO AG (Switzerland), www.qftp.org
4262942016
5043042017
6355012018
6174702019
5494192020
2016
381 173
2017 2018 2019 2020
289 000
467 980
201 000
289 551233 500
309 100
384 529
462 225
410 583

ORG
AN
IC S
ALE
S
DOMESTIC MARKET
The infographics are based on the organic market survey held by the Organic Standard (Ukraine) in partnership with OrganicInfo.ua (Ukraine) with the support of Switzerland within the framework of the Swiss-Ukrainian Program “Higher Value Added
Trade from the Organic and Dairy Sector in Ukraine” implemented by the Research Institute of Organic Agriculture (FiBL, Switzerland) in partnership with SAFOSO AG (Switzerland), www.qftp.org
tons
EXPORT MARKET
2018
2018 2019
2019
6 700
million USD21
million USD24
2020
million USD25
tons7 350
tons7 850
2020
Sales of organic products
245 100tons
2016
78million USD
254 000tons
2017
102million USD
390 000tons
2018
157million USD
469 000tons
2019
million USD
332 000tons
2020
204million USD189

ORGANIC MAP OF UKRAINE
Legend:
01 – 999
1 000 – 9 99910 000 – 29 999
> 30 000
Total area of agricultural land(organic and in-conversion), ha
462 225
410 583
Total area of agricultural land (organic and in-conversion), ha, certified according to the Equivalent EU Organic Production & Processing Standard for Third Countries and NOP (USA),
including organic agricultural land, ha
549
as of 31.12.2020
Total number of operators, including 419 agricultural producers, certified according to the Equivalent EU Organic Production & Processing Standard for Third Countries and NOP (USA)
The operational monitoring data were collected by the Ministry of Economy of Ukraine from the foreign certification bodies which certified organic production and circulation of organic products in Ukraine.
The map has been produced by the Information center “Green Dossier” (OrganicInfo.ua) and Organic Standard certification body with the support of Switzerland within the framework of the Swiss-Ukrainian Program “Higher Value Added Trade from the Organic and Dairy Sector in Ukraine” implemented by the Research Institute of Organic Agriculture (FiBL, Switzerland) in partnership with SAFOSO AG (Switzerland), www.qftp.org.
Sumy
Kharkiv
PoltavaCherkasy
Zhytomyr
Rivne
Lutsk
Lviv
Ternopil
Khmelnytskyi
Chernivtsi
Vinnytsia
KropyvnytskyiDnipro
ZaporizhzhiaDonetsk
Luhansk
Kherson
Mykolaiv
Odesa
Simferopol
Uzhhorod
Ivano-Frankivsk
Volyn
Kirovohrad
Dnipropetrovsk
AutonomousRepublic of Crimea
Zakarpattia
Chernihiv
Kyiv
4 8404 717
21
20 56019 897
20
29 28928 101
279 7298 511
8
29 60729 457
30
3 8243 264
1900
0
00
0
5959
1
44 53917 086
17
18 58414 568
21
81 69570 638
52
213135
38
13 46413 352
10
40 00539 975
13
4 7814 243
53
17 03216 942
21
62 08462 006
10
838798
13
190190
3
12 46211 792
32
1 112 1 110
14
58 12155 046
44
37883
7
8 8198 613
70
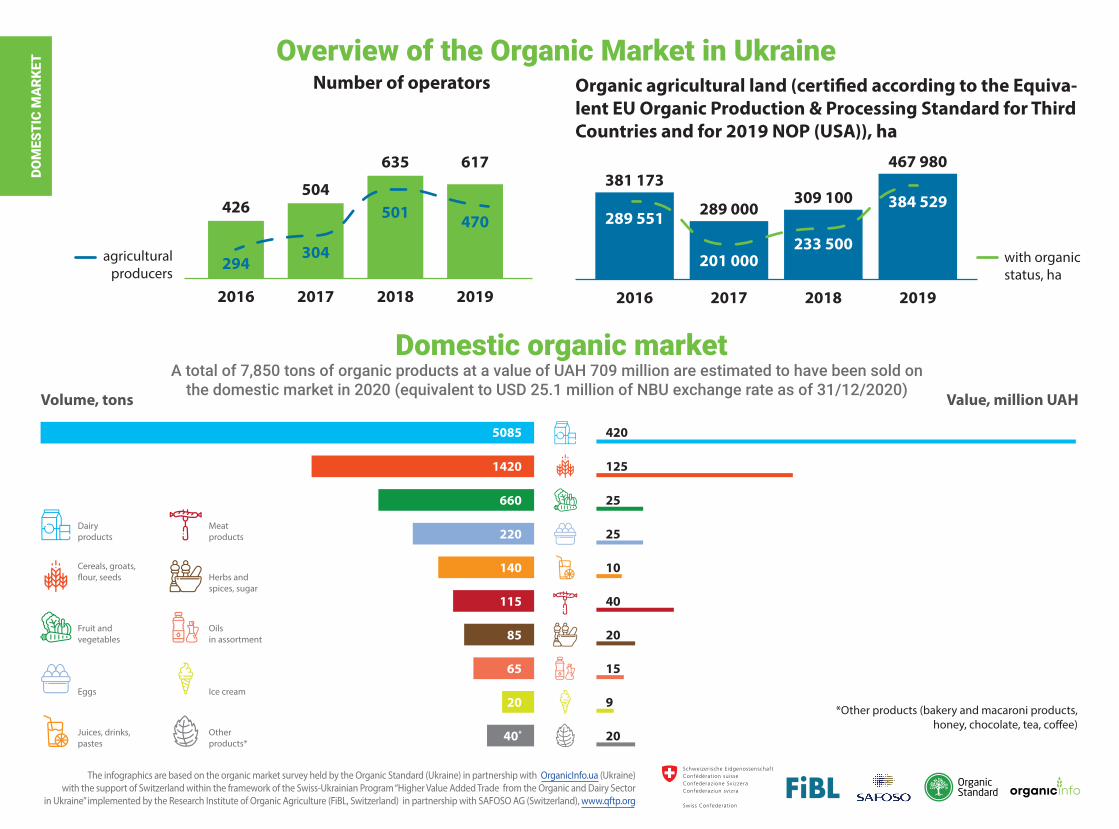
Overview of the Organic Market in Ukraine
Domestic organic market
2016
426
Number of operators
294
2017
504
304
2018
635
501
2019
617
agriculturalproducers
with organicstatus, ha
Value, million UAHVolume, tons
*Other products (bakery and macaroni products,honey, chocolate, tea, co�ee)
DOM
ESTI
C M
ARK
ET
The infographics are based on the organic market survey held by the Organic Standard (Ukraine) in partnership with OrganicInfo.ua (Ukraine)with the support of Switzerland within the framework of the Swiss-Ukrainian Program “Higher Value Added Trade from the Organic and Dairy Sector
in Ukraine” implemented by the Research Institute of Organic Agriculture (FiBL, Switzerland) in partnership with SAFOSO AG (Switzerland), www.qftp.org
470
2016
381 173
289 551
2017
289 000
201 000
2018 2019
309 100
233 500
467 980
384 529
5085
1420
660
220
140
115
85
65
20
40*
420
125
25
25
10
40
20
15
9
20
A total of 7,850 tons of organic products at a value of UAH 709 million are estimated to have been sold on the domestic market in 2020 (equivalent to USD 25.1 million of NBU exchange rate as of 31/12/2020)
Dairyproducts
Meatproducts
Cereals, groats,�our, seeds Herbs and
spices, sugar
Fruit andvegetables
Oilsin assortment
Juices, drinks,pastes
Otherproducts*
Ice creamEggs
Organic agricultural land (certified according to the Equiva-lent EU Organic Production & Processing Standard for Third Countries and for 2019 NOP (USA)), ha

420
240
15
10
641
406
286
40
31
53
43
22
5
0.3
Value, million UAHVolume, tons
Value, million UAHVolume, tons
Value, million UAHVolume, tons
DOM
ESTI
C M
ARK
ET Volume of the Ukrainian organic productssold on the domestic market, 2020
ORGANIC DAIRY PRODUCTS
ORGANIC CEREALS, GROATS, FLOUR, SEEDS
ORGANIC FRUITS AND VEGETABLES
Milk
Cottage cheese
Yoghurt
Sour cream
Butter
Hard cheese
Fermented baked milk
Kefir
Brynza cheese
Vegetables
Fruits
Groats
Flakes
Flour
Grains/seeds
Other
Sweet cream cheese
Sour milk drinks
Cream
2628
1049
357
296
245
245
118
69
49
12
9
6
118
50
64
95
40
23
5
21
10
2
2
1
The infographics are based on the organic market survey held by the Organic Standard (Ukraine) in partnership with OrganicInfo.ua (Ukraine)with the support of Switzerland within the framework of the Swiss-Ukrainian Program “Higher Value Added Trade from the Organic and Dairy Sector
in Ukraine” implemented by the Research Institute of Organic Agriculture (FiBL, Switzerland) in partnership with SAFOSO AG (Switzerland), www.qftp.org
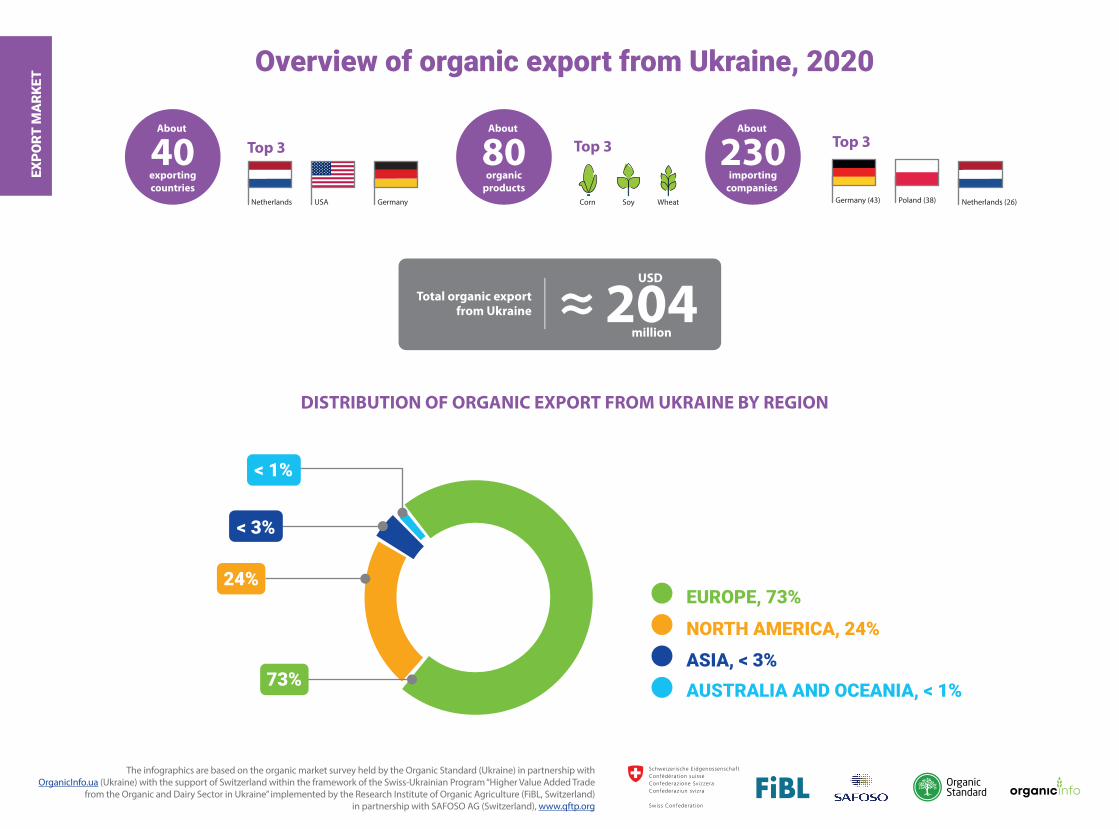
Overview of organic export from Ukraine, 2020
DISTRIBUTION OF ORGANIC EXPORT FROM UKRAINE BY REGION
EXPO
RT M
ARK
ET
Total organic exportfrom Ukraine
About
40exportingcountries
About
80organic
products
About
230importing
companies Netherlands Germany
Top 3
Germany (43) Poland (38) Netherlands (26)
Top 3Top 3
Corn Soy Wheat
EUROPE, 73%
NORTH AMERICA, 24%
ASIA, < 3%AUSTRALIA AND OCEANIA, < 1%
204≈USD
million
USA
< 1%
< 3%
73%
24%
The infographics are based on the organic market survey held by the Organic Standard (Ukraine) in partnership with OrganicInfo.ua (Ukraine) with the support of Switzerland within the framework of the Swiss-Ukrainian Program “Higher Value Added Trade
from the Organic and Dairy Sector in Ukraine” implemented by the Research Institute of Organic Agriculture (FiBL, Switzerland) in partnership with SAFOSO AG (Switzerland), www.qftp.org

Top 10 countries in the worldimporting organic products from Ukraine, 2020
EXPO
RT M
ARK
ET
332,000 TONS USD 204 MILLIONTotal amount and value of organic export from Ukraine
The infographics are based on the organic market survey held by the Organic Standard (Ukraine) in partnership with OrganicInfo.ua (Ukraine) with the support of Switzerland within the framework of the Swiss-Ukrainian Program “Higher Value Added Trade
from the Organic and Dairy Sector in Ukraine” implemented by the Research Institute of Organic Agriculture (FiBL, Switzerland) in partnership with SAFOSO AG (Switzerland), www.qftp.org
USA
Amount (tons)
67,000
Value (million USD)
48.5
LITHUANIA
Amount (tons)
21,500
Value (million USD)
5.8
UNITEDKINGDOMAmount (tons)
16,900
Value (million USD)
3.9
NETHERLANDS
Amount (tons)
97,400
Value (million USD)
29.5
CANADA
Amount (tons)
13,100
Value (million USD)
25.3
GERMANY
Amount (tons)
41,600
Value (million USD)
27
AUSTRIA
Amount (tons)
18,600
Value (million USD)
15.8
ITALY
Amount (tons)
6,800
Value (million USD)
4
SWITZERLAND
Amount (tons)
5,000
Value (million USD)
2.4
POLAND
Amount (tons)
15,300
Value (million USD)
19.6
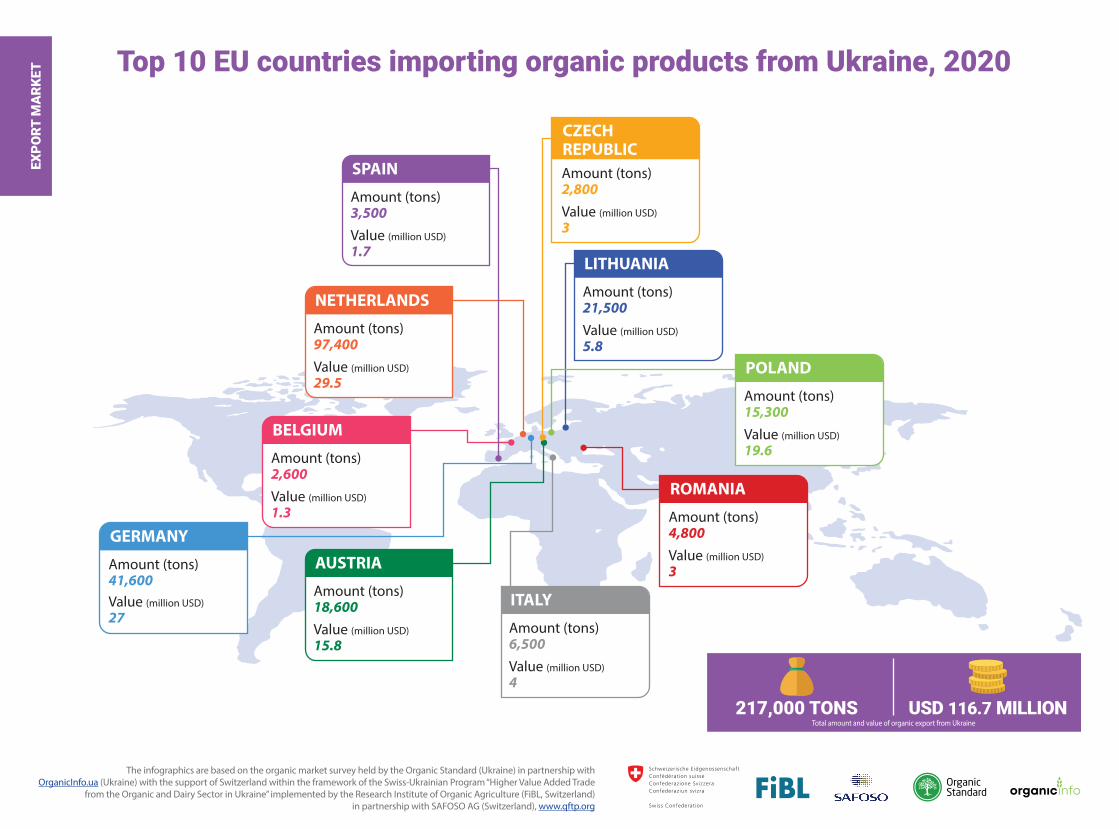
Top 10 EU countries importing organic products from Ukraine, 2020
LITHUANIA
Amount (tons)21,500
Value (million USD)
5.8
NETHERLANDS
Amount (tons)97,400
Value (million USD)
29.5
GERMANY
Amount (tons)41,600
Value (million USD)
27
AUSTRIA
Amount (tons)18,600
Value (million USD)
15.8
ITALY
Amount (tons)6,500
Value (million USD)
4
POLAND
Amount (tons)15,300
Value (million USD)
19.6
ROMANIA
Amount (tons)4,800
Value (million USD)
3
BELGIUM
Amount (tons)2,600
Value (million USD)
1.3
CZECH REPUBLICAmount (tons)2,800
Value (million USD)
3
SPAIN
Amount (tons)3,500
Value (million USD)
1.7
EXPO
RT M
ARK
ET
217,000 TONS USD 116.7 MILLIONTotal amount and value of organic export from Ukraine
The infographics are based on the organic market survey held by the Organic Standard (Ukraine) in partnership with OrganicInfo.ua (Ukraine) with the support of Switzerland within the framework of the Swiss-Ukrainian Program “Higher Value Added Trade
from the Organic and Dairy Sector in Ukraine” implemented by the Research Institute of Organic Agriculture (FiBL, Switzerland) in partnership with SAFOSO AG (Switzerland), www.qftp.org

Organic import to the EU*, 2020(by country of origin)
2 – DOMINICANREPUBLIC252,293 tons(9%)
8 – COLOMBIA
106,766 tons(3.8%)
4 – UKRAINE
217,210 tons(7.8%)
7 – TURKEY
155,741 tons(5.6%)
1 – ECUADOR
324,071 tons(11.6%)
5 – PERU
200,860 tons(7.2%)
9 – BRAZIL
67,225 tons(2.4%)
6 – INDIA
174,311 tons(6.2%)
3 – CHINA
227,669 tons(8.1%)
10 – MEXICO
66,127 tons(2.4%)
OTHER COUNTRIES1,685,507 tons 64,1%Total:2,794,103 tons 100%
EXPO
RT M
ARK
ET
* According to the Report of the European Commission on imports of organic agri-food products to the EU in 2020
The infographics are based on the organic market survey held by the Organic Standard (Ukraine) in partnership with OrganicInfo.ua (Ukraine) with the support of Switzerland within the framework of the Swiss-Ukrainian Program “Higher Value Added Trade
from the Organic and Dairy Sector in Ukraine” implemented by the Research Institute of Organic Agriculture (FiBL, Switzerland) in partnership with SAFOSO AG (Switzerland), www.qftp.org