organic molecules in the sheepbed mudstone, gale crater, mars
TRANSCRIPT

Organic molecules in the Sheepbed Mudstone, Gale Crater, Mars
The MIT Faculty has made this article openly available. Please share how this access benefits you. Your story matters.
Citation Freissinet, C.; Glavin, D. P.; Mahaffy, P. R.; Miller, K. E.; Eigenbrode,J. L.; Summons, R. E.; Brunner, A. E. et al. “Organic Molecules inthe Sheepbed Mudstone, Gale Crater, Mars.” Journal of GeophysicalResearch: Planets 120, no. 3 (March 2015): 495–514 ©2015 TheAuthors
As Published http://dx.doi.org/10.1002/2014je004737
Publisher American Geophysical Union (AGU)
Version Final published version
Citable link http://hdl.handle.net/1721.1/109264
Terms of Use Creative Commons Attribution-NonCommercial-NoDerivs License
Detailed Terms http://creativecommons.org/licenses/by-nc-nd/4.0/

Organic molecules in the Sheepbed Mudstone,Gale Crater, MarsC. Freissinet1,2, D. P. Glavin1, P. R.Mahaffy1, K. E.Miller3, J. L. Eigenbrode1, R. E. Summons3, A. E. Brunner1,4,A. Buch5, C. Szopa6, P. D. Archer Jr.7, H. B. Franz1,8, S. K. Atreya9, W. B. Brinckerhoff1, M. Cabane6, P. Coll10,P. G. Conrad1, D. J. Des Marais11, J. P. Dworkin1, A. G. Fairén12,13, P. François9, J. P. Grotzinger14,S. Kashyap1,8, I. L. ten Kate15, L. A. Leshin16, C. A. Malespin1,17, M. G. Martin1,18, F. J. Martin-Torres19,20,A. C. McAdam1, D. W. Ming21, R. Navarro-González22, A. A. Pavlov1, B. D. Prats1, S. W. Squyres12,A. Steele23, J. C. Stern1, D. Y. Sumner24, B. Sutter7, M.-P. Zorzano25, and the MSL Science Team
1Solar System Exploration Division, NASA Goddard Space Flight Center, Greenbelt, Maryland, USA, 2NASA PostdoctoralProgram, Oak Ridge Associated Universities, Oak Ridge, Tennessee, USA, 3Department of Earth, Atmospheric and PlanetarySciences, Massachusetts Institute of Technology, Cambridge, Massachusetts, USA, 4Center for Research and Explorationin Space Science & Technology, University of Maryland, College Park, Maryland, USA, 5Laboratoire de Génie des Procédéset Matériaux, Ecole Centrale Paris, Châtenay-Malabry, France, 6Laboratoire Atmosphères, Milieux, Observations Spatiales,Pierre and Marie Curie University, Université de Versailles Saint-Quentin-en-Yvelines, and CNRS, Paris, France, 7Jacobs,NASA Johnson Space Center, Houston, Texas, USA, 8Center for Research and Exploration in Space Science & Technology,University of Maryland, Baltimore County, Baltimore, Maryland, USA, 9Department of Atmospheric, Oceanic and SpaceSciences, University of Michigan, Ann Arbor, Michigan, USA, 10Laboratoire Interuniversitaire des Systèmes Atmosphériques,Université Paris-Est Créteil, Paris VII–Denis Diderot University, and CNRS, Créteil, France, 11Exobiology Branch, NASA AmesResearch Center, Moffett Field, California, USA, 12Department of Astronomy, Cornell University, Ithaca, New York, USA,13Centro de Astrobiología, INTA-CSIC, Madrid, Spain, 14Division of Geological and Planetary Sciences, California Instituteof Technology, Pasadena, California, USA, 15Earth Sciences Department, Utrecht University, Utrecht, Netherlands,16Department of Earth and Environmental Sciences and School of Science, Rensselaer Polytechnic Institute, Troy, New York,USA, 17Goddard Earth Sciences and Technologies and Research, Universities Space Research Association, Columbia,Maryland, USA, 18Department of Chemistry, Catholic University of America, Washington, District of Columbia, USA,19Instituto Andaluz de Ciencias de la Tierra (CSIC-UGR), Granada, Spain, 20Division of Space Technology, Department ofComputer Science, Electrical and Space Engineering, Luleå University of Technology, Kiruna, Sweden, 21AstromaterialsResearch and Exploration Science Directorate, NASA Johnson Space Center, Houston, Texas, USA, 22Instituto de CienciasNucleares, Universidad Nacional Autónoma de México, Ciudad Universitaria, México City, Mexico, 23Geophysical Laboratory,Carnegie Institution of Washington, Washington, District of Columbia, USA, 24Department of Earth and Planetary Sciences,University of California, Davis, California, USA, 25Centro de Astrobiologia (INTA-CSIC), Madrid, Spain
Abstract The Sample Analysis at Mars (SAM) instrument on board the Mars Science Laboratory Curiosityrover is designed to conduct inorganic and organic chemical analyses of the atmosphere and the surfaceregolith and rocks to help evaluate the past and present habitability potential of Mars at Gale Crater. Centralto this task is the development of an inventory of any organic molecules present to elucidate processesassociated with their origin, diagenesis, concentration, and long-term preservation. This will guide the futuresearch for biosignatures. Here we report the definitive identification of chlorobenzene (150–300 parts perbillion by weight (ppbw)) and C2 to C4 dichloroalkanes (up to 70 ppbw) with the SAM gas chromatographmass spectrometer (GCMS) and detection of chlorobenzene in the direct evolved gas analysis (EGA) mode, inmultiple portions of the fines from the Cumberland drill hole in the Sheepbed mudstone at Yellowknife Bay.When combined with GCMS and EGA data from multiple scooped and drilled samples, blank runs, andsupporting laboratory analog studies, the elevated levels of chlorobenzene and the dichloroalkanes cannotbe solely explained by instrument background sources known to be present in SAM. We conclude thatthese chlorinated hydrocarbons are the reaction products of Martian chlorine and organic carbon derivedfrom Martian sources (e.g., igneous, hydrothermal, atmospheric, or biological) or exogenous sources suchas meteorites, comets, or interplanetary dust particles.
1. Introduction
The exploration of habitable environments on Mars, including an assessment of the preservation potentialfor organic compounds of either abiotic or biotic origin in Martian rock, regolith fines, and the atmosphere,
FREISSINET ET AL. ©2015. The Authors. 495
PUBLICATIONSJournal of Geophysical Research: Planets
RESEARCH ARTICLE10.1002/2014JE004737
Key Points:• First in situ evidence of nonterrestrialorganics in Martian surface sediments
• Chlorinated hydrocarbons identifiedin the Sheepbed mudstone by SAM
• Organics preserved in sampleexposed to ionizing radiation andoxidative condition
Correspondence to:C. Freissinet and P. R. Mahaffy,[email protected];[email protected]
Citation:Freissinet, C., et al. (2015), Organicmolecules in the Sheepbed Mudstone,Gale Crater, Mars, J. Geophys. Res.Planets, 120, 495–514, doi:10.1002/2014JE004737.
Received 3 OCT 2014Accepted 13 FEB 2015Accepted article online 4 MAR 2015Published online 21 MAR 2015
This is an open access article under theterms of the Creative CommonsAttribution-NonCommercial-NoDerivsLicense, which permits use and distri-bution in any medium, provided theoriginal work is properly cited, the use isnon-commercial and no modificationsor adaptations are made.

is one of the key goals of the Mars Science Laboratory (MSL) mission which landed the Curiosity Rover inGale Crater [Grotzinger et al., 2012]. The Sample Analysis at Mars (SAM) instrument suite [Mahaffy et al., 2012]on the Curiosity rover is conducting the most extensive search for volatiles and organic compounds in theMartian near-surface materials since the Viking missions in 1976. SAM has made 21 separate measurementsof four different solid samples including a scoop from the Rocknest aeolian deposit, multiple drill samplesfrom Yellowknife Bay and Pahrump Hills (Figure 1) and associated blank runs, using both pyrolysis evolved gasanalysis-quadrupole mass spectrometry (EGA) and gas chromatography mass spectrometry (GCMS) (Table 1).The first samples analyzed by both SAM and the Chemistry and Mineralogy (CheMin) X-ray diffractioninstrument [Bish et al., 2013] at the Rocknest (RN) site (Figure 1) were shown to be unconsolidated basalticwindblown sand, silt, and dust [Blake et al., 2013], with an elemental composition similar to soils measured bythe Mars rovers Spirit and Opportunity [Bish et al., 2013]. Upon heating, the RN materials released severalchlorine-bearing hydrocarbons at approximately the same temperature where a rise in O2 and HCl wereobserved, providing strong evidence for the presence of an oxychlorine phase such as hydrated Ca-perchlorate(Ca(ClO4)2 · nH2O) [Archer et al., 2014; Glavin et al., 2013; Leshin et al., 2013]. Although the chlorine in thechloromethanes identified at RN was derived from the Martian oxychlorine phase, the carbon source wasargued to be primarily of terrestrial origin [Glavin et al., 2013; Leshin et al., 2013]. In 1976, the Viking landers hadalso detected chloromethane and dichloromethane after pyrolysis GCMS analyses of the surface soil collectedat two separate locations [Biemann et al., 1976, 1977]. These chloromethanes were originally thought to bederived from terrestrial sources [Biemann et al., 1977], although this conclusion hasmore recently been revisited[Biemann and Bada, 2011; Navarro-Gonzalez et al., 2010].
After the RN analyses, Curiosity traveled to the lowermost stratigraphic unit in the Yellowknife Bay formation,informally named the Sheepbed member, and proceeded to drill two holes designated John Klein (JK) andCumberland (CB) (Figure 1). The Sheepbed samples contained ~20wt% smectite clay [Ming et al., 2014;Vaniman et al., 2014] and were interpreted to be mudstone formed in an ancient lacustrine environment[Grotzinger et al., 2014]. Terrestrial phyllosilicates like smectite serve to transport and protect organic compoundswhen rapidly deposited under reducing chemical conditions [Farmer and Des Marais, 1999; Summons et al.,2011]. This suggests that the Sheepbed mudstone contains mineralogy ideally suited for preserving organics.
Figure 1. Curiosity’s route as of Sol 653, from Bradbury landing site to Pahrump Hills. The base image is from the HighResolution Imaging Science Experiment camera on Mars Reconnaissance Orbiter. Traverse map produced by Fred Calef,Jet Propulsion Laboratory-Caltech. Rocknest (RN) scooped site, John Klein (JK), Cumberland (CB), and Confidence Hillsdrilled sites are represented along with their respective sol of sample collection.
Journal of Geophysical Research: Planets 10.1002/2014JE004737
FREISSINET ET AL. ©2015. The Authors. 496
Again, chloromethanes were detected during pyrolysis of the JK and CB samples, and mostly attributed toinstrument internal carbon sources [Ming et al., 2014]. However, larger amounts of chloromethane anddichloromethane from the JK and CB drilled mudstone samples compared to the RN, suggested that anadditional Martian organic carbon source in the Sheepbed mudstone was possible [Ming et al., 2014]. Curiositythen traveled to Pahrump Hills at the base of Mount Sharpwhere a drill sample was collected called ConfidenceHills (CH). This report describes EGA combined with GCMS analyses performed on the RN, JK, CB, and CHsamples, associated blank runs, and the supporting laboratory experiment. We report the discovery ofchlorobenzene and several dichloroalkanes at CB, derived primarily from reactions between oxychlorinephases and a reduced organic carbon source indigenous to the Sheepbed mudstone.
2. SAM Instrument Modes and Background—Methods
The multiple changes in SAM operational modes with variations in instrument parameters reflect a results-driven strategy in a Martian environment, with limited resources and consumables. Best compromises betweenMSL experiments, as well as between SAM instrument measurement modes, were discussed in detail beforeeach SAM analysis. Here we summarize the challenges associated with the complexity of in situ analyses andlimited resources in a harsh and remote environment and the balance that must be obtained to accomplishmultiple instrument and mission science objectives.
2.1. SAM Instrument Modes
SAM is a suite of three instruments that measure volatiles extracted from solid samples using three primaryanalytical modes for analysis of organic compounds: (1) Evolved gas analysis-quadrupole mass spectrometry(EGA), where solid samples are heated inside a pyrolysis oven up to ~1000°C and the gases released areionized by electron impact and continuously monitored by quadrupole mass spectrometry (QMS), withportions of evolved gas isolated for gas chromatography mass spectrometry (GCMS) and/or tunable laser
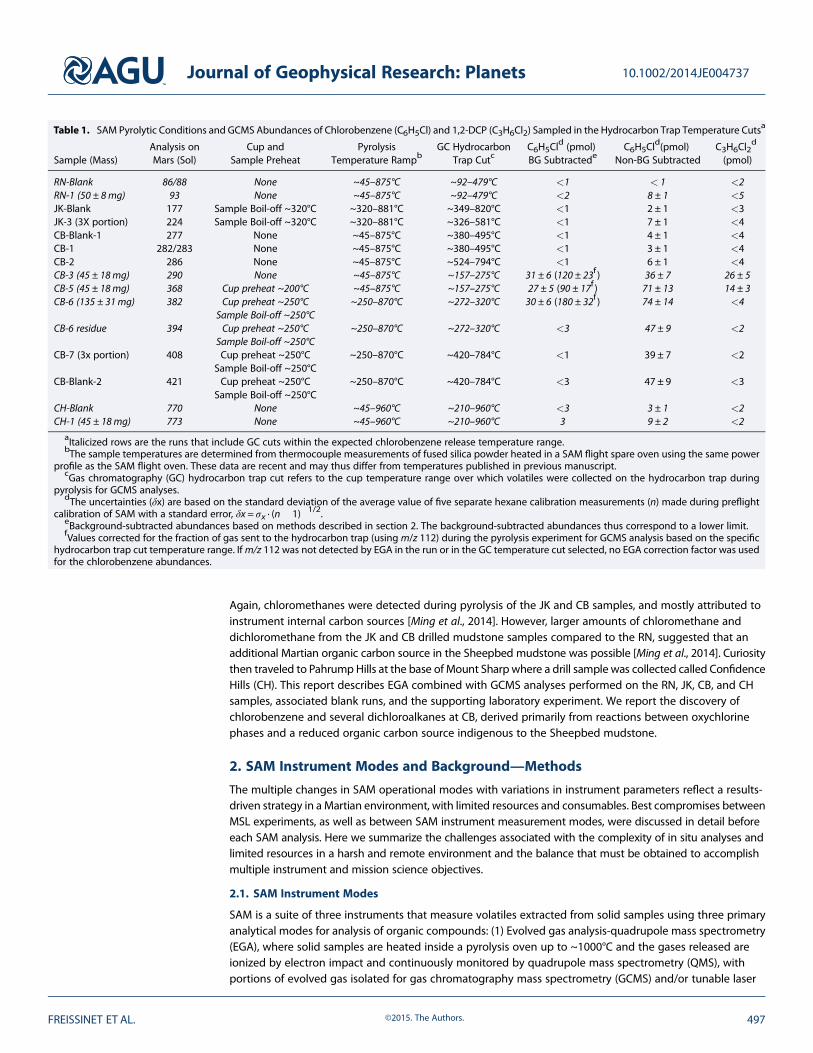
Table 1. SAM Pyrolytic Conditions and GCMS Abundances of Chlorobenzene (C6H5Cl) and 1,2-DCP (C3H6Cl2) Sampled in the Hydrocarbon Trap Temperature Cutsa
Sample (Mass)Analysis onMars (Sol)
Cup andSample Preheat
PyrolysisTemperature Rampb
GC HydrocarbonTrap Cutc
C6H5Cld (pmol)
BG SubtractedeC6H5Cl
d(pmol)Non-BG Subtracted
C3H6Cl2d
(pmol)
RN-Blank 86/88 None ~45–875°C ~92–479°C <1 < 1 <2RN-1 (50 ± 8mg) 93 None ~45–875°C ~92–479°C <2 8 ± 1 <5JK-Blank 177 Sample Boil-off ~320°C ~320–881°C ~349–820°C <1 2 ± 1 <3JK-3 (3X portion) 224 Sample Boil-off ~320°C ~320–881°C ~326–581°C <1 7 ± 1 <4CB-Blank-1 277 None ~45–875°C ~380–495°C <1 4 ± 1 <4CB-1 282/283 None ~45–875°C ~380–495°C <1 3 ± 1 <4CB-2 286 None ~45–875°C ~524–794°C <1 6 ± 1 <4CB-3 (45 ± 18mg) 290 None ~45–875°C ~157–275°C 31 ± 6 (120 ± 23f ) 36 ± 7 26 ± 5CB-5 (45 ± 18mg) 368 Cup preheat ~200°C ~45–875°C ~157–275°C 27 ± 5 (90 ± 17f ) 71 ± 13 14 ± 3CB-6 (135 ± 31mg) 382 Cup preheat ~250°C
Sample Boil-off ~250°C~250–870°C ~272–320°C 30 ± 6 (180 ± 32f ) 74 ± 14 <4
CB-6 residue 394 Cup preheat ~250°CSample Boil-off ~250°C
~250–870°C ~272–320°C <3 47 ± 9 <2
CB-7 (3x portion) 408 Cup preheat ~250°CSample Boil-off ~250°C
~250–870°C ~420–784°C <1 39 ± 7 <2
CB-Blank-2 421 Cup preheat ~250°CSample Boil-off ~250°C
~250–870°C ~420–784°C <3 47 ± 9 <3
CH-Blank 770 None ~45–960°C ~210–960°C <3 3 ± 1 <2CH-1 (45 ± 18mg) 773 None ~45–960°C ~210–960°C 3 9 ± 2 <2
aItalicized rows are the runs that include GC cuts within the expected chlorobenzene release temperature range.bThe sample temperatures are determined from thermocouple measurements of fused silica powder heated in a SAM flight spare oven using the same power
profile as the SAM flight oven. These data are recent and may thus differ from temperatures published in previous manuscript.cGas chromatography (GC) hydrocarbon trap cut refers to the cup temperature range over which volatiles were collected on the hydrocarbon trap during
pyrolysis for GCMS analyses.dThe uncertainties (δx) are based on the standard deviation of the average value of five separate hexane calibration measurements (n) made during preflight
calibration of SAM with a standard error, δx = σx · (n� 1)�1/2.eBackground-subtracted abundances based on methods described in section 2. The background-subtracted abundances thus correspond to a lower limit.fValues corrected for the fraction of gas sent to the hydrocarbon trap (using m/z 112) during the pyrolysis experiment for GCMS analysis based on the specific
hydrocarbon trap cut temperature range. Ifm/z 112 was not detected by EGA in the run or in the GC temperature cut selected, no EGA correction factor was usedfor the chlorobenzene abundances.
Journal of Geophysical Research: Planets 10.1002/2014JE004737
FREISSINET ET AL. ©2015. The Authors. 497

spectrometry (TLS) analyses (Figures 2and 3). (2) Combustion, where the solidsample is exposed to pure molecularoxygen gas while being heated in theoven and the products analyzed byQMS, GCMS, and/or TLS (Figure 2).(3) Wet chemistry experiments, whichconsist of a low-temperature extractionand derivatization with N-methyl-N-(tert-butyldimethylsilyl)-trifluoroacetamide(MTBSTFA) or thermochemolysis withtetramethylammonium hydroxide oforganic compounds in a solid samplefollowed by direct EGA and GCMSanalysis of the reaction products(Figure 2). In addition to direct detectionof organic molecules through the EGAand GCMS modes, the combustionexperiment is designed to provide
indirect evidence for the presence of organics in a sample through the quantification and carbon isotopicanalysis of evolved CO2 by TLS.
The separate solid samples collected at the Rocknest aeolian deposit, the Sheepbed mudstone and atConfidence Hills were sieved to< 150 μm particle size and individual aliquots of sample powder delivered
Figure 2. The three different modes of analysis of a solid sample fororganic compounds by the SAM instrument.
Figure 3. The SAM gas flow diagram showing the helium gas flow paths in both EGA (purple dashed line) and GCMSmodes(orange line). Major components shown include the quadrupole mass spectrometer (QMS), the gas chromatograph systemincluding six columns (GCx), three injection traps (ITx), and five thermal conductivity detectors (TCDx), the tunable laserspectrometer (TLS), the gas manifolds (MNx), the microvalves (Vx) and high-conductance valves (HCx), the hydrocarbonand noble gas trap, the sample manipulation system (SMS) with two solid sample inlet tubes (SSIT-1 and SSIT-2) and twopyrolysis ovens (Oven-1 and Oven-2), the helium gas reservoirs (He-1 and He-2), pressure sensors (PMx), and miniaturewide-range pumps (WRP-1 andWRP-2). The manifold and pipe heaters and associated temperature sensors are not shown.
Journal of Geophysical Research: Planets 10.1002/2014JE004737
FREISSINET ET AL. ©2015. The Authors. 498

to separate quartz-glass cups inside the SAM instrument from a portion tube with a volume of 76mm3.The RN sample analyzed by SAM was scooped on sol 93 and the samples collected at JK, CB, and CH weredrilled on sol 182, 279, and 759 respectively. Based on tests and models, a mass of 50 ± 8mg (2σ standarddeviation) per portion delivered to SAM was estimated for RN, and 45 ± 18mg for JK, CB, and CH singleportions. The analysis of gases released from these solid samples was conducted by heating the sampleportions to ~870°C in a pyrolysis oven at a rate of 35°Cmin�1, under a helium flow rate of ~0.8 cm3min�1
STP. Evolved gases were monitored directly and continuously with the QMS (EGA mode). Gases releasedfrom the sample over a specific temperature range (referred to as the GC temperature cut) were sentto a hydrocarbon trap and subsequently sent to one of the six gas chromatographic columns beforedetection by the thermal conductivity detector (TCD) and the QMS (GCMS mode) (Figure 3). During the GCtemperature cut, molecules in the He carrier gas flow are first concentrated onto the hydrocarbon trap,cooled to ~5°C with thermoelectric coolers. This trap consists of three adsorbents in series, each bearingdifferent adsorption properties: nonporous silica beads, Tenax TA (porous 2,6-diphenyl-p-phenyleneoxide polymer resin adsorbent) and Carbosieve G (a closed-pore structure carbon molecular sieve). Thedesorption of volatiles from the hydrocarbon trap for GC analysis (GC-5: MXT-CLP, Siltek-treated stainlesssteel metal-chlorinated pesticides column—30m length, 0.25mm internal diameter, and 0.25 μm filmthickness) was conducted as follows. From RN-Blank to RN-3, the hydrocarbon trap was flash heated to330°C under He flow and the valves were opened for ~6.3min. For the RN-4 to CB-Blank-2 runs, thehydrocarbon trap was heated to 310°C ± 5°C and the hydrocarbon trap valves were open for ~11.2min.For the CH-Blank and CH-1 sample runs the hydrocarbon trap was heated to 310°C ± 5°C and the valveswere open for 8.2min. Heating the hydrocarbon trap under He flow in the opposite direction used for thetrapping released the mixture of adsorbed volatiles to a smaller Tenax GR injection trap (IT) held at 20°Cfor collection at the front of the GC column. The IT was then flash heated up to ~300°C for approximately 5 sto send the trapped compounds to the GC column, and this flash heating was used as the referencetime (t = 0 s) from which volatile GC elution times were determined. For all the analyses presented here,only the MXT-CLP chromatographic column was used.
2.2. Background Subtraction and EGA correction
To account for the observed increase in the chlorobenzene GCMS background after CB-6 and a possiblecarryover of chlorobenzene or chlorobenzene precursors in the SAM gas processing system, the chlorobenzenedata presented are background subtracted. In addition, to account for differences in GC temperature cutsused for the different GC analyses, the total GCMS abundances were EGA corrected for the fraction of eachcompound sent to the hydrocarbon trap during pyrolysis [Glavin et al., 2004]. For the RN-Blank to CB-3 runs,the chlorobenzene background was defined as the average value measured in the GCMS runs from RN-1 toCB-2. The RN-Blank run was not included in the background average since no chlorobenzene was detected inthis run. For CB-5 and CB-6, the background subtracted was defined as the average of the GCMS abundancesof chlorobenzene in the CB-6-residue, CB-7 and CB-Blank-2 runs. For the CH-Blank and CH-1 runs, thebackground subtracted was the average of the GCMS abundances of chlorobenzene in CH-Blank and CH-1.Therefore, the background-subtracted chlorobenzene GCMS abundances calculated for CB-5 and CB-6represent a lower limit for the amount of indigenous chlorobenzene present in these samples. The EGA-corrected(using m/z 112) GCMS abundances of chlorobenzene were calculated from the background-subtractedabundances. Since the GC temperature cuts were different in the CB-5 to CB-6 runs (Table 1), the EGA-correctedabundances are required to obtain more accurate chlorobenzene abundances released from the samples.
2.3. SAM Instrument Background2.3.1. MTBSTFAMTBSTFA was sealed inside each of the seven derivatization cups present in SAM. Although none of thesestainless steel foil-capped cups have yet been punctured on Mars for the actual wet chemistry experiment, thepresence ofMTBSTFA products in the SAMbackground indicates that at least one of the cups releasedMTBSTFAinto the Sample Manipulation System (SMS), possibly through a stressed cup weld or pinch-off tube [Glavinet al., 2013]. MTBSTFA vapors in the SMS adsorb on the quartz cups and solid samples delivered to the cups priorto pyrolysis. MTBSTFA vapor released inside the SMS rapidly reacts with residual water present in the SMS orsample to form the MTBSTFA hydrolysis products tert-butyldimethylsilanol, 1,3-bis(1,1-dimethylethyl)-1,1,3,3-tetramethyldisiloxane, 2,2,2,-trifluoro-N-methylacetamide (TFMA) [Glavin et al., 2013]. Apart from its hydrolysis
Journal of Geophysical Research: Planets 10.1002/2014JE004737
FREISSINET ET AL. ©2015. The Authors. 499

products, MTBSTFA decompositionproducts include methylpropene andmethane. MTBSTFA also reacts withall side groups of molecules bearinga labile hydrogen. In the presenceof oxygen, MTBSTFA products canalso be oxidized to CO2 at elevatedtemperatures and may contribute tothe CO and NO compounds detectedin some of the SAM analyses. Thereaction of MTBSTFA with the GCcolumn and/or glass bead componentof the hydrocarbon trap may enhancethe degradation of these components.
The abundance of MTBSTFA carbonhas been quantified from the majorMTBSTFA by-products detected byEGA and its initial contribution to theSAM background was estimated tobe between ~47 and ~116 nmol ofMTBSTFA in the blank runs carried outbefore RN, JK, and CB (estimationsupdated from Ming et al. [2014]with additional MTBSTFA by-productcontributions from methylpropeneand methane). MTBSTFA reductionstrategies were successful in theCB-5, CB-6, CB-6-residue, CB-7, andCB-Blank-2 analyses and the initialcontribution from MTBSTFA wasreduced down to 35 nmol in CB-6
(Figure 4). In the CB-6-residue run, the combustion of MTBSTFA and MTBSTFA by-products was greatlyreduced due to the lack of O2 released from oxychlorine decomposition, which explains the higherabundance of MTBSTFA in the CB-6 residue run (Figure 4).
Two different experiments were carried out to try to significantly reduce the residual MTBSTFA contributionto the observed volatiles measured during pyrolysis of a solid sample and the empty cup blank runs. The first,used in the JK-Blank and JK-1 through JK-3 samples, was a boil-off of the cup/sample for ~25min to atemperature of ~320°C prior to the EGA and GCMS analysis to release and vent low-temperature volatiles(including MTBSTFA by-products) to the Martian atmosphere. However, because background volatilescan come into direct contact with the sample, chemical reactions may occur during the boil-off betweenMartian components in the sample and the MTBSTFA by-products adsorbed to the cup and solid sample.In addition, some information on the low-temperature volatiles released from the sample at temperaturesbelow ~320°C is also lost during the boil-off procedure. This is why a second MTBSTFA reduction experimentwas developed for the CB-5, CB-6, CB-6-residue, CB-7, and CB-Blank-2 experiments, consisting of (a) pumpingout the SMS for ~3 h with venting to the atmosphere via the wide-range pump prior to receiving samplewhile the SAM gas manifolds and transfer lines were heated to 135°C, (b) flushing the pyrolysis oven and SMSwith helium to minimize adsorption of MTBSTFA products inside the oven, and (c) preheating the selectedcup for ~20min to ~200°C (CB-5) or ~250°C (CB-6, CB-6-residue, CB-7, and CB-Blank-2) before moving thecup under the inlet tube to receive the solid sample portion. All of these approaches helped to limit theadsorption of volatile MTBSTFA vapor products present in the SMS onto the cup during sample delivery.The total time the cup was exposed to the residual MTBSTFA vapor sources inside the SMS during samplehandoff was ~13min for CB-5, roughly 5min shorter than the sample handoff cup exposure time for theprevious single-portion sample analyses of RN, JK, and CB. CB-6, CB-6-residue, CB-7, and the CB-Blank-2
Figure 4. (a)MTBSTFA, (b) chloromethanes, and (c) 1,2-DCPand chlorobenzenethroughout runs that include GC cuts within the expected chlorobenzenerelease temperature. MTBSTFA abundance (Figure 4a) is inferred from its majorby-products and is calculated from EGA. MTBSTFA reduction strategies areemployed on CB-5, CB-6 triple portion, and CB-6-residue. The increase in theMTBSTFA abundances in CB-6-residue is explained by the lack of combustionin the absence of O2 released from the sample. Chloromethanes (Figure 4b)reflect the sum of the abundances of chloromethanes (chloromethane,dichloromethane, trichloromethane, and carbon tetrachloride) observed inGCMS after EGA temperature cut correction. 1,2-DCP abundances (Figure 4c,orange) observed in GCMS. Chlorobenzene abundances (Figure 4c, pink)observed in GCMS are derived from an EGA temperature cut correction usingm/z 112, from the GCMS background-subtracted data.
Journal of Geophysical Research: Planets 10.1002/2014JE004737
FREISSINET ET AL. ©2015. The Authors. 500

sample exposure times to the SMS background were 3 times this duration (~40min), because of the longertime required for the triple portion sample dropoff which was performed by three separate single-portiondropoffs in series. In contrast to CB-5, for the CB-6 triple portion sample run, the CB-6-residue reheat, the CB-7triple portion and CB-Blank-2, a boil-off of the sample for ~27min to ~250°C after the last sample portiondropoff, or exposure-simulation dropoff (for the CB-Blank-2), was also added. No MTBSTFA reduction wasemployed for the CH-Blank and CH-1 analyses.2.3.2. Hydrocarbon TrapsThe hydrocarbon trap(s) components are also part of the SAM internal background. Their Tenax TA and GRadsorbents, made of 2,6-diphenyl-p-phenylene oxide (Figure 5), release aromatic compounds, and possiblyaliphatic compounds, from thermal and chemical degradation. When heated to 300°C, the Tenax polymer candecompose into various smaller products that may be subsequently detected with the GCMS (Figure 5). Inaddition to thermal degradation of the hydrocarbon traps components, reactive species from SAM sources orreleased from the Martian samples during pyrolysis can also enhance trap degradation. Due to repeatedexposure of the Tenax polymers to O2 and HCl released from the decomposition of oxychlorine species fromthe samples analyzed at RN, JK, CB, and CH, the effects of these molecules on the trap components andresulting by-products have been thoroughly investigated. Laboratory experiments and data from SAM showthat there are no strong correlations between the amount of MTBSTFA by-products, HCl, O2, SO2, or NO sentto the trap and the resulting degradation products detected by SAM GCMS (section 4.1.3).2.3.3. Other Sources of Instrument BackgroundNumerous preflight experiments were performed on SAM to assess the performance of the instrument.These include inorganic solid sample EGA calibration experiments, including calcite and melanterite. Thepresence of small amounts of SO2, CS2, and OCS in the first SAM GCMS blank run on Mars was attributedto cross contamination from the calibration experiments, since these molecules are known to stick to thehydrocarbon and GC injection traps. H2O, NO, N2/CO, and CO2 are also part of SAM background and theirabundances have been well characterized. EGA quantities of these gases are generally far above theseresidual background levels [Archer et al., 2014; Glavin et al., 2013; Leshin et al., 2013; Ming et al., 2014]. Smalllevels of acetone were identified in the first SAM GCMS blank and were also detected in the SAM test bedexperiments. The decrease in acetone abundance measured in SAM over time, as well as its presence in theSAM test bed, suggests that this compound might be a residual from the SAM hardware solvent cleaningprocedure. Acetone was also previously detected in the Viking GCMS instrument background and wasattributed to solvents used to clean the instrument hardware [Biemann et al., 1977]. Contributions of volatilesto the SAM background from the Curiosity rover’s sample handling chain was also considered, but terrestrialcontamination from this source is unlikely because it was scrubbed multiple times with scooped materialfrom Rocknest prior to the first drilled samples at JK and CB [Ming et al., 2014]. In addition, swabbed surfacesof Curiosity’s sample acquisition and processing system were found to be organically clean prior to launch
Figure 5. Tenax TA by-products. 2,6-diphenyl-p-phenylene oxide (Tenax TA) and the observed degradation products fromthe hydrocarbon traps present in SAM.
Journal of Geophysical Research: Planets 10.1002/2014JE004737
FREISSINET ET AL. ©2015. The Authors. 501
[Anderson et al., 2012]. In summary,memoryeffects from SAM preflight experiments,SAMhardware cleaning and fromCuriosity’ssample handling chain have all beenconsidered as possible contributors tothe SAM background, but these sourcesdo not create interferences with thedata analysis for the chlorobenzene anddichloroalkanes reported.
2.4. Supporting Laboratory Experiments
The pyrolysis-GCMS (pyr-GCMS)experiments conducted at NASA GoddardSpace Flight Center were designed tounderstand the chemical interactionsof MTBSTFA with the oxychlorinecompounds believed to be present inthe Martian samples. The experimentalsetup was used to analyze terrestrialanalog samples under conditions thatapproximate the SAM analysis conditionson Mars [Glavin et al., 2013]. Magnesium-perchlorate and calcium-perchloratewere studied and produced similarchlorohydrocarbon products whenheated in the presence of MTBSTFA[Glavin et al., 2013]. The reactions wereinvestigated using samples that werecomposed of fused silica dopedwith 1 wt%Ca(ClO4)2 · nH2O (28mg total) with orwithout addition of 0.4 μL MTBSTFA(~1.7μmol) + 0.1μL dimethyl formamide(DMF ~1.3μmol). The estimated maximumMTBSTFA carbon background level inthe SAM experiments of up to 2μmol C(updated from Ming et al. [2014]) is muchlower than the total amount of MTBSTFAcarbon typically used in each laboratorypyrolysis GCMS experiment (~19.2μmolC).The capillary column (Restek MTX-Q-Bond,30m length×0.25mm internal diameter
× 8μm film thickness) and the instrument parameters used for the study allows a complete resolution of lowmolecular weight volatiles but>C8 molecules could not be separated and detected under the experimentalconditions used [Glavin et al., 2013].
Analog experiments at the Massachusetts Institute of Technology (MIT) were also carried out to study theinteractions between oxychlorine minerals and simple organic compounds that may be present within SAMor indigenous to the Martian solid samples. These experiments were conducted using an olivine sandsubstrate spiked with Ca(ClO4)2 · nH2O or Mg(ClO4)2 · nH2O corresponding to 1wt% calcium or magnesiumperchlorate and various concentrations of other pure compound analytes. The olivine sand was preparedby first rinsing it with 6N HCl, followed by repeated rinses with H2O to remove plasticides. The sand wasthen powdered in a stainless steel mill, sieved to< 125μm and heated at 550°C in air for 5 h. Approximately5mg of the sand was added to a Chemical Data Systems, Inc. (CDS) quartz sample tube packed with aquartz filler rod and a plug of quartz wool. Aqueous solution of Ca(ClO4)2 · nH2O or Mg(ClO4)2 · nH2O were
200
150
100
50
0700600500400300200
700600500400300200
200
150
100
50
0700600500400300200
200
150
100
50
0700600500400300200
QM
S R
espo
nse
(103 c
ount
s/s)
Retention Time (s)
Rocknest
Cumberland blank
Cumberland1
2
3 4 5
1
2
3
4
6 7
8
8
8
200
150
100
50
08
1
2
a)
100806040
Rel
ativ
e S
igna
l
100806040 806040
m/z
b)
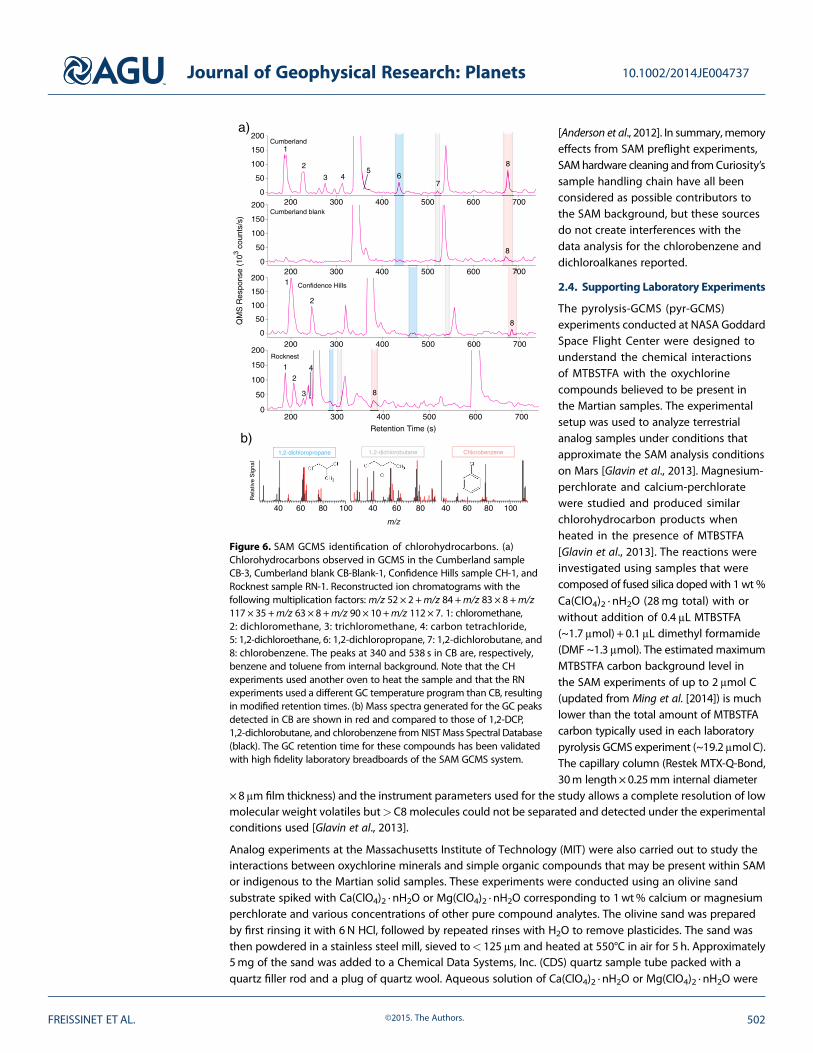
Figure 6. SAM GCMS identification of chlorohydrocarbons. (a)Chlorohydrocarbons observed in GCMS in the Cumberland sampleCB-3, Cumberland blank CB-Blank-1, Confidence Hills sample CH-1, andRocknest sample RN-1. Reconstructed ion chromatograms with thefollowing multiplication factors: m/z 52 × 2 +m/z 84 +m/z 83 × 8 +m/z117 × 35 +m/z 63 × 8 +m/z 90× 10 +m/z 112 × 7. 1: chloromethane,2: dichloromethane, 3: trichloromethane, 4: carbon tetrachloride,5: 1,2-dichloroethane, 6: 1,2-dichloropropane, 7: 1,2-dichlorobutane, and8: chlorobenzene. The peaks at 340 and 538 s in CB are, respectively,benzene and toluene from internal background. Note that the CHexperiments used another oven to heat the sample and that the RNexperiments used a different GC temperature program than CB, resultingin modified retention times. (b) Mass spectra generated for the GC peaksdetected in CB are shown in red and compared to those of 1,2-DCP,1,2-dichlorobutane, and chlorobenzene fromNISTMass Spectral Database(black). The GC retention time for these compounds has been validatedwith high fidelity laboratory breadboards of the SAM GCMS system.
Journal of Geophysical Research: Planets 10.1002/2014JE004737
FREISSINET ET AL. ©2015. The Authors. 502

individually added to each of the olivinecontaining sample tubes and allowed todry in a fume hood overnight. Individualanalytes (e.g., benzene, toluene, phthalicacid, and propanol) could then be addedto the sample, typically in a solution ofeither water or methanol. Due to concernabout loss of the analytes throughevaporation, the compoundswere addedto the sand with a syringe approximately5 s before pyrolysis GCMS analysis[Glavin et al., 2013; Miller et al., 2013].
Similar analog experiments wereconducted with kerogen-like organicmatter isolated from the Murchisonmeteorite [Deamer and Pashley, 1989].Approximately 1mg of the Murchisonkerogen was subsequently added toCDS quartz sample tubes and spikedwith 50–500 μg of Ca(ClO4)2 · nH2O.These samples were allowed to dry in afume hood overnight prior to pyrolysisGCMS analysis.
In all experiments at MIT, the CDSanalytical pyroprobe was programed toheat the sample from 50 to 750°C at arate of 35°Cmin�1. The resulting volatileswere concentrated on a stainless steel¼ inch hydrocarbon trap (Carbosieve G,Tenax TA, and silica beads) that was heldat �10°C throughout the pyrolysis. Thetrapped volatiles were then desorbedat 300°C for 5min. The GC, which wasequipped with an RTX-CLPesticidescolumn (30m×0.25mm×0.25μm),was programed to hold at 35°C for5min before heating to 300°C at a rateof 10°Cmin�1 with a final hold timeof 8.5min. The MS was operated inelectron impact mode at 70 eV andscanned from m/z 10 to m/z 535.
3. Results: SAM and Support Laboratory Experiments3.1. Chlorobenzene
Chlorobenzene (C6H5Cl) was identified by both retention time and mass spectra by GCMS in the CB-3, CB-5,and CB-6 runs at levels of ~90 to ~180 pmol above background (~150 to 300 ppbw) after trapping thevolatiles released from tens of milligrams (Table 1) of powdered CB materials at low temperatures (Figure 6and Table 1). These chlorobenzene abundances were background-subtracted and EGA-corrected data toaccount, respectively, for the observed increase in the chlorobenzene GCMS background after CB-6 and forthe difference in GC temperature cuts used for the GCMS analyses (section 2.2) and thus represent a lowerlimit of the initial chlorobenzene abundance present in the CB samples.
To decouple the measured chlorobenzene from the two primary terrestrial carbon sources in SAM (MTBSTFAand Tenax), further analyses and laboratory experiments were conducted.
Figure 7. Laboratory study showing the effect of MTBSTFA on theformation of chlorobenzene. GCMS analysis of hydrocarbon trap productscollected at 5°C under He flow (25mLmin�1) during pyrolysis from 45 to850°C at 35°Cmin�1 of (I) 1 wt% Ca-perchlorate in fused silica with 0.4μLMTBSTFA and 0.1μL DMF compared to (II) 1 wt% Ca-perchlorate in fusedsilica with no MTBSTFA/DMF. Peaks were identified by comparison of themass spectra to NIST. Molecules identified in the laboratory experimentsand not in SAM are lettered. Numbers and letters are as follows: 3, air;4, carbon dioxide; A, nitrous oxide; B, ethanedinitrile; 12, propene; 16,chloromethane; 15, hydrogen cyanide; C, acetaldehyde; 13, C4-alkene;28, acetonitrile; D, methyl isocyanate; 27, acetone; 24, dichloromethane;E, nitromethane; F, C4-alkene aldehyde; G, 2-chloro-2-methylpropane;29, trichloromethane; 31, 1- and 3-chloro-2-methyl-1-propene; 32,carbon tetrachloride; 33, benzene; H, C4-alkene nitrile; 41, N-methyl-2,2,2-trifluoroacetamide; I, N-methylformamide; J, N,N-dimethylformamide;39, toluene; K, tetrachloroethene; 44, chlorobenzene; and 43, tert-butyldimethylsilanol. The Restek MXT-Q-Bond Porous Layer Open Tubular(PLOT) GC column (30m length, 0.25mm internal diameter, and 8 μm filmthickness) used was held at 50°C for 4min followed by a 10°Cmin�1 rampto 250°C at a constant He flow of 1.5mLmin�1. Transfer line was set to135°C. The quadrupole mass spectrometer operated in electron impactmode at 70 eV and scanned m/z 25–350. Inset: Selected Ion Monitoring(SIM) mode (m/z 112) on the elution zone of chlorobenzene (22–26min).
Journal of Geophysical Research: Planets 10.1002/2014JE004737
FREISSINET ET AL. ©2015. The Authors. 503

The decoupling of chlorobenzene from MTBSTFA is provided by laboratory experiments (Figure 7), whichdemonstrates that pyrolysis of MTBSTFA with 1 wt % Ca-perchlorate in fused silica does not generateadditional chlorobenzene above the levels produced after pyrolysis of a 1 wt % Ca-perchlorate in fused silicaonly, although trace amounts of chlorobenzene is detectable in both runs.
Evidence for the decoupling of chlorobenzene from Tenax degradation is twofold: first, the observation ofa stable level of the aromatic compounds released from the traps throughout the solid sample runs (benzene19.2 ± 4.8 nmol and toluene 0.6 ± 0.3 nmol, JK runs not included), which does not support an additionalchemical degradation of the Tenax in the runs where the highest levels of chlorobenzene were detected.Second, the RN, JK, CB and CH runs, blank and sample experiments, demonstrate that there are no strongcorrelations between the amount of HCl, O2, NO, or SO2 sent to the hydrocarbon trap and the abundancesof chlorobenzene measured by GCMS (Figure 8). The high abundances of HCl, O2, and NO sent to thehydrocarbon trap in the CB-3, CB-5, and CB-6 runs where chlorobenzene is detected above background levelis intimately linked to the low temperature range sent to the trap (Figure 9). The presence of chlorine (Cl2),which is a more reactive compound than HCl and a major decomposition product of Mg-perchlorate [Glavinet al., 2013], has also been investigated. However, EGA mode does not allow for the definitive identificationof this compound due to possible mass interferences at m/z 70 andm/z 72. Moreover, Cl2 was not identified
0.001
0.01
0.1
1
10
SO
2 ab
unda
nce
sent
to tr
ap (
µmol
)
80604020GCMS Chlorobenzene (pmol)
0.001
0.01
0.1
1
10
O2
abun
danc
e se
nt to
trap
(µm
ol)
806040200GCMS Chlorobenzene (pmol)
0.1
1
10
100
NO
abu
ndan
ce s
ent t
o tr
ap (
nmol
)
80604020GCMS Chlorobenzene (pmol)
0.01
0.1
1
HC
l abu
ndan
ce s
ent t
o tr
ap (
µmol
)
80604020GCMS Chlorobenzene (pmol)
CB-5
CB-6
CB-3
CB-7
CB-6-residueCB-Blank-2
RN-2RN-1
JK-3
RN-3
JK-1, JK-2
RN-4JK-4
CB-1
CB-2
RN-BlankJK-BlankCB-BlankCH-Blank
CB-6
CB-5
CB-7
CB-Blank-2
CB-6-residueCB-3
RN-Blank
RN-4
RN-2
CB-Blank, CB-1
RN-1
JK-Blank
JK-2
RN-3
JK-1 CB-2JK-4
JK-3
CB-5
CB-7
CB-3
CB-6-residue
CB-Blank-2
RN-Blank, JK-BlankCH-Blank
CB-Blank
CB-1
JK-4, CB-2
RN-3
RN-4
JK-2
JK-1
JK-3
RN-1RN-2
CB-6
CB-5
CB-6-residue
CB-Blank-2
CB-7
CB-3
RN-Blank, JK-Blank, CB-Blank
CB-1
RN-4
RN-2
JK-2RN-1
CB-2JK-4
JK-1
JK-3
RN-3
b) a)
c) d)
CB-6
CH-Blank
CH-Blank CH-1
CH-1
CH-1
CH-1
Figure 8. No significant correlation between the abundance of HCl, O2, NO, or SO2 sent to the HC trap (EGA-corrected abundances) and the abundance of chlorobenzene(nonbackground-subtracted abundances)measured by GCMS. Chlorobenzene abundance (pmol) detected in GCMS versus (a) abundance of HCl sent to the hydrocarbontrap (μmol), (b) abundance of O2 sent to hydrocarbon trap (μmol), (c) abundance of NO sent to the hydrocarbon trap (nmol), and (d) abundance of SO2 sent to thetrap (μmol). For the calculated abundances of chlorobenzene (C6H5Cl) in the blanks and solid sample runs, measured by GCMS, the uncertainties (δx) are based onthe standard deviation of the average value of five separate hexane calibration measurements (n) made during preflight calibration of SAM with a standard error,δx = σx · (n� 1)�1/2. O2, HCl, NO, and SO2 abundances sent to the hydrocarbon trap are determined, respectively, fromm/z 32,m/z 36,m/z 30, andm/z 48measured byEGA and corrected for the temperature cut. Errors reported for the molar abundances of O2, HCl, NO, and SO2 (2σ standard deviation of the mean) also include theuncertainty in differences in ionization efficiency between masses.
Journal of Geophysical Research: Planets 10.1002/2014JE004737
FREISSINET ET AL. ©2015. The Authors. 504

by GCMS in any of the SAM or laboratoryexperiments. It is believed that any Cl2released from Mg-perchlorate or otheroxychlorine species will readily reactwith the water background present inSAM and water released from thesamples during pyrolysis. The averageH2O abundance released from the CBsamples was 47 μmol as determined bythe SAM EGA measurements. The totalabundance of chlorine measured by theAlpha Proton X-ray Spectrometer onCuriosity was 1.12 wt% in the CB dumppile. Assuming all of this chlorine wasderived from Mg-perchlorate, it wouldrepresent a maximum of 7.2 μmol of Cl2released from a 45mg sample during SAMpyrolysis. Therefore, the maximum molarratio of Cl2 to water released during CBsample pyrolysis would be ~1:6.5. Giventhe known reactivity of Cl2 with water
and the much higher abundance of water compared to Cl2 in the CB runs, it is reasonable to assume that anyCl2 released from Mg-perchlorate in the sample during pyrolysis will reach the hydrocarbon trap as HCland not Cl2. Laboratory experiments with 5, 50, and 500μg of Ca- and Mg-perchlorate, show that Cl2 wasnot observed in any of the experiments conducted under SAM-like conditions. The Cl2 formed during thedecomposition of Mg-perchlorate under laboratory conditions likely reacts with an excess of water in thelaboratory system to form HCl before reaching the hydrocarbon trap. Therefore, the only difference observedin Ca-perchlorate versus Mg-perchlorate experiments is the abundance of HCl and O2 released from thesamples which is higher for Mg-perchlorate. However, because the SAM data shows that there is no significantcorrelation between the amount of HCl and O2 sent to the hydrocarbon trap and the chlorobenzeneabundances measured by GCMS, the results for the laboratory experiments using Ca-perchlorate andMg-perchlorate are both valid when interpreting the SAM chlorobenzene data.
The possibility of a formation ofchlorobenzene from aromatic speciesreleased from the hydrocarbon trap,benzene and toluene, was also investigatedthrough multiple laboratory experimentswith Ca-perchlorate. Benzene (0.65 nmol)and toluene (47 nmol), which are themost abundant compounds releasedfrom the thermal degradation of Tenax,were individually pyrolyzed in the presenceof 50 μg of Ca-perchlorate. Even afteraddition of benzene and toluene tothe Ca-perchlorate, the chlorobenzeneabundance did not increase abovebackground level in these experiments[Miller et al., 2013].
However, the pyrolysis of 7.5–750 pmol offunctionalized aromatics such as phthalicacid with 50 μg of Ca-perchlorate and50 μg of Mg-perchlorate resulted in amarked increase in the formation of
650550450350250150
Sample Temperature (°C)50
102
103
104
105
106
QM
S r
espo
nse
(cou
nts/
s)
m/z 16m/z 30 m/z 36 m/z 64 m/z 89 m/z 105 m/z 112 m/z 119 m/z 135
Figure 9. Temperature releases of O2, HCl, NO, and SO2 and theirrelation with chlorobenzene and other aromatic-like m/z (showed insmoothed lines, shades of grey) in CB-5. The increase in chlorobenzeneobserved when a higher abundance of O2, HCl, and NO is sent to theHC trap (Figure 8) is explained by the release of all these species in thesame temperature range.
1
10
100
Phth
alic
Aci
d A
bund
ance
(pm
ol)
3 4 5 6 7 8 9 1 2 3 4 5 6 7 8 910 2
Chlorobenzene Abundance (pmol)
50 g Ca perchlorate + PA50 g Mg perchlorate + PA
Figure 10. Laboratory study showing the abundance of chlorobenzeneformation as a function of the initial abundance of phthalic acid(PA) pyrolyzed, in the presence of Ca-perchlorate (black circles) orMg-perchlorate (white circles). The higher yield for chlorobenzenewith Mg-perchlorate is explained by the higher abundance of HCland O2 release from Mg-perchlorate compared to Ca-perchlorate.Reported errors are 1σ.
Journal of Geophysical Research: Planets 10.1002/2014JE004737
FREISSINET ET AL. ©2015. The Authors. 505

chlorobenzene (Figure 10). Similar resultswere observed when subnanomolarconcentrations of benzoic acid andmellitic acid were pyrolyzed in the presenceof Ca-perchlorate [Miller et al., 2013].Furthermore, laboratory experiments inwhich approximately 1mg of kerogen-like organic matter isolated from theMurchison meteorite was pyrolyzed inthe presence of 500 μg Ca-perchlorateresulted in ~30 times more chlorobenzenecompared to the pyrolysis of 1mg ofMurchison without perchlorate (Figure 11).
SAM EGA data show the presence of apeak containing both m/z 112 and m/z114 ions, attributed to chlorobenzene,that was observed during pyrolysis of theCB-1, CB-2, CB-3, CB-5, CB-6, and CB-7samples but was not observed in the RNor in the CB-Blank-1 runs (Figure 12). In
addition, a decrease of bothm/z 112 andm/z 114 ions back down to background level in the CB-6-residue runafter a second heating of CB-6 was also observed (Figure 12). The blank following CB-7 (CB-Blank-2) andthe CH-Blank run, also do not display m/z 112 nor m/z 114 ions in the EGA data (Figure 12). CB-1 and CB-2would not be discussed further as the GC temperature cuts used in these runs were higher than the otheranalyses and did not include the m/z 112 and 114 ions of interest. A ~3:1 to ~5:1 ratio of the m/z 112 to m/z114 peaks in all EGA CB samples, approaching the National Institute of Standards and Technology (NIST)library ratio of 3:1 for chlorobenzene, confirms that chlorobenzene was either present in the sample or wasformed during pyrolysis. The EGA chlorobenzene abundances range from approximately 40 to 100 pmol,similar within error to the background-subtracted and EGA-corrected GCMS abundances for chlorobenzenereported in Table 1. The CB-5 EGA data show peaks in the low temperature range (150–350°C) for m/z 78,89, 102, 104, 105, 112, 113, 114, 119, 135, and 137 (Figure 13). These peaks are also present at a reduced level
Figure 11. Laboratory study showing the comparison of some organiccompounds detected from the GCMS analyses of ~1mg of kerogen-likeorganic matter isolated from theMurchisonmeteorite, pyrolyzed withoutor with 500 μg of Ca-perchlorate. Compound peak areas were measuredfrom extracted mass chromatograms (alkylthiophenes =m/z 97, 112;alkylbenzenes and benzoic acid =m/z 105; dichloromethane =m/z 49;chlorobenzene =m/z 112; and dichloropropane, dichlorobutane*,chloropropanone*, and dichloropropanone* =m/z 63). Reported errorsare 1σ. *Tentative identification.
350
300
250
200
150
100
50
0700600500400300200100
350
300
250
200
150
100
50
0700600500400300200100
350
300
250
200
150
100
50
0700600500400300200100
350
300
250
200
150
100
50
0700600
Sample Temperature (°C)
500400300200100
QM
S R
espo
nse
(cou
nts/
s)
a) RN-1 b) CB-3 and CB-5 c) CB-6 and CB-6-residued) CB-7, CB-Blank-2 and
CH-Blank
Figure 12. Smoothed EGA pyrograms showing them/z 112 (violet, top) andm/z 114 (green, bottom) signals in (a) RN-1; (b) CB-3 (plain lines) and CB-5 (dashed lines):(c) CB-6 triple portion (plain lines) and subsequent CB-6-residue reheated (dashed lines); and (d) CB-7 (plain lines), CB-Blank-2 (dashed lines), and CH-Blank (dotted lines).The m/z 112 to m/z 114 ratio of ~4 in CB-3, CB-5, and CB-6 is similar to the NIST chlorobenzene m/z 112 to m/z 114 ratio of ~3. The reheated CB-6-residue EGA tracesshow a return to background level for chlorobenzene. CB-7 shows a peak at m/z 112 but the temperature cut send to the GCMS excludes this peak. CB-Blank-2 andCH-Blank show and a return to background when no sample is pyrolyzed, after CB samples. The temperature cut sent to the hydrocarbon trap for GCMS analyses isindicated in the plot by the shaded region. The temperature cut for CH-Blank in Figure12d is not represented.
Journal of Geophysical Research: Planets 10.1002/2014JE004737
FREISSINET ET AL. ©2015. The Authors. 506
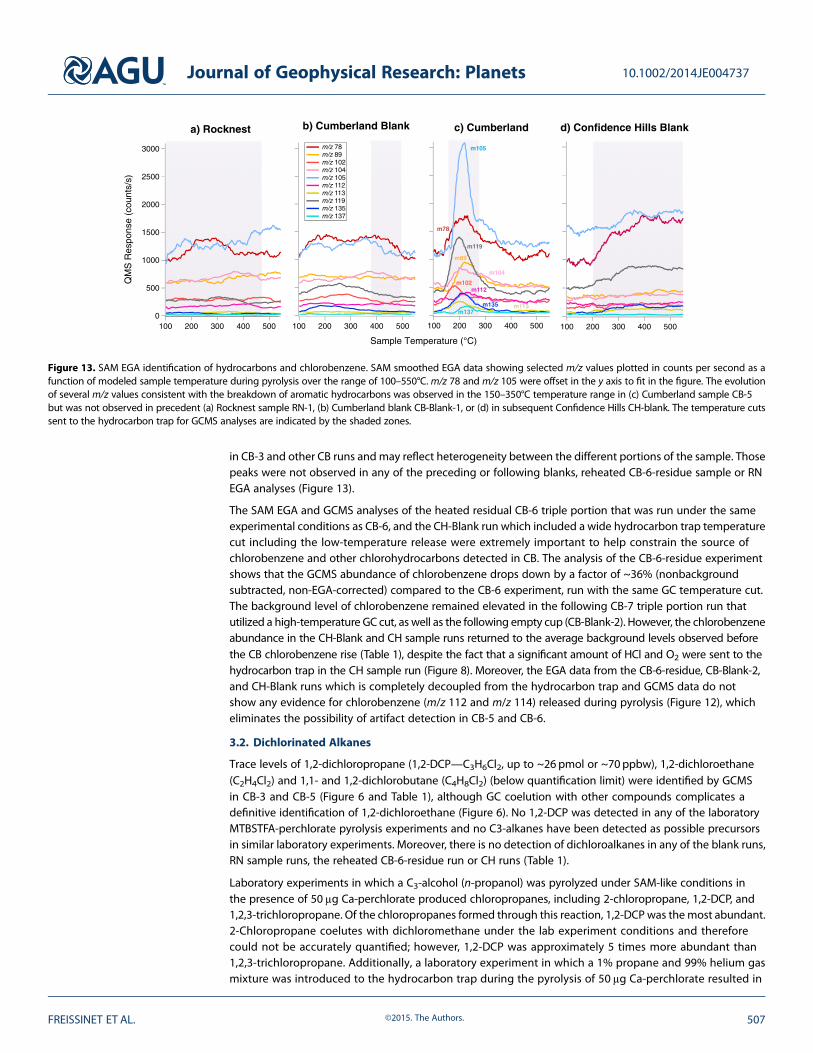
in CB-3 and other CB runs andmay reflect heterogeneity between the different portions of the sample. Thosepeaks were not observed in any of the preceding or following blanks, reheated CB-6-residue sample or RNEGA analyses (Figure 13).
The SAM EGA and GCMS analyses of the heated residual CB-6 triple portion that was run under the sameexperimental conditions as CB-6, and the CH-Blank run which included a wide hydrocarbon trap temperaturecut including the low-temperature release were extremely important to help constrain the source ofchlorobenzene and other chlorohydrocarbons detected in CB. The analysis of the CB-6-residue experimentshows that the GCMS abundance of chlorobenzene drops down by a factor of ~36% (nonbackgroundsubtracted, non-EGA-corrected) compared to the CB-6 experiment, run with the same GC temperature cut.The background level of chlorobenzene remained elevated in the following CB-7 triple portion run thatutilized a high-temperature GC cut, as well as the following empty cup (CB-Blank-2). However, the chlorobenzeneabundance in the CH-Blank and CH sample runs returned to the average background levels observed beforethe CB chlorobenzene rise (Table 1), despite the fact that a significant amount of HCl and O2 were sent to thehydrocarbon trap in the CH sample run (Figure 8). Moreover, the EGA data from the CB-6-residue, CB-Blank-2,and CH-Blank runs which is completely decoupled from the hydrocarbon trap and GCMS data do notshow any evidence for chlorobenzene (m/z 112 and m/z 114) released during pyrolysis (Figure 12), whicheliminates the possibility of artifact detection in CB-5 and CB-6.
3.2. Dichlorinated Alkanes
Trace levels of 1,2-dichloropropane (1,2-DCP—C3H6Cl2, up to ~26 pmol or ~70 ppbw), 1,2-dichloroethane(C2H4Cl2) and 1,1- and 1,2-dichlorobutane (C4H8Cl2) (below quantification limit) were identified by GCMSin CB-3 and CB-5 (Figure 6 and Table 1), although GC coelution with other compounds complicates adefinitive identification of 1,2-dichloroethane (Figure 6). No 1,2-DCP was detected in any of the laboratoryMTBSTFA-perchlorate pyrolysis experiments and no C3-alkanes have been detected as possible precursorsin similar laboratory experiments. Moreover, there is no detection of dichloroalkanes in any of the blank runs,RN sample runs, the reheated CB-6-residue run or CH runs (Table 1).
Laboratory experiments in which a C3-alcohol (n-propanol) was pyrolyzed under SAM-like conditions inthe presence of 50μg Ca-perchlorate produced chloropropanes, including 2-chloropropane, 1,2-DCP, and1,2,3-trichloropropane. Of the chloropropanes formed through this reaction, 1,2-DCPwas themost abundant.2-Chloropropane coelutes with dichloromethane under the lab experiment conditions and thereforecould not be accurately quantified; however, 1,2-DCP was approximately 5 times more abundant than1,2,3-trichloropropane. Additionally, a laboratory experiment in which a 1% propane and 99% helium gasmixture was introduced to the hydrocarbon trap during the pyrolysis of 50 μg Ca-perchlorate resulted in
500400300200100500
3000
2500
2000
1500
1000
500
0500400300200100
a) Rocknest b) Cumberland Blank c) Cumberland d) Confidence Hills Blank
400
Sample Temperature (°C)
300200100
QM
S R
espo
nse
(cou
nts/
s)
500400300200100
Figure 13. SAM EGA identification of hydrocarbons and chlorobenzene. SAM smoothed EGA data showing selected m/z values plotted in counts per second as afunction of modeled sample temperature during pyrolysis over the range of 100–550°C.m/z 78 and m/z 105 were offset in the y axis to fit in the figure. The evolutionof several m/z values consistent with the breakdown of aromatic hydrocarbons was observed in the 150–350°C temperature range in (c) Cumberland sample CB-5but was not observed in precedent (a) Rocknest sample RN-1, (b) Cumberland blank CB-Blank-1, or (d) in subsequent Confidence Hills CH-blank. The temperature cutssent to the hydrocarbon trap for GCMS analyses are indicated by the shaded zones.
Journal of Geophysical Research: Planets 10.1002/2014JE004737
FREISSINET ET AL. ©2015. The Authors. 507
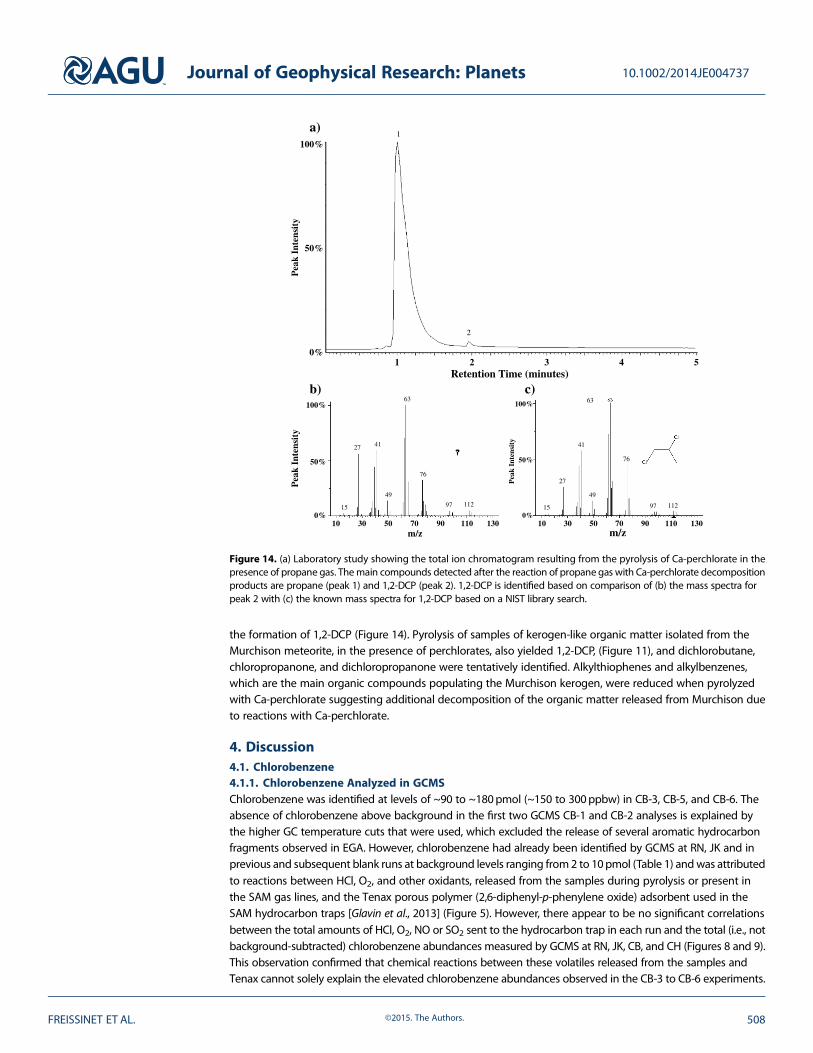
the formation of 1,2-DCP (Figure 14). Pyrolysis of samples of kerogen-like organic matter isolated from theMurchison meteorite, in the presence of perchlorates, also yielded 1,2-DCP, (Figure 11), and dichlorobutane,chloropropanone, and dichloropropanone were tentatively identified. Alkylthiophenes and alkylbenzenes,which are the main organic compounds populating the Murchison kerogen, were reduced when pyrolyzedwith Ca-perchlorate suggesting additional decomposition of the organic matter released from Murchison dueto reactions with Ca-perchlorate.
4. Discussion4.1. Chlorobenzene4.1.1. Chlorobenzene Analyzed in GCMSChlorobenzene was identified at levels of ~90 to ~180pmol (~150 to 300ppbw) in CB-3, CB-5, and CB-6. Theabsence of chlorobenzene above background in the first two GCMS CB-1 and CB-2 analyses is explained bythe higher GC temperature cuts that were used, which excluded the release of several aromatic hydrocarbonfragments observed in EGA. However, chlorobenzene had already been identified by GCMS at RN, JK and inprevious and subsequent blank runs at background levels ranging from2 to 10pmol (Table 1) andwas attributedto reactions between HCl, O2, and other oxidants, released from the samples during pyrolysis or present inthe SAM gas lines, and the Tenax porous polymer (2,6-diphenyl-p-phenylene oxide) adsorbent used in theSAM hydrocarbon traps [Glavin et al., 2013] (Figure 5). However, there appear to be no significant correlationsbetween the total amounts of HCl, O2, NO or SO2 sent to the hydrocarbon trap in each run and the total (i.e., notbackground-subtracted) chlorobenzene abundances measured by GCMS at RN, JK, CB, and CH (Figures 8 and 9).This observation confirmed that chemical reactions between these volatiles released from the samples andTenax cannot solely explain the elevated chlorobenzene abundances observed in the CB-3 to CB-6 experiments.
1 2 3 4 0%
100%
50%
1
2
Pea
k In
tens
ity
5
b) 100%
50%
0% 10 30 50 70 90 110 130
27
15
41
49
76
97 112
63
m/z
Pea
k In
tens
ity
27
15
41
49
76
97 112
63
10 30 50 70 90 110 130 m/z
100%
50%
0%
c) Retention Time (minutes)
Pea
k In
tens
ity
a)
Figure 14. (a) Laboratory study showing the total ion chromatogram resulting from the pyrolysis of Ca-perchlorate in thepresence of propane gas. Themain compounds detected after the reaction of propane gas with Ca-perchlorate decompositionproducts are propane (peak 1) and 1,2-DCP (peak 2). 1,2-DCP is identified based on comparison of (b) the mass spectra forpeak 2 with (c) the known mass spectra for 1,2-DCP based on a NIST library search.
Journal of Geophysical Research: Planets 10.1002/2014JE004737
FREISSINET ET AL. ©2015. The Authors. 508

The presence of chlorobenzene in post-CB-6 GCMS runs (Table 1) may be explained by incomplete desorptionof chlorobenzene from the hydrocarbon or injection trap(s) and/or gas processing system collected during theCB-3, CB-5, and CB-6 triple portion experiment. Based on the SAM GCMS data, it is clear that after the firstintroduction of chlorobenzene released from CB-3 to CB-6 samples to the SAM hydrocarbon trap, the GCMSbackground level of chlorobenzene increased. In addition, the simultaneous presence of a known HClbackground and a hypothetical high molecular weight and low volatility parent aromatic compounds forchlorobenzene (such as benzenecarboxylates) indigenous to the sample, may also explain the residualdetection of chlorobenzene in the GCMS CB-6-residue, CB-Blank-2 and higher temperature cut CB-7 experiments.Because empty cup blankswere not run between each solid sample analysis, the change in GCMS chlorobenzenebackground levels between the experiments CB-3 to CB-6 remains unclear. This change is thus taken intoaccount in the background-subtracted data presented in Table 1. When the chlorobenzene average abundancesmeasured by GCMS in the CB-6-residue, CB-7 and CB-Blank-2 runs (~44 pmol) are subtracted from the levelsof chlorobenzene measured in the CB-5 and CB-6 analyses, a positive detection of chlorobenzene abovebackground of ~27 pmol in CB-5 and ~30 pmol in CB-6 remains. The EGA-corrected chlorobenzeneabundances calculated from the background-subtracted abundances show an almost twofold increase fromthe CB-5 single-portion to the CB-6 triple portion analyses. Due to possible additional combustion of organicsduring pyrolysis and possible incomplete transfers through the SAM gas processing system, the chlorobenzeneabundances reported here represent a lower limit of the amount of chlorobenzene originally present in thesample prior to pyrolysis. The CH-Blank and subsequent CH-1 sample GCMS runs display a return to the averagebackground level for chlorobenzene, which confirms that any chlorobenzene carry over from the CB runs inthe SAM gas processing system had been completely removed. It is worth noting that between the last CB run(CB-Blank-2) and the CH-Blank, a SAM combustion experiment was conducted where O2 gas was introducedinto the SAM gas lines at ~135°C. This combustion experiment may have removed the residual chlorobenzeneor chlorobenzene precursors from the SAM gas lines that were responsible for the chlorobenzene carryoverobserved in the CB-6-residue, CB-7, and CB-Blank-2 runs.4.1.2. Chlorobenzene and MTBSTFAThe evidence for decoupling of chlorobenzene from terrestrial sources is provided by the observation thatthe chlorobenzene abundances did not decrease in the CB-5 and CB-6 runs in which the terrestrial MTBSTFAcarbon sources within SAM were significantly reduced and did not increase in the CH-1 sample run whereMTBSTFA reduction was not employed (Figure 4). Indeed, chlorobenzene is present at nearly the sameabundance (both background and nonbackground-subtracted, non-EGA-corrected m/z 112 abundance),and approximately twofold higher (background-subtracted, EGA-corrected m/z 112 abundance), in theCB-6 triple portion compared to CB-5 single-portion run (Table 1). The chlorobenzene abundance thendecreased back down to the original chlorobenzene background level in the CH-Blank and CH-1 runs. Sincethe chlorobenzene abundances do not follow the MTBSTFA abundance trend, as the chloromethanes do(Figure 4), MTBSTFA cannot be a source of chlorobenzene in SAM.
In addition, laboratory pyrolysis GCMS experiments show that the chlorobenzene abundances do not varywhen a sample is pyrolyzed in the presence or absence of MTBSTFA (Figure 7). This experiment supports theconclusion that MTBSTFA cannot be a carbon source for chlorobenzene under the experimental conditionsemployed, since the amount of MTBSTFA used in the laboratory experiment (1.7μmol) is about 1 order ofmagnitude higher than the highest estimation of MTBSTFA abundance in the SAM background beforeeach experiment (~116 nmol). The chlorobenzene background in this laboratory experiment is attributedto reactions of the chlorine in its reduced form (HCl) and O2 released during pyrolysis of perchlorate witharomatic molecules derived from the Tenax TA of the hydrocarbon trap.4.1.3. Chlorobenzene and TenaxWhen heated to 300°C during thermal desorption, Tenax produces trace amounts of various aromaticmolecules: benzene, toluene, ethylbenzene, xylene, phenylethyne, styrene, naphthalene, biphenyl, andphenol (Figure 5). Phenol is also observed at low abundance in the SAM GCMS data and laboratory GCMSexperiments under its derivatized form, tert-butyldimethylsilylphenol (TBDMS-phenol). The phenol releasedfrom the trap is therefore the most likely precursor of the chlorobenzene observed in the laboratoryexperiments as well as in the SAM blank runs, since laboratory experiments have shown that functionalizedaromatic molecules can readily react with perchlorate decomposition products to form chlorobenzene, whilethose chlorinated decomposition products do not substitute easily for H or methyl groups from benzene and
Journal of Geophysical Research: Planets 10.1002/2014JE004737
FREISSINET ET AL. ©2015. The Authors. 509

toluene. In SAM, this reaction, along with EGA evidence of an increasing amount of HCl background in SAMafter the first solid sample run at RN, indicates that HCl is building up along the SAM sample-processingpathway andmay explain why chlorobenzene has also been observed at background level in the SAM blanksother than RN. Residual HCl within SAM is thus available to react with phenol released from the Tenaxcomponent of the hydrocarbon trap during heating.
Consideration was thus also given to the possibility of production of chlorobenzene by chemical reactions onthe Tenax polymer trap. We first examined the possibility of an increasing chlorobenzene level reflecting agradual or an acute degradation of the Tenax from the traps with time. If the increase in chlorobenzeneabundance was attributed to an increasing degradation of the traps with time, one would expect to see agradual increase in chlorobenzene abundances. However, a sudden and significant increase in chlorobenzenewas observed from CB-2 (6 ± 1 pmol) to CB-3 (36 ± 7 pmol), CB-5 (71 ± 13 pmol), and CB-6 (74 ± 14 pmol)(nonbackground-subtracted abundances), followed by a decrease in the subsequent samples and a returnto the background level in the CH runs (Table 1). In case of an acute degradation event, the abundance ofchlorobenzene would not decrease after the first significant increase in CB-3. The results from SAM as well asthe laboratory results do not support this possibility.
The possibility that the increasing chlorobenzene level observed in the CB samples is the result of a chemicaldegradation of the Tenax from the HC traps due to the volatiles released from the sample was also examined.HCl, O2, NO, and SO2 abundances were examined as possible sources of trap degradation. SAM data showno correlation between the abundance of these species sent to the HC trap, and the chlorobenzeneabundance detected by GCMS (Figure 8). However, NO, HCl, and O2 all start to evolve at approximately thesame temperature (low temperature, ~150–200°C) as the release of m/z 112 and m/z 114 attributed tochlorobenzene, explaining a high abundance of the three molecules in the CB runs where chlorobenzeneis detected. Cl2, a reactive species originating from the decomposition of Mg-perchlorate, was discardedas a possible contributor of trap degradation and is considered to react with water and readily form HCl.Indeed, its lower molar abundance than H2O in CB, as well as its nondetection in SAM GCMS, strongly suggeststhat it does not reach the HC trap as Cl2 molecule.
Taken together, the SAM and laboratory observations rule out the possibility that the elevated chlorobenzeneabundances detected at CB are due to the degradation of the SAM hydrocarbon trap by perchloratedecomposition products or when exposed to increasing amounts of HCl, O2, NO, or SO2.4.1.4. Detection of Chlorobenzene by EGASince the EGA mode samples the gas stream directly evolved from the sample during pyrolysis, prior tointroduction of gas to the hydrocarbon traps, them/z 112 andm/z 114 ions detected at CB cannot be derivedfrom the Tenax polymers in the traps and provide additional evidence for a CB origin of chlorobenzene.It is also highly unlikely that all of these ions in the CB EGA are from complex reactions between MTBSTFAand oxychlorine phases, because they were not detected in the RN EGA analyses [Glavin et al., 2013] orsubsequent CH analyses (Figure 12). Moreover, them/z 112 andm/z 114 signatures were not observed in anyof the empty cup blank runs or reheated CB-6 triple portion sample, indicating a sample contribution to thesemasses for CB-1 to CB-6 and CB-7 runs. The 36Cl/38Cl isotopic ratio found on Mars from HCl measurementsis very similar to the one on Earth (3.19 ± 0.03 [Farley et al., 2014] versus 3.08 from NIST). However, due tothe collection and processing of the data, a deviation from the 3:1 ratio is expected. It is explained by bothcoelution with other compounds sharing the same masses and by the scanning rates intrinsic to the SAMMSwhich requires the peaks area to be fitted in posttreatment. A ~3.8 ratio of the m/z 112 and m/z 114 ionswas also observed in the EGA data during the boil-off segment of the JK-3 experiment, but because theGC temperature cut did not include volatiles released during the boil-off, the JK-3 EGA observation withoutGCMS confirmation is insufficient to support definitive identification of chlorobenzene at JK. This is neverthelessa secondary level observation that may suggest the presence of chlorobenzene (or precursors) in both JKand CB samples from the Sheepbed mudstone.
The highm/z ions observed in CB EGA and released at low temperature between ~150 and ~350°C, displayedon Figure 13 for CB-5, are consistent with ions that can be produced from aromatic hydrocarbons releasedfrom the CB sample, although other molecular structures may also produce them [McLafferty, 1959]. Forexample, m/z 105 and m/z 107 both evolve from CB-5 at similar intensities in the EGA analysis at a peaksample temperature of ~220°C and may be attributed to bromocyanogen (BrCN). However, the identification
Journal of Geophysical Research: Planets 10.1002/2014JE004737
FREISSINET ET AL. ©2015. The Authors. 510

of this compound has not been confirmed by SAM GCMS and other molecules can contribute to those masses.The m/z 105 observed is thought to have contributions from at least two different ions.
The large increases in chlorobenzene abundance measured by GCMS in CB-3, CB-5, and CB-6 occurredwhen the hydrocarbon trap temperature cut was modified to collect evolved gases over a lower temperaturerange (~157–320°C), which included a fraction of the m/z 112, m/z 114 and other high m/z peaks observedin EGA. Moreover, when the GCMS signals were EGA corrected to account for the fraction of the m/z 112 ionsent to the hydrocarbon trap, the CB-6 triple portion chlorobenzene abundances were about 1.5 to 2 timesgreater than the CB-3 and CB-5 single-portion levels (Table 1). Thus, SAM EGA and GCMS results together makea compelling case for an indigenous aromatic hydrocarbon source of the chlorobenzene released from CBsample in the ~150–350°C temperature range.
4.2. Dichlorinated Alkanes
1,2-DCP was quantified at abundances up to ~26 pmol or ~70 ppbw, and 1,2-dichloroethane and 1,1- and1,2-dichlorobutane were identified below quantification limit in CB-3 and CB-5 samples (Table 1 and Figure 6).At the low levels observed in GCMS, 1,2-DCP is not detectable in EGA mode, given that it is below the EGAdetection limit. In addition, the base peak of 1,2-DCP (m/z 63) interferes with the mass spectrum of cyanogenchloride, known to be present well above the EGA detection limit. Given these limitations, the identification of1,2-DCP by EGA is not possible.
The fact that 1,2-DCP was not detected in any of the laboratory MTBSTFA-perchlorate pyrolysis experimentsand that no C3-alkanes have been detected as possible precursors in similar experiments, coupled to thesignificant reduction of volatiles derived from instrument sources in the CB-5 run compared to CB-3 (Figure 4)and to the lack of dichloroalkanes detected in any of the blank runs, RN sample runs, or the reheatedCB-6-residue run (Table 1), indicate that neither MTBSTFA nor Tenax are major carbon contributors to thesedichloroalkanes detected in the CB low-temperature cut GCMS analyses. Moreover, the lack of 1,2-DCP inthe triple portion CB-6 GCMS analysis (Table 1), in which much higher abundances of HCl and O2 were sentto the hydrocarbon trap compared to the single-portion CB-3 and CB-5 runs (Figure 8), indicates that 1,2-DCPis not formed from chemical reactions between Tenax breakdown products (e.g., propene) and theseoxychlorine decomposition products.
RN and CH analyses included low-temperature GC cuts similar to the ones used in CB-3 and CB-5, establishinga baseline for these CB experiments. The lower abundance of 1,2-DCP in CB-5 (~14 ± 3 pmol) compared to theCB-3 sample (~26 ± 5 pmol) may reflect cup and sample pretreatment differences between the runs thatcould have favored vaporization of 1,2-DCP prior to the CB-5 pyrolysis experiment (Table 1), or it may reflectheterogeneity in the different portions of the CB sample. The lack of dichloroalkanes detected in any ofthe JK runs or CB runs other than CB-3 and CB-5 (Table 1 and Figure 4) is explained by a higher temperaturerange of evolved volatiles sent to the hydrocarbon trap for GC analyses and/or by a partial loss of dichloroalkanesor their carbon precursor during the higher temperature sample boil-offs (JK-1-3, CB-6-7) (Table 1). Thus,an indigenous carbon precursor in CB is favored as the source for the dichloroalkanes, and through theirvariety of chain lengths, these C2-, C3-, and C4-chlorinated alkanes support an organic source that includessome structural diversity.
4.3. Organic Precursors Indigenous to the Sheepbed Mudstone4.3.1. Chlorobenzene PrecursorsSince Tenax, MTBSTFA, and other instrument background sources can be ruled out as the primary sourceof the aromatic hydrocarbon fragments detected during EGA analyses of CB as well as most of the chlorobenzeneidentified in the GCMS and EGA analyses, one must conclude that these organics originate from the mudstone,either as Martian (hydrothermal, igneous, atmospheric, or biological) or exogenous carbon (meteoritic,cometary, or from interplanetary dust particles (IDPs)). Organic compounds such as polycyclic aromatichydrocarbons and kerogen delivered to Mars by meteorites, comets, and IDPs infall may undergo successiveoxidation reactions to eventually formmetastable benzenecarboxylates, including phthalic and mellitic acids[Benner et al., 2000]. These aromatic carboxylic acids are rather stable and not prone to further oxidation,and as such may accumulate in the Martian regolith.
The laboratory experiments show that functionalized group of those aromatic ring structures make them proneto chlorination and formation of chlorobenzene, when pyrolyzed in the presence of Ca- or Mg-perchlorate
Journal of Geophysical Research: Planets 10.1002/2014JE004737
FREISSINET ET AL. ©2015. The Authors. 511

(Figure 10). The yield of chlorobenzene is higher in the experiments with Mg-perchlorate than in experimentswith Ca-perchlorate. However, this is again a function of the total HCl formed during the pyrolysis of these twoperchlorates; when there is more HCl present, more of the phthalic acid is converted to chlorobenzene.
These results demonstrate that under the experimental conditions, the HCl produced from perchloratedecomposition and subsequent reactions with H2O replaces more electronegative functional groups, likehydroxyl- or carboxylic acid groups, but does not easily substitute for H or methyl groups. Thus, benzene andtoluene from the hydrocarbon traps, which are the most abundant compounds released from the thermaldegradation of Tenax, are not good candidates for the formation of chlorobenzene. However, the presenceof both benzene and iron-bearing phases in the sample, could result in formation of chlorobenzene froman iron-catalyzed reaction between benzene, H2O and HCl vapor. This combination of reactants is very similarto known methods of industrial synthesis of chlorobenzene. Although benzene released from the SAMhydrocarbon traps is not a likely precursor to the chlorobenzene observed in GCMS, benzene from the CBsample might be a possible precursor due to the known presence of metal catalysts in the CB samples,including magnetite, akaganeite, and hematite [Carey, 1993; Vaniman et al., 2014].
The results from the pyrolysis of organicmatter isolated fromMurchisonmeteorite in the presence of perchlorate(Figure 11) demonstrate that meteoritic kerogen-like macromolecular organic material can be chlorinatedfrom perchlorate-derived decomposition products to form the types of compounds detected by SAM in theSheepbed mudstone. The Murchison meteorite is used as an analog sample but is not expected to harbor asimilar organics composition as the ones present in CB, thus leading to a different set and ratio of chlorinatedhydrocarbons. Since aromatic carboxylic acids are of high polarity and low volatility, those organic moleculesreleased during pyrolysis are largely undetectable by GCMS under the SAM GC conditions used. For example,the pyrolysis of ppm levels of mellitic acid in fused silica in laboratory pyr-GCMS and EGA experiments carriedout under SAM-like conditions leads to the formation of CO and CO2, and none of the mellitic acid or itsexpected hydrocarbon by-products were identified. Nevertheless, these metastable partially oxidized productscould be good candidates as precursors of the chlorobenzene detected in the Sheepbed mudstone. It is alsopossible that chlorobenzene formed during pyrolysis from a reaction between benzene (base peak m/z 78),H2O, and HCl vapor released from the sample in the presence of iron-containing catalysts [Carey, 1993] such asmagnetite, akaganeite, or hematite, all known to be present in CB [Vaniman et al., 2014].4.3.2. Dichloroalkanes PrecursorsAlkyl components in CB could act as precursors for the dichloroalkanes detected in the Sheepbed mudstone.The tentative identification of propane in the CB-5 GCMS analysis (data not shown), made difficult by its lowretention time and weak mass spectrum, may indicate that aliphatic hydrocarbons are available to act asprecursors for the 1,2-DCP detected in CB. This propane may be a fragment of a larger hydrocarbon in theCB sample and C3 hydrocarbons may participate in the formation of 1,2-DCP in the presence of reactiveoxychlorine. C3 alcohol and alkane were tested against chlorination when pyrolyzed in the presence ofCa-perchlorate. Although the propane introduced in this experiment (Figure 14) was not pyrolyzed directly inthe presence of the perchlorate, as it might be in SAM, this experiment demonstrates that propane formedduring pyrolysis can react with perchlorate decomposition products in the gas phase to form mostly 1,2-DCP.Although 1,2-DCP was identified with SAM, other C3 chlorinated hydrocarbons including 2-chloropropaneand 1,2,3-dichloropropane have not been identified, as they were in laboratory runs. Traces of 1,2-DCP werealso identified when Murchison organic matter was pyrolyzed in the presence of Ca-perchlorate (Figure 11),suggesting a variety of precursors leading to 1,2-DCP. The identification of 1,2-DCP, 1,1- and 1,2-dichlorobutane,and possibly 1,2-dichloroethane by SAM, coupled with the elevated abundance of chloromethanes measuredby EGA in JK and CB compared to RN [Ming et al., 2014], may indicate that the same chlorination reaction isoccurring on C1 to C4 alkyl precursors present in the Martian mudstone samples.
Although it is thought that the chlorinated forms of the organic molecules detected by SAM are formedduring pyrolysis, the presence of chlorobenzene and 1,2-DCP as such in the Sheepbed mudstone cannot beexcluded. However, the boiling temperature range of chlorobenzene below 40°C at the pressures the sampleis exposed to, before the pyrolysis ramp, is estimated to be lower than the sample handoff of ~45°C, whichmake the presence of chlorobenzene as such in the low-temperature release part of the sample unlikely.
The low-temperature CO2 release that was observed in EGA in the JK and CB portions but was not observed inRN may be due to the combustion of Martian or exogenous organic matter in the mudstone [Ming et al., 2014].
Journal of Geophysical Research: Planets 10.1002/2014JE004737
FREISSINET ET AL. ©2015. The Authors. 512

The trace element inventory of the Sheepbed mudstone is consistent with a meteoritic component [McLennanet al., 2014], which could be a source of organic matter andmay contribute to the carbon source responsible forthe chlorobenzene and dichloroalkanes observed at CB.
4.4. Preservation of Organic Molecules on Mars
Organic compounds in ancient sedimentary rocks onMars could include polycyclic aromatic hydrocarbons andrefractory organic material, either formed on Mars from igneous, hydrothermal, atmospheric, or biologicalprocesses [Shock, 1990; Steele et al., 2012] or, alternatively, delivered directly to Mars via meteorites, comets,or interplanetary dust particles [Gibson, 1992; Sephton, 2012]. The ability to detect organic compounds inMartian sedimentary rocks with SAM is a function of their initial abundance and entrainment as the rockformed, the extent of subsequent degradation during diagenesis, exhumation, and exposure to the surfaceand near-surface, and the volatility/polarity and minimal combustion of products released during pyrolysis.Destruction or transformation of organic compounds may occur in the near-surface environment of Marseither by oxidants present in the regolith that can permeate the subsurface [Biemann et al., 1977; Kounaveset al., 2014] or by ultraviolet and ionizing radiation [Oro and Holzer, 1979; Pavlov et al., 2012]. It has beenpostulated that organic compounds in near-surface rocks may undergo successive oxidation reactions thateventually form metastable benzenecarboxylates, including phthalic and mellitic acids [Benner et al., 2000].Energetic cosmic rays can further degrade organics in the top 2m of the surface [Pavlov et al., 2012] and SAMmeasurements of the abundance of noble gas isotopes in the CB sample, produced by spallation and neutroncapture, established that the mudstone analyzed was exposed to cosmic radiation for ~78Ma [Farley et al.,2014], which could have reduced the abundance of organic matter originally present in CB [Oro and Holzer,1979]. The widespread presence of chlorine on Mars [Keller et al., 2006] and the detection of perchlorateand/or oxychlorine compounds at two very different locations (Phoenix: polar [Hecht et al., 2009] and Curiosity:equatorial [Glavin et al., 2013] landing sites) and the EETA79001 meteorite [Kounaves et al., 2014] support thehypothesis that oxychlorine compounds may be widely distributed in the regolith of Mars. These compoundsmay be ubiquitous on the Martian surface and may play a critical role in the organic preservation state, notonly at Gale Crater but all over the planet. The detection of chlorohydrocarbons illustrates that as alreadysuggested by laboratory studies [Navarro-Gonzalez et al., 2010; Steininger et al., 2012], the presence of anoxychlorine phase, thought to be perchlorate, does not fully inhibit the detection of organics in pyrolysis EGAand GCMS, despite being a strong oxidant when heated in the conditions of the experiment.
5. Conclusion
Organic molecules such as chlorobenzene (C6H5Cl—150 to 300ppbw) and trace levels of 1,2-dichloropropane(1,2-DCP (C3H6Cl2) up to 70ppbw), 1,2-dichloroethane (C2H4Cl2), and 1,1- and 1,2-dichlorobutane (C4H8Cl2)(below quantification limit) were identified by GCMS and EGA in multiple CB samples from the Sheepbedmudstone. The discussion above supports elimination of terrestrial carbon as a possible source of the elevatedlevels of chlorobenzene and the C2 to C4 dichloroalkanes identified in CB. Although the presence of thosechlorohydrocarbons as such in the Sheepbed mudstone cannot be excluded, it is thought that they originatefrom reactions during pyrolysis between Martian oxychlorine and organic aromatic and aliphatic compoundsindigenous to the sample.
The MSL search for hydrocarbons is designed to constrain the source, destruction, and transformation of organiccompounds in the Mars’ near-surface rocks and soils. The discovery of the presence of chlorinated organiccompounds near the surface means that reduced material with covalent bonds has survived despite theabundance of oxidants and significant high-energy radiation exposure through the thin Mars atmosphere. Thiswork provides significant progress towardmapping out potential windows of preservation for chemically reducedorganic compounds. This view into ancient Mars begins to provide a context for habitable environments and is afirst step toward understanding the presence and diversity of possible prebiotic or biotic molecular signatures.
ReferencesAnderson, M. S., I. Katz, M. Petkov, B. Blakkolb, J. Mennella, S. D’Agostino, J. Crisp, J. Evans, J. Feldman, and D. Limonadi (2012), In situ cleaning
of instruments for the sensitive detection of organics on Mars, Rev. Sci. Instrum., 83(10), doi:10.1063/1061.4757861.Archer, P. D., et al. (2014), Abundances and implications of volatile-bearing species from Evolved Gas Analysis of the Rocknest aeolian
deposit, Gale Crater, Mars, J. Geophys. Res. Planets, 119, 237–254, doi:10.1002/2013JE004493.
AcknowledgmentsThis work could not have been conductedwithout the continuous support of theSAM and MSL operations, engineering,and scientific teams. NASA providedsupport for the development andoperation of SAM. SAM-GC wassupported by funds from the FrenchSpace Agency (CNES). C.F. acknowledgesthe NPP program. C.F., D.P.G., K.E.M., J.L.E.,R.E.S., J.P.D., and M.G.M. acknowledgesupport from the MSL ParticipatingScientist Program. Data from these SAMexperiments are archived in the PlanetaryData System (pds.nasa.gov).
Journal of Geophysical Research: Planets 10.1002/2014JE004737
FREISSINET ET AL. ©2015. The Authors. 513

Benner, S. A., K. G. Devine, L. N. Matveeva, and D. H. Powell (2000), The missing organic molecules on Mars, Proc. Natl. Acad. Sci. U.S.A.,97(6), 2425–2430.
Biemann, K., and J. L. Bada (2011), Comment on “Reanalysis of the Viking results suggests perchlorate and organics at midlatitudes on Mars”by Rafael Navarro-Gonzalez et al, J. Geophys. Res., 116, E12001, doi:10.1029/2011JE003869.
Biemann, K., et al. (1976), Search for organic and volatile inorganic-compounds in 2 surface samples from Chryse-Planitia Region of Mars,Science, 194(4260), 72–76.
Biemann, K., et al. (1977), The search for organic substances and inorganic volatile compounds in the surface of Mars, J. Geophys. Res., 82(28),4641–4658, doi:10.1029/JS082i028p04641.
Bish, D. L., et al. (2013), X-ray diffraction results from Mars Science Laboratory: Mineralogy of Rocknest at Gale Crater, Science, 341(6153),doi:10.1126/science.1238932.
Blake, D. F., et al. (2013), Curiosity at Gale Crater, Mars: Characterization and analysis of the Rocknest sand shadow, Science, 341(6153),doi:10.1126/science.1239505.
Carey, F. A. (1993), Organic Chemistry, 5th ed., McGraw-Hill, Boston, Mass.Deamer, D. W., and R. M. Pashley (1989), Amphiphilic components of the Murchison carbonaceous chondrite: Surface properties and
membrane formation, Origins Life Evol. Biosphere, 19(1), 21–38.Farley, K. A., et al. (2014), In-situ radiometric and exposure age dating of the Martian surface, Science, 343(6169), doi:10.1126/science.1247166.Farmer, J. D., and D. J. Des Marais (1999), Exploring for a record of ancient Martian life, J. Geophys. Res., 104(E11), 26,977–26,995, doi:10.1029/
1998JE000540.Gibson, E. K. (1992), Volatiles in interplanetary dust particles—A review, J. Geophys. Res., 97(E3), 3865–3875, doi:10.1029/92JE00033.Glavin, D. P., H. J. Cleaves, M. Schubert, A. Aubrey, and J. L. Bada (2004), New method for estimating bacterial cell abundances in natural
samples by use of sublimation, Appl. Environ. Microbiol., 70(10), 5923–5928.Glavin, D. P., et al. (2013), Evidence for perchlorates and the origin of chlorinated hydrocarbons detected by SAM at the Rocknest aeolian
deposit in Gale Crater, J. Geophys. Res. Planets, 118, 1955–1973, doi:10.1002/jgre.20144.Grotzinger, J. P., et al. (2012), Mars Science Laboratory mission and science investigation, Space Sci. Rev., 170(1–4), 5–56.Grotzinger, J. P., et al. (2014), A habitable fluvio-lacustrine environment at Yellowknife Bay, Gale Crater, Mars, Science, 343(6169), doi:10.1126/
science.1242777.Hecht, M. H., et al. (2009), Detection of perchlorate and the soluble chemistry ofMartian soil at the Phoenix Lander Site, Science, 325(5936), 64–67.Keller, J. M., et al. (2006), Equatorial and midlatitude distribution of chlorine measured by Mars Odyssey GRS, J. Geophys. Res., 111, E03S08,
doi:10.1029/2006JE002679.Kounaves, S. P., B. L. Carrier, G. D. O’Neil, S. T. Stroble, and M. W. Claire (2014), Evidence of Martian perchlorate, chlorate, and nitrate in Mars
meteorite EETA79001: Implications for oxidants and organics, Icarus, 229, 206–213.Leshin, L. A., et al. (2013), Volatile, isotope, and organic analysis of Martian fines with the Mars Curiosity rover, Science, 341(6153),
doi:10.1126/science.1238937.Mahaffy, P. R., et al. (2012), The sample analysis at Mars investigation and instrument suite, Space Sci. Rev., 170(1–4), 401–478.McLafferty, F. W. (1959), Mass spectrometric analysis—Molecular rearrangements, Anal. Chem., 31(1), 82–87.McLennan, S. M., et al. (2014), Elemental geochemistry of sedimentary rocks in Yellowknife Bay, Gale Crater, Mars, Science, 343(6169),
doi:10.1126/science.1244734.Miller, K. E., R. E. Summons, J. L. Eigenbrode, C. Freissinet, D. P. Glavin, and M. G. Martin (2013), Analogue experiments identify possible precursor
compounds for chlorohydrocarbons detected in SAM, Abstract P23B-1785 presented at 2013 Fall Meeting, AGU, San Francisco, Calif.Ming, D. W., et al. (2014), Volatile and organic compositions of sedimentary rocks in Yellowknife Bay, Gale Crater, Mars, Science, 343(6169),
doi:10.1126/science.1245267.Navarro-Gonzalez, R., E. Vargas, J. de la Rosa, A. C. Raga, and C. P. McKay (2010), Reanalysis of the Viking results suggests perchlorate and
organics at midlatitudes on Mars, J. Geophys. Res., 115, E12010, doi:10.1029/2010JE003599.Oro, J., and G. Holzer (1979), Photolytic degradation and oxidation of organic-compounds under simulated Martian conditions, J. Mol. Evol.,
14(1–3), 153–160.Pavlov, A. A., G. Vasilyev, V. M. Ostryakov, A. K. Pavlov, and P. Mahaffy (2012), Degradation of the organic molecules in the shallow subsurface
of Mars due to irradiation by cosmic rays, Geophys. Res. Lett., 39, L13202, doi:10.1029/2012GL052166.Sephton, M. A. (2012), Pyrolysis and mass spectrometry studies of meteoritic organic matter, Mass Spectrom. Rev., 31(5), 560–569.Shock, E. L. (1990), Geochemical constraints on the origin of organic-compounds in hydrothermal systems, Origins Life Evol. Biosphere,
20(3–4), 331–367.Steele, A., et al. (2012), A reduced organic carbon component in Martian basalts, Science, 337(6091), 212–215.Steininger, H., F. Goesmann, and W. Goetz (2012), Influence of magnesium perchlorate on the pyrolysis of organic compounds in Mars
analogue soils, Planet. Space Sci., 71(1), 9–17.Summons, R. E., J. P. Amend, D. Bish, R. Buick, G. D. Cody, D. J. Des Marais, G. Dromart, J. L. Eigenbrode, A. H. Knoll, and D. Y. Sumner (2011),
Preservation ofMartian organic and environmental records: Final report of theMars biosignatureworking group, Astrobiology, 11(2), 157–181.Vaniman, D. T., et al. (2014), Mineralogy of a mudstone at Yellowknife Bay, Gale Crater, Mars, Science, 343(6169), doi:10.1126/science.1243480.
Journal of Geophysical Research: Planets 10.1002/2014JE004737
FREISSINET ET AL. ©2015. The Authors. 514