organic matter content and type variation in the sequence...
TRANSCRIPT

Sedimentary Geology 383 (2019) 101–120
Contents lists available at ScienceDirect
Sedimentary Geology
j ourna l homepage: www.e lsev ie r .com/ locate /sedgeo
Organic matter content and type variation in the sequence stratigraphiccontext of the Upper Devonian New Albany Shale, Illinois Basin
Bei Liu a,⁎, Juergen Schieber a, Maria Mastalerz b, Juan Teng b,c
a Department of Earth and Atmospheric Sciences, Indiana University, Bloomington, IN 47405, USAb Indiana Geological and Water Survey, Indiana University, Bloomington, IN 47405-2208, USAc Department of Petroleum Engineering, Chengdu University of Technology, Chengdu, Sichuan 610059, China
⁎ Corresponding author.E-mail address: [email protected] (B. Liu).
https://doi.org/10.1016/j.sedgeo.2019.02.0040037-0738/© 2019 Elsevier B.V. All rights reserved.
a b s t r a c t
a r t i c l e i n f oArticle history:Received 4 December 2018Received in revised form 7 February 2019Accepted 8 February 2019Available online 14 February 2019
Editor: Dr. J. Knight
Organic matter quantity and type are important parameters in conventional source rock evaluation and unconven-tional shale oil/gas reservoir characterization. Understanding the stratigraphic distribution of organicmatter contentand type in black shale successions is critical for identifying potentially productive intervals, because organicmattercan adsorb large amounts of oil and gas. Detailed examination of total organic carbon content, organic petrographiccomposition, and high-resolution (8 cm spacing) geochemical proxies in a sequence stratigraphic framework wereconducted on an earlymature (0.55%Ro)NewAlbany Shale core of the Illinois Basin to study the influence of relativesea-level fluctuations on paleoproductivity, clastic supply, bottom-water redox conditions, and their combined con-trol on total organic carbon distribution pattern and organic maceral variation.Marine organic matter including amorphous organic matter and alginite (mainly derived from Tasmanites cysts)is the dominant organic matter in the New Albany Shale. Terrestrial organic matter accounts for b10% of total or-ganicmatter.Within a sequence stratigraphic context, total organic carbon content increases in transgressive sys-tems tracts, reaches a maximum before the maximum flooding surface, and shows relatively low values inhighstand systems tracts. Comparatively, low total organic carbon contents atmaximum flooding surfaces reflecta combination of low sedimentation rates, elevated bottom-water oxygenation, and high biogenic silica dilution.Stratigraphically, amorphous organic matter content increases in transgressive systems tracts, reaches a maxi-mum near the maximum flooding surface, and decreases in highstand systems tracts. Enrichment of brokenTasmanites cysts and their detrital infills are an indicator of high-energy environments and could possibly indi-cate lowstand systems tracts. The stratigraphic distribution of organic matter content and type may result in cy-clic stratigraphic variations of hydrocarbon generation potential and oil saturation, and influence thedevelopment of secondary organic pores when the New Albany Shale is within the oil and gas windows.
© 2019 Elsevier B.V. All rights reserved.
Keywords:Organic matterDevonian black shalesSequence stratigraphyPaleoproductivityClastic supplyBottom-water redox condition
1. Introduction
Organicmatter (OM) richness, type, and thermalmaturity are key pa-rameters used in the evaluation of conventional and unconventional pe-troleum systems (Tissot and Welte, 1984; Peters and Cassa, 1994; Jarvie,2012a, 2012b; Hackley and Cardott, 2016). The total organic carbon(TOC) content in source rocks determines the quantity of generated pe-troleum and the type of kerogen controls the type of generated hydrocar-bons (Tissot andWelte, 1984). OM-hosted pores play a significant role inoil and gas storage and migration in unconventional petroleum systemsbecause of their large specific surface area and organic affinity (Passeyet al., 2010; Schieber, 2010; Loucks et al., 2012; Liu et al., 2017). However,most organic pores are b1000 nm (Wang et al., 2009; Schieber, 2010;Loucks et al., 2012) and contribute differently in shale oil vs shale gas
systems because of the difference in fluid properties of oil vs gas (Jarvie,2012a, 2012b; Bohacs et al., 2013). OM content in source rocks is not uni-formly distributed stratigraphically or spatially (Creaney and Passey,1993; Slatt and Rodriguez, 2012; Dong et al., 2017), and OM is not homo-geneous in composition, but is composed of amixture of organicmacerals(e.g., Robl et al., 1992; Stasiuk and Fowler, 2004; Mastalerz et al., 2012,2013; Hackley and Cardott, 2016; Liu et al., 2017, 2019; Abarghani et al.,2018; Harris et al., 2018; Ponsaing et al., 2018). Therefore, documentingTOCdistribution andorganicmaceral variation in a sequence stratigraphiccontext is of great significance for the evaluation of conventional sourcerocks and unconventional shale oil/gas resources.
Primary controls on OM accumulation in marine sediments includepaleoproductivity, preservation conditions (bottom-water redox condi-tions), clastic supply, as well as sedimentation rate (Sageman et al.,2003; Rimmer et al., 2004; Bohacs et al., 2005, 2013). Sedimentationrate can affect preservation conditions of OM and tie accumulation oforganic-rich mudstones to a sequence stratigraphic framework

102 B. Liu et al. / Sedimentary Geology 383 (2019) 101–120
(Schwalbach and Bohacs, 1992; Bohacs et al., 2005). Cyclic fluctuationsof relative sea level affect accommodation, water depth, and nutrientsupply, and influence the parameters that control the deposition oforganic-rich sediments (Creaney and Passey, 1993; Sageman et al.,2003; Slatt and Rodriguez, 2012; Dong et al., 2017; Byun et al., 2018).In general, when sea level rises, detrital input and oxygen content inbottom water decrease, and in combination they result in sediment-starved conditions and OM accumulation. In contrast, when sea leveldrops, increased clastic supply and better oxygenation of bottomwater result in enhanced microbial degradation of OM and the deposi-tion of bioturbated organic-poor strata. Previous studies have reportedthat shales deposited in transgressive systems tracts (TSTs) have beenfound to be more enriched in OM than shales deposited in highstandsystems tracts (HSTs) (Lazar, 2007; Slatt and Rodriguez, 2012; Donget al., 2017).
OM in petroleum source rocks can be classified into four types of ker-ogens on the basis of H/C versus O/C ratios (Tissot et al., 1974; Petersand Cassa, 1994). However, examining them with a reflected-light mi-croscope reveals added complexity through the recognition of a varietyof organic macerals which have different sources and formation pro-cesses (Peters and Cassa, 1994; Taylor et al., 1998). Stratigraphic varia-tion of OM type has been previously studied in black shale successions(Pasley et al., 1991; Gregory and Hart, 1992; Robison et al., 1996;Bialkowski et al., 2000; Schieber, 2001; Harris et al., 2018). For example,the stratigraphic variability of the distribution of organic macerals is il-lustrated by the observation that in the New Albany Shale and Chatta-nooga Shale, alginite derived from Tasmanites cysts is concentrated atmaximum flooding surfaces (MFSs) (Schieber, 2001; Lazar, 2007).
The Upper Devonian New Albany Shale of the Illinois Basin is anorganic-rich formation with TOC contents ranging from b1% to 20%(Chou et al., 1991), and its thermal maturity ranges from vitrinite reflec-tance (Ro) 0.5% near the basin margin to 1.5% at Hicks Dome, Illinois(Strąpoć et al., 2010; Mastalerz et al., 2013). Although geochemically OMin the New Albany Shale is classified as type II kerogen on the basis ofRock-Eval pyrolysis (Chou et al., 1991; Akar et al., 2015), it is nonethelesscomposed of varying organic macerals including amorphous organic mat-ter (AOM), alginite, liptodetrinite, vitrinite, inertinite, and solid bitumen(SB) when examined with a reflected-light microscope (Mastalerz et al.,2012, 2013; Wei et al., 2016; Liu et al., 2017, 2019). Commercial oil andgas production from the New Albany Shale has been reported where ithas oil-windowmaturity (Hamilton-Smith et al., 1994;Nuttall et al., 2015).
Lazar (2007) studied the controls of paleo-redox conditions,paleoproductivity, and clastic dilution on organic matter accumulationin each unit of the New Albany Shale. Because Lazar (2007) only hadTOC contents available, he operated under the assumption of uniformmarine OM, although he noted that petrographic examination of theserocks shows considerable variability in the relative abundances of or-ganic macerals (also pointed out by Mastalerz et al. (2012, 2013) andLiu et al. (2017, 2019)) and that quantitative information on their abun-dances could affect the conclusions reached in his study. This studybuilds on the earlier work of Lazar (2007) and adds to the data setwith more detailed information on the stratigraphic variation of TOCcontent, and augments it with newly acquired data on the types andproportions of organic macerals. The goal of this investigation is to un-derstand the controls on TOC content from a perspective of organicmaceral accumulation in the sequence stratigraphic context of theUpper Devonian New Albany Shale of the Illinois Basin. Specific objec-tives are to: (1) document TOC content distribution in greater detail;(2) reevaluate the influence of relative sea-level fluctuations onpaleoproductivity, clastic supply, bottom-water redox conditions, andtheir combined control onOMaccumulation; and (3) examine the strat-igraphic variability of organic macerals (AOM, alginite, vitrinite, andinertinite) within the New Albany Shale. Results of this study shouldallow for more sophisticated assessment of OM accumulation in time-equivalent Upper Devonian black shales deposited in adjacent epiconti-nental basins such as the Ohio Shale of the central Appalachian Basin,
the Antrim Shale of the Michigan Basin, the Chattanooga Shale of thesouthern Appalachian Basin, and the Bakken Shale of the WillistonBasin (Schieber, 1998; Schieber and Lazar, 2004).
2. Geological background
The Upper Devonian New Albany Shale of the Illinois Basin was de-posited in an epicontinental sea during the late Devonian (Lineback,1964, 1968; Beier and Hayes, 1989). It unconformably overlies theMid-dle Devonian North Vernon Limestone and underlies the Falling RunBed, a phosphatic lag deposit (Campbell, 1946). Where the Falling RunBed is absent, it is unconformably overlain by the early MississippianUnderwood, Henryville, and Jacobs Chapel Beds, or directly overlainby the Mississippian Rockford Limestone or the Mississippian NewProvidence Shale if these beds are absent (Campbell, 1946; Lineback,1964, 1968). The NewAlbany Shale is composed of the Blocher, Selmier,Morgan Trail, Camp Run, and Clegg Creek Member in ascending order(Lineback, 1964, 1968). Lithologically, the New Albany Shale is com-posed of black laminated to banded shales and greenish-gray, biotur-bated shales (Lineback, 1964, 1968; Lazar, 2007).
A complete NewAlbany Shale core of 39.43m thickness thatwas de-scribed by Lazar (2007) for a sequence stratigraphic study, has been fur-ther examined and analyzed in order to study the distribution of TOCand organic macerals within a sequence stratigraphic context. Thecore is from Daviess County, Indiana (Fig. 1) with a coordinate of X =494,611, Y = 4,276,705 (North American Datum 83; Lazar, 2007). Thecore (1–3 Kavanaugh) was drilled by Deka Exploration Inc. in 1994.OM in this core indicates a thermal maturity of 0.55% Ro. Being margin-ally mature, OM in this core has not undergone significant thermaltransformation, although early diagenesis could to some degree alterOM through chemical and microbial degradation (Curtis, 1980; Tissotand Welte, 1984).
Using the conceptual framework of Schieber (1998) and Schieberand Lazar (2004), the studied New Albany Shale core can be dividedinto four basin-wide depositional sequences based on integration ofsedimentological, paleontological, geophysical, and geochemical data(Fig. 2) (Lazar, 2007). Within those sequences, we identified six majorlithofacies based on sedimentological (color, lamination, and banding)and ichnological (bioturbation intensity) characteristics: (1) black lam-inated to banded carbonate-bearing shale, (2) black laminated tobanded shale, (3) black to brownish laminated shale with abundantlag deposits, (4) black-gray cyclic shale, (5) black massive to bandedshale with interbedded gray bioturbated shale, and (6) black massiveto banded shale (Fig. 3).
The black laminated to banded carbonate-bearing shale lithofacies(Figs. 2, 3A) is limited to unit 1TST (TST of sequence 1) with varyingcontent of carbonateminerals (calcite and dolomite) and a bioturbationindex (BI) of 0–1. The laminae are mainly composed of silt-sized quartzand recycled dolomite (Fig. 4) and formed through intermittentreworking of bottom sediments by storms and waves whichwinnowedthe seabed and removed the fine-grained fraction (e.g., clay mineralsand clay-sized particles). The black laminated to banded shalelithofacies (Figs. 2, 3B) is most common in units 1HST (BI = 0–2) and3TST (BI = 0–1). The black to brownish laminated shale with abundantlag deposits (Figs. 2, 3C) is themajor lithofacies in units 2LST (lowstandsystems tract, BI= 0–1) and 4LST (BI= 0–2). Laminae and lag deposits,which can be cm-thick, formed via intensive reworking of bottom sed-iments by strong storms and waves (Schieber, 1998). The brownishcolor is due to an abundance of pyrite and Tasmanitesmicrofossils, uni-cellular green algae that belong to the class Prasinophyceae (Tappan,1980). The black-gray cyclic shale lithofacies (Figs. 2, 3D) occurs in theupper half of unit 2TST (BI = 2–4) and the entire 2HST (BI = 3–4).The formation of these black-gray cyclic shales has been interpreted toreflect alternation of anoxic and oxic environments resulting fromfluctuations of relative sea level (Calvert et al., 1996). As such theblack-gray cycles most likely represent distal parasequences (Schieber,

Fig. 1. Map showing the location of the drill core and the extent of the New Albany Shale. Vitrinite reflectance isolines are from Mastalerz et al. (2013).
103B. Liu et al. / Sedimentary Geology 383 (2019) 101–120
1998) that reflect a high-frequency interplay of sediment buildup(shallowing) and intermittent small increases of sea level (deepening)as detailed by Spencer (2013). The black massive to banded shale withinterbedded gray bioturbated shale lithofacies (Figs. 2, 3E−F) is re-stricted to unit 3HST (BI = 0–2). Gray bioturbated beds are organic-poor beds. The black massive to banded shale lithofacies (Figs. 2, 3G)is common in units 4TST (BI = 0–1) and 4HST (BI = 0–1). Generally,shales deposited in HSTs are more intensively bioturbated than thosein TSTs within a given depositional sequence.
3. Analytical methods
Portable x-ray fluorescence (pXRF) instrumentation can providerapid, non-destructive, and quantitative geochemical analysis of mud-stone samples (Rowe et al., 2012). Major and trace elements in 482samples were measured on the core at a spacing of approximately8 cm with a pXRF analyzer (Thermo Niton XL3t GOLDD+) at theIndiana Geological and Water Survey. The measurements were carriedout in situ on the cleaned surfaces of core slabs and conducted on around area with a diameter of 11 mm. The pXRF analyzer was run in“Test All Geo” mode for 75 s. Three USGS certified reference materials(one carbonatite and two shale: COQ-1, SDO-1, and SBC-1) were ana-lyzed at the beginning and end of each analytical session to examinethe accuracy and precision of the analyses (McLaughlin et al., 2016). Inthis study, the analysis errors for major elements silicon (Si), aluminum(Al), titanium (Ti), phosphorus (P) are 0.78%, 2.88%, 3.27%, and 8.49%,
respectively. Errors for trace elements molybdenum (Mo), nickel (Ni),vanadium (V), U, thorium (Th), and cobalt (Co) are 13.24%, 21.24%,23.31%, 34.71%, 38.43%, and 43.17%, respectively, which are muchhigher than those of major elements.
Because portable XRF spectrometers have a lower detection accu-racy than high-energy XRF spectrometers, contents of elements Si, Al,Ti, P, U, Mo, V, Ni, Th, and Co obtained with pXRF analyzer were cali-brated with 44 previously analyzed New Albany Shale samples fromLazar (2007) (Supplementary Fig. 1). Major elements Si, Al, and Ti andtrace elements U, V, and Mo exhibit high regression coefficients of de-termination (R2 N 0.7), whereas coefficients of determination for P andtrace elements Ni, Th, and Co are relatively low (SupplementaryFig. 1). Although accuracy is low, trace element ratio profiles can still in-dicate stratigraphic trends of paleo-redox conditions. Because U is com-monly associatedwith OM inmarine shales (Swanson, 1960; Leventhal,1981; Fertl and Chilingar, 1988; Bohacs and Schwalbach, 1994; Lüningand Kolonic, 2003), the TOC content of the 482 samples was calculatedbased on the relationship between TOC and U content (Eq. (1))established with 43 previously analyzed New Albany Shale samples(Lazar, 2007). This relationship is very similar to the results of Fertland Chilingar (1988) (Fig. 5).
TOC wt%ð Þ ¼ 4:18 lnU ppmð Þ−6:26 ð1Þ
The TOC content of seventeen sampleswasmeasured using a LECO el-emental analyzer (SC832DR). The seventeen samples were selected to

Fig. 2. Sequence stratigraphic framework of the New Albany Shale.Modified from Lazar (2007).
104 B. Liu et al. / Sedimentary Geology 383 (2019) 101–120
supplement the forty-four measurements of Lazar (2007) from the samecore and to cover the unmeasured intervals. During the TOC measure-ments, 0.25 g powdered samples were acidified to remove carbonateminerals and then combusted in the LECO elemental analyzer. Theamounts of generated CO2 were converted to organic C content in sam-ples. A duplicate sample was measured to ensure the accuracy of mea-surements. Of the 61 samples (17 in this study and 44 from Lazar(2007))with TOC contents, thirty-three sampleswere taken fromten sys-tems tracts in four depositional sequences for organic petrographic study.Vitrinite reflectance of shale samples was measured on polished whole-rock pellets using a Zeiss RS-III microscope with 50 measurements.
Semi-quantitative organic petrographic compositions (AOM, alginite,liptodetrinite, vitrinite inertinite, and SB) of shale samples were deter-mined via point-counting (500 points counted only on OM). Themaceralgroups vitrinite and inertinite were not classified into macerals becauseof their scarcity. The liptinite group includes AOM, alginite, andliptodetrinite because they are dominant oil-prone macerals in the NewAlbany Shale (Liu et al., 2017, 2019) and marine black shales in general(Mastalerz et al., 2018). Organic macerals were identified andphotographed using a reflected-light microscope (Leica DFC310 FX) inreflected white light (for occurrence, color, and morphology) and bluelight (for fluorescence properties) with oil immersion. A field emissionscanning electronmicroscope (FEI Quanta 400 FEG)was used to examineshale composition and AOM using a correlative microscopy approach(reflected-light and SEMmicroscopy). Themethods of correlativemicros-copy have been presented in Liu et al. (2017).
4. Results
4.1. Stratigraphic variation of TOC content
The TOC content of the New Albany Shale measured in this studyranges from 0.18% to 16.29%, with an average content of 6.53% (Fig. 6).Samples with the same lithofacies and next to each other show highvariations of TOC content (e.g., at 630.75m; Fig. 6), suggesting high het-erogeneity of organic richness in black shales. The Clegg Creek Member(sequence 4) exhibits the highest TOC content (average TOC content8.22%) in the New Albany Shale. Within a given depositional sequence,TOC content increases in the TST, reaches a maximum before getting tothe MFS, and maintains relatively low values during the HST (Fig. 6).Stratigraphically, the TOC profile displays a very similar trend to thegamma-ray profile except in the Blocher Member (Fig. 6).
Calculated TOC contentwith Eq. (1) ranges from0 to 12.53%, with anaverage content of 6.45%, which is very close to the measured averageTOC content of 6.53%. The calculated TOC profile is very similar to themeasured TOC profile and closely matches the gamma-ray profile(Fig. 6), suggesting that U is the main contributor to gamma radiationin the New Albany Shale. As with the trend of measured TOC in the se-quence stratigraphic context, calculated TOC content increases in theTST, reaches a maximum before getting to the MFS, and maintains rela-tively low values during the HST with the exception of the BlocherMember (Fig. 6). Similar to the gamma-ray profile, the calculated TOCcontent is relatively constant in the Blocher Member (Fig. 6).
4.2. Paleoproductivity
Even though the New Albany Shale is characterized by high clay con-tent (Mastalerz et al., 2013), there is a significant contribution of biogenicsilica (Schieber, 1996; Schieber et al., 2000). Biogenic silica in the NewAlbany Shale is primarily sourced from radiolaria, planktonic organismswith an opaline test (Schieber, 1996; Schieber et al., 2000). High biogenicsilica content (Sibio) typically indicates high paleoproductivity (Ross andBustin, 2009), and for this study Sibio contentwas calculated using the fol-lowing formula (Eq. (2); Ross and Bustin, 2009):
Sibio ¼ Sisample− Si : Alð Þbackground � Alsample
h ið2Þ
A Si:Al ratio of 2.55 is used as the background value, which is thelowest Si:Al ratio (at 623.90 m) in the New Albany Shale. This intervalis gray bioturbated shale and is mainly composed of detrital compo-nents, such as clay minerals (mostly illite), silt-sized quartz, dolomite,albite, potassium (K)-feldspar and minor pyrite, muscovite, and biotite(Fig. 7). Biogenic silica is very rare to absent in this interval. A back-ground Si:Al ratio of 3.11 (Wedepohl, 1971) has been used inmany pre-vious studies (Ross and Bustin, 2009; Dong et al., 2017; Zhao et al., 2017;Harris et al., 2018), but at that ratio, a large number of samples would

Fig. 3. Images of scanned core slabs showing major lithofacies in the New Albany Shale. (A) Black laminated to banded carbonate-bearing shale. (B) Black laminated to banded shale.(C) Black laminated shale. (D) Black-gray cyclic shale. (E) Black massive shale. (F) Black massive to banded shale with interbedded gray bioturbated shale. Note the Zoophycos burrowin the center. (G) Black massive to banded shale. Z = Zoophycos.
105B. Liu et al. / Sedimentary Geology 383 (2019) 101–120
have negative Sibio content. Because that is implausible, a backgroundSi:Al ratio of 3.11 is considered too high for the New Albany Shale. Like-wise, Harris et al. (2018) reported that a background Si:Al ratio of 3.11would result in negative values for calculated biogenic silica in theUpper Devonian Duvernay Formation (Western Canada SedimentaryBasin). Given that the background Si:Al ratio of 3.11 is based on an aver-age composition that includes data from a large number of shales acrossthe globe and without differentiation of biogenic vs detrital sources ofSiO2 (Wedepohl, 1971), universal application of a Si:Al backgroundratio of 3.11 should be discouraged. As shown in this study, a plausibleminimum Si:Al ratio that is intrinsic to a given stratigraphic intervalcan be derived and should help a more realistic assessment of biogenicsilica inputs.
In the studied core, total Si content ranges from 4.07 to 38.90%(average 25.52%), out of which 0 to 35.14% (average 6.01%) is calculatedas of biogenic origin, suggesting that 24% of total Si is biogenic. Sequence4 has the highest biogenic Si content (average Sibio 9.51%) in the NewAlbany Shale (Fig. 6). The highest Sibio (35.14%) content occurs neartheMFS of sequence 4, accounting for 90% of total Si.Within a given de-positional sequence, Sibio content increases in the TST, reaches a maxi-mum at the MFS, and decreases in the HST (Fig. 6).
Phosphorus is an essential nutrient formarine phytoplankton and allorganisms in general (Schoepfer et al., 2015), and its content in marinesediments can be related to surface ocean productivity (Schenau et al.,2005). P content in the New Albany Shale core is relatively constant(close to 0.04%). P content in the Clegg CreekMember (average content

Fig. 4. Photomicrographs of silty laminae in theNewAlbany Shale. The laminae are composed of silt-sized quartz (yellow arrows) and recycled dolomite (red arrows). (A) Plane-polarizedlight; (B) cross-polarized light. (For interpretation of the references to color in this figure legend, the reader is referred to the web version of this article.)
106 B. Liu et al. / Sedimentary Geology 383 (2019) 101–120
0.06%), however, is higher than in the rest of the core (average content0.03%). The high P content at the bottom of unit 4LST results from theenrichment of reworked conodont fragments. The P profile shows asimilar distribution pattern to the Sibio profile, but the P content maxi-mum at the MFS is not as clear as in the case of Sibio (Fig. 6).
4.3. Clastic supply
Al is abundant in aluminosilicates such as clay minerals and feld-spars, and Ti is contained in heavy minerals such as rutile (Brumsack,2006). Al and Ti are chemically conservative during diagenesis(Brumsack, 2006) and have been used to serve as proxies for clastic sup-ply (Sageman et al., 2003; Rimmer et al., 2004; Dong et al., 2017).
Al and Ti contents range from 0 to 10.20% (average 7.65%) and 0 to0.56% (average 0.41%), respectively. Stratigraphically, Al and Ti contentsdisplay the same trend, and show an opposite distribution pattern com-pared to the Sibio profile, with Al and Ti content at a minimum (but Sibiomaximum) at theMFS (Fig. 6).Within a given depositional sequence, Aland Ti contents decrease in the TST, reach a minimum at the MFS, andincrease in the HST, with the exception of the Blocher Member (Fig. 6).
Fig. 5. Correlation between TOC and U content in the New Albany Shale and an empiricalrelationship between TOC and U content from Fertl and Chilingar (1988). TOC and U dataof the New Albany Shale are from Lazar (2007).
4.4. Bottom-water redox conditions
There is a variety of trace element-based geochemical proxies thathave been suggested as indicators of relative oxygenation of bottomwa-ters (e.g., Adams and Weaver, 1958; Hatch and Leventhal, 1992; Jonesand Manning, 1994; Rimmer et al., 2004). These proxies, however,may provide contradictory results, and should not be applied rigidly(Rimmer, 2004; Rimmer et al., 2004; Lazar, 2007; Ocubalidet et al.,2018). Instead, they are best used as relative indicators of levels andtrends of bottom-water oxygenation (Rimmer, 2004; Rimmer et al.,2004).
U(UO2(CO3)34−) is soluble in seawater, but it will be converted to theless soluble U(UO2, U3O7, or U3O8) in reducing environments (Langmuir,1978; Anderson et al., 1989; Klinkhammer and Palmer, 1991; Algeo andTribovillard, 2009; Cumberland et al., 2016). U(IV,+4 oxidation state) oc-curs inmarine OM as either U dioxide (UO2) in an absorbed state or as U-OM compounds (Swanson, 1960; Cumberland et al., 2016). Th is typicallyassociatedwith heavyminerals and is relatively immobile during diagen-esis (Adams and Weaver, 1958). Therefore, high U/Th ratios of marinesediments are generally thought to indicate oxygen-deficient conditions(Adams and Weaver, 1958; Jones and Manning, 1994).
In this study, the U/Th ratio profile closely matches the calculatedTOC profile (Fig. 6). Stratigraphically, the U/Th ratio increases in theTST, reaches a maximum before the MFS, and maintains relatively lowvalues during the HST. Most of the U/Th ratio values are higher than0.75, which may indicate dysoxic to anoxic environments (Tyson andPearson, 1991; Jones and Manning, 1994) (Fig. 6).
Enrichment factors (EF) have been used to evaluate the enrichment oftrace metals in organic-rich shales relative to average shales (Brumsack,2006; Tribovillard et al., 2006, 2012; Algeo and Tribovillard, 2009). EFare calculated as (Eq. (3)):
XEF ¼ X : Alð Þsample= X : Alð Þaverage shale
h ið3Þ
where X and Al represent the concentrations of elements X and Al, re-spectively. Samples were normalized using the post-Archean averageshale (PAAS) composition (Taylor and McLennan, 1985).
UEF ranges from to 0 to 50.08, with an average value of 11.26, sug-gesting a common anoxic environment (Algeo and Tribovillard, 2009;Tribovillard et al., 2012) during the deposition of the New AlbanyShale. UEF with values of 0 probably results from the relatively high de-tection limit of pXRF analyzer (sampleswith lowU contentwere not de-tected). Stratigraphically, the UEF profile displays the same distributionpattern as the U/Th profile (Fig. 6).
V and Ni are preferentially concentrated in tetrapyrrole compoundsunder anoxic conditions (Lewan and Maynard, 1982), and V/(V + Ni)ratios from whole-rock analyses have been used to indicate

Fig. 6. Stratigraphic distribution of lithofacies and profiles of gamma-ray log, total organic carbon (TOC) content, and geochemical proxies of paleoproductivity, clastic supply, and bottom-water redox conditions of theNewAlbany Shale in the studiedcore. Proposed threshold values for the degree of bottom-water oxygenation are from Tyson and Pearson (1991); Hatch and Leventhal (1992); Jones and Manning (1994); Algeo and Tribovillard, 2009. LST = lowstand systems tract; TST =transgressive systems tract; HST = highstand systems tract; MFS = maximum flooding surface; O = oxic; D = dysoxic; A = anoxic. aSequence stratigraphic context of the New Albany Shale is modified from Lazar (2007). bMeasured TOCcontent of 17 samples in this study and 44 samples from Lazar (2007). cTOC content calculated from U content. pXRF data can be found in Supplementary data sets.
107B.Liu
etal./Sedimentary
Geology
383(2019)
101–120

Fig. 7. SEM images (backscattered electron image) of shale samplewith a Si:Al ratio of 2.55 at 623.90m. The sample is composed of clayminerals (mostly illite), silt-sized quartz, dolomite,albite, K-feldspar and minor pyrite, muscovite, and biotite. Panel B is the close-up view of the red dashed framed area in panel A. Qtz = quartz; Dol = dolomite; Ab = albite; Kfs = K-feldspar; Py= pyrite; Bt= biotite;Ms. =muscovite; Ill = illite. (For interpretation of the references to color in this figure legend, the reader is referred to theweb version of this article.)
108 B. Liu et al. / Sedimentary Geology 383 (2019) 101–120
environmental conditions at the time of deposition (Hatch andLeventhal, 1992). For the studied interval, the V/(V + Ni) ratio doesnot show significant variations stratigraphically, and is generally higherthan 0.46, suggesting dysoxic to anoxic conditions (Tyson and Pearson,1991; Hatch and Leventhal, 1992) (Fig. 6).
Co is strongly determined by the abundance of clastic materials(Tribovillard et al., 2006), and the Ni/Co ratio of mudstones has beenused to indicate oxygenation conditions (Jones and Manning, 1994).Similar to the V/(V+Ni) ratio, the Ni/Co ratio does not show significantvariations stratigraphically (Fig. 6). Across the studied core, the Ni/Coratio is typically lower than 7.00, which would suggest dysoxic to oxicconditions (Tyson and Pearson, 1991; Jones and Manning, 1994)(Fig. 6).
Mo tends to be enriched in marine sediments under anoxic condi-tions (Calvert and Pedersen, 1993; Algeo and Lyons, 2006; Tribovillardet al., 2006). Mo content is generally normalized to Al content to com-pensate for the dilution of biogenic minerals (common diluents are cal-cium carbonate and biogenic silica; Tribovillard et al., 2006), and thisnormalized Mo content has in the past been proposed as an indicatorof paleo-redox conditions of marine black shales (Rimmer et al.,2004). In this study, the Mo/Al ratio and the U/Th ratio display similardistribution patterns stratigraphically except in sequence 4, where theMo/Al ratio reaches a maximum at the MFS (Fig. 6). Covariation of Uand Mo has been reported in modern and paleo- marine systems(Algeo and Tribovillard, 2009; Tribovillard et al., 2012). No thresholdvalues have been proposed to define paleo-redox conditions based onthe Mo/Al ratio. MoEF ranges from to 0 to 283.17, with an averagevalue of 69.85.Mo/Al ratio andMoEF show exactly the same distributionpattern (Fig. 6) because MoEF is normalized with Al content.
4.5. Organic maceral variation
Organic macerals are microscopically recognizable individual con-stituents of OM (Stach et al., 1982; Taylor et al., 1998). Organicmaceralsobserved in this study include AOM, alginite, liptodetrinite, vitrinite,inertinite, and SB (Fig. 8). In marine organic-rich shales, AOM andalginite are of marine origin (Kus et al., 2017), whereas vitrinite andinertinite are derived from terrestrial woody materials (Stach et al.,1982; Taylor et al., 1998). AOM, derived frommicrobially degraded phy-toplankton, zooplankton, and bacterial biomass, refers to structurelessOM in coals and organic-rich shales (Teichmüller, 1989; Taylor et al.,
1998; Pacton et al., 2011; Kus et al., 2017). AOM commonly has smallmineral inclusions, such as clay minerals and clay-sized particles(e.g., quartz, feldspar, and pyrite), suggesting its degradation origin(Fig. 9). Alginite in the New Albany Shale is mainly in the form ofTasmanites cysts (Fig. 8). Liptodetrinite occurs as small fluorescencingOM particles (Fig. 8E), and is likely of algal origin. SB is secondary OMgenerated from primary oil-prone macerals (Jacob, 1989; Mastalerzet al., 2018), such as AOM and alginite (Liu et al., 2019). A detailed pet-rographic study of OM in the New Albany Shale was presented in Liuet al. (2017, 2019).
OM in the New Albany Shale is dominated by either AOM or alginite(Table 1). The terrestrial OM (vitrinite + inertinite) content is b10%(Table 1). Vitrinite content is typically lower than inertinite content(Table 1) because inertinite is chemically inert and vitrinite is possiblypartially oxidized during transport to the place of deposition (Weiet al., 2016; Liu et al., 2019). Because this core is at the early maturestage (0.55% Ro), relatively low but varying contents of SB were ob-served (Table 1). This SB likely results from thermal degradation of la-bile OM (Liu et al., 2019).
The organic petrographic composition of the New Albany Shalevaries stratigraphically (Fig. 10). AOM dominates except in the unit1HST, the Selmier Member (sequence 2), the unit 3TST, and the unit4LST (Table 1; Fig. 10). Within sequences 1, 2, and 4, AOM content in-creases in the TST, reaches a maximum near the MFS, and decreases inthe HST (Fig. 10). There is a slight decrease of AOM content at the MFS(Fig. 10). Because OM is dominated by alginite in the Selmier Member,the stratigraphic distribution pattern of AOM content is not as obviousas in sequence 1 and 4 (Fig. 10). Compared to other sequences, sequence3 does not show an AOM content maximum near the MFS, but withinthe middle of the HST (Fig. 10). In contrast to AOM, alginite displaysan opposite pattern stratigraphically (Fig. 10). Alginite can be enrichedin certain intervals of the studied core. For example, alginite accountsfor 83.1% of total OM in sample NAS-15, whereas samples above andbelow it are dominated by AOM (Table 1; Figs. 10, 11). Terrestrial OM(vitrinite + inertinite) content is relatively constant (~2.5% of totalOM) throughout most of the studied core except at the top where ter-restrial OM accounts for 6–10% of total OM (Table 1; Figs. 10, 12).Ripley et al. (1990) also reported a high abundance of terrestrial OM(6–14%)within the upper part of the Clegg CreekMember. The increaseof terrestrial OM at the top of the New Albany Shale is accompanied byincreasing Al and Ti contents (Figs. 6, 10).

Fig. 8. Photomicrographs of organic macerals in reflected white light and oil immersion (A–C, F–H) and in fluorescence mode (D–E) in the New Albany Shale in the studied core. (A–B)Amorphous organic matter. AOM occurs as organic streaks. (C) Alginite in the form of Tasmanites cysts. The algal cysts are compacted. (D) The same field of panel C in fluorescencemode.Alginite shows greenish-yellow fluorescence at this maturity. (E) Liptodetrinite and alginite in fluorescence mode. (F–G) Vitrinite and inertinite occurring as dispersed particles in thematrix. Inertinite in panel G shows cellular structure (red arrows). (H) Solid bitumen. Note the embayments against mineral particles. AOM = amorphous organic matter; AL =alginite; LPD = liptodetrinite; V = vitrinite; I = inertinite; SB = solid bitumen. (For interpretation of the references to color in this figure legend, the reader is referred to the webversion of this article.)
109B. Liu et al. / Sedimentary Geology 383 (2019) 101–120

Fig. 9. Photomicrographs of AOM in the NewAlbany Shale in reflected white light and oil immersion (A) and its correlative SEM images (B, backscattered electron image; C–D, secondaryelectron images). AOM = amorphous organic matter; AL = alginite; Py = pyrite; Qtz = quartz; CSP = clay-sized particle.
110 B. Liu et al. / Sedimentary Geology 383 (2019) 101–120
5. Discussion
5.1. Paleoproductivity
OM preserved in marine sediments comes mainly from primary pro-duction of phytoplankton in the ocean (e.g., Müller and Suess, 1979;Schoepfer et al., 2015), togetherwith a component of terrestrial OM sup-plied from adjacent land (e.g., Goñi et al., 1997; Hedges et al., 1997;Opsahl and Benner, 1997; Ponsaing et al., 2018). High paleoproductivityis favorable for enhanced OM burial (Pedersen and Calvert, 1990;Schoepfer et al., 2015). Biogenic silica content is considered a usefulproxy for paleoproductivity (Ross and Bustin, 2009). Zhao et al. (2017)reported a positive correlation between TOC and excess (biogenic) silicacontent in the Wufeng and Longmaxi Formations of the Sichuan Basin(China). In this study, the Clegg Creek Member has the highest averageSibio content (9.51%), P content (0.06%), and TOC content (8.22%) in theNew Albany Shale (Fig. 6). High paleoproductivity could be one reasonfor high TOC content in the Clegg Creek Member, an assumption that issupported by the common presence of early diagenetic silica, derivedfrom the dissolution of radiolaria (Schieber, 1996; Schieber et al.,2000), in Tasmanites cysts and microcrystalline quartz in the matrix insequence 4 (Fig. 13). However, when abundant biogenic silica contrib-utes to the shale composition, it can lower OM content in shales(Figs. 6, 13). Bohacs et al. (2005) and Passey et al. (2010) also suggested
that primary productivitymight have a dual impact onOMaccumulationin organic-rich sediments, with organic‑carbon-rich organisms enhanc-ing OMcontent, but siliceous and calcareous organisms diluting OMcon-tent in sediments.
The stratigraphic distribution pattern of Sibio content (Fig. 6) suggestsincreasing paleoproductivity in the TST and decreasing paleoproductivityin the HST. Lash and Blood (2011) and Dong et al. (2017) reported ele-vated diagenetic silica during the deposition of TSTs in the Devonian gasshales of the Appalachian Basin (USA) and the Middle and Upper Devo-nian Horn River Group of the Horn River Basin (Canada), respectively.The stratigraphic distribution pattern of Sibio content, however, can alter-natively be explained by decreasing clastic supply in the TST and increas-ing clastic supply in the HST (Fig. 6) with paleoproductivity held stablethroughout a given sequence. Stratigraphically, the Sibio profile displaysan opposite distributionpattern relative toAl and Ti,with the Sibio contentmaximum coinciding with the Al and Ti content minimum at MFSs(Fig. 6). Therefore, Sibio variation in the New Albany Shale may not somuch indicate paleoproductivity, but rather reflect changes of dilutionby clastic materials (Fig. 6).
Mass flux of organic carbon per unit area (in g cm−2 kyr−1) is a betterway to represent the surface ocean productivity at the time of depositionof organic-rich sediments if a high-resolution chronostratigraphic frame-work is available (Algeo et al., 2011, 2013; Schoepfer et al., 2015). How-ever, OM consumption during settling, early diagenesis, and thermal

Table 1Sample depth, measured total organic carbon (TOC) content, and organic petrographic composition of the New Albany Shale in the studied core.
Sample Depth (m) TOC (wt.%) Organic petrographic composition (volume %, on mineral-matter-free basis)
AOM Alginite Liptodetrinite Vitrinite Inertinite SB
NAS-1 610.50 14.87 44.3 40.0 2.5 1.1 8.2 3.9NAS-2 612.66 9.54 64.8 21.9 1.4 1.6 5.3 5.0NAS-3 613.94 9.57 53.5 38.4 2.7 1.0 1.5 2.9NAS-4 615.54 11.93 67.9 20.6 1.3 2.3 2.1 5.8NAS-5 616.46 10.81 59.5 32.5 2.1 1.0 1.1 3.8NAS-6 617.44 8.05 48.7 44.5 2.9 0.4 1.0 2.5NAS-7 619.00 1.11 57.5 34.8 2.1 1.3 1.0 3.3NAS-8 620.25 9.98 19.3 74.0 3.8 0.4 1.2 1.3NAS-9 621.87 2.48 40.6 51.7 2.7 1.1 1.1 2.8NAS-10 623.82 4.91 57.0 35.8 2.0 0.6 0.9 3.7NAS-11 624.64 4.74 68.4 25.3 1.7 0.8 0.8 3.0NAS-12 626.12 5.01 58.5 34.8 2.2 0.6 0.8 3.1NAS-13 628.54 4.98 73.5 18.3 1.3 0.6 0.7 5.6NAS-14 629.99 7.29 54.3 36.8 2.6 0.9 1.1 4.3NAS-15 630.73 16.29 11.0 83.1 4.1 0.2 0.2 1.4NAS-16 631.58 5.94 48.1 44.0 2.7 0.6 0.8 3.8NAS-17 632.64 7.31 33.2 58.8 4.0 0.4 0.8 2.8NAS-18 632.94 8.57 42.2 48.6 2.8 0.9 1.3 4.2NAS-19 633.70 8.09 26.0 67.4 3.4 0.4 0.7 2.1NAS-20 635.26 5.65 9.6 82.7 5.4 0.4 0.4 1.5NAS-21 636.86 3.61 21.0 71.0 3.9 0.7 1.2 2.2NAS-22 638.32 1.92 10.9 80.3 5.2 0.7 1.0 1.9NAS-23 639.36 5.32 22.0 71.0 4.1 0.4 0.6 1.9NAS-24 640.21 4.58 25.7 65.9 3.3 0.4 1.0 3.7NAS-25 640.64 8.62 21.6 69.6 4.2 0.7 1.5 2.4NAS-26 641.49 5.91 16.0 70.8 4.7 0.9 4.2 3.4NAS-27 643.10 5.82 19.8 70.6 4.4 0.6 2.0 2.6NAS-28 644.10 3.33 45.8 46.7 3.1 0.4 2.5 1.5NAS-29 644.80 6.59 32.5 57.6 3.7 0.9 2.7 2.6NAS-30 645.84 6.54 72.9 14.7 1.9 0.8 1.1 8.6NAS-31 646.97 8.37 70.0 15.1 2.4 0.8 3.7 8.0NAS-32 648.30 9.87 68.6 15.8 2.1 1.0 4.7 7.8NAS-33 648.83 6.76 64.6 27.8 2.1 0.2 1.5 3.8Average 7.10 43.3 47.6 3.0 0.8 1.8 3.6
AOM = amorphous organic matter; SB = solid bitumen.
111B. Liu et al. / Sedimentary Geology 383 (2019) 101–120
maturation has to be carefully considered when calculating the primaryproductivity of phytoplankton in the ocean (Bralower and Thierstein,1987; Raiswell and Berner, 1987; Tyson, 1995; Bohacs et al., 2005). Thecalculated primary productivity of OM during deposition of the NewAlbany Shale based on multiple sedimentologic, petrographic, and geo-chemical data, ranges from 10.1 to 952.4 mg C cm−2 kyr−1 with an aver-age value of 155.4 mg C cm−2 kyr−1 (Lazar, 2007). No stratigraphicdistribution pattern of primary productivity of OM exists in the New Al-bany Shale.
5.2. Clastic supply
Devonian clastics in the Illinois Basin were supplied from the east, theAcadian orogeny (Dickinson et al., 1983; Ettensohn, 2008; Schieber,2016). The sedimentation rate of the studied New Albany Shale intervalis extremely low (~ 0.24 cm/ka; Lazar, 2007). Relative sea-level fluctua-tions played a significant role in transporting detrital materials to the Illi-nois Basin. Generally speaking, detrital materials are restricted landwardduring transgressions and transported to the basin during regressions.The stratigraphic distribution patterns of Al and Ti contents (Fig. 6) sug-gest decreasing clastic supply in the TST and increasing clastic supply inthe HST. The TOC profile exhibits an opposite trend compared to the Aland Ti profiles (Fig. 6), which indicates that clastic supply is not favorablefor OM accumulation due to dilution. However, a too low clastic supplycan imply limited supply of nutrients (e.g., N, P, Si, and Fe) to the basin,which in turn can reduce paleoproductivity (Killops and Killops, 2005).In addition, low clastic supply limits the burial of OM by clastic materialsand thus keeps OMwithin the surficial zone of active microbial degrada-tion for longer time intervals (Bohacs et al., 2005). Therefore, similar topaleoproductivity, clastic supply has a dual impact on OM accumulationin marine organic-rich sediments. What is worth noting is that Al and Ti
contents (in %) may not represent the real flux of silisiclastic detritus be-cause of the dilution of biogenicminerals (Tribovillard et al., 2006). How-ever, Al and Ti contents correlate well with the sequence stratigraphicframework of the New Albany Shale (Fig. 6) proposed by Lazar (2007),and high Al and Ti contents typically indicate high sedimentation rateand possibly high detrital flux.
Al and Ti contents in the Blocher Member display a different patternfrom the other three sequences (Fig. 6), which show decreasing Al andTi contents in the TST and increasing Al and Ti contents in the HST withthe minimum at the MFS. The reason for this difference could be thatwhen sea level started to rise during the deposition of the BlocherMem-ber, clastic materials were not yet effectively delivered to the basin(Brett et al., 2004). The Blocher Member contains calcareous fossil frag-ments and recycled (clastic) dolomite, as shown by laminae composedof Tentaculites and recycled dolomite (Fig. 14), which are features un-common in the other three sequences.
5.3. Bottom-water redox conditions
The preservation potential of OM decreases in the presence of oxy-gen due to microbial degradation (Wignall, 1991). Nonetheless, OMcan still be preserved if paleoproductivity is high enough (Pedersenand Calvert, 1990). The stratigraphic distribution of redox-sensitivetrace element ratios suggests that paleo-redox conditions varied duringthe deposition of the New Albany Shale (Beier and Hayes, 1989; Lazar,2007; Ocubalidet et al., 2018) (Fig. 6). The U/Th and V/(V + Ni) ratiossuggest common dysoxic to anoxic conditions, whereas the Ni/Co ratiosuggests common dysoxic to oxic conditions (Fig. 6). Previous studieshave proposed that application of trace element ratios to indicatepaleo-redox conditions should be in a relative sense, rather than strictlyapplying proposed thresholds (Rimmer, 2004; Rimmer et al., 2004;
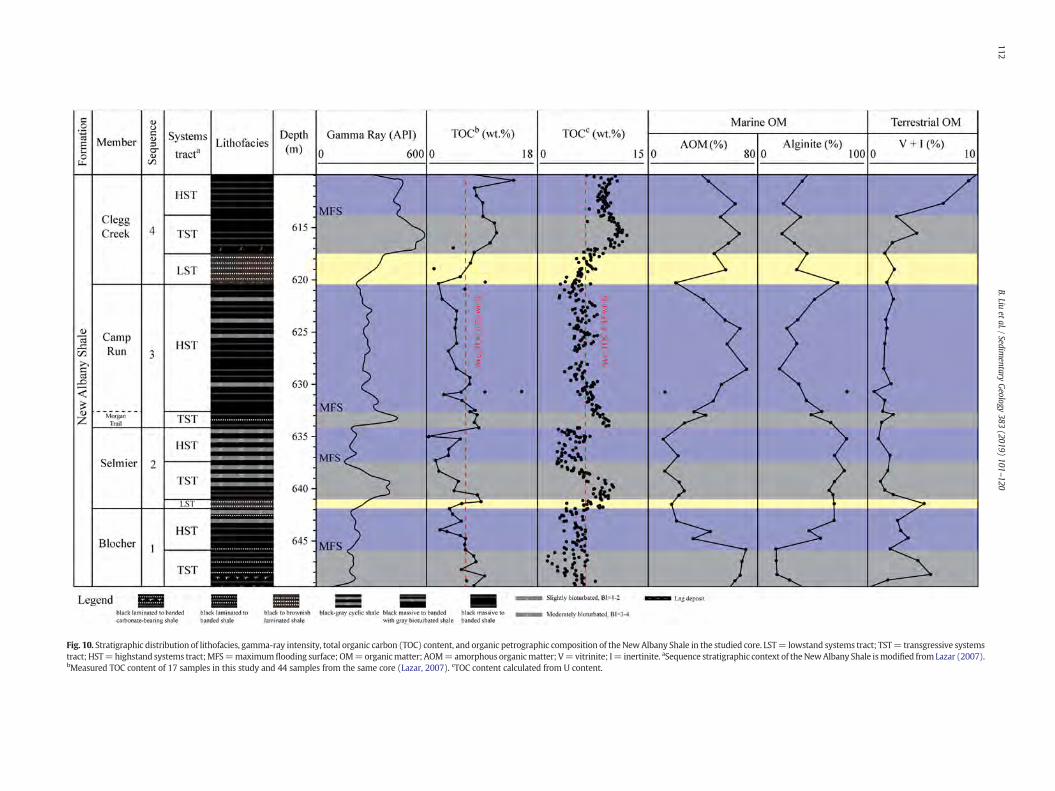
Fig. 10. Stratigraphic distribution of lithofacies, gamma-ray intensity, total organic carbon (TOC) content, and organic petrographic composition of theNewAlbany Shale in the studied core. LST= lowstand systems tract; TST= transgressive systemstract; HST=highstand systems tract;MFS=maximumflooding surface; OM=organicmatter; AOM=amorphous organicmatter; V=vitrinite; I= inertinite. aSequence stratigraphic context of theNewAlbany Shale ismodified fromLazar (2007).bMeasured TOC content of 17 samples in this study and 44 samples from the same core (Lazar, 2007). cTOC content calculated from U content.
112B.Liu
etal./Sedimentary
Geology
383(2019)
101–120

Fig. 11. Photomicrographs of alginite derived from Tasmanites cysts in reflected white light and oil immersion (A) and in fluorescence mode (B) in sample NAS-15. AL = alginite.
113B. Liu et al. / Sedimentary Geology 383 (2019) 101–120
Lazar, 2007; Ocubalidet et al., 2018). For example, Ocubalidet et al.(2018) reported that theNi/Co ratio indicates higher oxygenated condi-tions than the V/(V+ Ni) ratio in the New Albany Shale. Based on geo-chemical and petrographic paleo-redox proxies and sedimentologicobservations from cores and thin sections, Lazar (2007) concludedthat bottom water was mainly dysoxic with intermittent anoxia andoxic conditions during the deposition of the New Albany Shale.Schieber (2009) also reported a common presence of agglutinated ben-thic foraminifera in the New Albany Shale, suggestive of bottom-wateroxygenation.
V/(V + Ni) and Ni/Co ratios are relatively constant stratigraphically(Fig. 6) and thus of limited use for detecting variable paleo-redox condi-tions of bottomwaters in this study. BecauseUEF andMoEF profiles showthe same distribution patterns as U/Th and Mo/Al profiles, respectively(Fig. 6), theywill not be discussed separately. The stratigraphic distribu-tion of U/Th and Mo/Al ratios indicates that oxygen content in bottomwater decreases towards theMFSwith the rise of sea level and increasestowards the sequence boundarywith the drop of sea level (Fig. 6). Inter-estingly, according to the U/Th and Mo/Al ratio profiles, the mostoxygen-deficient condition (as indicated by metal ratios) does notoccur at the MFS where relative sea level is presumed at a maximum(Fig. 6). A potential explanation for this could be that at the MFS strongstorms that reworked the substrate and generated lag deposits at MFSs(Fig. 15)were able to supply oxygen to bottomwaters viawater columnmixing. Because redox-sensitive metals would have been mobilizedvery close to the sediment-water interface under these conditions,they could have diffused out of the sediments into the overlying water(Shaw et al., 1994; Morford and Emerson, 1999). The mismatch be-tween the U/Th and Mo/Al ratios at the MFS of sequence 4 (Fig. 6) is
Fig. 12. Photomicrographs of inertinite in reflected white light and oil immersion in sample NAfilled with minerals. I = inertinite. (For interpretation of the references to color in this figure l
difficult to explain, probably due to the difference between the degreeof enrichment of authigenic U and Mo (Algeo and Tribovillard, 2009;Tribovillard et al., 2012). The lag deposits at the MFS are mainly com-posed of pyrite, recrystallized radiolaria, Tasmanites cysts filled withauthigenic quartz and pyrite, and microcrystalline quartz in the matrix(Figs. 13, 15). The Tasmanites cysts with authigenic infills suggest ex-tremely low sedimentation rate (Schieber, 1996), otherwise the algalcysts would be compacted (Figs. 8C−D, 11). The U/Th and Mo/Al ratioprofiles display a similar trend to the TOC profile (Fig. 6), suggestingthat oxygen-deficient conditions are favorable for OM accumulation.
The U/Th and Mo/Al ratios indicate lower bottom-water oxygena-tion in the Clegg Creek Member compared to the other members,which could be another reason for high TOC content in the CleggCreek Member besides high paleoproductivity (Fig. 6). A productivity-anoxia feedback (Ingall et al., 1993) may have contributed to OM accu-mulation during the deposition of the Clegg Creek Member (Ocubalidetet al., 2018). In the Blocher Member, the U/Th and Mo/Al ratios are rel-atively constant and close to the values in theHSTs of sequences 2 and 3(Fig. 6). A potential explanation could be that relative sea level was stilllow during the deposition of the Blocher Member and bottom waterswere still oxygenated to some extent because storms and waves, as in-dicated by silty laminae and lenses (Figs. 14, 16), would mix oxygen-deficient bottom waters and oxygenated surface waters. U and Mo donot tend to be enriched under such conditions (Langmuir, 1978;Anderson et al., 1989; Klinkhammer and Palmer, 1991; Calvert andPedersen, 1993; Tribovillard et al., 2006; Algeo and Tribovillard,2009); a possible explanation of low gamma-ray intensities observedin the Blocher Member (Fig. 6). Ocubalidet et al. (2018) also suggestedthat the paleoenvironment was dysoxic to oxic during the deposition
S-1. Inertinite in panel B shows cellular structure (yellow arrows). The cellular pores areegend, the reader is referred to the web version of this article.)

Fig. 13. Photomicrographs of biogenic silica in samples near the MFS of sequence 4 at 613.85 m. (A) Recrystallized radiolaria. The impurity results from inclusions of clay minerals andpyrite during silica precipitation, plane-polarized light. (B) The same field of panel A under cross-polarized light. (C) Biogenic silica precipitated in Tasmanites cysts, plane-polarizedlight; (D) Panel C as seen in cross-polarized light; (E) SEM image (backscattered electron image) of biogenic silica precipitated in Tasmanites cysts; (F) SEM image (backscatteredelectron image) of microcrystalline quartz precipitated in Tasmanites cysts and in the matrix. R = radiolaria; T = Tasmanites cyst; Qtz = quartz.
114 B. Liu et al. / Sedimentary Geology 383 (2019) 101–120
of the Blocher Member based on C-S-Fe relationships and redox-sensitive trace element ratios.
5.4. Organic maceral variation
Organic macerals follow specific evolutional pathways during ther-mal maturation (Peters and Cassa, 1994; Liu et al., 2019). Alginite de-rived from Tasmanites cysts has higher hydrocarbon generationpotential (Revill et al., 1994; Vigran et al., 2008), but is more resistantto thermal degradation compared to AOM (Vigran et al., 2008; Liuet al., 2019). The stratigraphic distribution of organicmacerals can resultin stratigraphic variability of the hydrocarbon generation potential of
source rocks (Bohacs, 1993; Chandra et al., 1993; Slatt et al., 2012;Ade and Trindade, 2017). For example, Slatt et al. (2012) reported thatcyclic variations of hydrocarbon generation potential in the BarnettShale resulted fromfluctuations of relative sea level at the parasequencescale. Ade and Trindade (2017) reported higher hydrogen index in theTST than in the HST in the southeastern Paraná Basin (Brazil).
The stratigraphic distribution of organic macerals within the NewAlbany Shale indicates that sea-level fluctuations control selective pres-ervation of organic macerals by influencing bottom-water redox condi-tions and clastic supply. In the LST, organic macerals are dominated byalginite (Fig. 10). Relative sea level is low and bottom water is oxygen-ated in the LST, and under such conditions OM undergoes severe

Fig. 14.Photomicrographs of laminae composedof calcareous fossil fragments and recycleddolomite in the BlocherMember. (A–B) Laminae composed Tentaculites in theBlocherMember,plane-polarized light; (C) Silty lamina mainly composed of recycled dolomite (yellow arrows), plane-polarized light; (D) The same field of panel C under cross-polarized light. Ten =Tentaculites; C = conodont. (For interpretation of the references to color in this figure legend, the reader is referred to the web version of this article.)
115B. Liu et al. / Sedimentary Geology 383 (2019) 101–120
microbial breakdown. Labile OM, whichwill turn into AOM later in dia-genesis, would be largely destroyed and relatively resistant algal cystswhich will turn into alginite during diagenesis will be enriched.Schieber (2001) also reported that alginite was more abundant thanbituminite (a synonym of AOM; Kus et al., 2017) at the base of blackshale packages within a given depositional sequence. At the onset oftransgression, sea level rises and oxygen content in the bottom waterdecreases. Labile OMwill be better preserved because of reducedmicro-bial degradation. There is a slight decrease of AOM content at the MFS(Fig. 10), probably because sedimentation rates were so low that labileOMstayed on the sea floor long enough to be partially destroyed. The U/Th and Mo/Al ratio profiles also suggest that the most oxygen-deficientconditions did not occur at MFSs (Fig. 6). Schieber (2001) also foundthat alginite derived from Tasmanites cysts was enriched at MFSs inthe Chattanooga and New Albany Shale of the eastern USA. As sealevel drops, oxygen content in bottom water increases and microbialbreakdown of labile OM intensifies. Better oxygenation of bottom wa-ters is indicated by gray bioturbated beds in HSTs (Figs. 2, 3). In theSelmier Member, bioturbation is common and intense (Figs. 2, 3) andOM is dominated by alginite (Fig. 10), suggesting that relatively oxicconditions are not favorable for AOM preservation. In sequence 3, how-ever, the AOM content reaches a maximum in the middle of the HST(Fig. 10). A potential explanation for this could be that increasing clasticsupply in the HST improved preservation of AOM because timely coverby clastic materials prevented AOM from microbial breakdown. This isfurther supported by the coincidence of AOM and Al content maximumat about 625.0 m (Figs. 6, 10). Organic petrographic study of moreclosely spaced samples is needed to understand the stratigraphic varia-tion of different types of OM and infer the control of depositional condi-tions on the differential preservation of organic macerals.
Authigenic precipitates of quartz and pyrite in Tasmanites cysts havebeen reported fromDevonian black shales of the eastern USA (Schieber,1996; Schieber et al., 2000; Schieber and Baird, 2001) as a consequenceof very low sedimentation rates. These cyst fills are common in the TSTand HST, and most prominent at the MFS where sedimentation rateswere minimal. In the LST, filled Tasmanites cysts occur as well, but thefill in this case consists of detrital materials, such as grains of quartz,K-feldspar, recycled dolomite, mica, pyrite, and clay minerals (Fig. 17).Schieber and Lazar (2004) and Lazar (2007) pointed out that these de-trital infills as well as an abundance of broken alga cysts (Fig. 17) arebest explained as a consequence of sediments reworking by storm-induced bottom currents during lowstands.
5.5. Influence of relative sea-level fluctuations on OM accumulation
In this study, the stratigraphic distribution of TOC and geochemicalproxies indicates that bottom-water redox conditions are one of thecontrolling factors for OMaccumulationwithin a sequence stratigraphiccontext (Fig. 6). Clastic supply and paleoproductivity exert additionalinfluences via dilution or preservation.
Relative sea-levelfluctuations influence paleoproductivity, clastic sup-ply, bottom-water redox conditions, and their combined control on OMaccumulation in epicontinental seas (Arthur and Sageman, 2005). OMcontent has been linked to sequence stratigraphic context in a numberof previous studies (Bohacs, 1993; Chandra et al., 1993; Creaney andPassey, 1993; Slatt and Rodriguez, 2012; Ade and Trindade, 2017; Donget al., 2017; Byun et al., 2018; Harris et al., 2018), and in general terms,OM preferentially accumulates in TSTs because of lower clastic dilutionand bottom-water oxygenation. OM is not as easily preserved in HSTs be-cause of increasing clastic dilution and bottom-water oxygenation due to

Fig. 15. (A) Scanned core slab showing lag deposits at theMFS of sequence 3 at 632.64m. (B) Scanned core slab showing lag deposits at theMFS of sequence 4 at 613.85m. The carbonatenodules suggest low sedimentation rate. (C) Scannedpolished thin section of the lower two lags inpanel B. (D) SEM image (backscattered electron image) of the rectangular framedarea inpanel C. Note the Tasmanites cysts filled with authigenic quartz. T = Tasmanites cyst; Q = quartz; Py = pyrite.
116 B. Liu et al. / Sedimentary Geology 383 (2019) 101–120
shallowing, and is thought to reach amaximum at the MFS (Creaney andPassey, 1993). As pointed out above, in this study TOCmaxima do not co-incide with MFSs, presumably because OM residence times were suchthat substantial amounts of initial OMwere remineralized prior to burial.Byun et al. (2018) reported similar TOC distribution patterns in the Mid-dle Ordovician Jigunsan Formation of Korea, but attributed it to the reduc-tion of productivity of benthic biota towards the MFS. The TOCdistribution pattern seen in relation to sequence stratigraphic variability
Fig. 16. (A) Scanned core slab showing silty laminae in the Blocher Member. Note the combidolomite, quartz, and pyrite. Also note silt-filled burrows and laminae disruptions, an indicatioA. Laminae of several grains thick are very common, suggesting frequent storm and wave rew
in the New Albany Shale may also apply to other black shale successions,which may have different depositional settings and histories. It isnoteworthy that the stratigraphic variation of TOC content in blackshale successions with high thermal maturity may not represent thevariation of OM content when shales were deposited because of petro-leum generation and expulsion (Tissot and Welte, 1984) and migrationof solid bitumen within black shales (Hackley and Cardott, 2016; Liuet al., 2019).
ned-flow ripple in the lower right corner. The laminae are mainly composed of recycledn of benthic life at the seafloor. (B) Scanned polished thin section of the sample in panelorking of bottom sediments.

Fig. 17. Tasmanites cysts-enriched interval in the LST of sequence 4 at 620.24 m. (A) Scanned core slab showing brownish laminae mainly composed of Tasmanites cysts and pyrite.(B) Photomicrograph of the rectangular framed area in panel A, plane-polarized light. Tasmanites cysts filled with varying mineral particles. Note that most Tasmanites cysts arebroken. (C) Tasmanites cyst filled with recycled dolomite, quartz, and other mineral particles, plane-polarized light. (D) SEM image (backscattered electron image) of the Tasmanitescyst in panel C. The Tasmanites cyst is filled with quartz, K-feldspar, recycled dolomite, and pyrite. T = Tasmanites cyst; Q = quartz; Dol = dolomite; Kfs = K-feldspar; Py = pyrite.
117B. Liu et al. / Sedimentary Geology 383 (2019) 101–120
6. Conclusions
Detailed examination of TOC content, organic petrographic composi-tion, and high-resolution (8 cm spacing) geochemical proxies of theNew Albany Shale allow us to evaluate the influence of relative sea-level fluctuations on paleoproductivity, clastic supply, bottom-waterredox conditions, and their complex interactions on OM enrichment inmarine organic-rich sediments. The key contribution of this study is un-derstanding stratigraphic variation of OM content and type within a se-quence stratigraphic context. Specific conclusions can be drawn:
(1) OM content and type in the New Albany Shale varystratigraphically. The stratigraphic distribution of TOC contentand geochemical proxies indicates that bottom-water redox con-ditions are one of the controlling factors for OM accumulation inthe New Albany Shale. Paleoproductivity and clastic supply havedual impacts on OM accumulation; they can enrich or dilute OM.
(2) Relative sea-level fluctuations influence paleoproductivity, clas-tic supply, bottom-water redox conditions, and their combinedcontrol on OM accumulation in the New Albany Shale. Within asequence stratigraphic context, TOC content increases in TSTs,reaches a maximum before the MFS, and maintains relativelylow values during HSTs. The relatively low TOC contents atMFSs reflect a combination of low burial efficiency, elevatedbottom-water oxygenation caused by storm reworking, andhigh levels of dilution by biogenic silica. The stratigraphic varia-tion of organic matter content and type may also apply to otherblack shale successions and can be beneficial for working outthe sequence stratigraphic framework of fine-grained organic-rich sedimentary successions.
(3) OM in the New Albany Shale is dominated by either AOM oralginite (mainly derived from Tasmanites cysts). Terrestrial OM
(vitrinite + inertinite) content is b10%. AOM content increasesin TSTs, reaches a maximum near the MFS, and decreases inHSTs. Increasing clastic supply in HSTs can enhance the preserva-tion of AOM and shift the AOM content maximum to the middleof HSTs. Enrichment of broken and detrital filled Tasmanites cystsindicates high-energy environments and LST conditions.
(4) Successful development of oil and gas from tight shalereservoirs requires a good understanding of stratigraphic dis-tribution of TOC and hydrocarbon generation potential be-cause OM plays different roles in shale oil vs shale gas plays(Jarvie, 2012a, 2012b; Bohacs et al., 2013). The results of thisstudy can help better evaluate unconventional petroleumsystems.
Supplementary data to this article can be found online at https://doi.org/10.1016/j.sedgeo.2019.02.004.
Acknowledgements
This research was supported by the sponsors of the Indiana Univer-sity Shale Research Consortium, a Geological Society of America Gradu-ate Student Research Grant, and a Research Grant-in-Aid Award fromDepartment of Earth and Atmospheric Sciences, Indiana UniversityBloomington. Mastalerz's contribution is based upon work supportedby the U.S. Department of Energy, Office of Science, Office of Basic En-ergy Sciences, Chemical Sciences, Geosciences, and Biosciences Divisionunder Award Number DE-SC0006978. Financial support for B. Liu fromthe China Scholarship Council is also gratefully acknowledged. Wethank Remus Lazar from ExxonMobil Upstream Research Company forsharing his work on and insights into the sequence stratigraphic frame-work of the New Albany Shale.

118 B. Liu et al. / Sedimentary Geology 383 (2019) 101–120
References
Abarghani, A., Ostadhassan, M., Gentzis, T., Carvajal-Ortiz, H., Bubach, B., 2018.Organofacies study of the Bakken source rock in North Dakota, USA, based on organicpetrology and geochemistry. Int. J. Coal Geol. 188, 79–93.
Adams, J.A.S., Weaver, C.E., 1958. Thorium-to-uranium ratios as indicators of sedimentaryprocesses: example of concept of geochemical facies. AAPG Bull. 42, 387–430.
Ade, M.V.B., Trindade, L.A., 2017. Dispersed organicmatter analysis and distribution in thesequence stratigraphic framework of the southeastern, Paraná Basin, Brazil.J. Sediment. Environ. 2, 195–218.
Akar, Ç., Mastalerz, M., Schimmelmann, A., Drobniak, A., 2015. Comparison of hydrocar-bon potentials of New Albany Shale and Maquoketa Group in Indiana, USA. JacobsJ. Petrol. Nat. Gas 1, 1–15.
Algeo, T.J., Lyons, T.W., 2006. Mo–total organic carbon covariation in modern anoxic ma-rine environments: Implications for analysis of paleoredox and paleohydrographicconditions. Paleoceanography 21, PA1016. https://doi.org/10.1029/2004PA001112.
Algeo, T.J., Tribovillard, N., 2009. Environmental analysis of paleoceanographic systemsbased on molybdenum–uranium covariation. Chem. Geol. 268, 211–225.
Algeo, T.J., Kuwahara, K., Sano, H., Bates, S., Lyons, T., Elswick, E., Hinnov, L., Ellwood, B.,Moser,J.,Maynard, J.B., 2011. Spatial variation in sedimentfluxes, redox conditions, andproduc-tivity in the Permian–Triassic Panthalassic Ocean. Palaeogeogr. Palaeoclimatol.Palaeoecol. 308, 65–83.
Algeo, T.J., Henderson, C.M., Tong, J., Feng, Q., Yin, H., Tyson, R.V., 2013. Plankton and pro-ductivity during the Permian–Triassic boundary crisis: An analysis of organic carbonfluxes. Glob. Planet. Chang. 105, 52–67.
Anderson, R.F., Fleisher, M.Q., LeHuray, A.P., 1989. Concentration, oxidation state, and par-ticulate flux of uranium in the Black Sea. Geochim. Cosmochim. Acta 53, 2215–2224.
Arthur, M.A., Sageman, B.B., 2005. Sea-level control on source-rock development: Per-spectives from the Holocene Black Sea, the mid-Cretaceous Western Interior Basinof North America, and the Late Devonian Appalachian Basin. In: Harris, N.B. (Ed.),The Deposition of Organic-Carbon Rich Sediments: Models, Mechanisms, and Conse-quences. SEPM Special Publication 82, pp. 35–59.
Beier, J.A., Hayes, J.M., 1989. Geochemical and isotopic evidence for paleoredox conditionsduring deposition of the Devonian-Mississippian New Albany Shale, southernIndiana. Geol. Soc. Am. Bull. 101, 774–782.
Bialkowski, A., Tribovillard, N., Vergès, E., Deconinck, J.-F., 2000. Sedimentary organic mat-ter, accumulation and grain-size in the Kimmeridgian–Tithonian of the Boulonnaisarea (Northern France). Application to sequence stratigraphy. C. R. Acad. Sci. Ser.IIA Earth Planet. Sci. 331, 451–458.
Bohacs, K.M., 1993. Source quality variations tied to sequence development in the Mon-terey and associated formations, southwestern California. In: Katz, B.J., Pratt, L.M.(Eds.), Source Rocks in a Sequence Stratigraphic Framework. AAPG Studies in Geol-ogy 37, pp. 177–204.
Bohacs, K.M., Schwalbach, J.R., 1994. Natural gamma-ray spectrometry of the MontereyFormation at Naples Beach, California: insights into lithology, stratigraphy, andsource-rock quality. In: Hornafius, J.S. (Ed.), Field Guide to the Monterey Formationbetween Santa Barbara and Gaviota, California. AAPG Pacific Section GB 72,pp. 85–94.
Bohacs, K.M., Grabowski Jr., G.J., Carroll, A.R., Mankiewicz, P.J., Miskell-Gerhardt, K.J.,Schwalbach, J.R., Wegner, M.B., Simo, J.A., 2005. Production, destruction, and dilu-tion—the many paths to source-rock development. In: Harris, N.B. (Ed.), The Deposi-tion of Organic-Carbon Rich Sediments: Models, Mechanisms, and Consequences.SEPM Special Publication 82, pp. 61–101.
Bohacs, K.M., Passey, Q.R., Rudnicki, M., Esch, W.L., Lazar, O.R., 2013. The spectrum of fine-grained reservoirs from ‘shale gas’ to ‘shale oil’/tight liquids: essential attributes, keycontrols, practical characterization. International Petroleum Technology Conference.Beijing, China, March 26–28, 2013, Paper IPTC 16676 https://doi.org/10.2523/IPTC-16676-MS.
Bralower, T.J., Thierstein, H.R., 1987. Organic carbon and metal accumulation rates in Ho-locene and mid-Cretaceous sediments: palaeoceanographic significance. Geol. Soc.Lond., Spec. Publ. 26, 345–369.
Brett, C.E., Baird, G.C., Bartholomew, A.J., 2004. Sequence stratigraphy of highly variableMiddle Devonian strata in central Kentucky: Implications for regional correlationsand depositional environments. In: Schieber, J., Lazar, R.O. (Eds.), Devonian BlackShales of the Eastern U.S.: New Insights into Sedimentology and Stratigraphy fromthe Subsurface and Outcrops in the Illinois and Appalachian Basins. Field Guide forthe 2004 Annual Field Conference of the Great Lakes Section of SEPM, Indiana Geo-logical Survey Open File Study, 04–05, pp. 35–60.
Brumsack, H.J., 2006. The trace metal content of recent organic carbon-rich sediments:implications for Cretaceous black shale formation. Palaeogeogr. Palaeoclimatol.Palaeoecol. 232, 344–361.
Byun, U.H., Lee, H.S., Kwon, Y.K., 2018. Sequence stratigraphy in the middle Ordovicianshale successions, mid-east Korea: stratigraphic variations and preservation potentialof organic matter within a sequence stratigraphic framework. J. Asian Earth Sci. 152,116–131.
Calvert, S.E., Pedersen, T.F., 1993. Geochemistry of recent oxic and anoxic marine sedi-ments: Implications for the geological record. Mar. Geol. 113, 67–88.
Calvert, S.E., Bustin, R.M., Ingall, E.D., 1996. Influence of water column anoxia and sedi-ment supply on the burial and preservation of organic carbon in marine shales.Geochim. Cosmochim. Acta 60, 1577–1593. https://doi.org/10.1016/0016-7037(96)00041-5.
Campbell, G., 1946. New Albany Shale. GSA Bull. 57, 829–908.Chandra, K., Raju, D.S.N., Mishra, P.K., 1993. Sea level changes, anoxic conditions, organic
matter enrichment, and petroleum source rock potential of the Cretaceous sequencesof the Cauvery Basin, India. In: Katz, B.J., Pratt, L.M. (Eds.), Source Rocks in a SequenceStratigraphic Framework. AAPG Studies in Geology 37, pp. 131–146.
Chou, M.-I.M., Dickerson, D.R., Chou, S.-F.J., Sargent, M.L., 1991. Hydrocarbon Source Po-tential and Organic Geochemical Nature of Source Rocks and Crude Oils in the IllinoisBasin. 136. Illinois State Geological Survey, Champaign, Illinois, USA (39 pp).
Creaney, S., Passey, Q.R., 1993. Recurring patterns of total organic carbon and source rockquality within a sequence stratigraphic framework. AAPG Bull. 77, 386–401.
Cumberland, S.A., Douglas, G., Grice, K., Moreau, J.W., 2016. Uranium mobility in organicmatter-rich sediments: A review of geological and geochemical processes. Earth Sci.Rev. 159, 160–185.
Curtis, C.D., 1980. Diagenetic alteration in black shales. J. Geol. Soc. 137, 189–194.Dickinson, W.R., Beard, L.S., Brakenridge, G.R., Erjavec, J.L., Ferguson, R.C., Inman, K.F.,
Knepp, R.A., Lindberg, F.A., Ryberg, P.T., 1983. Provenance of North American Phaner-ozoic sandstones in relation to tectonic setting. GSA Bull. 94, 222–235.
Dong, T., Harris, N.B., Ayranci, K., 2017. Relative sea-level cycles and organic matter accu-mulation in shales of the Middle and Upper Devonian Horn River Group, northeast-ern British Columbia, Canada: Insights into sediment flux, redox conditions, andbioproductivity. GSA Bull. 130, 859–880.
Ettensohn, F.R., 2008. The Appalachian foreland basin in eastern United States. In: Miall,A.D. (Ed.), The Sedimentary Basins of the United States and Canada. Elsevier,Amsterdam, pp. 105–179.
Fertl, W.H., Chilingar, G.V., 1988. Total organic carbon content determined fromwell logs.SPE Form. Eval. 3, 407–419.
Goñi, M.A., Ruttenberg, K.C., Eglinton, T.I., 1997. Sources and contribution of terrigenousorganic carbon to surface sediments in the Gulf of Mexico. Nature 389, 275–278.
Gregory, W.A., Hart, G.F., 1992. Towards a predictive model for the palynologic responseto sea-level changes. Palaios 7, 3–33.
Hackley, P.C., Cardott, B.J., 2016. Application of organic petrography in North Americanshale petroleum systems: A review. Int. J. Coal Geol. 163, 8–51.
Hamilton-Smith, T., Hasenmueller, N.R., Boberg, W.S., Smidchens, Z., Frankie, W.T., 1994.Gas production. In: Hasenmueller, N.R., Comer, J.B. (Eds.), Gas Potential of the NewAlbany Shale (Devonian and Mississippian) in the Illinois Basin. Gas Research Insti-tute, GRI-00/0068, Illinois Basin Studies 2, pp. 23–40.
Harris, N.B., McMillan, J.M., Knapp, L.J., Mastalerz, M., 2018. Organic matter accumulationin the Upper Devonian Duvernay Formation, Western Canada Sedimentary Basin,from sequence stratigraphic analysis and geochemical proxies. Sediment. Geol. 376,185–203.
Hatch, J.R., Leventhal, J.S., 1992. Relationship between inferred redox potential of the de-positional environment and geochemistry of the Upper Pennsylvanian (Missourian)Stark Shale Member of the Dennis Limestone, Wabaunsee County, Kansas, USA.Chem. Geol. 99, 65–82.
Hedges, J.I., Keil, R.G., Benner, R., 1997. What happens to terrestrial organic matter in theocean? Org. Geochem. 27, 195–212.
Ingall, E.D., Bustin, R.M., Van Cappellen, P., 1993. Influence of water column anoxia on theburial and preservation of carbon and phosphorus in marine shales. Geochim.Cosmochim. Acta 57, 303–316.
Jacob, H., 1989. Classification, structure, genesis and practical importance of natural solidoil bitumen (“migrabitumen”). Int. J. Coal Geol. 11, 65–79.
Jarvie, D.M., 2012a. Shale resource systems for oil and gas: Part 1—shale-gas resource sys-tems. In: Breyer, J.A. (Ed.), Shale Reservoirs— Giant Resources for the 21st Century.AAPG Memoir 97, pp. 69–87.
Jarvie, D.M., 2012b. Shale resource systems for oil and gas: Part 2—shale-oil resource sys-tems. In: Breyer, J.A. (Ed.), Shale Reservoirs—Giant Resources for the 21st Century.AAPG Memoir 97, pp. 89–119.
Jones, B., Manning, D.A., 1994. Comparison of geochemical indices used for the inter-pretation of palaeoredox conditions in ancient mudstones. Chem. Geol. 111,111–1129.
Killops, S., Killops, V., 2005. Introduction to Organic Geochemistry. second ed. BlackwellPublishing, Malden, MA, USA (406 pp.).
Klinkhammer, G.P., Palmer, M.R., 1991. Uranium in the oceans: where it goes and why.Geochim. Cosmochim. Acta 55, 1799–1806.
Kus, J., Araujo, C.V., Borrego, A.G., Flores, D., Hackley, P.C., Hámor-Vidó, M., Kalaitzidis, S.,Kommeren, C.J., Kwiecińska, B., Mastalerz, M., Mendonça Filho, J.G., Menezes, T.R.,Misz-Kennan, M., Nowak, G.J., Petersen, H.I., Rallakis, D., Suárez-Ruiz, I., Sýkorová, I.,Životić, D., 2017. Identification of alginite and bituminite in rocks other than coal.2006, 2009, and 2011 round robin exercises of the ICCP Identification of DispersedOrganic Matter Working Group. Int. J. Coal Geol. 178, 26–38.
Langmuir, D., 1978. Uranium solution-mineral equilibria at low temperatures with appli-cations to sedimentary ore deposits. Geochim. Cosmochim. Acta 42, 547–569.
Lash, G., Blood, R., 2011. Sequence stratigraphy as expressed by shale source rock and res-ervoir characteristics—Examples from the Devonian succession, Appalachian Basin.AAPG Annual Convention and Exhibition, Houston, TX, USA, April 10-13, 2011,80168.
Lazar, O.R., 2007. Redefinition of the New Albany Shale of the Illinois Basin: An Integrated,Stratigraphic, Sedimentologic, and Geochemical Study. (Ph.D. dissertation). Indiana Uni-versity, Bloomington (336 pp.). https://search.proquest.com/docview/304849382?pq-origsite=gscholar.
Leventhal, J.S., 1981. Pyrolysis gas chromatography-mass spectrometry to characterize or-ganic matter and its relationship to uranium content of Appalachian Devonian blackshales. Geochim. Cosmochim. Acta 45, 883–889.
Lewan, M.D., Maynard, J.B., 1982. Factors controlling enrichment of vanadium and nickelin the bitumen of organic sedimentary rocks. Geochim. Cosmochim. Acta 46,2547–2560.
Lineback, J.A., 1964. Stratigraphy and Depositional Environment of the New Albany Shale(Upper Devonian and Lower Mississippian) in Indiana. (Ph.D. dissertation). IndianaUniversity (136 pp.).
Lineback, J.A., 1968. Subdivisions and depositional environments of New Albany Shale(Devonian-Mississippian) in Indiana. AAPG Bull. 52, 1291–1303.

119B. Liu et al. / Sedimentary Geology 383 (2019) 101–120
Liu, B., Schieber, J., Mastalerz, M., 2017. Combined SEM and reflected light petrography oforganic matter in the New Albany Shale (Devonian-Mississippian) in the IllinoisBasin: A perspective on organic pore development with thermal maturation. Int.J. Coal Geol. 184, 57–72.
Liu, B., Schieber, J., Mastalerz, M., 2019. Petrographic andmicro-FTIR study of organicmat-ter in the Upper Devonian New Albany Shale During thermal maturation: Implica-tions for kerogen transformation. https://doi.org/10.1306/13672216M1213380.
Loucks, R.G., Reed, R.M., Ruppel, S.C., Hammes, U., 2012. Spectrum of pore types and net-works in mudrocks and a descriptive classification for matrix-related mudrock pores.AAPG Bull. 96, 1071–1098.
Lüning, S., Kolonic, S., 2003. Uranium spectral gamma-ray response as a proxy for organicrichness in black shales: applicability and limitations. J. Pet. Geol. 26, 153–174.
Mastalerz, M., Schimmelmann, A., Lis, G.P., Drobniak, A., Stankiewicz, A., 2012. Influenceof maceral composition on geochemical characteristics of immature shale kerogen:insight from density fraction analysis. Int. J. Coal Geol. 103, 60–69.
Mastalerz, M., Schimmelmann, A., Drobniak, A., Chen, Y., 2013. Porosity of Devonian andMississippian New Albany Shale across a maturation gradient: insights from organicpetrology, gas adsorption, and mercury intrusion. AAPG Bull. 97, 1621–1643.
Mastalerz, M., Drobniak, A., Stankiewicz, A.B., 2018. Origin, properties, and implications ofsolid bitumen in source-rock reservoirs: A review. Int. J. Coal Geol. 195, 14–36.
McLaughlin, P.I., Emsbo, P., Desrochers, A., Bancroft, A., Brett, C.E., Riva, J.F., Premo, W.,Neymark, L., Achab, A., Asselin, E., Emmons, M.M., 2016. Refining 2 km of Ordovicianchronostratigraphy beneath Anticosti Island utilizing integrated chemostratigraphy.Can. J. Earth Sci. 53, 865–874.
Morford, J.L., Emerson, S., 1999. The geochemistry of redox sensitive trace metals in sed-iments. Geochim. Cosmochim. Acta 63, 1735–1750.
Müller, P.J., Suess, E., 1979. Productivity, sedimentation rate, and sedimentary organicmatter in the oceans—I. Organic carbon preservation. Deep Sea Res. A Oceanogr.Res. Pap. 26, 1347–1362.
Nuttall, B.C., Parris, T.M., Beck, G., Willette, D.C., Mastalerz, M., Crockett, J., 2015. OilProduction from Low-maturity Organic-rich Shale: an example from theDevonian New Albany Shale in the Illinois Basin, Breckinridge County, Kentucky.AAPG Eastern Section 44th Annual Meeting, Indianapolis, Indiana, September20-22, 2015, 51196.
Ocubalidet, S.G., Rimmer, S.M., Conder, J.A., 2018. Redox conditions associated with or-ganic carbon accumulation in the Late Devonian New Albany Shale, west-centralKentucky, Illinois Basin. Int. J. Coal Geol. 190, 42–55.
Opsahl, S., Benner, R., 1997. Distribution and cycling of terrigenous dissolved organicmat-ter in the ocean. Nature 386, 480–482.
Pacton, M., Gorin, G.E., Vasconcelos, C., 2011. Amorphous organic matter—experimentaldata on formation and the role of microbes. Rev. Palaeobot. Palynol. 166, 253–267.
Pasley, M.A., Gregory, W.A., Hart, G.F., 1991. Organic matter variations in transgressiveand regressive shales. Org. Geochem. 17, 483–509.
Passey, Q.R., Bohacs, K.M., Esch, W.L., Klimentidis, R., Sinha, S., 2010. From oil-pronesource rock to gas-producing shale reservoir-geologic and petrophysical characteri-zation of unconventional shale-gas reservoirs. Chinese Petroleum Society/Society ofPetroleum Engineers International Oil and Gas Conference and Exhibition, Beijing,China, June 8–10, 2010, SPE Paper 131350 https://doi.org/10.2118/131350-MS.
Pedersen, T.F., Calvert, S.E., 1990. Anoxia vs. productivity: what controls the forma-tion of organic-carbon-rich sediments and sedimentary Rocks? AAPG Bull. 74,454–466.
Peters, K.E., Cassa, M.R., 1994. Applied source rock geochemistry. In: Magoon, L.B., Dow,W.G. (Eds.), The Petroleum System—From Source to Trap. AAPG Memoir vol. 60,pp. 93–120.
Ponsaing, L., Bojesen-Koefoed, J.A., Thomsen, E., Stemmerik, L., 2018. Temporal organic fa-cies variations of Upper Jurassic-lowermost Cretaceous source rocks in the DanishCentral Graben, North Sea. Int. J. Coal Geol. 195, 217–237.
Raiswell, R., Berner, R.A., 1987. Organic carbon losses during burial and thermal matura-tion of normal marine shales. Geology 15, 853–856.
Revill, A.T., Volkman, J.K., O'leary, T., Summons, R.E., Boreham, C.J., Banks,M.R., Denwer, K.,1994. Hydrocarbon biomarkers, thermal maturity, and depositional setting oftasmanite oil shales from Tasmania, Australia. Geochim. Cosmochim. Acta 58,3803–3822.
Rimmer, S.M., 2004. Geochemical paleoredox indicators in Devonian–Mississippian blackshales, central Appalachian Basin (USA). Chem. Geol. 206, 373–391.
Rimmer, S.M., Thompson, J.A., Goodnight, S.A., Robl, T.L., 2004. Multiple controls on thepreservation of organic matter in Devonian–Mississippian marine black shales: geo-chemical and petrographic evidence. Palaeogeogr. Palaeoclimatol. Palaeoecol. 215,125–154.
Ripley, E.M., Shaffer, N.R., Gilstrap, M.S., 1990. Distribution and geochemical characteris-tics of metal enrichment in the New Albany Shale (Devonian-Mississippian),Indiana. Econ. Geol. 85, 1790–1807.
Robison, V.D., Liro, L.M., Robison, C.R., Dawson, W.C., Russo, J.W., 1996. Integrated geo-chemistry, organic petrology, and sequence stratigraphy of the Triassic Shublik For-mation, Tenneco Phoenix # 1 well, North Slope, Alaska, USA. Org. Geochem. 24,257–272.
Robl, T.L., Rimmer, S.M., Barron, L.S., 1992. Organic petrography of Mississippian and De-vonian shales in east-central Kentucky. Fuel 71, 267–271.
Ross, D.J.K., Bustin, R.M., 2009. The importance of shale composition and pore struc-ture upon gas storage potential of shale gas reservoirs. Mar. Pet. Geol. 26,916–927.
Rowe, H., Hughes, N., Robinson, K., 2012. The quantification and application of handheldenergy-dispersive X-ray fluorescence (ED-XRF) in mudrock chemostratigraphy andgeochemistry. Chem. Geol. 324, 122–131.
Sageman, B.B., Murphy, A.E., Werne, J.P., Ver Straeten, C.A., Hollander, D.J., Lyons, T.W.,2003. A tale of shales: the relative roles of production, decomposition, and dilution
in the accumulation of organic-rich strata, Middle–Upper Devonian, Appalachianbasin. Chem. Geol. 195, 229–273.
Schenau, S.J., Reichart, G.J., De Lange, G.J., 2005. Phosphorus burial as a function ofpaleoproductivity and redox conditions in Arabian Sea sediments. Geochim.Cosmochim. Acta 69, 919–931.
Schieber, J., 1996. Early diagenetic silica deposition in algal cysts and spores: a source ofsand in black shales? J. Sediment. Res. 66, 175–183.
Schieber, J., 1998. Developing a sequence stratigraphic framework for the Late DevonianChattanooga Shale of the southeastern USA: relevance for the Bakken Shale. In:Christopher, J.E., Gilboy, C.F., Paterson, D.F., Bend, S.L. (Eds.), Eighth InternationalWilliston Basin Symposium. Saskatchewan Geological Society Special Publication13, pp. 58–68.
Schieber, J., 2001. A role for organic petrology in integrated studies of mudrocks: ex-amples from Devonian black shales of the eastern US. Int. J. Coal Geol. 47,171–187.
Schieber, J., 2009. Discovery of agglutinated benthic foraminifera in Devonian black shalesand their relevance for the redox state of ancient seas. Palaeogeogr. Palaeoclimatol.Palaeoecol. 271, 292–300.
Schieber, J., 2010. Common themes in the formation and preservation of intrinsic porosityin shales and mudstones-illustrated with examples across the Phanerozoic. SPEUnconventional Gas Conference. Society of Petroleum Engineers, Pittsburgh,Pennsylvania, USA. SPE 132370 https://doi.org/10.2118/132370-MS.
Schieber, J., 2016. Mud re-distribution in epicontinental basins–Exploring likely pro-cesses. Mar. Pet. Geol. 71, 119–133.
Schieber, J., Baird, G., 2001. On the origin and significance of pyrite spheres in Devonianblack shales of North America. J. Sediment. Res. 71, 155–166.
Schieber, J., Lazar, R.O., 2004. Devonian Black Shales of the Eastern U.S.: New Insightsinto Sedimentology and Stratigraphy from the Subsurface and Outcrops in the Il-linois and Appalachian Basins. Indiana Geological Survey Open File Study 04–05(90 pp.).
Schieber, J., Krinsley, D., Riciputi, L., 2000. Diagenetic origin of quartz silt in mudstonesand implications for silica cycling. Nature 406, 981–985.
Schoepfer, S.D., Shen, J., Wei, H., Tyson, R.V., Ingall, E., Algeo, T.J., 2015. Total organic car-bon, organic phosphorus, and biogenic barium fluxes as proxies for paleomarine pro-ductivity. Earth Sci. Rev. 149, 23–52.
Schwalbach, J.R., Bohacs, K.M., 1992. Sequence Stratigraphy in Fine-grained Rocks: Exam-ples from the Monterey Formation. Pacific Section SEPM 70 (80 pp.).
Shaw, T.J., Sholkovitz, E.R., Klinkhammer, G., 1994. Redox dynamics in the ChesapeakeBay: the effect on sediment/water uranium exchange. Geochim. Cosmochim. Acta58, 2985–2995.
Slatt, R.M., Rodriguez, N.D., 2012. Comparative sequence stratigraphy and organicgeochemistry of gas shales: commonality or coincidence? J. Nat. Gas Sci. Eng. 8,68–84.
Slatt, R.M., Philp, P.R., Abousleiman, Y., Singh, P., Perez, R., Portas, R., Marfurt, K.J., Madrid-Arroyo, S., O'Brien, N., Eslinger, E., Baruch, E.T., 2012. Pore-to-regional-scale inte-grated characterization workflow for unconventional gas shales. In: Breyer, J.A.(Ed.), Shale Reservoirs — Giant Resources for the 21st Century. AAPG Memoir vol.97, pp. 127–150.
Spencer, S., 2013. A Sedimentologic, Petrographic, Mineralogic, and Geochemical Investi-gation of Parasequences in the Camp Run Member of the Late Devonian New AlbanyShale. (Master Thesis). Indiana University, Bloomington (338 pp.).
Stach, E., Mackowsky, M.-T.H., Teichmüller, M., Taylor, G.H., Chandra, D., Teichmüller, R.,1982. Stach's Textbook of Coal Petrology. third ed. Gebrüder Borntraeger, Berlin-Stuttgart (535 pp.).
Stasiuk, L.D., Fowler, M.G., 2004. Organic facies in Devonian and Mississippian strata ofWestern Canada Sedimentary Basin: relation to kerogen type, paleoenvironment,and paleogeography. Bull. Can. Petrol. Geol. 52, 234–255.
Strąpoć, D., Mastalerz, M., Schimmelmann, A., Drobniak, A., Hasenmueller, N.R., 2010.Geochemical constraints on the origin and volume of gas in the New Albany Shale(Devonian–Mississippian), eastern Illinois Basin. AAPG Bull. 94, 1713–1740.
Swanson, V.E., 1960. Oil yield and uranium content of black shales. USGS ProfessionalPaper 356-A (44 pp.).
Tappan, H., 1980. The Paleobiology of Plant Protists. Freeman, San Francisco (1028 pp.).Taylor, S.R., McLennan, S.M., 1985. The Continental Crust: Its Composition and Evolution.
Blackwell, Oxford, pp. 24–29.Taylor, G.H., Teichmüller, M., Davis, A., Diessel, C.F.K., Littke, R., Robert, P., 1998. Organic
Petrology. Gebrüder Borntraeger, Berlin-Stuttgart (704 pp.).Teichmüller, M., 1989. The genesis of coal from the viewpoint of coal petrology. Int. J. Coal
Geol. 12, 1–87.Tissot, B.P., Welte, D.H., 1984. Petroleum Formation and Occurrence. 2nd ed. Springer-
Verlag, Berlin (699 pp.).Tissot, B., Durand, B., Espitalié, J., Combaz, A., 1974. Influence of nature and diagenesis of
organic matter in formation of petroleum. AAPG Bull. 58, 499–506.Tribovillard, N., Algeo, T.J., Lyons, T., Riboulleau, A., 2006. Trace metals as paleoredox and
paleoproductivity proxies: An update. Chem. Geol. 232, 12–32.Tribovillard, N., Algeo, T.J., Baudin, F., Riboulleau, A., 2012. Analysis of marine environ-
mental conditions based onmolybdenum–uranium covariation—Applications to Me-sozoic paleoceanography. Chem. Geol. 324, 46–58.
Tyson, R.V., 1995. Sedimentary Organic Matter: Organic Facies and Palynofacies. Chapman& Hall, London (615 pp.).
Tyson, R.V., Pearson, T.H., 1991. Modern and ancient continental shelf anoxia: an over-view. In: Tyson, R.V., Pearson, T.H. (Eds.), Modern and Ancient Continental Shelf An-oxia. Geological Society, London, Special Publication 58, pp. 1–26.
Vigran, J.O., Mørk, A., Forsberg, A.W., Weiss, H.M., Weitschat, W., 2008. Tasmanites algae—contributors to the Middle Triassic hydrocarbon source rocks of Svalbard and the Ba-rents Shelf. Polar Res. 27, 360–371.

120 B. Liu et al. / Sedimentary Geology 383 (2019) 101–120
Wang, F.P., Reed, R.M., John, A., Katherine, J., 2009. Pore networks and fluid flow in gasshales. SPE Annual Technical Conference and Exhibition. Society of Petroleum Engi-neers, New Orleans, Louisiana, USA. SPE 124253 https://doi.org/10.2118/124253-MS.
Wedepohl, K.H., 1971. Environmental influences on the chemical composition of shalesand clays. Phys. Chem. Earth 8, 307–333.
Wei, L., Wang, Y., Mastalerz, M., 2016. Comparative optical properties of macerals and sta-tistical evaluation of mis-identification of vitrinite and solid bitumen from early
mature Middle Devonian–Lower Mississippian New Albany Shale: Implications forthermal maturity assessment. Int. J. Coal Geol. 168, 222–236.
Wignall, P.B., 1991. Model for transgressive black shales? Geology 19, 167–170.Zhao, J., Jin, Z., Jin, Z., Wen, X., Geng, Y., 2017. Origin of authigenic quartz in organic-rich
shales of the Wufeng and Longmaxi Formations in the Sichuan Basin, South China:implications for pore evolution. J. Nat. Gas Sci. Eng. 38, 21–38.