organic finishes on coil coated steels
TRANSCRIPT

0
UNIVERSITY OF MANCHESTER
Organic Finishes on
Coil Coated Steels A thesis submitted to The University of Manchester for the degree of
Doctor of Philosophy in the Faculty of Science & Engineering
2018
Lee A. Farren
School of Materials
1
Contents Table of Figures ..............................................................................................................................4
Abstract ....................................................................................................................................... 10
Declaration .................................................................................................................................. 11
Copyright Statement ................................................................................................................... 11
Acknowledgements ..................................................................................................................... 12
1 Chapter 1 – Literature Review ............................................................................................ 13
Introduction ................................................................................................................ 14 1.1
Corrosion Fundamentals ............................................................................................. 14 1.2
Cost of Corrosion ........................................................................................................ 32 1.3
Introduction to Coil Coating ........................................................................................ 34 1.4
Corrosion Protection ................................................................................................... 36 1.5
Corrosion Analysis ....................................................................................................... 55 1.6
1.6.1 Electrochemical Methods ................................................................................. 56
Corrosion Testing ........................................................................................................ 74 1.7
Final Remarks, Aims and Objectives ........................................................................... 78 1.8
Chapter References ..................................................................................................... 81 1.9
2 Chapter 2 - Materials and Methodology ............................................................................. 89
Introduction ................................................................................................................ 89 2.1
Materials ..................................................................................................................... 89 2.2
Methodology ............................................................................................................... 91 2.3
3 Chapter 3 - Electrochemical Impedance with Segmented Electrodes for Modelling Zinc
Coated Steel ................................................................................................................................ 98
Introduction ................................................................................................................ 99 3.1
Verification of Technique .......................................................................................... 100 3.2
3.2.1 Introduction .................................................................................................... 100
3.2.2 Experimental ................................................................................................... 101
3.2.3 Results ............................................................................................................. 102
3.2.4 Discussion ........................................................................................................ 104
3.2.5 Conclusions ..................................................................................................... 111
Application of Segmented Electrode Technique to Chromate Replacement Pigments - 3.3
Polyphosphates ..................................................................................................................... 112
3.3.1 Introduction .................................................................................................... 112
3.3.2 Experimental ................................................................................................... 112
3.3.3 Results ............................................................................................................. 112

2
3.3.4 Discussion ........................................................................................................ 119
3.3.5 Conclusions ..................................................................................................... 125
Effects of Changing Spatial Geometry ...................................................................... 126 3.4
3.4.1 Introduction .................................................................................................... 126
3.4.2 Experimental ................................................................................................... 126
3.4.3 Results ............................................................................................................. 127
3.4.4 Discussion ........................................................................................................ 128
3.4.5 Conclusions ..................................................................................................... 131
Chapter Summary and Conclusions .......................................................................... 132 3.5
Chapter References ................................................................................................... 133 3.6
4 Chapter 4 – Analysis of Polyphosphate Inhibitor Film Formation .................................... 134
Introduction .............................................................................................................. 135 4.1
Scanning Electron Microscopy and Energy Dispersive X-Ray Spectroscopy ............. 136 4.2
4.2.1 Introduction .................................................................................................... 136
4.2.2 Experimental ................................................................................................... 137
4.2.3 Results ............................................................................................................. 137
4.2.4 Discussion ........................................................................................................ 160
4.2.5 Conclusions ..................................................................................................... 164
X-Ray Photoelectron Spectroscopy – The Effect of Zinc on Inhibitor Film Formation4.3
166
4.3.1 Introduction .................................................................................................... 166
4.3.2 Experimental ................................................................................................... 166
4.3.3 Results ............................................................................................................. 167
4.3.4 Discussion ........................................................................................................ 175
4.3.5 Conclusions ..................................................................................................... 182
Surface Analysis – The Effects of Competing Cationic Species on Inhibitor Film 4.4
Formation .............................................................................................................................. 183
4.4.1 Introduction .................................................................................................... 183
4.4.2 Experimental ................................................................................................... 183
4.4.3 Results ............................................................................................................. 184
4.4.4 Effect of Zinc Ion Concentration ..................................................................... 211
4.4.5 Discussion ........................................................................................................ 217
4.4.6 Conclusions ..................................................................................................... 222
Chapter Summary and Conclusions .......................................................................... 224 4.5

3
Chapter References ................................................................................................... 225 4.6
5 Chapter 5 - Electrochemical Experiments Utilising Segmented Electrode for Modelling a
High Percentage Aluminium Alloyed Zinc Coated Steel ........................................................... 226
Introduction .............................................................................................................. 227 5.1
Experimental ............................................................................................................. 227 5.2
Results ....................................................................................................................... 229 5.3
Discussion .................................................................................................................. 248 5.4
Conclusions ............................................................................................................... 260 5.5
Chapter References ................................................................................................... 262 5.6
6 Conclusions ....................................................................................................................... 263
7 Suggestions for Future Work ............................................................................................ 266
Word Count: 50,250

4
Table of Figures Figure 1.2.1 - An energy diagram representative of a generic metal and the products of corrosion 17
Figure 1.2.2 – A simplified Pourbaix diagram for iron 19
Figure 1.2.3 - A Tafel plot showing the variation in current with overpotential 21
Figure 1.2.4 - Proposed structure of a filament in filiform corrosion[23]. 27
Figure 1.2.5 - A Pourbaix diagram showing the states of iron for different potentials and pH values 30
Figure 1.2.6 - A Pourbaix diagram showing the states of zinc for different potentials and pH values 32
Figure 1.4.1 - A visual representation of a coil coating line[47] 35
Figure 1.6.1 - An example diagram showing the circuitry contained within a zero resistance ammeter
57
Figure 1.6.2 – The equivalent circuit representation of a resistor 62
Figure 1.6.3 - The equivalent circuit representation of a capacitor 63
Figure 1.6.4 - A Nyquist plot showin the distinctive appearance of a Warburg element at high
frequencies 64
Figure 1.6.5 - The equivalent circuit representation of an inductor 65
Figure 1.6.6 – A circuit diagram representation for a Randles Circuit 65
Figure 1.6.7 - Basic electrochemical circuit for an imperfect coating. The physical interpretation of the
circuit is as follows: Rs – solution resistance, Cc – coating capacitance, Rpo – pore resistance, Cdl
– double layer capacitance, Rct – charge transfer resistance 66
Figure 1.6.8 - A series of Nyquist plots showing the effect of lowering the coating capacitance from
green to black (all other parameters remaining the same) 67
Figure 1.6.9 - A series of Nyquist plots showing the effect of lowering the pore resistance from light
green to black (all other parameters remaining the same) 67
Figure 2.3.1 - Orientation of working electrodes in the secondary segmented electrode impedance
tests, designed to mimic an exposed cut edge. 91
Figure 2.3.2 - Schematic representation of the geometry of the three working electrode setup utilised
(1 – steel, 2 – zinc, 3 – aluminium, R – reference) 92
Figure 2.3.3 - An example schematic for the ACM Gill AC Weld Tester utilising two working electrodes
94
Figure 3.2.1 - The orientation of electrodes as used in the segmented electrode impedance tests (R -
saturated calomel reference electrode, C - platinum counter electrode) 102
Figure 3.2.2 - Nyquist plots obtained for the blank, uninhibited 0.6M sodium chloride solution for steel
(cathodic, left) and zinc (right) electrodes of equal area. 103
Figure 3.2.3 - Nyquist plots obtained for the strontium chromate inhibited 0.6M sodium chloride
solution for steel (cathodic, left) and zinc (right) electrodes of equal area. 103
Figure 3.2.4 - Nyquist plots obtained for the calcium exchanged silica inhibited 0.6M sodium chloride
solution for steel (cathodic, left) and zinc (right) electrodes of equal area. 103
Figure 3.2.5 - Nyquist plots obtained for the zinc molyphosphate inhibited 0.6M sodium chloride
solution for steel (cathodic, left) and zinc (anodic, right) 104
Figure 3.2.6 - Nyquist plots obtained for the calcium exchanged silica/zinc molyphosphate mixture
inhibited 0.6M sodium chloride solution for steel (cathodic, left) and zinc (anodic, right) 104
Figure 3.2.7 - Representative equivalent circuits used for the analysis of electrochemical impedance
obtained on the surface of steel – (a) a simplified Randles circuit, (b) modified Randles circuit and
(c) an equivalent circuit containing two time constants 108
Figure 3.2.8 - Representative equivalent circuits used for the analysis of electrochemical impedance
obtained on the surface of zinc. 110
Figure 3.3.1 - Selected Nyquist plots obtained for the strontium aluminium polyphosphate inhibited
0.6M sodium chloride solution immersed steel sample when coupled to zinc over a 72 hour
period 114

5
Figure 3.3.2 - Selected Nyquist plots obtained for the strontium aluminium polyphosphate inhibited
0.6M sodium chloride solution immersed zinc sample when coupled to steel over a 72 hour
period 114
Figure 3.3.3 - Selected Nyquist plots obtained for steel in the electrochemical impedance with
segmented electrodes experiment when coupled to zinc over a 72 hour period 115
Figure 3.3.4 - Selected Nyquist plots obtained for zinc in the electrochemical impedance with
segmented electrodes experiment when coupled to steel over a 72 hour period 116
Figure 3.3.5 - Selected Nyquist plots obtained for steel in the electrochemical impedance with
segmented electrodes experiment when coupled to zinc over a 72 hour period 117
Figure 3.3.6 - Selected Nyquist plots obtained for zinc in the electrochemical impedance with
segmented electrodes experiment when coupled to steel over a 72 hour period 117
Figure 3.3.7 - Graph displaying calculated inhibitor efficiencies for the modified aluminium
polyphosphate inhibitors on the surfaces of coupled steel and zinc 119
Figure 3.4.1 - Selected Nyquist plots obtained for steel in the electrochemical impedance with
segmented electrodes experiment when coupled to zinc over a 24 hour period in the model cut
edge geometry cell 127
Figure 3.4.2 - Selected Nyquist plots obtained for zinc in the electrochemical impedance with
segmented electrodes experiment when coupled to steel over a 24 hour period in the model cut
edge geometry cell 128
Figure 3.4.3 - Scatter graph showing the progression of inhibitor efficiency on the steel surface over
time for both the original cell geometry and the cut edge mimic 129
Figure 4.2.1 - Images of steel surfaces following exposure to an uninhibited solution. a) - Pre-
wash, b) - Post-wash 138
Figure 4.2.2 - Images of steel surfaces following exposure to a zinc-rich uninhibited solution. a) -
Pre-wash, b) - Post-wash 138
Figure 4.2.3 – a) - A representative image of the steel surface after washing from the electron
microscopy. b) - A measured EDX spectrum representative of the surface shown on SEM, cut to
show observed elements 140
Figure 4.2.4 – Results obtained from exposure to electrolyte containing sodium chloride and zinc
chloride. a) - Electron microscope image showing the general structure of the surface without
visually detectable adhered deposits. b) - Electron microscope image showing the general
structure of the surface containing adhered deposit. c) – EDX spectrum showing the detectable
species in the adhered deposit. 142
Figure 4.2.5 - Images of steel surfaces following exposure to SAPP inhibited solution. a) - Pre-wash, b)
- Post-wash 143
Figure 4.2.6 - Images of steel surfaces following exposure to SAPP inhibited solution containing zinc. a)
- Pre-wash. b) - Post-wash 143
Figure 4.2.7 – a) - A representative electon microscopeimage of the steel surface exposed to a sodium
chloride solution containing strontium aluminium polyphosphate inhibitor pigment, after
washing. b) - A measured EDX spectrum representative of the surface shown on SEM, with the
observed element peaks labelled 145
Figure 4.2.8 – Results obtained for the sample exposed to an electrolyte containing sodium chloride,
SAPP inhibitor pigment and zinc chloride. a) - A representative image of the steel surface after
washing from the electron microscopy. b) - A measured EDX spectrum representative of the
surface shown on SEM, cut to show observed elements. 147
Figure 4.2.9 - Images of steel surfaces following exposure to CAPP inhibited solution. a) - Pre-wash, b)
- Post-wash 148
Figure 4.2.10 - Images of steel surfaces following exposure to CAPP inhibited solution containing zinc.
a) - Pre-wash, b) - Post-wash 149

6
Figure 4.2.11 – Results obtained for steel exposed to a sodium chloride solution containing the CAPP
inhibitor pigment. a) - A representative image of the steel surface after washing from the
electron microscopy. b) - A measured EDX spectrum representative of the surface shown on
SEM, cut to show observed elements 150
Figure 4.2.12 – Results obtained for steel exposed to a sodium chloride solution containing the CAPP
inhibitor pigment and zinc chloride. a) - A representative image of the steel surface after washing
from the electron microscopy. b) - A measured EDX spectrum representative of the surface
shown on SEM, cut to show observed elements 152
Figure 4.2.13 - Images of steel surfaces following exposure to MAPP inhibited solution. a) - Pre-wash,
b) - Post-wash 153
Figure 4.2.14 - Images of steel surfaces following exposure to MAPP inhibited solution containing zinc.
a) - Pre-wash, b) - Post-wash 153
Figure 4.2.15 – Results obtained for steel exposed to a sodium chloride solution containing the MAPP
inhibitor pigment in the absence of zinc chloride. a) - A representative image of the steel surface
after washing from the electron microscopy, showing a deposit (darker areas) alongside areas
where only iron and oxygen could be observed. b) - A measured EDX spectrum representative of
the surface shown on SEM, cut to show observed elements 155
Figure 4.2.16 - Results obtained for steel exposed to a sodium chloride solution containing the MAPP
inhibitor pigment and zinc chloride. a) - A representative image of the steel surface after washing
from the electron microscopy. b) - Measured EDX spectra representative of the particulate
surface shown on SEM. 157
Figure 4.2.17 - Results obtained for steel exposed to a sodium chloride solution containing the SAPP
inhibitor pigment and zinc chloride. a) - A representative image of the steel surface, after
washing, from the electron microscopy. b) - Measured EDX spectra representative of the surface
shown on SEM. 159
Figure 4.3.1 - An example wide scan XPS spectrum for a steel surface cathodically polarised and
exposed to a sodium chloride solution containing SAPP and 2 mM zinc chloride. 168
Figure 4.3.2 - High resolution, background-subtracted XPS spectrum of the region containing the
phosphorus 2p peak, showing samples obtained with and without zinc chloride. Spectra are
shown as obtained, i.e. without smoothing by deconvolution summation. 169
Figure 4.3.3 - An example survey scan XPS spectrum for a steel surface cathodically polarised and
exposed to a sodium chloride solution containing CAPP and 2 mM zinc chloride 171
Figure 4.3.4 - High resolution, background-subtracted XPS spectrum of the region containing the
phosphorus 2p peak, showing CAPP samples obtained with and without zinc chloride. Spectra
shown are summations of the deconvoluted spectra. 172
Figure 4.3.5 - An example wide scan XPS spectrum for a steel surface cathodically polarised and
exposed to a sodium chloride solution containing MAPP and 2 mM zinc chloride 173
Figure 4.3.6 - High resolution, background-subtracted XPS spectrum of the region containing the
phosphorus 2p peak, showing MAPP samples obtained with and without zinc chloride. Spectra
shown are summations of the deconvoluted spectra. 174
Figure 4.3.7 - Graph showing the concentrations of selected elements deposited on the steel surface,
as determined by X-ray photoelectron spectroscopy (M.S.E. – major secondary element(s)
including zinc, calcium and magnesium) 179
Figure 4.4.1 - An example wide scan XPS spectrum for a steel surface cathodically polarised and
exposed to a sodium chloride solution containing SAPP and calcium chloride. 185
Figure 4.4.2 - High resolution, background-subtracted XPS spectrum of the region containing the
calcium 2p peak. Spectra shown are summations of the deconvoluted spectra. 186
Figure 4.4.3 - High resolution, background-subtracted XPS spectrum of the region containing the
phosphorus 2p peak. Spectra shown are summations of the deconvoluted spectra. 187

7
Figure 4.4.4 - An example wide scan XPS spectrum for a steel surface cathodically polarised and
exposed to a sodium chloride solution containing CAPP and calcium chloride. 188
Figure 4.4.5 - High resolution, background-subtracted XPS spectrum of the region containing the
calcium 2p peak. Spectra shown are summations of the deconvoluted spectra. 189
Figure 4.4.6 - High resolution, background-subtracted XPS spectrum of the region containing the
magnesium 1s peak. Spectra shown are summations of the deconvoluted spectra. 190
Figure 4.4.7 - An example wide scan XPS spectrum for a steel surface cathodically polarised and
exposed to a sodium chloride solution containing SAPP and magnesium chloride. 191
Figure 4.4.8 - High resolution, background-subtracted XPS spectrum of the region containing the
magnesium 1s peak. The spectra displayed in this figure are as obtained without additional
processing. 192
Figure 4.4.9 - High resolution, background-subtracted XPS spectrum of the region containing the
phosphorus 2p peak. The spectra displayed in this figure are as obtained without additional
processing. 193
Figure 4.4.10 - An example wide scan XPS spectrum for a steel surface cathodically polarised and
exposed to a sodium chloride solution containing CAPP and magnesium chloride. 194
Figure 4.4.11 - High resolution, background-subtracted XPS spectrum of the region containing the
magnesium 1s peak. Spectra shown are summations of the deconvoluted spectra. 195
Figure 4.4.12 - High resolution, background-subtracted XPS spectrum of the region containing the
calcium 2p peak. Spectra shown are summations of the deconvoluted spectra. 196
Figure 4.4.13 - High resolution, background-subtracted XPS spectrum of the region containing the
phosphorus 2p peak. Spectra shown are summations of the deconvoluted spectra. 197
Figure 4.4.14 - An example wide scan XPS spectrum for a steel surface cathodically polarised and
exposed to a sodium chloride solution containing SAPP and both aluminium chloride. 198
Figure 4.4.15 - High resolution, background-subtracted XPS spectrum of the region containing the
phosphorus 2p and zinc 3s peaks. Spectra shown are summations of the deconvoluted spectra.
199
Figure 4.4.16 - An example wide scan XPS spectrum for a steel surface cathodically polarised and
exposed to a sodium chloride solution containing CAPP and both aluminium chloride. 200
Figure 4.4.17 - High resolution, background-subtracted XPS spectrum of the region containing the
calcium 2p peak. Spectra shown are summations of the deconvoluted spectra. 201
Figure 4.4.18 - High resolution, background-subtracted XPS spectrum of the region containing the
phosphorus 2p peak. Spectra shown are summations of the deconvoluted spectra. 202
Figure 4.4.19 - An example wide scan XPS spectrum for a steel surface cathodically polarised and
exposed to a sodium chloride solution containing SAPP and both calcium chloride and zinc
chloride at 1mM concentration. 203
Figure 4.4.20 - High resolution, background-subtracted XPS spectrum of the region containing the zinc
2p (3/2) peak. Spectra shown are summations of the deconvoluted spectra. 204
Figure 4.4.21 - High resolution, background-subtracted XPS spectrum of the region containing the
calcium 2p peak. The spectra displayed in this figure are as obtained. 205
Figure 4.4.22 - High resolution, background-subtracted XPS spectrum of the region containing the
phosphorus 2p peak. Spectra shown are summations of the deconvoluted spectra. 206
Figure 4.4.23 - An example wide scan XPS spectrum for a steel surface cathodically polarised and
exposed to a sodium chloride solution containing CAPP and both calcium chloride and zinc
chloride at 1 mM concentration. 207
Figure 4.4.24 - High resolution, background-subtracted XPS spectrum of the region containing the zinc
2p 3/2 peak. Spectra shown are summations of the deconvoluted spectra. 208

8
Figure 4.4.25 - High resolution, background-subtracted XPS spectrum of the region containing the
calcium 2p peak. The spectra displayed in this figure are as obtained without additional
processing. 209
Figure 4.4.26 - High resolution, background-subtracted XPS spectrum of the region containing the
phosphorus 2p peak. Spectra shown are summations of the deconvoluted spectra. 210
Figure 4.4.27 - High resolution, background-subtracted XPS spectrum of the region containing the zinc
3s (left, 140 eV)) and phosphorus 2p (right, 133 eV) peaks for the solution containing 0.1 mM zinc
chloride. The spectra displayed in this figure are as obtained. 212
Figure 4.4.28 - High resolution, background-subtracted XPS spectrum of the region containing the zinc
3s (left, 140 eV)) and phosphorus 2p (right, 133 eV) peaks for the solution containing 0.5 mM zinc
chloride. The spectra displayed in this figure are as obtained 213
Figure 4.4.29 - High resolution, background-subtracted XPS spectrum of the region containing the zinc
3s (left, 140 eV)) and phosphorus 2p (right, 133 eV) peaks for the solution containing 1 mM zinc
chloride. The spectra displayed in this figure are as obtained. 214
Figure 4.4.30 - High resolution, background-subtracted XPS spectrum of the region containing the zinc
3s (left, 140 eV)) and phosphorus 2p (right, 133-134 eV) peaks for the solution containing 4 mM
zinc chloride. The spectra displayed in this figure are as obtained. 215
Figure 4.4.31 - High resolution, background-subtracted XPS spectrum of the region containing the zinc
3s (left, 140 eV)) and phosphorus 2p (right, 133 eV) peaks, showing a comparison of the 12 hour
exposure times for each of the zinc concentrations measured. The spectra displayed in this figure
are 216
Figure 5.2.1 - Schematic representation of the geometry of the three working electrode setup utilised
(1 – steel, 2 – zinc, 3 – aluminium, R – reference) 229
Figure 5.3.1 - The split cell potentiodynamic polarisation graph for the three electrode system in an
uninhibited solution 230
Figure 5.3.2 - The split cell potentiodynamic polarisation graph for the three electrode system in a zinc
molyphosphate inhibited salt solution 231
Figure 5.3.3 - The split cell potentiodynamic polarisation graph for the three electrode system in an
calcium exchanged silica inhibited salt solution 232
Figure 5.3.4 - The split cell potentiodynamic polarisation graph for the three electrode system in a zinc
molyphosphate and calcium exchanged silica mixed inhibitor salt solution 233
Figure 5.3.5 - The split cell potentiodynamic polarisation graph for the three electrode system in a
strontium chromate inhibited salt solution 234
Figure 5.3.6 - The split cell potentiodynamic polarisation graph for the three electrode system in a
strontium aluminium polyphosphate inhibited salt solution 235
Figure 5.3.7 - The split cell potentiodynamic polarisation graph for the three electrode system in a
calcium aluminium polyphosphate inhibited salt solution 236
Figure 5.3.8 - The split cell potentiodynamic polarisation graph for the three electrode system in a
magnesium aluminium polyphosphate inhibited salt solution 237
Figure 5.3.9 - A comparison of the potentiodynamic polarisation measurements for overall system in
each of the inhibitor solutions measured 238
Figure 5.3.10 - Selected Nyquist plots obtained for the steel surface in an uninhibited 0.6M sodium
chloride solution for the three electrode system 239
Figure 5.3.11 - Selected Nyquist plots obtained for the zinc surface in an uninhibited 0.6M sodium
chloride solution for the three electrode system 240
Figure 5.3.12 - Selected Nyquist plots obtained for the aluminium surface in an uninhibited 0.6M
sodium chloride solution for the three electrode system 240

9
Figure 5.3.13 - Selected Nyquist plots obtained for the steel surface in a saturated strontium
aluminium polyphosphate inhibited 0.6M sodium chloride solution for the three electrode
system. 241
Figure 5.3.14 - Selected Nyquist plots obtained for the zinc surface in a saturated strontium aluminium
polyphosphate inhibited 0.6M sodium chloride solution for the three electrode system. 242
Figure 5.3.15 - Selected Nyquist plots obtained for the aluminium surface in a saturated strontium
aluminium polyphosphate inhibited 0.6M sodium chloride solution for the three electrode
system. 243
Figure 5.3.16 - Selected Nyquist plots obtained for the steel surface in a saturated calcium aluminium
polyphosphate inhibited 0.6M sodium chloride solution for the three electrode system. 244
Figure 5.3.17 - Selected Nyquist plots obtained for the zinc surface in a saturated calcium aluminium
polyphosphate inhibited 0.6M sodium chloride solution for the three electrode system. 244
Figure 5.3.18 - Selected Nyquist plots obtained for the aluminium surface in a saturated calcium
aluminium polyphosphate inhibited 0.6M sodium chloride solution for the three electrode
system. 245
Figure 5.3.19 - Selected Nyquist plots obtained for the steel surface in a saturated magnesium
aluminium polyphosphate inhibited 0.6M sodium chloride solution for the three electrode
system. 246
Figure 5.3.20 - Selected Nyquist plots obtained for the zinc surface in a saturated magnesium
aluminium polyphosphate inhibited 0.6M sodium chloride solution for the three electrode
system. 247
Figure 5.3.21 - Selected Nyquist plots obtained for the aluminium surface in a magnesium aluminium
polyphosphate inhibited salt solution for the three electrode system. 248
Figure 5.4.1 - Representative equivalent circuit used for the analysis of most electrochemical
impedances obtained on the surface of aluminium. 255

10
Abstract The replacement of hexavalent chromium corrosion inhibitors from paints is an important
venture due to the effects of those compounds on the environment and detrimental health
effects. The procedure of replacement is made more urgent by imminent changes on the
legality of using these compounds within the European Union. Whilst replacements have been
devised, in many cases these replacements are less versatile, less effective and their
mechanisms less understood.
In aid of this, a methodology was produced that allows some understanding of the potential of
an inhibitor on complex metallic systems, without the time restraints involved with more
traditional methods, such as atmospheric testing. This methodology, simultaneous
electrochemical impedance, utilises multiple zero resistance ammeters attached to a single
overriding potentiostat to gain electrochemical information on multiple metals whilst
maintaining the mixed potential of the coupled system, and was verified using previously
defined inhibitor systems.
Three commercial polyphosphate inhibitors were analysed using this technique and were
shown to have distinct behaviours on a simple steel/zinc couple. Strontium aluminium
polyphosphate exhibited a delayed inhibition response which was absent when the distance
between working electrodes was decreased, which was theorized to be due to the mechanism
of action requiring the presence of anodically produced zinc ions. This was tested and
confirmed through an x-ray photoelectron spectroscopy study which externally introduced zinc
ions and showed an increase in the phosphorus content seen on the steel surface. The
concentration of externally added zinc required for this effect was tested and determined to
be approximately between 1 and 2 mM.
Subsequently, alternative cationic species were added to determine whether the efficacy of
the phosphorus surface deposition could be potentially improved through other in-paint
additives. Calcium was shown to be effective, with magnesium showing some effect on
strontium aluminium polyphosphate. Aluminium cations appeared to have little effect.
Additionally, the use of the simultaneous electrochemical impedance methodology was shown
to have some use in analysing even more complex materials with a zinc/steel/aluminium
model. The use of pure aluminium may cause some issues in analysis due to the protective
oxide layer. Magnesium aluminium polyphosphate results suggest that it may initially interfere
with this oxide layer production.

11
Declaration The author declares that no portion of the work presented here has been submitted in support
of an application for another degree or qualification of this or any other University
Copyright Statement The ownership of certain Copyright, patents, designs, trademarks and other intellectual
property (the “Intellectual Property”) and any reproductions of copyright works in the thesis,
for example graphs and tables (“Reproductions”, which may be described in this thesis, may
not be owned by the author and may be owned by third parties. Such Intellectual Property and
Reproductions cannot and must not be made available for use without the prior written
permission of the owner(s) of the relevant Intellectual Property and/or Reproductions.

12
Acknowledgements Whilst a thesis can be considered to be the celebration and accumulation of the research
accomplishments of an individual, it is certain that it would not be possible without the
support of those who surround us. As such, I would like to use this section to personally thank
those people who have aided over the last several years.
To Professor Stuart Lyon and Dave Francis, as supervisors of the academic and industrial parts
of the project respectively, who have been vital in keeping the project from becoming
unmanageable and unwieldy. Both important beacons of guidance throughout the entire
process, and without whom this piece of work would not be what it is today.
To Dr. Suzanne Morsch, with whom I have shared an office as desk neighbour, for being an
ever-present sounding board and one of the greatest outlets for unscrambling thoughts and
producing sensible ideas and plans.
I would also like to acknowledge, for the support offered, the members of the AkzoNobel
laboratory team: Reza Emad, Zoe Keffalinou, Nick Curry, Monika Walczak, Matthew Goodall,
Yanwen Liu, Kiran Kousar and Wei Shi.
Finally, I would like to dedicate this thesis to my parents, Gary Wake and Jennifer Farren,
whom without their support I would not be in the position to submit it. And, to my girlfriend
Nicola Neale, whose endless patience and moral support has allowed me to complete it.

13
1 Chapter 1 – Literature Review
Chapter 1
Literature Review

14
Introduction 1.1
The works presented in this thesis were carried out to investigate the effects of corrosion
inhibitor pigments on the cut edges of coil coated materials. In this literature review, the
concepts, methods and materials utilised throughout the thesis will be introduced, and an
overview and critical analysis of previously published research within these areas will be
presented.
Corrosion Fundamentals 1.2
Introduction to Corrosion
Corrosion is defined as the ‘physicochemical interaction between a metal and its environment
that results in changes in the properties of the metal, and which may lead to significant
impairment of the function of the metal, the environment, or the technical system, of which
these form a part[1].’ (ISO 8044-1999). This process occurs electrochemically, with an
oxidation reaction occurring at anodic sites and balancing reduction reactions occurring at
cathodic sites.
The particular electrochemical process that occurs at a metal surface is dependent on both the
environment and the metal itself. Susceptibility of a metal or system to different corrosion
phenomena are determined by a combination of these two factors. Later sections will deal
with the corrosion behaviour of certain individual metals.
Both oxidation and reduction have multiple pathways which can be represented by chemical
half-equations. A common oxidation reaction that is observed at the anode can be expressed
by the general equation[2]:
where M is a metallic element, and n is the number of electrons removed from the element,
which is dependent on the valency of the metal. The positively charged atom can then solvate

15
into the surrounding electrolyte as an ion, or react with other species present within the
environment to form insoluble corrosion products[3].
The dissolution of the anodic site, as represented by the previous chemical half-equation, is
very common. However, this does not occur in cases where the anodic site is inert. In this case,
other reactions must take place to balance any cathodic activity. Commonly, this occurs
through the oxidation of anionic species in solution, or, alternatively, through the release of
oxygen. Examples of chemical half-equations representing these processes are:
The electron transfer shown in the oxidation half-equation is balanced by a reduction reaction,
which occurs at the cathodic site on the material. There are several reactions that can occur at
the cathode. Of these, the simplest is metal deposition, also known as replating, which is
effectively a reversal of the anodic dissolution process shown previously. This can be
represented by the following equation[2]:
The particular reduction reaction that takes place at the cathodic site is dependent on factors
such as the surface potential and local environmental effects. The oxygen reduction reaction is
a common reaction seen at the cathode. The particular pathway for this reaction to occur is
dependent on the environment, with two possible half-equations:[2]
(Acidic solutions)
(Basic/Neutral solutions)

16
In the absence of a sufficient concentration of oxygen dissolved in solution, the reduction of
hydrogen can occur[4]:
In some cases, the anodic process can provide enough energy to electrolytically split water at
the cathode. This most often occurs in situations where there is a reactive metal, such as
magnesium, aluminium or zinc, and the concentration of dissolved oxygen is sufficiently low
enough to limit oxygen reduction[5].
Corrosion can only occur when a complete cell is formed. This consists of a conductive
electrolyte, an anodic site, a cathodic site and an electric bridge between anode and cathode.
An electric bridge can be formed through either direct contact between the two sites, or
through other means such as a wire. The electrons released at the anode spontaneously travel
to the cathode to allow the cathodic reaction to occur[6]. Therefore, to maintain balance, one
cannot happen without the other.
Thermodynamics of Corrosion Free Energy The likelihood of a particular reaction occurring is governed by Gibbs free energy, which is
represented in electrochemical reactions by the equation given below[7].
Where ΔG is the change in Gibbs free energy, n is the number of electrons transferred in the
reaction, F is the Faraday constant and E is the potential of the reaction.
For a reaction to be favourable, the ΔG for the process will be negative. Corrosion is, in the
case of most metals, a thermodynamically favourable process. This is due to the relatively high
energy state of the base metal when compared to the oxide forms, and it is this energy

17
difference that drives corrosion[3]. This is also the reason that metals are naturally found
within ore, where energy must be expended to isolate the metal. As can be seen in Figure
1.2.1, the metal exists in a higher energy state than that of the corrosion products[3].
Therefore, the free energy of the metal can be significantly reduced by being corroded, and
thus there is, in most cases, a thermodynamic driving force for corrosion.
Figure 1.2.1 - An energy diagram representative of a generic metal and the products of
corrosion
However, in spite of this thermodynamic driving force, metals are capable of existing as free
metal. The stability of metals can be explained by ΔG‡, the free energy of activation, which
represents an energy barrier for the corrosion reaction. This ensures that corrosion is not a
completely spontaneous process in reality.

18
Nernst Equation An electrochemical reaction can be also be represented in its entirety by the Nernst
equation[3].
In the Nernst equation, E is the potential of the cell, specific to the conditions as measured. E0
is the standard potential of the cell, which is a measure of the potential of a reversible cell at
standard state. R is the ideal gas constant (8.314 J K-1 mol-1), T is the absolute temperature, z is
the number of electrons transferred in the corrosion reaction and F is the Faraday constant
(approximately 96,494 C mol-1). K is the equilibrium constant for the reaction being
investigated, which is dependent on the concentrations of the products and reactants.
The standard electrode potential, E0, is the characteristic activity of a reversible electrode in
standard conditions, which means the potential measured with solutes at an effective
concentration of 1 mol dm-3 and gasses at a pressure of 1 atm. This standard measurement can
be used to represent the electrochemical activity of particular elements, as elements with
higher standard electrode potentials can be considered to be less active, or more noble, than
those with lower or negative standard electrode potentials[7]. It is this which is the basis
behind the electrochemical series. Standard electrode potentials are given with reference to
the standard hydrogen electrode, which is defined as having 0 potential[7].
The measurement of the potential of individual electrodes is, however, impractical.
Experimentally, only the difference in potentials between two electrodes can be measured.
The need for accuracy means the use of a reference electrode. A reference electrode is used in
determining the potential of a cell by providing a well-defined standard potential for
comparing all other electrodes with. Several reference electrodes have been developed for use
in electrochemical experiments. A common reference electrode is the saturated calomel

19
electrode, a mercury/mercury chloride electrode containing saturated potassium chloride that
has a potential of +0.245 V when compared to the standard hydrogen electrode[8].
Pourbaix Diagrams
pH-overpotential diagrams, also known as Pourbaix diagrams, were first introduced in the
1940s by Marcel Pourbaix[9]. These diagrams show a representation of the most
thermodynamically stable forms of a particular metal over a 2 dimensional range of pH values
and applied potentials. A simplified Pourbaix diagram, however, only shows distinct areas of
how the metal behaves in the particular environment. There are three distinct areas:
immunity, where the metal remains unchanged in the system, passivation, where the metal is
reacted but forms a protective surface layer, and corrosion, where general attack of the
surface can occur[9]. A simplified Pourbaix diagram for iron is shown in Figure 1.2.2.
Figure 1.2.2 – A simplified Pourbaix diagram for iron

20
Whilst there are certainly uses for the information that can be obtained by analysis of Pourbaix
diagrams, specifically the general usefulness of a material in a particular environment, it is
somewhat limited. Whilst a Pourbaix diagram will give information on thermodynamic stability
of a material in specific environments, it gives no details about the kinetics of those reactions.
This means that the actual rate of a particular corrosion reaction, a property which is also
significant, cannot be considered through the use of Pourbaix diagrams alone.
Kinetics of Corrosion Tafel Equation As previously mentioned, the electrochemical reactions that take place during corrosion
cannot occur unless there are electrochemically equivalent reactions occurring simultaneously.
As such, it can be expected that the rate of oxidation is equivalent to the rate of reduction[3].
It is therefore also the case that when a metal begins to corrode, there must always be an
oxidation process and a reduction process. The potential observed for a sample undergoing
these processes would be observed as a combination of the two, and would therefore lie
between. Therefore, plotting the intersection of the anodic and cathodic processes provides
the Ecorr, which is the free corrosion potential, and icorr, the corrosion current density[2].
In the early 1900s, Tafel discovered that the logarithm of current density of a reaction taking
place in an electrochemical cell varies linearly with potentials lying away from the open circuit
potential[3]. The equation describing the relationship is known as the Tafel equation, and is as
shown below:
Plotting a graph of η vs. log|i|, therefore, gives a graphical representation of the effect of
overpotential on current density. This can be used as a way of determining the open circuit
potential, Ecorr.

21
Figure 1.2.3 - A Tafel plot showing the variation in current with overpotential
As can be seen in Figure 1.2.3, there is a deviation from linearity as α approaches 0. This is due
to the fact that the reaction occurring in the opposite direction becomes non-negligible at very
low values of α[10]. There are also deviations from the linear path at the upper and lower
limits of η. This is because the reaction at these values becomes limited by the ability for mass
to be transferred at a sufficient rate[11].
Diffusion
Diffusion plays an important part in determining how corrosion occurs. As previously
mentioned, metals have a thermodynamic tendency toward corrosion when immersed in
electrolyte, and thus it can be considered that corrosion occurs readily upon immersion[3].
However, the onset of corrosion has the effect of lowering the thermodynamic demand for

22
corrosion. This is due, in part, to Le Chatelier’s principle, where a system will react to oppose
changes in the equilibrium position of the system[3].
The formation of the Helmholtz double layer is partially responsible for the lowering of the
corrosion rate. As metal ions solvate, the surface is left with a net surplus of electrons. This
surface charge maintains an attraction to the solvated cationic species, hindering diffusion
away. In time, the surface has a strong electrostatic interaction with an adjacent volume of
solution containing a high concentration of solvated ions[3]. As a result, the tendency for the
surface to solvate is reduced, and thus, the rate of corrosion is lowered. In some cases, this
may eventually lead to equilibrium between the dissolution process and replating process[12].
The phenomenon of concentration polarisation is also a result of diffusion. If it is considered
that the cathodic component of a cell is the oxygen reduction reaction, then through the
application of a cathodic overpotential, the thermodynamic driving force for this reaction, and
consequently the rate of the reaction, can be increased. It can be asserted, however, that the
highest rate that this reaction is capable of is limited by the amount of oxygen that is present
at the cathode surface to be reduced. In this way, the resulting current from the cathode is
limited to the rate at which oxygen can diffuse to the surface[13]. This is known as the
diffusion limiting current density.
Passivity Metals that are closer to the top of the electrochemical series as it is traditionally arranged are
expected to be more prone to corrosion than those considered to be less active. However, this
is not always the case. Some metals with active electromotive forces can corrode at a low rate
when exposed to certain conditions[14]. This is due to a phenomenon known as passivity.
Passivity occurs when the thermodynamic product of a reaction between the metal and
components of the environment forms a solid material on the surface that exists as a
continuous and adherent film which remains insoluble within the surroundings. A common

23
example of this is aluminium, which, when exposed to the air, will form a protective oxide
layer that slows the rate of corrosion[14]. Similarly, passivity is observed on stainless steels, in
which the chromium alloying additions form a protective chromium oxide layer on the
surface[15]. In a previous section, it could be seen that the simplified Pourbaix diagram for iron
shows passivity in areas of applied anodic current and alkaline environments.
Passivity may not always significantly hinder corrosion processes, however, as the effect that
the formation of a surface film is dependent on the properties of that film. Taking into
consideration the formation of chromium oxide on the surface of stainless steels, it can be
seen that due to the electrical conductivity of the chromium oxide layer, cathodic processes
may still occur at the surface. However, the dissolution of iron is hindered by the presence of
chromium oxide, due to the interference with diffusion. Thus the passivation in this case can
be considered to be hindering just anodic processes[16].
Forms of Corrosion
How corrosion proceeds is dependent on a number of factors. There are a number of different
corrosion processes, and the susceptibility of a system to these processes is dependent on
both the metal and the environment in which it is contained.
Uniform Corrosion
Uniform corrosion, also known as general attack corrosion, is a process which leads to
reasonably even dissolution across the metallic surface[17]. The characteristic sign of uniform
corrosion is a general reduction in the thickness of the material that is approximately evenly
distributed. Two common examples of this process are seen in the degradation of
unprotected iron in the atmosphere and the tarnishing of silver[17].
Due to the nature of uniform corrosion, the amount of time before it becomes an issue from a
mechanical properties standpoint can often be well predicted and measured[17]. Thus,
monitoring the progression of this corrosion process generally requires only basic techniques.

24
However, uniform corrosion can prove to be problematic, particularly when dealing with the
aesthetics of materials. The nature of uniform corrosion means that most developed corrosion
protection strategies can be utilised.
However, it is worth noting that uniform corrosion can never be truly uniform. As corrosion is a
stochastic process, in that both cathodic and anodic processes must occur at the same time
with the same magnitude but never at the same site. This fact can give rise to intrinsic variance
that causes non-uniform attack on the surface.
Galvanic Corrosion
Galvanic corrosion is the preferential dissolution of one material over another. This occurs
when two dissimilar metals come into electrical contact with each other whilst exposed to an
electrolyte, causing a current to flow between the two. This current flows from the metal with
the lower electromotive force, which becomes the anode, to that with the higher, which
becomes the cathode. This happens as the potential difference between the two metals causes
each to assume a different corrosion potential. This, in effect, leads to the anodic and cathodic
polarisation of the constituent parts[18].
Galvanic corrosion is often perceived as occurring between two distinct pieces of metal, either
through metal coatings or other attached metal blocks. However, galvanic corrosion occurs
even without such well-defined dissimilar metals. For example, it is also possible for the
corrosion products of a material to form a galvanic couple. This is particularly problematic in
some applications where the corrosion products of one metal may leave the surface and be
deposited on another metal. When this happens, there is the potential for a small galvanic cell
to develop that can lead to severe corrosion around the point of deposition[19].
The risk of galvanic corrosion is increased when there is a greater difference between the
electromotive forces of the two materials in the environment in which they are exposed.
However, greater risk of galvanic activity does not necessarily equate to a greater rate of

25
galvanic corrosion, as other factors, such as tendency to passivate, must also be taken into
account[20].
The rate of galvanic corrosion can be affected by various parameters, besides the properties of
the selected metals. One such consideration is the ratio of the exposed areas of the anode and
cathode. In situations where the cathodic area far exceeds that of the anodic area, the
corrosion rate of the anodic material may see a notable increase; even in cases where the
potential difference between the anodic and cathodic materials is low[21].
Differences in material geometry and electrolyte properties can also have an effect on the rate
of galvanic corrosion. For example, in conditions where the electrolyte is sparingly conductive,
and there is a significant pathway between the two coupled materials, a drop in the potential
of the couple is observed. This is due to the increased resistance that is imparted by the
electrolyte[21].
Temperature also has an effect on the rate of galvanic corrosion. Typically corrosion rate will
increase with increasing temperature. However, there are cases where the cathodic and
anodic sites will switch following temperature changes. For example, the couple of zinc and
iron has been reported to switch in some electrolytes at higher temperatures due to the
ennoblement of zinc by corrosion products[21]. Temperature gradients on single metals can
also cause galvanic corrosion to occur, with areas differing in temperature becoming anodic or
cathodic to the rest of the material[21].
Localised Corrosion
Pitting and crevice corrosion are two distinct forms of localised corrosion in which a particular
site on the substrate surface is subjected to corrosive attack at a rate that is significantly higher
than that of the rest of the surface. This is due to the development of a microenvironment at
the site of corrosion which differs greatly to the bulk electrolyte. The underlying cause of this
microenvironment is the distinguishing factor between crevice corrosion and pitting.

26
Pitting occurs in systems where there is a surface protection of the substrate, through either
the use of corrosion inhibitors or the self-passivation of metals such as stainless steels or
aluminium[6]. Pits initiate at a point where the surface protection breaks down, despite being
in conditions in which the bulk material remains protected.
For pitting to initiate, there must be the development of a corrosive microenvironment. For
example, in chloride containing environments, the microenvironment local to the pit can be
acidified due to the formation of hydrochloric acid at the site. This is caused by the hydrolysis
of metal chloride complexes. Chloride ions are attracted to the pit from the high concentration
of counterions from anodic dissolution of the bulk metal, which in turn produces metal
chloride complexes. The hydrolysis of these complexes produces free hydrochloric acid at the
pit through reactions such as the following[20].
Whilst pitting can be considered to be initiated through a combination of metallurgical and
solution properties, crevice corrosion occurs as a result of geometrical factors of the materials
which cause an environment to be shielded or restricted. A shielded environment can cause
the lowering of the rate of diffusion of dissolved species in the bulk electrolyte to the local
environment[21].
As this can restrict the diffusion of dissolved oxygen to metal sites in the crevice, cathodic
processes in this environment are suppressed. This leads to metal within the crevice to assume
a more anodic character than the rest of the material, leading to a greater rate of anodic
dissolution. The increased anodic activity within the crevice can aid the diffusion of chloride
ions into the crevice through providing a greater concentration of counter ions. Through
reactions similar to those mentioned for the propagation of pitting, the corrosion rate within
the crevice is then increased[20].

27
Filiform Corrosion
Filiform corrosion is a type of corrosion that produces filament-like corrosion products. It
occurs most commonly on samples that have thin coating layers, although it has been
observed on bare substrates[6]. It has been shown to occur in high humidity environments,
and is particularly prevalent with some salts and on certain metallic substrates. Considered to
mainly be an aesthetic issue, it does not generally make significant changes to the strength of
the bulk material.
It is considered to contain a small anode at the head, with an electrolyte containing tube
running behind it, with the mechanism of propagation being similar to that of crevice
corrosion[22]. Figure 1.2.4 shows the proposed mechanism of filiform corrosion as it proceeds
under an organic film.
Figure 1.2.4 - Proposed structure of a filament in filiform corrosion[23].
Filiform is a commonly observed form of corrosion of aluminium alloys, and the presence of
filiform corrosion on aluminium alloys[24,25] and inhibiting filiform corrosion of aluminium
alloys[26,27] is well documented. However, there are some reports of filiform corrosion
present on steels[28,29], and of particular interest, galvanised steels[30].
It could be suggested that the added inclusions of aluminium into the zinc coatings of
galvanised steels may produce coatings that are more susceptible to this form of degradation.
Whilst not much research suggests filiform corrosion occurring on zinc-coated and zinc alloy-

28
coated steel materials, a paper by Luckeneder et al[31] reports anecdotal evidence of “filiform-
like” corrosion in zinc-aluminium alloys from industrial sources.
Dealloying
Dealloying is a corrosion process where one metallic constituent of an alloy is removed
preferentially. Galvanic currents generated between two of the constituent metal parts of the
alloy is the major reason behind dealloying, although other factors do still have an effect[32].
Dealloying occurs in two distinct ways. The first is through uniform dealloying, which entails
the selective dissolution of a particular phase that occurs at a similar rate across the surface of
the material. Alternatively, dealloying can be localised, where the selective dissolution occurs
with greater severity at particular parts of the material[21].
A common example of dealloying is in brass. Brass is a copper-zinc alloy containing between 15
and 40 wt% of zinc. Due to the difference in electrode potential of zinc and copper, zinc
corrodes preferentially as it is an anodic when coupled to the copper[33]. This results in
general dissolution of the zinc rich phases in the brass alloy, leading to a porous structure that
loses all structural strength. The dealloying of brass is more commonly known as
dezincification.
Dealloying has been reported to occur in the corrosion of some alloy coatings used in the coil
coating industry. Sullivan et al[34] were able to observe the dealloying of eutectic phases
within zinc magnesium aluminium ternary alloy structures in-situ using time lapse optical
microscopy. This was independently observed by Volovitch et al[35], who speculated that the
inactivity of aluminium is due to the naturally protective oxides forming on aluminium phases.
By using atomic emission photoelectron spectroscopy, Salguiero Azevedo et al[36] were also
able to confirm dealloying phenomena in zinc magnesium aluminium alloys, but noted that the
mechanisms and phases that were preferentially dissolved was dependent on the
environment.

29
Corrosion of Iron and Steels
The corrosion of iron is a significant problem that is well identified on a global scale. Iron oxide,
or rust, present on an iron or steel surface is one of the most recognisable products of a
corrosion process, and the prevention of this has been a source of research for several years.
Many of the problems arising from the corrosion of iron come from the ability of iron to be
readily oxidised and reduced depending on the environment.
Iron corrosion occurs generally with the metal taking the form as both the anode and the
cathode, although in some cases, other materials can act as cathodes when in contact with the
iron surface. The dissolution of iron at an anodic site on the metal proceeds as mentioned
previously:
The iron ions in solution can then react with cathodically produced hydroxide ions to form an
adherent iron (II) hydroxide precipitate on the surface[37].
This iron (II) oxide forms a barrier layer between the free iron surface and the environment, of
which oxygen must diffuse through. However, in the presence of oxygen, this iron (II)
hydroxide product can be further oxidised from iron (II) to form iron (III) products, such as iron
(III) oxide, hematite, or iron (III) hydroxide, which are the more characteristic compounds
noted on rusty surfaces[38].
Whilst there are many different forms of rust that can appear on an iron surface, an oxidising
environment will generally result in the production of iron (III) oxide and oxide-hydroxide

30
hybrids on the surface, with an iron (II) oxide lower layer. However, this is dependent on the
impurities present within the environment, which can have an effect on the overall corrosion
chemistry of iron. Figure 1.2.5 is an example of a potential-pH diagram for iron.
Figure 1.2.5 - A Pourbaix diagram showing the states of iron for different potentials and pH values
Corrosion of Zinc
Zinc is thermodynamically unstable in both pure water and aqueous solutions, meaning that it
will dissolve over a wide range of pHs, and tends to evolve hydrogen upon dissolution. Its
chemistry is dominated by the divalent form, and therefore the dissolution of zinc can be
considered to be as follows[39]:

31
Or the aided dissolution using protons in solutions[40]:
Zinc hydroxide, , is a commonly formed product of zinc dissolution in aqueous media.
It is amphoteric, which means that it is generally soluble in both acidic and alkaline
environments. However, there is the possibility for the formation of an adherent zinc
hydroxide layer at specific alkaline pHs, generally between 9 and 13, which can be considered
protective[39].
Zinc is capable of forming many insoluble compounds with commonly observed chemicals, and
can have an effect on the corrosion rate of zinc in various environments. Zinc carbonate, in
particular, has been found to be instrumental in the corrosion resistance exhibited by zinc in
atmospheric conditions.
Figure 1.2.6 shows a common example of a potential-pH diagram for zinc. This shows the large
potential range where zinc is most stable in solution, and also the range of potentials (mildly
alkaline conditions) where solid zinc oxide is the most stable, which is why zinc ions can
precipitate at cathodic sites.

32
Figure 1.2.6 - A Pourbaix diagram showing the states of zinc for different potentials and pH values
Cost of Corrosion 1.3Deterioration due to corrosion can lead to a range of problems that range in severity; from
aesthetic issues to major structural damage. As such, it is an issue that must be taken into
account, particularly when using metals as materials. Certainly, considerable thought has been
directed towards quantifying the drain that corrosion has on the economy.
Several reports have been published on the subject of corrosion cost. H.H. Uhlig’s report from
1949 on the cost of corrosion in the United States was one of the first to portray the
magnitude of the economic impact of corrosion, estimating direct losses due to corrosion at
around 5.5 billion dollars[41]. Direct losses refer to the cost that arises from replacement and
reconditioning of corroded parts, as well as the cost of using more corrosion resistant
materials where the mechanical properties of cheaper materials may be sufficient[41].

33
Whilst direct losses are considered to be somewhat simple to quantify, they are not
responsible for all costs that can be attributed to corrosion. Indeed, there are considerable
losses that are a consequence of the material degradation beyond the material itself[42].
These are referred to as indirect losses.
There are several incidents that can account for indirect losses. Whilst significant, these can be
difficult to quantify. As a result, reports that take into account indirect losses use estimations
for the financial implications of indirect losses. These include lost revenue through equipment
downtime during maintenance on corroded parts, losing product through damaged piping or
containers, contamination of products with corrosion material that can lead to the need for
batch disposal and facility overdesign to deal with unpredictable or unknown corrosion activity
in some cases[42].
However, whilst “cost” often has a financial implication, there are other consequences of
corrosion that can be considered to be costly but are unable to be financially quantifiable.
There is the potential for problems affecting the environment to arise due to corrosion. This
can be through the release of dangerous chemicals through damaged components, or the
need to remove natural resources to replace corrosion affected parts[43]. The loss of integrity
in structure critical components can lead to situations that may result in injury or in some
cases death[43].
Following the increased awareness of the issues of corrosion, case studies have been taken to
determine the cost of corrosion specifically to certain industries. It has been calculated that
the direct cost to the paper and pulp industry in India alone of corrosion is approximately £1.5
million per annum[44], where the application of one particular preventative measure could
potentially save nearly 10% of this cost annually.
34
A case study of an African oil rig showed a similar annual cost due to corrosion, with product
deferment, an indirect cost of corrosion, considered to be the largest contributing factor to the
overall cost[45]. A study carried out in 2004 on the financial impact of corrosion on the Indian
fertilizer market saw an extrapolated annual corrosion cost of just over $900,000. The
projected potential savings for this industry was small, and the overall annual cost is lower
than the projected costs in a previous study[46]. This suggests that the successful
implementation of corrosion preventative strategies can have a noticeable impact on the
financial implications of corrosion.
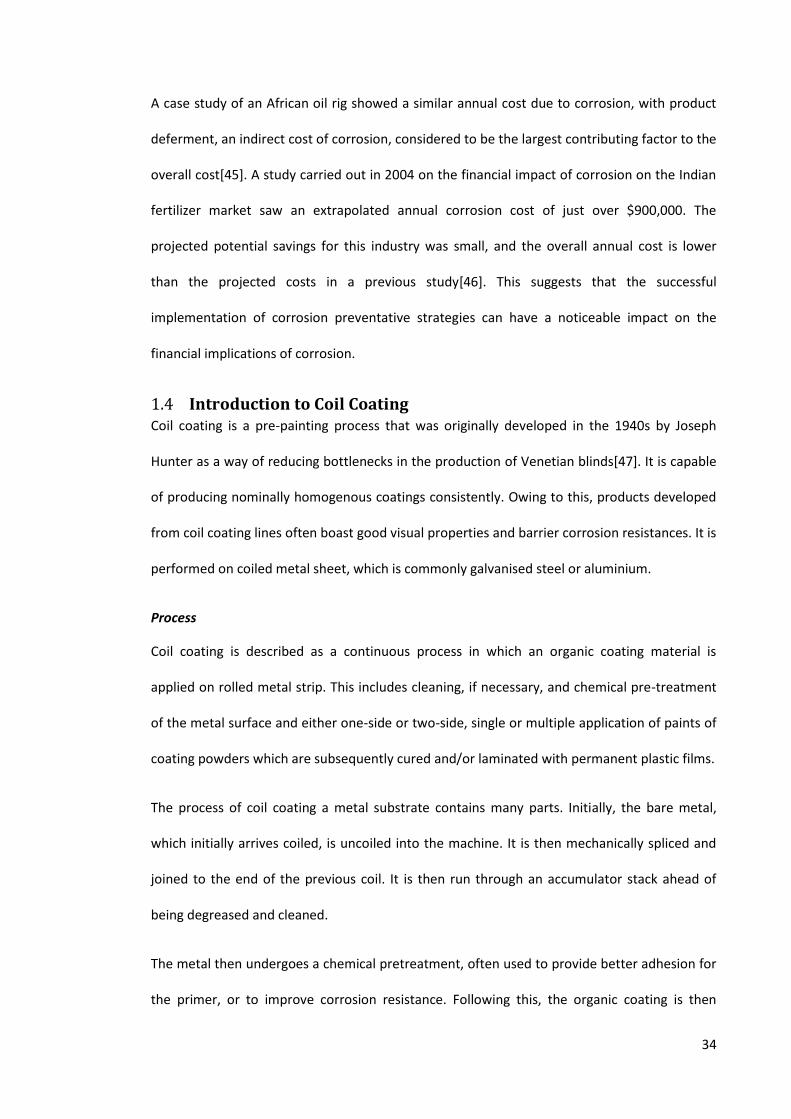
Introduction to Coil Coating 1.4Coil coating is a pre-painting process that was originally developed in the 1940s by Joseph
Hunter as a way of reducing bottlenecks in the production of Venetian blinds[47]. It is capable
of producing nominally homogenous coatings consistently. Owing to this, products developed
from coil coating lines often boast good visual properties and barrier corrosion resistances. It is
performed on coiled metal sheet, which is commonly galvanised steel or aluminium.
Process
Coil coating is described as a continuous process in which an organic coating material is
applied on rolled metal strip. This includes cleaning, if necessary, and chemical pre-treatment
of the metal surface and either one-side or two-side, single or multiple application of paints of
coating powders which are subsequently cured and/or laminated with permanent plastic films.
The process of coil coating a metal substrate contains many parts. Initially, the bare metal,
which initially arrives coiled, is uncoiled into the machine. It is then mechanically spliced and
joined to the end of the previous coil. It is then run through an accumulator stack ahead of
being degreased and cleaned.
The metal then undergoes a chemical pretreatment, often used to provide better adhesion for
the primer, or to improve corrosion resistance. Following this, the organic coating is then

35
applied. This is often done in multiple steps as appropriate for the application, with primer, top
coat and lamination all applied and cured separately and as appropriate. It is important to note
that due to the speeds that the metals go through this line (the coil is capable of reaching
speeds in excess of 3 metres per second), the coatings must be able to be cured at high
temperatures for short periods[48].
Following this procedure, the coated metal is then run through an exit accumulator stack
before being recoiled and shipped. Figure 1.4.1 shows an example of how a coil coating line
may be set up[47].
Figure 1.4.1 - A visual representation of a coil coating line[47]
Issues
Changes in and around the coil coating industry, occurring both in the recent past and
imminent future, is driving research within the area. Firstly, the galvanized steel substrate that
is generally used in the coil coating process has been gradually modified over the course of the
last half century. Companies that produce the substrate have been moving away from
traditional hot dip galvanised steels and towards more complex zinc alloys that are either
cheaper or considered to provide greater corrosion protection.

36
Secondly, European Union legislations have been introduced that outline the timeframe for a
region-wide ban on the use of hexavalent chromium compounds. Chromates are widely used
as corrosion inhibitors as they are effective and are capable of working over a wide range of
conditions and are commonly used in coil coating formulations.
The combination of these issues is particularly problematic when considering protection at cut
edges. The cut edge is an inherent defect within coil coated materials that is produced on the
machining of the material into the final product, leading to the exposure of bare substrate.
Attack at this vulnerability is known as cut edge corrosion, and is one of the main failure points
for coil coated materials in service[49]. Therefore, to extend the lifetime of coil coated
materials, cut edges must be sufficiently protected.
The new galvanising coatings can be thinner or less effective at sacrificial protection, whilst the
more complicated nature of the microstructure may change local chemistries which chromate
replacements rely on for inhibitive action. Therefore, further research into the area is required.
Corrosion Protection 1.5As previously mentioned, corrosion causes various problems in real world scenarios. The
deterioration that it is responsible for can result in issues ranging from purely aesthetic
problems, such as the presence of visible red rust, to potentially life-endangering structural
damage. It is therefore important to understand some of the methods that can be used in
limiting or protecting from corrosion.
Barrier Coatings
One way of protecting a metal is to attempt to isolate it from the environment. A common
method of doing this is to coat the metal and produce a barrier between the metallic material
and the environment.

37
Organic Coatings
Organic coatings, or paints, are a widely used commodity in corrosion protection systems. To
protect effectively, an organic coating must exhibit a number of properties that combine to
make a shielding layer between the underlying metal and the environment. Depending on the
application, these properties may include any number of the following: resistance to water and
ionic transport, resistance to abrasion, weathering and radiation and good adhesion to the
metal surface[50]. In essence, an organic barrier coating is intended to isolate the substrate
metal from the environment to prevent the onset of corrosion. However, an organic coating
cannot be considered a true barrier to the environment as polymers do allow diffusion of
molecular species through them.
Organic coatings, in addition to acting as a barrier, may also incorporate active inhibitor
pigments that can act to slow the corrosion process. Corrosion inhibitor pigments are
described in more detail in a later section of this report. This allows organic coatings to
improve corrosion properties when the barrier is compromised.
Metallic Coatings (Barrier and Sacrificial Protection)
Metallic coatings are also a common way of protecting an underlying material. The coating of a
susceptible metal with a thin layer of a metal that is unaffected by the working environment
can be a useful way of protecting a metal that is either expensive to replace or structurally
important when a viable alternative is unavailable.
A metallic coating may also be capable, if it is more chemically active in a particular
environment, of sacrificially protecting the underlying metal if the coating becomes damaged.
As previously mentioned, a galvanic corrosion cell is created when electrically connecting two
dissimilar metals, leading to the preferential dissolution of the more active metal. Whilst this

38
can be problematic when occurring unexpectedly[51], by applying the fundamentals of
galvanic corrosion, it can also be a useful method of corrosion protection.
Through taking into account the galvanic series, it is generally understood that the metals that
with more negative potentials become anodes when forming a galvanic couple with those that
are lower in the series. The anodic material will then corrode preferentially, leaving the other
material to be free from corrosive attack. In this way, a structure can be protected by attaching
a more reactive metal to the surface to form a galvanic couple[51].
An example of a regularly observed sacrificial anode is zinc. Reports of zinc being used for
sacrificial protection can be seen in works from as early as the 1800s[52], where it was seen
that attaching zinc and copper together was seen to lower the rate of dissolution of copper to
undetectable levels. In more recent times, zinc has found common use in protecting steel
structures. It has been estimated that around 40% of all zinc produced annually is used to
protect steels[53].
Zinc is used as a sacrificial anode due to its high position in the galvanic series, alongside its
high anodic efficiency. Anodic efficiency is an important consideration in sacrificial protection,
as it determines the current output that is delivered to the cathode when compared to the loss
of material (by weight) at the anode over a period of time, as a percentage of the theoretical
maximum that the material can provide[53]. The anodic efficiency of zinc is measured at above
90%, whereas other sacrificial anodes such as aluminium (65-90% efficiency) and magnesium
(45-55% efficiency) can be significantly lower[53].
Whilst zinc is commonly used as a sacrificial anode, other materials may be more suitable,
depending on the final application. For example, cadmium has been used for cathodic
protection of steel in military jets, owing to greater anodic lifetime and low activity of

39
corrosion products. However, the use of cadmium in other applications is limited due to its
toxicity[19].
Some work has also been done on increasing the efficiency of sacrificial magnesium anodes for
use on underground steels[54]. It is also possible to use carbon steel as a sacrificial anode
when connected to copper, with waste steel being utilised to protect copper in marine
environments[55]. It is, however, important to note that galvanic protection is not infallible,
and cannot protect materials from all forms of corrosive attack. For example, aluminium or
lead material that is cathodically protected will still deteriorate due to cathodically produced
hydroxide ions causing an alkali environment which dissolves the surface aluminium oxide
layer[56].
Electrochemical Protection
Using the same ideas behind protection through the use of sacrificial anodes, protection can
be afforded to metals through the direct application of a potential to a metal. As previously
seen in the Pourbaix diagram, some metals have areas in which corrosion can be prevented.
Knowledge of where these areas are situated within the environment the metal is expected to
be exposed to means that there may be a possibility that the metal can be protected[51].
In some cases, a sufficiently negative applied potential can lead to metal immunity. Immunity
implies that the metal remains unchanged within the environment. This occurs when the
potential of the metal at the surface of the material becomes lower than the potential for the
oxidation process[51]. At this point, the oxidation of the metal does not occur and the metal is
considered to be thermodynamically stable.
The use of polarisation for cathodic protection requires a counter electrode to act as the
anode. This is known as an impressed current anode. In this case, it is useful to use materials
that do not take part in anodic dissolution. Examples of inert materials that can be used as

40
anodes in this way are platinum and graphite. As this does not consume the electrode, another
anodic process must occur. An example of this is[12]:
However, it is not always necessary to use an inert material for protection with impressed
current anodes. In some cases, a material that will eventually be consumed is acceptable as an
impressed current anode. This occurs when the cost of replacing an expired anode is
significantly less than the cost of using an inert anode. The use of scrap steel as an anode to
stainless steels to prevent pitting in marine environments is an example of this[56].
Whilst the direct application of a cathodic potential can be useful as a method of protection,
there can be some issues that arise. Application of negative overpotentials may lead to
significant cathodic activity at the surface. Whilst these are often not directly problematic, the
evolution of hydrogen at the surface may encourage hydrogen embrittlement in some
materials[57]. There is also the risk of cathodic disbondment of coatings due to increased
cathodic activity, which can be problematic in painted samples[58,59].
Alternatively, the application of a sufficiently positive overpotential (anodic polarisation) can
lead to passivation. As seen in some areas of some Pourbaix diagrams, this is dependent on
both the surrounding environment and particular metal that is being used. Upon passivation
with this method, the oxides formed on the metal surface reduce the rate of corrosion[14].
However, sustaining a passive film through anodic polarisation can be dangerous. Slight
deviations from the applied potential, or a change in the working environment[60], could
result in a shift away from the passivating region, causing severe corrosion to occur as the
passive film breaks down.

41
Corrosion Inhibitors
It is possible to slow the rate of corrosion through the action of certain chemical species when
present within the electrolyte. These species are known as corrosion inhibitors, and can be
classified as either cathodic or anodic inhibitors, depending on which of these reactions are
affected the most.
Cathodic Inhibition
Cathodic inhibitors are species that migrate to the cathodic site and provide coverage, or
provide other methods of disrupting cathodic processes.
Positive ions will be attracted to the cathode due to the nature of the surface. In some cases,
these ions will react with alkali species that are formed at the cathodic site to form compounds
with low solubility. The precipitation of these compounds takes place on the cathode surface
and acts as a protective film, limiting the surface area that can take part in cathode
reactions[61].
An example of something that can be considered a cathodic inhibitor is cationic zinc. This will
interact with the hydroxyl ions produced at the surface to form insoluble zinc hydroxide, which
then precipitates and blocks the cathodic sites, resulting in inhibition.
Species can also be added to reduce the rate of the cathodic reaction through other
disruptions besides precipitation. An example of the introduction of a species that can disrupt
cathodic processes is an oxygen scavenger. An oxygen scavenger is an example of inhibition
through environmental modification. Oxygen scavengers work to reduce the concentration of
oxygen dissolved within the electrolyte by reacting with it. An example of an oxygen scavenger
is hydrazine, which works through the following process[62]:

42
The consumption of dissolved oxygen prevents cathodic reactions that rely on the presence of
oxygen from taking place, particularly cathodic reduction of oxygen. This reduces anodic
activity, and therefore corrosion, by limiting the cathodic reactions that can balance the overall
process.
Anodic Inhibition
Anodic inhibition is generally provided by species that aggregate and interact with ions
released from the anodic reaction. These species then form insoluble compounds that can
form a film on the anode surface. In forming this surface film, the flow of material away from
the anodic surface is restricted and thus the rate of anodic dissolution is reduced.
It is considered that the species must be sufficiently oxidising in the particular environment
that the material is in to promote surface oxide formation after adsorption to the surface[63].
The presence of oxygen is often required, although strong oxidising agents can promote
surface passivation in deaerated solutions. Examples of potential anodic inhibitors include
nitrates and silicates[64].
Anodic inhibition can be considered to be fairly dangerous to the material if applied
incorrectly. Having an anodic inhibitor that is present in concentrations that are not sufficient
to be evenly distributed across the anode surface has the effect of reducing the area of
available anodic sites. In these cases, the cathode to anode area ratio becomes unfavourable,
causing corrosion to become aggressive at the exposed anodic sites. This generally leads to
localised corrosion occurring at the anode[61].
Protection in Coil Coating
Due to the nature of coil coated materials, there must be a multi-faceted approach to
corrosion protection. The homogenous nature of the organic coating that is deposited leads to
a defect-free organic coating that is generally good as barrier protection. However, as coil

43
coating is a pre-painting method (i.e. painted before forming into products), product formation
must occur after the fact. This can cause inherent defects in the final material.
The cutting of the metal into a workable size is one of the most problematic forming
processes. This leads to the inevitable exposure of the substrate to the environment and is
known as the cut edge. The cut edge is a site on coil coated materials that is particularly
vulnerable to attack by corrosion. As such, coil coated materials must take this into account
when considering corrosion protection mechanisms, and is dealt with in a few ways.
Metallic Coatings
One particular method of corrosion protection in coil coated materials is the galvanised layer
that is applied to steel substrates before coating. This layer generally comprises of a zinc-based
alloy and not only provides an additional barrier layer between the substrate and the
environment, but is also capable of providing sacrificial protection at the cut edge, or in the
case of general coating damage that exposes the steel.
Process of Galvanising
There are a number of different ways of applying a metallic coating to a substrate. Examples of
those that are used for producing zinc and zinc alloys on steel substrates are electroplating,
sherardizing, thermal spraying and hot-dipping. For coil coated materials, the substrate is most
often hot-dip galvanized.
Hot-dip galvanising is both the oldest and most used process for producing zinc coatings for
coil coating, and this is also true generally for zinc coatings[65]. There are two different main
methods for hot-dip galvanising, which are batch and continuous processes.
Batch hot-dip galvanising applies a coating to individual parts, and is most applicable when
applying metal coatings post-production, or for low quantity work[66]. The size of parts in
batch processing is restricted to the size of the available metal bath.

44
Continuous hot-dip galvanising is more of a large scale process that is applied to wires and
sheets, and is more suited to pre-production. A continuous hot dip galvanising line will begin
with a cleaning process that removes dirt, oil and other impurities from the substrate surface.
There will then be one or several surface preparation steps where the surface is roughened,
though processes such as grit-blasting, and chemically fluxed[67]. The substrate will then be
immersed into a bath of molten zinc where the zinc coating is attached to the steel. The
thickness of this coating is controlled by the use of air knives. The cleaning, pre-treatment and
coating processes are done successively in the continuous process. The sheet is then cooled
and wound into a coil[65].
Galvanneal
Galvanneal is a zinc-iron alloy coating. It is produced by the heat treatment of an iron or steel
substrate that has been galvanized. The heat allows for iron diffusion into the zinc coating to
produce the zinc-iron alloy[68]. Therefore the microstructure and properties of the galvanneal
coating are determined both by composition of the substrate and by the specifics, the
temperature and time exposed, of the heat treatment used[68–70].
Galvanneal was produced to improve coating adhesion to the substrate. It also exhibits greater
weldability than other zinc coatings[71]. Galvanneal is also reported to give superior corrosion
resistance to coated cold rolled steels[72], although that is unsurprising. A long term SVET
experimentation saw a galvanneal coated steel maintain protection for the 12 months that the
experiment was run, showing superior corrosion resistance to standard hot dip galvanised
material, but with inferior performance to that of the tested zinc-aluminium coatings[73].
Dealloying is reported to occur in some phases present in galvanneal, leaving a porous coating
that would lack barrier protection[74]. Galvanneal has also been proven in some environments
to not provide adequate corrosion protection. Some tests have observed the presence of red
rust, an indication of iron corrosion products and therefore loss of corrosion protection of the

45
substrate after salt spray tests[71,75]. The presence of red rust is an aesthetic issue that also
can affect the galvanneal coating itself due to the iron content, and therefore it is less likely to
be used without an organic coating[76]. However, the protective properties of galvanneal have
been determined to be superior to that of normal hot dip galvanised materials[73,76,77]
Galfan
Galfan was one of many alloys produced in an effort to improve upon the properties of
standard hot dip galvanised steel products. It is a zinc-aluminium binary alloy containing
around 5 wt% aluminium, keeping it close to the zinc-aluminium eutectic composition[78], and
a small percentage of mischmetal[79]. The mischmetal is a rare earth metal mixture of cerium
and lanthanum that is added as it was found to improve fluidity and wettability of the liquid
metal, whilst also improving ductility and hindering intergranular corrosion[80,81]. Due to the
aluminium content of the Galfan, the formation of iron-zinc intermetallics during the coating
of the substrate is supressed and consequently provides the same benefits to adhesion and
formability as mentioned previously for minor aluminium additions in the galvanised steel
section.
It is difficult to give a definitive microstructure for Galfan as the quoted aluminium weight
percentages are variable. It has been reported that Galfan has a microstructure that contains a
percentage volume of primary zinc dendrites of around 14%, regardless of cooling rate[82,83].
However, it is suspected that the structure and volume of zinc dendrites can be changed by
processing conditions[84]. Furthermore, there have been reports that the surface of the
coating is enriched in aluminium, allowing the coating to passivate and improve barrier
properties[85,86]. Whilst this claim is disputed[87], it seems likely that it is the case.
Zhang et al[88] have reported that the atmospheric corrosion products present on the Galfan
surface contain both zinc and aluminium, such as Zn2Al(OH)6Cl.H2O, alongside some products

46
seen on surface of hot dip galvanised steels. It is also suggested that all aluminium oxide is
eventually converted into aluminium-zinc products.
The volume fraction of primary zinc dendrites is reported to have an effect on the corrosion
rate of the coating[84]. The cut edge corrosion performance of Galfan coating has been
reported to be dependent on the microstructure produced. Barnard and Brown [89] modelled
the corrosion rate of Galfan with various cooling rates and determined that faster cooling rate
produced a coating with a finer zinc dendrite structure which consequently improved cut edge
corrosion. Corrosion of Galfan is reported to initiate through the dissolution of primary zinc
phases[90], which supports the previously mentioned hypothesis that the corrosion rate of
Galfan is dependent on the volume fraction of zinc dendrites.
Galvalume
Galvalume is a zinc-aluminium alloy containing 55 wt% aluminium and 1.6 wt% silicon
developed in the 1970s[91]. The silicon is added to suppress an exothermic reaction between
the molten bath and the substrate surface[92] which if left unsuppressed is capable of quickly
consuming the substrate.
The microstructure of Galvalume is considered to consist of dendritic areas, which are
aluminium dendrites containing zinc rich particles, and interdendritic areas that have small
amounts of silicon dispersed within. The interdendritic areas are considered to be aluminium
containing zinc and zinc containing aluminium[93].
Galvalume is reported to corrode in chloride containing environments mainly through the zinc-
rich constituents of the microstructure, with aluminium corrosion occurring at a low
percentage of corrosion activity throughout[94]. This happens as the aluminium oxide surface
layer is broken down and replaced with zinc corrosion products. Similarly, McMurray[95] has
shown that Galvalume, unlike Galfan, is susceptible to preferential dissolution in some
circumstances, with corrosive attack concentrated on zinc-rich phases in the material. It is

47
theorized that this results in the local enrichment of aluminium which in turn can passivate the
area.
However, the corrosion of aluminium can be initiated by the application of a potential to the
Galvalume structure[96]. The presence of aluminium in Galvalume is reported to prevent
cathodic protection in environments containing low chloride concentrations, which is
explained through the presence of an aluminium oxide passivating layer on the surface[97].
Seré et al used[98] compared the corrosion performance of Galvalume coated steel to hot dip
galvanized with salt spray, humidity and immersion testing, analysed by observing the
corroded area of the material. It was determined that Galvalume showed superior corrosion
resistance across all tests. However, weight loss experiments performed by Domínguez-Crespo
et al[99] have shown that Galvalume gave worse performance than hot dip galvanised samples
when immersed in a sodium chloride solution. Microscopic observation from these tests
showed that the corrosion that occurred on the Galvalume was more uniform in nature, and
can therefore be considered to be a more controlled corrosion process.
Zinc Magnesium Aluminium Ternary Alloys
A variety of alloys have been produced which introduce both magnesium and aluminium into
the zinc coating. Zinc-aluminium-magnesium alloys exhibit a complex microstructure that
includes zinc dendrites along with binary and ternary eutectics[58,100–102]. A variety of zinc-
magnesium-aluminium alloy compositions are used in industry. There have been some reports
that zinc magnesium aluminium alloys are prone to corrosion through dealloying, with the
ZnMg2 intermetallic phase dissolving preferentially from the alloy[34,101]. However, an
alternative report suggests that initial corrosion attack is instead concentrated close to
eutectic phases or close to grain boundaries of primary zinc phases[34], but is otherwise not
selective in actual dissolution of phases. The mechanism and site of corrosion initiation is
therefore likely to be dependent on the microstructure.

48
Whilst a general representation of the complex microstructure has been given, the overall
organization of the microstructure is different between compositions[75]. The corrosion
resistance of the ternary alloys is reported to be superior to that of galvanised steel, regardless
of the microstructure. However, as the analysis using 5% red rust time seems like it would be
open to interpretation, the overall improvement relative to the original galvanised
measurements may not be entirely accurate. It has been reported that zinc-magnesium-
aluminium alloys perform better in salt spray than equivalent zinc systems, with no signs of
iron oxide corrosion product (red rust) present on the ternary alloy after 600 hours whilst hot
dip galvanised coatings show red rusting after just 100 hours[100].
The presence of magnesium within the alloy composition is suggested to make noticeable
differences to both the properties of the material and the corrosion products. Zinc oxide based
corrosion products are reported to be present at the surface of both hot dip galvanised
coatings and Galfan coatings. However, the addition of magnesium to create ternary alloys
suppresses the oxidisation of zinc to leave the surface oxides to consist entirely of aluminium
and magnesium oxides[103]. This claim is disputed in chloride environments, where XPS
measurements have determined that the initial corrosion products consist mainly of a zinc
aluminium carbonate hydroxide compound[104]. With this claim, it can be seen that
magnesium does not appear to interact with the chloride in the environment.
Chloride is not the only factor that affects the corrosion products of zinc-magnesium-
aluminium alloys. The concentration of CO2 has been reported to have a considerable effect on
the corrosion rate of zinc-magnesium-aluminium ternary alloys. The corrosion products found
on the surface in conditions with low CO2 levels were seen to be different to that of CO2 levels
in ambient conditions. It was also seen that in levels of CO2 found in ambient air, the corrosion
products for the ternary alloy were the same as for hot dip galvanised steel[93]. The rate of

49
corrosion was also notably different for the ternary alloys in low CO2 concentrations, corroding
at a rate approximately 12 times quicker than in normal concentrations.
The microhardness of the coatings is also increased by the addition of magnesium. It has been
suggested that due to this increase in hardness of the coating, the resultant material cannot be
formed without the development of cracks across the surface. However, despite this, testing
has revealed that zinc-magnesium-aluminium ternary alloys provide superior corrosion
resistance after forming even with the presence of surface cracking[105].
Corrosion Inhibitors
Chromate
Inhibitors based on hexavalent chromium are commonly used in the coil coating industry.
Chromate inhibitors are considered to work well over a large pH range and in the presence of
many aggressive species, such as chlorides[106]. They are also noted for the protection that
they can afford both the anodic and cathodic surfaces, working on a wide range of
substrates[106]. This is because at high concentrations, chromates act as oxidising agents and
passivate the surface. At low concentrations, the reduction of chromium (VI) to chromium (III)
occurs at the cathodic sites and leads to precipitation which then blocks the site.
The ability to work over a large pH range is down to its solubility over the range, although the
actual level of solubility of some chromates (strontium chromate, for example) can be both
fairly low, and pH dependant[107,108]. This means that chromates present in the pigment of
an organic coating can leach out into the surrounding electrolyte by dissolution[107,108].
The mechanisms of inhibition and paint leaching for chromate species have long been studied
and debated. Prosek and Thierry[109] observed the leaching rate for chromates from model
primers across a range of different conditions and electrolytes by ion chromatography on

50
washing to determine the mechanism of release. It was found that the rate of leaching was
increased by pH and the presence of chloride ions.
The development of chromate films on steel surfaces was observed through the use of
radioactive chromium isotopes. Firstly, the presence of chromium was detected by
Brasher[110], who noted the time and pH dependant growth of chromate films on mild steel.
Longer immersion times and lower electrolyte pH was noted to improve film growth, whilst
chromate concentration was suggested to be ultimately not important to the process.
Kubaschewski[111] then proceeded to explain the mechanism as the reduction of chromium
(VI) oxides to insoluble chromium (III) oxides at the surface, noted by the film growth rate
being limited by the rate of through-film electron transfer.
Clark and McCreery[112] used voltamperometry to explore the mechanism of chromate
inhibition on various electrodes. It was determined that the reduction of chromium (IV) to an
insoluble chromium (III) monolayer on the electrode surface prevented oxygen chemisorption
and prevented the oxygen reduction reaction from taking place. The non-conductive nature of
this film also prevents electron transfer through the film and therefore electrochemical
reactions cannot take place on the film surface. This theory fits well with the similar findings of
other published research[27,107,113,114]
The process in which chromates provide anodic protection is rather less understood. One
possible theory is that the reduction of chromium (VI) into insoluble chromium hydroxide
(Cr(OH)3) leads to a local increase in pH through either the consumption of hydrogen ions[114]
or evolution of hydroxide ions[108]. As a consequence of the reduced pH brought about by the
mechanism of chromate inhibition, the ions from anodic dissolution result in insoluble
hydroxide products, which are then capable of anodic coverage, resulting in corrosion

51
inhibition at both the anode and cathode. It is thought that this is possible with zinc
anodes[115].
Alternate theories suggest that chromates can act as anodic inhibitors through the same film
formation as with cathodic inhibition; however this is only effective at inhibiting the initiation
of anodic sites, as opposed to anodic propagation[27]. Prior thoughts on the inhibition of
anodic processes by chromates suggested that the formation of chromate films reduced
corrosion as it prevented the diffusion of ions away from the anodic site[116].
Formulations containing hexavalent chromium, however, are being phased out. This is due to
the inherent health risks, such as carcinogenicity, associated with the handling of those
compounds[117]. European legislations have previously placed strong restrictions on the use
of hexavalent chromium, particularly in electronics. A sunset date of September 2017 has been
given for the use of hexavalent chromium compounds across all applications (REACH Annex
XIV-3, Dec 2011). Therefore, effective alternatives for chromate based inhibitors are being
sought.
Chromate Replacements
The main issue that is facing the industry for replacing chromate inhibitors is the flexibility of
chromates. Chromates act as inhibitors on various metal surfaces, over a range of pHs and are
capable of working in both aerated and deaerated conditions[106]. Whilst this flexibility is
difficult to replicate without the use of several inhibitors working synergistically, taking into
consideration the working environment and particular chemistry of the eventual application
allows for some non-chromate inhibitors to be effective.
Phosphates are being considered as a potential replacement for chromates. Naderi and
Attar[118] have demonstrated using scanning electron microscopy the presence of a
precipitated layer containing phosphates on the surface of steels following exposure to a
polyphosphate inhibitor, which is not present after exposure to zinc phosphate. This study

52
concluded that the inhibition of iron by polyphosphates was much superior to that of
monophosphate inhibitors. It was found the polarisation resistance and corrosion current
density of monophosphates deviated little from that of blank solutions. This is in good
agreement with Bastos et al[119] which also found that the corrosion rate of iron in phosphate
inhibited solutions did not differ significantly from the blank solutions until longer exposure
times.
It can be suggested that this is the case for phosphate inhibition of iron, however, Simões et
al[120] have suggested and observed that the presence of zinc ions, from anodic zinc
dissolution, in a solution containing sodium phosphate can result in the precipitation of
phosphate at the zinc surface, due to the formation of near-insoluble zinc phosphate. On cut
edges, zinc ions would be present mainly around the anode, so precipitation would be seen
mainly at the anode site. This precipitate would have the effect of reducing both the current
flow and ability for zinc to diffuse away from the surface[120]. However, as zinc diffusion is not
completely blocked, over time, zinc ions can migrate to the cathode surface and the presence
of phosphates can produce a similar effect[120]. The inhibition efficiency of phosphates also
improves with the presence of calcium ions, which has resulted in the use of combined
inhibitor systems with phosphate and calcium containing pigments providing synergistic
effects[121].
Additionally, Sullivan et al[122] used time-lapse microscopy and scanning vibrating electrode
technique to observe the corrosion mechanism of zinc magnesium aluminium alloys. It was
seen that the addition of small amounts of sodium phosphate was sufficient to reduce the
corrosion of the system significantly, with SVET suggesting an approximate 98% reduction in
mass loss, and the shift of the free corrosion potential as observed through polarisation to less
negative potentials.

53
Some success has been had with the introduction of organosilanes. It was proposed that the
silane molecules bind to the metal surface, allowing them to form protective cross-linked
layers[123]. Some organosilane applications have been reported to exhibit superior corrosion
resistance than that of chromate inhibited samples when used in tests containing drying
cycles[124]. However, the omission of product line material in this particular test where silanes
show better performance is of some concern and could make the results shown in that
particular paper questionable. It has also been reported that in-paint tests of a phosphosilicate
inhibitor system have shown success with performances comparative to the chromate system
tested[125].
Benzotriazole has been considered as an organic replacement for chromate. Research carried
out on benzotriazole[126] discovered that it was capable of inhibition on both anodic and
cathodic processes, although this was at significantly increased levels of inhibitor than would
be realistically possible in a real world scenario.
Alternatives have been researched using ion-exchange as a way of introducing inhibitors.
Organic coatings containing yttrium have been used for coating on zinc surfaces where, upon
dissolution of the zinc, the yttrium is released and the zinc is captured in the resultant vacancy
in the paint matrix. Yttrium then diffuses to the cathodic site where it coats the surface with
insoluble hydroxides[127]. This method is reportedly useful in systems where differential
aeration pushes one side of the metallic coating anodic to the other.
The use of bentonite clays as a corrosion inhibitor for coil coated materials, particularly on the
cut edge, has been researched. In these works, bentonite matrices are produced and modified
to change the normal metal cation with others. It was reported that rare earth metals are
particularly effective at inhibiting corrosion[128], although the natural composition bentonites
also provide corrosion protection close to that of the chromate system that was tested[129].

54
Molybdates have been proposed as chromate inhibitor replacements. Robertson[130]
proposed both molybdates and tungstates as general replacements for chromates in certain
applications due to their non-oxidising nature, although this nature has been disputed to claim
that they are more accurately mildly oxidising inhibitors[63,131].
Zinc molyphosphate, an industrial non-chromate inhibitor pigment used in the coil coating
industry is considered to be a combination of zinc phosphate and molybdate[132]. However,
zinc molyphosphate is shown to, when utilised in a common system which also contains
calcium ion-exchange inhibitor, and applied to aluminium alloys, that the inhibitor action is
mainly composed of phosphates. Therefore, the molybdate part of this inhibitor can be
considered a passive part of the inhibition process[133]. Indeed, the usefulness of molybdates
as a chromate-replacement inhibitor has been reported to be predominantly as a synergistic
part of an overall system[134].
The improved performance of molybdate inhibitors by the presence of zinc cations has been
shown by Qian and Turgoose[135], confirmed through the use of weight loss experiments and
DC polarisation. The prediction of the production of a porous film at the surface appears to be
entirely speculation, however, and should have been confirmed with further analytical
techniques such as scanning electron microscopy. The mechanism of inhibition proposed by
Monticelli et al[136] suggests that molybdates work through the reinforcement of the oxide
film at the metal surface, with additional chemisorption that prevents the ingress of chloride
ions to the surface.
Factors Affecting Cut Edge Corrosion
As previously mentioned, corrosion at the cut edge is one of the major points of failure for coil
coated materials. There are various factors that can affect how cut edge corrosion proceeds.
The thickness of the metallic coating effects corrosion on the cut edge. Lowering the thickness
of the metallic coating leads to a less favourable anode to cathode area ratio, which is already

55
a concern for corrosion on the cut edge[137]. Similarly, it has been shown that increasing the
steel thickness results in an increase of rate of dissolution of the metallic coating[138]. The
thickness of coating is also reported to affect the microstructure in Galfan coatings, which also
causes differences in corrosion rates[139].
Cut edge corrosion can be affected by the presence of an organic coating. Restrictions placed
on the diffusion of ions by the coating can change the mechanism of dissolution from cathodic
protection of the steel, to differential aeration between the two sides of metallic coating.
In some applications of coil coated steels, the organic coating is applied at different
thicknesses on either side. It has been reported that in this case, as the diffusion of oxygen is
less restricted on the thinner coating side, the metallic coating underneath becomes cathodic
to the metal coating on the other side. This leads to strong anodic activity occurring, leading to
dissolution of one coating side over the other[140]. A similar effect has been reported to take
place in the case of two coatings of equal thickness that are cured to different extents, owing
to a similar mechanism[141].
The composition and microstructure of the protective metallic coating has also been reported
to have a noticeable effect on cut edge corrosion. Upon addition of small amounts of
magnesium, the microstructure of Galfan was noted to become increasingly heterogeneous.
The heterogeneity is reported to have an effect on the particular site of anodic activity, as
dissolution of the zinc phases in heterogeneous microstructures leads to localised corrosion of
those phases[142].
Corrosion Analysis 1.6Gaining an understanding of corrosion processes and behaviours is fundamental to
determining suitable materials and additives for particular applications and environments. In
this section, an overview of some of the common laboratory and field techniques used to
analyse corrosion behaviour will be looked at, touching upon basic theory and some relevant

56
historical literature, paying particular attention to the techniques used within the experimental
sections of this thesis.
1.6.1 Electrochemical Methods
Zero Resistance Amperometry
Zero resistance amperometry refers to the use of a zero resistance ammeter (ZRA) to
determine the galvanic current flowing between two metals. By electrically isolating the two
metals, and forming a galvanic contact that forces the current flow through a ZRA, the galvanic
current of that metallic couple can be measured. The main use of this is to determine the
corrosion rate of the system. The relationship between current and corrosion rate can be
shown through derivation of Faraday’s law of electrolysis. Faraday’s law of electrolysis is given
by the equation , where Q is the charge produced upon ionising z moles of material.
Taking the derivative of this equation with respect to time, considering that z and F are
constant, produces the equation
. Considering that
is equivalent to current and
is equivalent to the flux of substance, the equation can be re-written as . Thus, it
can be considered that and as such the galvanic current is a direct representation of the
corrosion rate[3].
Ammeters generally calculate current through the conversion of measured voltage that has
been subject to a known resistance through the equation . However, this becomes
problematic when dealing with low magnitude currents, such as those that are observed in
galvanic couples, as the required resistor becomes large and therefore the voltage drop will
interfere with the electrode potential. This necessitates the use of a zero resistance ammeter.
Zero resistance ammeters work by applying a potential across the resistor that is equivalent to
the voltage drop from the resistor. By doing this, it can be suggested that any additional
voltage measured within the equipment should be as a result of the electrochemical system,

57
and thus the current can be determined accurately. An example of the circuit diagram for a
zero resistance ammeter is given in Figure 1.6.1[143].
Figure 1.6.1 - An example diagram showing the circuitry contained within a zero resistance
ammeter
There is historical literature which reports the use of zero resistance amperometry in analysing
the corrosion behaviour of the cut edges of coil coated steels. In order to determine the
corrosion current of a cut edge, distinct metals have been electrically isolated, and mounted to
be geometrically similar to the configuration seen in a real world cut edge[132,144]. Howard et
al[144] used zero resistance amperometry to follow the galvanic current between steel and
zinc using this model electrochemical cell with a range of inhibitors to determine the efficiency
of each inhibitor. Similarly, Chiba et al[145] observed the change in current of a model cut
edge with isolated Galvalume coating during the wet components of a wet-dry-wet corrosion
test cycle to follow and determine the effectiveness of chromate inhibition.
Zero resistance amperometry can also been used to study the effectiveness of metallic coating
protection. Li et al[91] used zero resistance amperometry to ascertain the galvanic coupling
currents galvanising coatings and steel, where it could be seen that zinc coating provides
superior sacrificial protection to the two aluminium-containing coatings that were also studied.

58
The use of zero resistance ammeters has also been seen in the production and validation of
models. Jia et al [146] utilised a ZRA array to determine corrosion current density across a
range of materials. This was designed to view the effects of separation and electrode areas on
the galvanic coupling of steel and magnesium alloys, which produced results that appeared to
fit well with the model.
Potentiodynamics
A common and potentially powerful method of analysing electrochemical systems is through
the use of potentiodynamics. A potentiodynamic experiment uses a potentiostat apply a
linearly-shifting potential to the system, observing and measuring the resultant current.
Analysis of the profile obtained of the potential versus the resultant current can give
information on elements of a particular system, such as the corrosion potential and any areas
of passivation[147].
A number of different processes can be present in a polarisation curve, which is often
displayed as a semi-log graph depicting the log of the current against the potential, depending
on the particular system being observed, and the direction of the polarisation. Polarisation
tends to be driven either cathodically or anodically from a point that is approximately at the
open circuit potential of the system so as to gain an understanding of that particular process.
Depending on which direction the polarisation is driven, the processes that are evident in
these curves are different in each case.
For cathodic region polarisation, an initial drop to zero current is observed at the open circuit
potential. This is generally followed by a steady current increase as cathodic reactions begin to
occur on the metal surface. The first of these is generally the oxygen reduction reaction. The
oxygen reduction reaction is a diffusion limited process, and is therefore kinetically controlled.
This means that current flow seen by the system from this reaction will become limited at a
point of maximum diffusion rate, seen in the polarisation curve as a current plateau,

59
independent of the increase in thermodynamic driving force. Further cathodic polarisation will
then activate a second reduction reaction which evolves hydrogen at the metal surface.
For polarisations exploring the anodic region, starting at slightly cathodic of the open circuit
potential, initially the drop to zero current is seen for the open circuit potential, as in the
cathodic polarisation. A steady increase of current is observed as anodic processes begin to
occur at the metal surface. This is usually, for non-inert anodes, a metal oxidation process,
commonly metal dissolution. With some materials and environments, with further anodic
polarisation a current drop can be observed. This is associated with a surface passivation and
the production of an adherent metal compound, often oxides, which slow the anodic process.
Further anodic polarisation may lead to the breakdown of this passivating layer, and a
subsequent sharp increase in the current observed.
The importance of potentiodynamic polarisation to corrosion studies cannot be overstated,
and as such, several papers have been published outlining both the uses and particular
methods of analysing polarisation curves[147–150].
The use of polarisation to study inhibition mechanisms is well documented. By analysing the
shifts in both corrosion potential and current density, the effectiveness and mechanism of an
inhibitor can be determined. For example, Baghni et al[115] demonstrated the effects of
chromate on the corrosion of steel, showing it to be predominantly cathodically inhibiting
through the depression of the corrosion potential and reduction of the current demand.
Similarly, Zin et al[151] used polarisation experiments to compare the inhibitor profiles of
strontium chromate with various chromate replacement inhibitors and determined similar
characteristics for the Shieldex/Actirox mixture when compared to strontium chromate
inhibition.

60
Whilst the understanding of the corrosion behaviour of a system requires more information
that can be obtained from merely a polarisation curve alone, they can be used to compare the
behaviour of different systems with a reasonable degree of accuracy.
Electrochemical Impedance
Introduction and Basics
An important technique that is used in the investigation of electrochemical reactions is
electrochemical impedance spectroscopy (EIS). EIS uses the application of alternating current
(AC) to determine the nature of the electrochemical system at the surface of an electrode.
Indeed, impedance is the AC analogue of resistance. As such, impedance can be considered to
have both a magnitude and a phase.
To understand how impedance spectra can be utilised, the relationships between certain
components and impedance values must be known. For a pure resistor, impedance is entirely
real and can then be considered to be equivalent to the resistance, R. For a pure capacitor, the
impedance is non-real, and the oscillation must be taken into account. For a system with an
alternating current, the voltage can be represented by the following equation
where
As previously mentioned, impedance is the alternating current equivalent of resistance, and
thus can be dictated by the same equations:
For a basic system containing a resistor and capacitor in parallel, the overall impedance is the
summation of the reciprocal of admittances for both resistors and capacitors. Admittance is
the inverse of impedance and can therefore be represented by the following equation:

61
Therefore the overall admittance can be given by the following equation:
Rearranging the equation that relates current and voltage to impedance can be manipulated
to incorporate the admittance as follows:
(
)
(
| |) | |
( )
[152]
As a result of manipulation of the complex parts of the equations mentioned above, it can be
shown that through fitting data and calculating values for |Z| and the phase angle, α, both R
and C can be estimated. To do this effectively, it is important to calculate impedances over a
range of frequencies. However, taking consideration of the range of frequencies used is
important, as higher frequencies are more likely to contain artefacts, whereas lower
frequencies are much more prone to drift and longer term instabilities in the system being
measured[152].
Ultimately, it is through these calculations that electrochemical impedance becomes useful. By
producing a circuit that is comprised of elements that in effect model the behaviour of the
system, the mechanisms can be elucidated and changes in behaviour over time modelled and
quantified.
Equivalent Circuit Elements
Combining knowledge of how a system is expected to behave with an equivalent circuit that is
similar to the actual behaviour of the system allows mechanistic information of the system to

62
be retrieved through analysis of the electrochemical impedance spectrum. Each component of
an equivalent circuit can be used to model certain behaviours of an electrochemically active
system. The following section will briefly explain common elements, and the potential real
world implications of including these components within equivalent circuits.
Resistor
In electronics, resistors are devices in which the current flowing is lowered with respect to the
applied voltage, and is visually represented in a circuit by the symbol shown in Figure 1.6.2.
The equation that represents the effect of a resistor is
. Due to this, the resistor will
have a direct and proportional influence on the current within the system.
Figure 1.6.2 – The equivalent circuit representation of a resistor
Resistors are used to simulate behaviours of processes that are purely resistive in nature, and
would respond similarly when subjected to a direct current. Equivalent circuits representations
of systems containing coatings or deposited films will normally include resistors. Additionally,
solutions themselves also have an inherent resistance which, in most cases, will be
represented in the equivalent circuit by a resistor.
Capacitor
A capacitor is an electronic device in which charge is stored following the application of a
voltage over time. Current that flows from a capacitor is represented by the equation
. Consequently, current flow through a capacitor can be considered to be
dependent on both the application time and intensity of a voltage.

63
Figure 1.6.3 - The equivalent circuit representation of a capacitor
Capacitors are a commonly seen element in equivalent circuits developed for analysis of
electrochemical impedance spectroscopy, and can be considered to be one of the basic
building blocks of equivalent circuits alongside resistors. Elements that are commonly seen in
real systems that are capacitive in nature include coatings, which have a degree of
capacitance, and the interfacial double layer seen at the surface of electrodes in electrolyte.
Constant Phase Element
In many real situations, the exhibited behaviour of an electrode deviates from standard
models that contain resistors and capacitors. Constant phase elements are often used in place
of capacitors to ensure that d.c. conductivity is still directly readable. This has been
determined to fit well with experimental data and thus is generally considered to be accurate.
Constant phase elements are generally characterised through the presence of a depressed
semi-circle in the spectrum. A common explanation behind constant phase element behaviour
is that of heterogeneity on the surface. This heterogeneity can arise from surface roughness or
through other effects, such as ion motion[153], that can cause variation in the capacitive
behaviour across the area of the surface. This has been tested by Jorcin et al[154] who used a
combination of global and local electrochemical impedance to determine that constant phase
element behaviour is due to local variations in resistance.
Warburg Element
The Warburg element is a specific type of constant phase element that models near-infinite
linear diffusion of the bulk electrolyte. It is represented by the symbol W in an equivalent
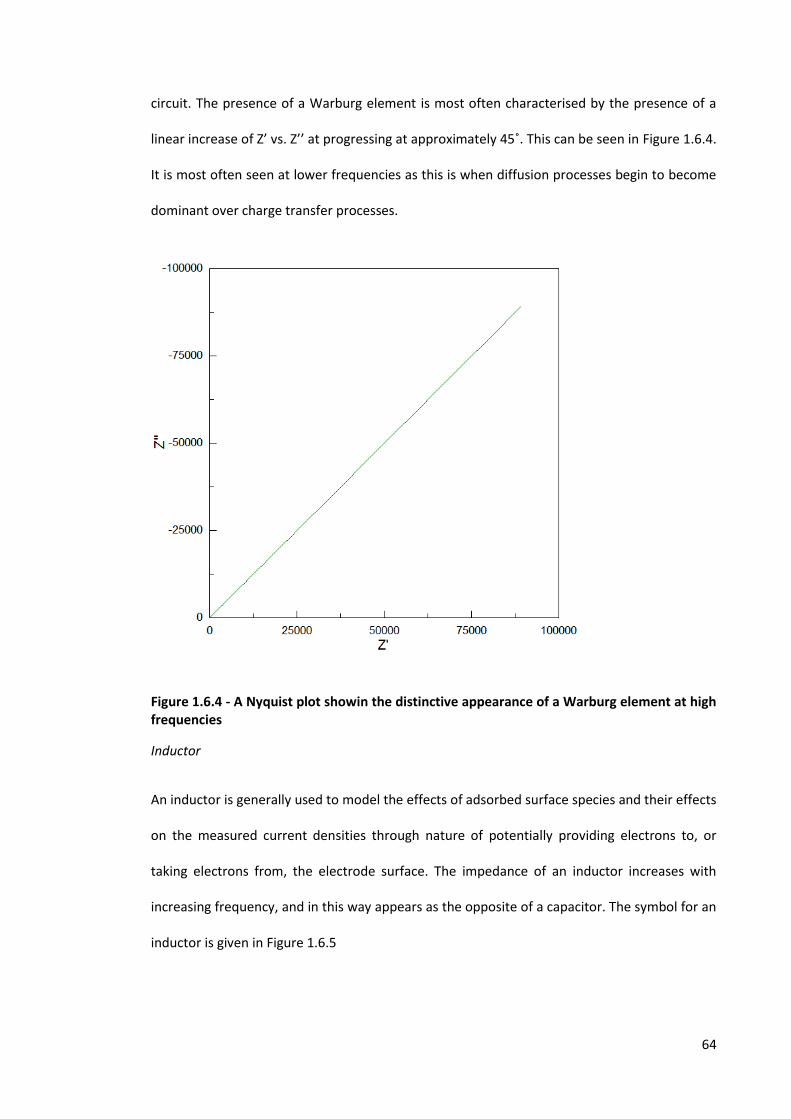
64
circuit. The presence of a Warburg element is most often characterised by the presence of a
linear increase of Z’ vs. Z’’ at progressing at approximately 45˚. This can be seen in Figure 1.6.4.
It is most often seen at lower frequencies as this is when diffusion processes begin to become
dominant over charge transfer processes.
Figure 1.6.4 - A Nyquist plot showin the distinctive appearance of a Warburg element at high frequencies
Inductor
An inductor is generally used to model the effects of adsorbed surface species and their effects
on the measured current densities through nature of potentially providing electrons to, or
taking electrons from, the electrode surface. The impedance of an inductor increases with
increasing frequency, and in this way appears as the opposite of a capacitor. The symbol for an
inductor is given in Figure 1.6.5

65
Figure 1.6.5 - The equivalent circuit representation of an inductor
Randles Circuit
A Randles circuit is an equivalent circuit that was proposed by John Edward Brough
Randles[155] and became a common starting point for fitting of EIS data. It consists of a
resistor representing the resistance of the solution that is connected in series with a parallel
arrangement of a capacitor representing the double layer capacitance in the solution and a
resistor representing the charge transfer resistance attached in series with a Warburg element.
This arrangement is visually shown in Figure 1.6.6.
Figure 1.6.6 – A circuit diagram representation for a Randles Circuit
This arrangement is typical of a bare metal in a solution and is therefore frequently observed
in many electrochemical systems.
Electrochemical Impedance of Coatings
In theory, an ideal coating is entirely capacitive in nature and can be represented by a resistor
and capacitor in series. However, it can be stated that most coatings are realistically imperfect.
Thus, a more complicated circuit diagram must be used, which is shown in Figure 1.6.7.

66
Figure 1.6.7 - Basic electrochemical circuit for an imperfect coating. The physical interpretation of the circuit is as follows: Rs – solution resistance, Cc – coating capacitance, Rpo – pore resistance, Cdl – double layer capacitance, Rct – charge transfer resistance
Using this electrochemical circuit, in cases where the coating capacitance is very large, the
obtained impedance spectrum is similar to that of the perfect coating case. However, as the
coating fails, two discernible effects can be seen on the values generally obtained. A drop in
the coating capacitance is indicative of a reduction in the ability of the coating to shield the
underlying substrate from the environment. Additionally, as the electrolyte of the
environment ingresses into the coating, the pores within will expand and a resultant drop in
the pore resistance will also be observed.
Figure 1.6.8 shows the effect of decreasing the coating capacitance. It can be seen that the
second time constant arising from the charge transfer resistance and double layer capacitance
segment of the equivalent circuit becomes more easily discernible as the coating capacitance
reduces. Figure 1.6.9 shows the effect of decreasing the pore resistance. As the pore resistance
drops, the magnitude of the semi-circle representing the first time constant can be seen to
reduce in magnitude.

67
Figure 1.6.8 - A series of Nyquist plots showing the effect of lowering the coating capacitance from green to black (all other parameters remaining the same)
Figure 1.6.9 - A series of Nyquist plots showing the effect of lowering the pore resistance from light green to black (all other parameters remaining the same)

68
Electrochemical Impedance in Coil Coatings
Research around the area of coil coating has often used EIS as an analytical tool. Naderi and
Attar[156] used electrochemical impedance to look at the differences in corrosion inhibition of
phosphate based inhibitors. It was shown that zinc orthophosphate hydrate was not an
effective inhibitor whilst both strontium aluminium polyphosphate and zinc aluminium
polyphosphate were effective, with the polyphosphate inhibitors potentially displaying film-
forming behaviour as determined by the equivalent circuits.
Additionally, Pokhmurs’kyi et al[157] used impedance to determine corrosion inhibitor
efficiencies of phosphate/calcium ion exchange pigments in comparison to chromates. It was
determined that by following the changes in charge transfer resistance of the system with
different coatings that whilst the non-chromate inhibition systems did increase corrosion
resistance, it did not reach the levels of inhibition found with chromates.
Simões and Fernandes[158] have utilised impedance spectroscopy, combined with scanning
vibrating electrode technique to observe corrosion at the cut edge. This allowed them to
observe the effects of a phosphate inhibitor on the cut edge, and compare the impedance of
the cut edge with that of zinc and steel separately, showing that the impedance spectra gained
is similar, but distinct, between zinc and the cut edge, whereas steel is completely different.
Yıldız and Dehri[159] applied EIS to samples following accelerated weathering tests to
determine the onset of coating defects from the cut-edge. It was determine through the
analysis of the impedance plots that following 120 days exposure the coating resistance
reduced significantly suggesting coating deterioration.
Electrochemical impedance is also used in to observe or check the coatings in cut edge
corrosion studies without directly observing the cut edge, often prior to using other, localised
techniques to observe the cut edge. For example, Worsley et al determined the coating

69
performance using electrochemical impedance before analysing the cut edge performance
with SVET[141].
Impedance Spectroscopy in Other Research
Beyond its uses in coil coating research, electrochemical impedance spectroscopy is used
across a wide range of fields for analysis of chemical systems and environments. Of particular
importance is its use in analysis of coatings.
Delucchi et al[160] have used impedance spectroscopy to analyse the multiple layers of
coatings in a coil coating system following various tests to maximize performance. The
information gathered from the impedance spectra allows for reasoned and considered
evaluations of performance across a range of tests, and highlights the usefulness of the
technique as a quick post-test analytical tool.
Electrochemical impedance has also been utilised to look at local phenomena. Dehri et al[161]
isolated sections of a coil coated material following a standard testing procedure using tubes
and performed EIS on each tube section individually. The impedance results showed significant
deterioration of the coating near the cut edges. Whilst the results make sense, it is important
to note that there could be issues caused by the delay required between running sections of
the sample.
Mansfield’s paper on electrochemical impedance explores the usefulness of electrochemical
impedance spectroscopy on the analysis of corrosion protection, showing equivalent circuits
that have been used to analyse inhibitors in free solution, conversion coatings and organic
coatings, amongst others[162]. However, it is Epelboin et al, whose initial studies showing the
usefulness of the charge transfer resistance, readily obtainable from most impedance spectra,
and the link it has with the corrosion rate at the metal surface which resulted in the
emergence of impedance as a way of monitoring corrosion inhibition[163].

70
Following the development of inhibitor films is also possible using impedance spectroscopy.
Naderi and Attar[156] observed the development of a second time function when following
the inhibition of polyphosphates by impedance, which was suggested as the deposition of a
thin layer on the surface. Bastos et al[164] also determined the mechanism of inhibition of
chromates and phosphates was the deposition of an inhibitive layer on the metal surface
through following the impedance of the samples over time.
Scanning Ion-selective Electrode Technique (SIET)
The ion-selective electrode technique is a tool capable of noting small environmental changes
with reference to a particular ion, or to localised pH changes. This can be useful, as when
cathodic or anodic processes occur on the surface, there is a change in the local pH. This is due
to the chemical species that are released or consumed in the electrochemical processes.
Knowledge of the particular reactions that may occur on a metal surface, combined with the
pH values obtained through pH microsensing can give an idea of whether a particular site on
the surface may be anodic or cathodic.
The knowledge of how local environments behave with relation to pH can also be used to
develop inhibitor systems that can utilise the local pH changes to become active. Lamaka et
al[165] demonstrated the applications of the SIET technique with relation to both pH
microsensing for localised acidification and alkalisation reactions, as well as through
monitoring the release of ions dissolved from anodic sites.
The quasi-simultaneous use of SVET and SIET was also demonstrated, which would have the
potential for observing and analysing the corrosion of complex microstructure if the length
scales and resolution could be improved. However, Alvarez-Pampliega et al[166] have shown
the usefulness of this combination technique in the determination of mechanisms at the cut
edges, using localised pH measurements to understand the movement and inhibition by alloy
coating hydroxides. Zdrachek et al[167] have also able to use pH microsensing techniques to
71
observe and map the localised pH behaviour and corresponding current densities on the cut
edge of a zinc magnesium aluminium ternary alloy coated material, so there is potential in this
technique for analysing larger scale corrosion and inhibition mechanisms at cut edges.
Other Methods
Scanning Electron Microscopy
Scanning electron microscopy is a useful tool in the field of corrosion. The scanning electron
microscope utilises various signals that are produced from the interaction of the sample and a
focussed beam of high-energy electrons to produce images. It can be used to obtain
topographical detail of corroded surfaces with a good amount of detail. Using scanning
electron microscopy allows for greater resolution and depth of field when compared to optical
microscopy. This allows a fuller overall picture of localised corrosion structure and potentially
allows for dimensions of the phenomena to be obtained.
Whilst scanning electron microscopy ultimately gives no information other than surface
corrosion structure, it is commonly combined with energy dispersive x-ray spectroscopy (EDS)
to provide chemical information for either the microstructure or the corrosion products. EDS
utilises the x-rays that are emitted from the sample as it interacts with the electron beam. The
energies of the emitted x-rays are generally characteristic of individual elements and can be
used to give an indication of the elemental make-up of a particular site.
SEM is a common analytical tool in corrosion studies, and sees a wide range of uses. For
example, Naderi and Attar[156] used SEM to analyse the morphology of corrosion inhibitor
pigments, as well as that of the produced inhibitive layer on the surface of the steel, which was
capable of being analysed by EDS. In contrast, Bernard et al[168] utilised SEM to show the
structures of various zinc corrosion products. Similarly, Muster and Cole[169] used SEM and
EDS to observe the structure and confirm the elemental make-up of potentially passivating
zinc corrosion product layers.

72
Duchoslav et al[170] observed both the microstructure and the localised corrosion initiation
sites of zinc-magnesium-aluminium ternary alloy coatings using SEM and other techniques. A
similar, albeit simplified, version of this experiment was also carried out and analysed by SEM
by Palma et al on a Galvalume coating[94].
Scanning electron microscopy finds uses across many areas of coil coating. Combining SEM
imaging with EDX analysis allows for greater understanding of alloy coating microstructure,
paint structure, corrosion products and inhibition structures. Vu et al[171] used SEM and EDS
to follow the corrosion initiation sites at the cut edge of Galvalume coated materials in sulfate
and chloride solutions.
X-Ray Photoelectron Spectroscopy
X-Ray photoelectron spectroscopy, or XPS, is a spectroscopic technique that utilises a focussed
X-ray beam to determine the elemental composition of a particular surface. When an area of
the surface is irradiated with x-rays, the energy from the radiation source is transferred to
core-level electrons. This leads to emission of this electron from the sample. The kinetic energy
of this electron is dependent on the binding energy of the atomic orbital from which it is
released. Therefore, the detected kinetic energy of a released electron can be considered
characteristic of coming from a particular orbital of a particular element. In this way, by
analysing the quantities and energies of emitted electrons from an irradiated sample, the
elemental make-up of the surface may be determined[172].
XPS is a commonly used method of analysis in corrosion. Of particular interest is the utilisation
of XPS to analyse inhibitor film formation. Due to the surface resolution of XPS, it can be used
for inhibitor films that are too thin to be analysed by SEM/EDS analysis, as XPS observes the
top few nanometers (generally considered to be approximately 10 nm) of the surface. For
example, Aramaki[173] used XPS to follow the deposition of cationic inhibitor species onto the

73
surface of zinc, and this allowed for some quantification and analysis of the composition of
these surfaces.
The XPS technique is generally found to be unsuitable for cut edge corrosion studies as the
required detection area is too large to provide an acceptable direct measurement at the edge.
However, studies have been reported that attempt to approximate chemistry on the cut edge.
Custódio et al[126] attempted to understand the action of benzotriazole at the cut edge using
XPS by producing larger samples that contained a 7:3 steel:zinc ratio. Whilst this may be a
reasonable approximation from a chemistry standpoint, it is also worth noting that the steel to
zinc ratio of 7:3 is significantly different from the ratio of approximately 40:1 generally
observed at the actual cut edge. This may significantly alter the observed chemistry,
particularly if there is reliance on dissolved zinc ions. It is possible that this could be an issue as
it has been suggested in other research that the inhibitor action of benzotriazole is reliant on
the presence of dissolved zinc ions[174].
Weight Loss
One method of characterising the severity of corrosion is to measure the weight difference
between the system before and after exposure. Theoretically, as the metal corrodes through
anodic processes, weight is lost through the creation and expulsion of corrosion products. By
measuring the change in weight as samples corrode, as well as knowing the density and
exposed area of the sample measured, the rate of corrosion can be determined[175].
Whilst this can be a useful, and simple, way of deducing corrosion rates, it is prone to errors.
Some corrosion products can adhere strongly to the substrate surface and, despite efforts to
remove corrosion products, may be included within a weight loss measurement. Similarly,
overzealous cleaning of the substrate to remove corrosion products could potentially lead to
damaging of unaffected substrate and affect the overall result. Similarly, if looking at rates of

74
painted surfaces, the uptake of the electrolyte into the paint, as well as the loss of paint
throughout the test may affect the overall results.
The use of weight loss as a method of understanding corrosion has been evident for over a
century, with Dudley’s work published in 1908[176] primarily using the technique to
understand the effects of soil on the corrosion of pipes in the presence of gas. More recently,
it has been used as a qualitative measure for comparing results[63]. For example, Amadeh et
al[177] used weight loss measurement combined with other methods to compare the
corrosion rate and profile of galvanised steels with rare earth additions to the zinc layer.
Whilst there are some potential drawbacks to the technique, weight loss studies can be used
to form some quantitative results. Ju and Li[178] have attempted to use weight loss
measurements to quantify inhibitor efficiency through adapting the equation used with charge
transfer resistance. Whilst this is potentially an interesting avenue for calculating inhibitor
efficiencies, the previously described issues with the technique could cause problems when
comparing calculated results. The most common quantification of weight loss measurements
appears to be the aforementioned calculation of the corrosion rate of a sample[179].
Corrosion Testing 1.7In the aforementioned analytical techniques, some understanding of materials and
environments can be gained, including theoretical rates and the particular corrosion processes
that may occur. However, whilst this can give a rough idea of the potential uses or drawbacks
in particular applications, the link between laboratory analysis and real world results is
tenuous. Therefore, it is also important to observe the development of corrosion in more
realistic situations. This section will introduce and discuss various methods that have been
developed to mimic more realistic corrosion behaviour.

75
Atmospheric Field Testing
A simple way of testing how materials corrode is to expose them to the environment and
observe how corrosion occurs over a period of time. This is often done with a coated panel
that has standardised defects introduced, such as scribes and bends. The panel is observed
several times over a period of time to analyse the progression of corrosion. Panels are also
tested in a variety of different configurations, facing in different directions to vary wind and
sunlight exposure, and different angles to change the length of time it takes for rain to wash
over the sample.
As it is difficult to accurately measure and characterise the environment in which a particular
sample is in over the length of time of exposure, the overall environment of a particular testing
site is what is characterised.
Following exposure, a variety of tests can be performed. Many of these involve visual analysis
of the test panel as a whole, and potentially measuring corrosion processes that are evident on
the surface, such as edge creep and degree of filiform corrosion for comparative purposes. The
panels can also be used for mechanical testing to observe the effect of corrosion on the
mechanical properties of the material, or be observed under an electron microscope to view
smaller scale corrosion processes such as intergranular corrosion[180].
Field testing is the test that is most representative of a material in real service. However, there
are some issues with the test. As it is not an accelerated test, it can take a long time to gather
useful feedback. The environment also has to be well defined to determine the applicability of
the results to other areas of the world, and environmental variability over a long term must be
taken into account. However, it is worth noting that the real world environmental variability is
not easily replicated in a laboratory environment, which makes this type of testing invaluable.

76
Accelerated Corrosion Testing
As it takes years to gain a more extensive picture by atmospheric field testing, performing all
corrosion testing this way is not feasible. Therefore, the development of tests that cause
realistic corrosive damage on an accelerated timescale was vital. Whilst no accelerated test
can ultimately provide perfect results[181], some widely-used methods of accelerated
corrosion testing have been developed.
Salt Spray
Salt spray testing was one of the first laboratory tests devised for accelerated corrosion
testing[180], and is a method that is still commonly used for testing corrosion.
Whilst salt spray testing is mainly dictated by the ASTM B117 standard, this is not the only
standard available. Many companies have developed their own standard salt spray tests; for
example, Hörnström et al have used a salt spray/humidity test standard that was developed by
Volvo in the analysis of paints on Galvalume substrates[124].
The main issue with salt spray testing is that it is performed with conditions that are closely
controlled and so there are a limited number of variables. This means that it cannot be truly
representative of a real-world environment. To counter this, a comparison standard can be
used, which is a sample that is known to show resistances to both atmospheric and
accelerated corrosion tests that are acceptable[182].
It has been reported that the standard test solution for salt spray does not provide accurate or
reproducible results[49]. Indeed, the applicability of the tests has been doubted in the
literature, particularly for testing sacrificial coatings[183]. Static salt spray testing can be
considered to be a particularly unrealistic test. It has been recognised that corrosion in
atmospheric conditions involves both wet and dry cycles which allows for initial electrolyte
deposition on the surface, followed by electrolyte concentration through evaporation which

77
eventually may lead to solid salt formation on the surface and an eventual washing of the
surface. To produce a more realistic result, cyclic salt spray tests were developed[180].
In regards to cut edge corrosion, salt spray testing is not often used to study the cut edge, and
tend to seal them instead. This is to prevent effects of having thinner organic coatings at the
edges, despite this being the case in real applications.
The sealing of edges can have a noticeable effect on the results obtained from salt spray
testing. In one report, the sealing off of edges decreased the time required for the presence of
visible iron oxide corrosion product appearing on the sample[75]. This potentially shows a
change in corrosion mechanism as a result of the covered edges and brings into question the
validity of the results.
Prohesion Testing
The prohesion test was developed following concerns that the standard procedures for salt
spray testing (ASTM B117) caused failures in systems which were capable in the real world.
The prohesion testing method uses weakened Harrison’s solution as opposed to the 5% salt
solution in ASTM B117. This less aggressive solution is considered to produce more realistic
corrosion results that have a greater reproducibility when used as opposed to the standards
set for normal salt spray testing[49]. It is also considered that prohesion testing is more
representative of real in-service conditions when compared to normal salt spray testing[134].
Prohesion testing has now become a standard itself, and is dictated by several standard
procedures, such as ASTM G85-A5 and ASTM D5894.
Humidity Testing
Testing for corrosion in humidity chambers involves subjecting the material to a high humidity
environment. This is generally invokes mild corrosion and is most relevant for observing early
onset corrosion. It is commonly used for analysis of metal coatings and inhibitive pre-

78
treatments[184]. Conditions that can be controlled in humidity chambers are the relative
humidity level, which tends to be between 75 and 95 percent, of the chamber and the
temperature, which is usually around 25˚C. As with salt spray tests, this can be either static or
cyclic in nature. Many standards for humidity testing have been developed, examples of which
are ASTM A164-55, A165-55[184] and D227[182].
Immersion
Immersion testing is similar to salt spray testing. However, instead of subjecting the sample to
a spray, the sample is immersed in an electrolyte solution. Again, similar to the salt spray
testing, immersion testing can be either cyclic or static in nature. It has been reported that
cyclic immersion improves the accuracy of corrosion results when compared to field testing. It
is thought that this is because the continuous exposure to electrolyte prevents the initiation of
local anodic and cathodic sites that can occur in the atmosphere[185].
Immersion testing is reported to become a more accurate test when an external cathode is
introduced[186]. However, immersion testing in this way results in fairly slow corrosion, and
thus to be considered a reasonable accelerated test, needs a method of further speeding up
the tests. It has also been reported that the use of synthetic rainwater solutions in accelerated
tests can give more realistic corrosion pathways when corrosion products are compared to
field tests[103].
Final Remarks, Aims and Objectives 1.8This introductory section has attempted to highlight the background behind this project and
touch upon the issues that drive it. Corrosion is responsible for substantial global financial
losses, as well as injury. Due to the significant losses, industry is taking notice, and gaining a
greater understanding of corrosion, alongside the development of corrosion prevention
methods, is becoming important.

79
A major cause of failure in coil coated materials is cut edge corrosion. Inhibition of corrosion at
the cut edge is currently done through incorporation of chromate inhibitors. A search for
alternatives has been necessitated by the upcoming restrictions placed on chromates in
Europe by new safety regulations, owing to its toxicity. The more recent industry push towards
complex zinc-aluminium-magnesium alloys increases the difficulty in finding replacements, as
these alloys are not as well characterised.
Characterisation of these new alloys presents an issue in attempting to replicate
microstructure and particular phases that are present. An overarching approach to this
problem would likely require the combination of widely used localised techniques with the
application of new methods of isolating electrochemical information for particular phases and
chemical information through spectroscopy.
This project specifically aims towards improving the understanding of the mechanism of
corrosion inhibitors on multiphase galvanic protection alloy systems. In doing so, it is hoped
that effective corrosion prevention systems can be developed that potentially utilise the
unique corrosion chemistries of these materials.
To do this, this body of work will be using two main approaches. The first is producing a
methodology to observe corrosion inhibitor behaviour on systems containing multiple metals
simultaneously whilst maintaining a more realistic electrochemical environment for each of
the individual materials. Testing of this methodology will be done on a simplified zinc and steel
mimic of galvanised steel using previously characterised industrial inhibitor pigments,
concentrating on strontium chromate as a standard, zinc molyphosphate and a calcium
exchanged silica pigment.
Once the methodology has been verified, the project will then aim to look at a more recent,
newer generation of industrially relevant inhibitor pigments, modified aluminium

80
polyphosphates, concentrating on the strontium, calcium and magnesium modifications to this
pigment.
The second approach will be to, using results obtained from the electrochemical tests, target
pigments of interest and apply additional analytical techniques to gain further insight into the
mechanism of inhibition. Using surface analysis and imaging, such as scanning electron
microscopy, energy dispersive x-ray spectroscopy and x-ray photoelectron spectroscopy, and
manipulating the environment, a greater understanding of the nature of the inhibition of these
pigments can be sought.
81
Chapter References 1.9[1] ISO 8044-1999. Geneve: International Standards Organisation; 2010.
[2] Scully JC. Aqueous Corrosion, in:. The Fundamentals of Corrosion, 2nd ed. Oxford: Pergamon Press; 1975.
[3] Trethewey KR, Chamberlain J. Theory of Aqueous Corrosion, in:. Corrosion for Science and Engineering, 2nd ed. London: Longman Group Limited; 1995.
[4] Piron DL. Basic Electrochemical Concepts and Their Uses, in:. The Electrochemistry of Corrosion. Houston, Texas: NACE International; 1991.
[5] Scully JR. Electrochemical, in:. Baboian R (Ed.). Corrosion Tests and Standards: Application and Interprtation. Philadelphia: ASTM; 1995.
[6] Munger CG. Corrosion as Related to Coatings, in:. Corrosion Prevention by Protective Coatings. Houston, Texas: NACE International; 1984.
[7] Uhlig HH. Corrosion Tendency and Electrode Potentials, in:. Corrosion and Corrosion Control. New York: John Wiley & Sons; 1963.
[8] Wranglen G. Electrochemical Elements, in:. An Introduction to Corrosion and Protection of Metals. London: Chapman and Hall; 1985.
[9] Pourbaix MJN. Thermodynamics of Dilute Aqueous Solutions - With Applications to Electrochemistry and Corrosion. Norwich: Jarrold and Sons; 1949.
[10] Mokaddem M, Volovitch P, Ogle K. Electrochim Acta 2010;55:7867.
[11] Bard AJ, Faulkner LR. Kinetics of Electrode Reactions, in:. Electrochemical Methods: Fundamentals and Applications, 2nd ed. New York: John Wiley & Sons; 2001.
[12] Stewart D, Tulloch DS. Electrode Kinetics, in:. Principles of Corrosion & Protection. London: Macmillan & Co Ltd; 1968.
[13] Bardal E. Electrode Kinetics, in:. Corrosion and Protection. London: Springer-Verlag London; 2003.
[14] Uhlig HH. Passivity, in:. Corrosion and Corrosion Control. New York: John Wiley & Sons; 1963.
[15] Olefjord I, Elfstrom B. Corrosion 1982;38:46.
[16] Bardal E. Passivity, in:. Corrosion and Protection. London: Springer-Verlag London; 2003.
[17] Uhlig HH. Electrochemical Mechanisms, in:. Corrosion and Corrosion Control. New York: John Wiley & Sons; 1963.
[18] Francis R. First Principles, in:. Galvanic Corrosion: A Practical Guide for Engineers. Houston, Texas: NACE International; 2001.
[19] Ketcham S, Pearlstein F, Jankowsky E, Taylor E, Manty B, Snyder W, Hecht R. Metallic Coatings, in:. A Handbook of Protecting Coatings for Military and Aerospace Equipment. Houston, Texas: NACE International; 1983.

82
[20] Rothwell N, Tullmin M. Corrosion Monitoring Handbook, 1st ed. Oxford: Coxmoor; 2000.
[21] Bardal E. Different Forms of Corrosion, in:. Corrosion and Protection. London: Springer-Verlag London; 2003.
[22] Wranglen G. Some Important Types of Electrochemical Corrosion, in:. An Introduction to Corrosion and Protection of Metals. London: Chapman and Hall; 1985.
[23] Bautista A. Prog Org Coatings 1996;28:49.
[24] Donofrio J. Met Finish 2000;98:57.
[25] Fedrizzi L, Deflorian F, Rossi S, Bonora PL. Mater Sci Forum 1998;289–292:485.
[26] van Ooij WJ, Zhu DQ, Prasad G, Jayaseelan S, Fu Y, Teredesai N. Surf Eng 2000;16:386.
[27] Frankel GS, McCreery RL. Interface 2001;10:34.
[28] Grundmeier G, Schmidt W, Stratmann M. Electrochim Acta 2000;45:2515.
[29] Mercer AD, Jenkins IR. Br Corros J 1968;3:130.
[30] Andrade C, Macias A. Br Corros J 1987;22:162.
[31] Luckeneder G, Fleischanderl M, Steck T, Stellnberger K-H, Faderl J, Schuerz S, Mori G. BHM Berg- und Hüttenmännische Monatshefte 2012;157:121.
[32] Trethewey KR, Chamberlain J. Selective Attack, in:. Corrosion for Science and Engineering, 2nd ed. London: Longman Group Limited; 1995.
[33] Wranglen G. Metallurgical Elements, in:. An Introduction to Corrosion and Protection of Metals. London: Chapman and Hall; 1985.
[34] Sullivan J, Mehraban S, Elvins J. Corros Sci 2011;53:2208.
[35] Volovitch P, Vu TN, Allély C, Abdel Aal A, Ogle K. Corros Sci 2011;53:2437.
[36] Salgueiro Azevedo M, Allély C, Ogle K, Volovitch P. Electrochim Acta 2015;153:159.
[37] Uhlig HH. Iron and Steel, in:. Corrosion and Corrosion Control. New York: John Wiley & Sons; 1963.
[38] Uhlig HH. Iron and Steel, in:. Corrosion and Corrosion Control. New York: John Wiley & Sons; 1963.
[39] Zhang XG. Electrochemical Thermodynamics and Kinetic, in:. Corrosion and Electrochemistry of Zinc. New York: Plenum Press; 1996.
[40] Stanojevic D, Toskovic D, Rajkovic MB. J Min Metall Sect B Metall 2005;41:47.
[41] Uhlig HH. Definition and Importance, in:. Corrosion and Corrosion Control. New York: John Wiley & Sons; 1963.
[42] Trethewey KR, Chamberlain J. Corrosion and Society, in:. Corrosion for Science and Engineering, 2nd ed. London: Longman Group Limited; 1995.

83
[43] Biezma M V, San Cristóbal JR. Corrosion 2006;62:1051.
[44] Bhaskaran R, Palaniswamy N, Rengaswamy NS, Jayachandran M, Raghavan M. Corros Eng Sci Technol 2005;40:75.
[45] Akinyemi OO, Nwaukocha CN, Asedanya AO. J Eng Sci Technol 2012;7:517.
[46] Bhaskaran R, Palaniswamy N, Rengaswamy NS, Jayachandran M. Mater Corros 2004;55:865.
[47] Drufke R. Met Finish 2006;104:35.
[48] Graziano F. Met Finish 2000;98:175.
[49] Howard RL, Lyon SB, Scantlebury JD. Prog Org Coatings 1999;37:91.
[50] Munger CG. Essential Coating Characteristics, in:. Corrosion Prevention by Protective Coatings. Houston, Texas: NACE International; 1984.
[51] Uhlig HH. Cathodic Protection, in:. Corrosion and Corrosion Control. New York: John Wiley & Sons; 1963.
[52] Davy H. Philos Trans R Soc London 1824;114:151.
[53] Gellings PJ. Prevention and Control of Electrochemical Corrosion, in:. Introduction to Corrosion Prevention and Control. Delft: Delft University Press; 1985.
[54] Kim J, Joo J, Koo S. J Mater Sci Lett 2000;9:477.
[55] Davy H. Philos Trans R Soc London 1825;115:328.
[56] Department of Industry. Cathodic Protection. London: Institute of Corrosion Science and Technology; 1981.
[57] Pourbaix M. Corros Sci 1974;14:25.
[58] Edavan RP, Kopinski R. Corros Sci 2009;51:2429.
[59] Koehler EL. Corrosion 1984;40:5.
[60] Trethewey KR, Chamberlain J. Cathodic and Anodic Protection, in:. Corrosion for Science and Engineering, 2nd ed. London: Longman Group Limited; 1995.
[61] Wranglen G. Corrosion Protection by Corrosive Medium, in:. An Introduction to Corrosion and Protection of Metals. London: Chapman and Hall; 1985.
[62] Fontana MG. Ind Eng Chem 1955;47:81A.
[63] Pryor MJ, Cohen M. J Electrochem Soc 1953;100:203.
[64] Dariva CG, Galio AF. Corrosion Inhibitors – Principles , Mechanisms and Applications, in:. Aliofkhazraei M (Ed.). Developments in Corrosion Protection. InTech; 2014.
[65] Zhang XG. Properties, Products and Processes, in:. Corrosion and Electrochemistry of Zinc. New York: Plenum Press; 1996.
[66] Chen ZW, Kennon NF, See JB, Barter MA. JOM 1992;44:22.

84
[67] Carter VE. Metallic Coatings for Corrosion Control. London: Butterworth; 1977.
[68] Taniyama A, Arai M, Takayama T, Sato M. Mater Trans 2004;45:2326.
[69] de Oliveira ACL, Rios PR. J Mater Res Technol 2013;2:117.
[70] Chen L, Fourmentin R, Mc Dermid JR. Metall Mater Trans A 2008;39:2128.
[71] Almeida E, Morcillo M. Surf Coatings Technol 2000;124:180.
[72] Bandyopadhyay N, Jha G, Singh AK, Rout TK, Rani N. Surf Coatings Technol 2006;200:4312.
[73] Worsley DA, McMurray HN, Sullivan JH, Williams IP. Corrosion 2004;60:437.
[74] Queiroz FM, Costa I. Surf Coatings Technol 2007;201:7024.
[75] Li F, Lv JS, Yang HG, Zhou F, Zhang L, Wang HK. Appl Mech Mater 2013;442:64.
[76] Lee HH, Hiam D. Corrosion 1989;45:852.
[77] Shibli SMA, Meena BN, Remya R. Surf Coatings Technol 2015;262:210.
[78] Żelechower M, Kliś J, Augustyn E, Grzonka J, Stróż D, Rzychoń T, Woźnica H. Arch Metall Mater 2012;57:517.
[79] Bluni ST, Marder AR, Goldstein JI. Mater Charact 1994;33:93.
[80] Gyurov S, Kostova Y, Parshorov S. J Univ Chem Technol Metall 2012;47:211.
[81] Marder AR. Prog Mater Sci 2000;45:191.
[82] Elvins J, Spittle JA, Worsley DA. Corros Eng Sci Technol 2003;38:197.
[83] Elvins J, Spittle JA, Worsley DA. Corros Sci 2005;47:2740.
[84] Elvins J, Sullivan JH, Spittle JA, Worsley DA. Corros Eng Sci Technol 2005;40:43.
[85] Feliu S, Barranco V. Acta Mater 2003;51:5413.
[86] Rodnyansky A, Warburton YJ, Hanke LD. Surf Interface Anal 2000;29:215.
[87] Shih H., Hsu J., Sun C., Chung S. Surf Coatings Technol 2002;150:70.
[88] Zhang X, Leygraf C, Odnevall Wallinder I. Corros Sci 2013;73:62.
[89] Barnard NC, Brown SGR. Corros Sci 2008;50:2846.
[90] Lin K-L., Yang C-F, Lee J-T. Corrosion 1991;47:9.
[91] Li Y. Bull Mater Sci 2001;24:355.
[92] Selverian JH, Marder AR, Notis MR. Metall Trans A 1988;19:1193.
[93] LeBozec N, Thierry D, Rohwerder M, Persson D, Luckeneder G, Luxem L. Corros Sci 2013;74:379.
[94] Palma E, Puente JM, Morcillo M. Corros Sci 1998;40:61.

85
[95] McMurray HN. Corrosion 2001;57:313.
[96] Zhang X, Vu T-N, Volovitch P, Leygraf C, Ogle K, Wallinder IO. Appl Surf Sci 2012;258:4351.
[97] Panossian Z, Mariaca L, Morcillo M, Flores S, Rocha J, Peña JJ, Herrera F, Corvo F, Sanchez M, Rincon OT, Pridybailo G, Simancas J. Surf Coatings Technol 2005;190:244.
[98] Seré PR, Zapponi M, Elsner CI, Di Sarli AR. Corros Sci 1998;40:1711.
[99] Domínguez-Crespo MA, Onofre-Bustamante E, Torres-Huerta AM, Rodríguez-Gómez FJ, Rodil SE, Flores-Vela A. Metall Mater Trans A 2009;40:1631.
[100] Schuerz S, Fleischanderl M, Luckeneder GH, Preis K, Haunschmied T, Mori G, Kneissl AC. Corros Sci 2009;51:2355.
[101] Vimalanandan A, Bashir A, Rohwerder M. Mater Corros 2014;65:392.
[102] Arndt M, Duchoslav J, Itani H, Hesser G, Riener CK, Angeli G, Preis K, Stifter D, Hingerl K. Anal Bioanal Chem 2011;403:651.
[103] Salgueiro Azevedo M, Allély C, Ogle K, Volovitch P. Corros Sci 2015;90:472.
[104] Schürz S, Luckeneder GH, Fleischanderl M, Mack P, Gsaller H, Kneissl AC, Mori G. Corros Sci 2010;52:3271.
[105] Kollárová M, Hrabčáková L, Graban J, Šohajová M. Mater Sci Forum 2014;782:623.
[106] Sinko J. Prog Org Coatings 2001;42:267.
[107] Zin IM, Howard RL, Badger SJ, Scantlebury JD, Lyon SB. Prog Org Coatings 1998;33:203.
[108] Baghni IM, Lyon SB. Corros Eng Sci Technol 2005;40:165.
[109] Prosek T, Thierry D. Prog Org Coatings 2004;49:209.
[110] Brasher M. Trans Faraday Soc 1958;54:1214.
[111] Kubaschewski BY, Brasher DM. Trans Faraday Soc 1959;55:1200.
[112] Clark WJ, McCreery RL. J Electrochem Soc 2002;149:B379.
[113] Onuchukwu AI, Lori JA. Corros Sci 1984;24:833.
[114] Kendig MW, Davenport AJ, Isaacs HS. Corros Sci 1993;34:41.
[115] Baghni I., Lyon S., Ding B. Surf Coatings Technol 2004;185:194.
[116] Mayne JEO, Pryor MJ. J Chem Soc 1949;0:1831.
[117] World Health Organization. Chromium and Chromium Compounds, in:. IARC Monographs on the Evaluation of Carcinogenic Risks to Humans - Chromium, Nickel and Welding. Lyon: International Agency for Research on Cancer; 1990.
[118] Naderi R, Attar MM. Electrochim Acta 2008;53:5692.
[119] Bastos AC, Ferreira MG, Simões AM. Corros Sci 2006;48:1500.
86
[120] Simões AM, Torres J, Picciochi R, Fernandes JCS. Electrochim Acta 2009;54:3857.
[121] Zin IM, Lyon SB, Pokhmurskii VI, Simmonds MC. Corros Eng Sci Technol 2004;39:167.
[122] Sullivan J, Cooze N, Gallagher C, Lewis T, Prosek T, Thierry D. Faraday Discuss 2015;180:361.
[123] van Ooij WJ, Zhu DQ, Prasad G, Jayaseelan S, Fu Y, Teredesai N. Surf Eng 2000;16:386.
[124] Hörnström S, Karlsson J, Van Ooij WJ, Tang N, Klang H. J Adhes Sci Technol 1996;10:883.
[125] Simões AMP, Carbonari RO, Di Sarli AR, Del Amo B, Romagnoli R. Corros Sci 2011;53:464.
[126] Custódio J V., Agostinho SML, Simões AMP. Electrochim Acta 2010;55:5523.
[127] McMurray HN, Powell SM, Worsley DA. Br Corros J 2001;36:42.
[128] McMurray HN, Williams D, Worsley DA. ECS Trans 2006;1:153.
[129] Loveridge MJ, McMurray HN, Worsley DA. Corros Eng Sci Technol 2006;41:240.
[130] Robertson WD. J Electrochem Soc 1951;98:94.
[131] Twite RL, Bierwagen GP. Prog Org Coatings 1998;33:91.
[132] Zin IM, Pokhmurskii VI, Scantlebury JD, Lyon SB. J Electrochem Soc 2001;148:B293.
[133] Zin’ IM, Lyon SB, Bilyi LM, Tymus’ MB. Mater Sci 2008;44:638.
[134] Walker DE, Wilcox GD. Trans Inst Met Finish 2008;86:251.
[135] Qian YJ, Turgoose S. Br Corros J 1987;22:268.
[136] Monticelli C, Brunoro G, Frignani A, Trabanelli G. J Electrochem Soc 1992;139:706.
[137] Ogle K, Baudu V, Garrigues L, Philippe X. J Electrochem Soc 2000;147:3654.
[138] Ogle K, Morel S, Jacquet D. J Electrochem Soc 2006;153:B1.
[139] Penney D, Sullivan J, Worsley D. Corros Sci 2007;49:1321.
[140] Worsley DA, McMurray HN, Belghazi A. Chem Commun 1997;0:2369.
[141] Worsley DA, Williams D, Ling JSG. Corros Sci 2001;43:2335.
[142] Challis M, Worsley DA. Br Corros J 2001;36:297.
[143] Deshpande P, Deshpande P, Vagge S. UPB Sci Bull Ser B Chem Mater Sci 2013;75:251.
[144] Howard RL, Zin IM, Scantlebury JD, Lyon SB. Prog Org Coatings 1999;37:83.
[145] Chiba A, Muto I, Hara N. J Electrochem Soc 2011;158:C42.
[146] Jia JX, Song G, Atrens A. Corros Sci 2006;48:2133.
[147] Flitt HJ, Schweinsberg DP. Corros Sci 2005;47:2125.
[148] Callow LM, Richardson JA, Dawson JL. Br Corros J 1976;11:123.

87
[149] Callow LM, Richardson JA, Dawson JL. Br Corros J 1976;11:132.
[150] Hines JG. Br Corros J 1983;18:10.
[151] Zin IM, Lyon SB, Pokhmurskii VI. Corros Sci 2003;45:777.
[152] Christensen PA, Hamnett A. Techniques Giving Mechanistic Information, in:. Techniques and Mechanisms in Electrochemistry. Glasgow: Chapman and Hall; 1994.
[153] Shoar Abouzari MR, Berkemeier F, Schmitz G, Wilmer D. Solid State Ionics 2009;180:922.
[154] Jorcin J-B, Orazem ME, Pébère N, Tribollet B. Electrochim Acta 2006;51:1473.
[155] Randles JEB. Discuss Faraday Soc 1947;1:11.
[156] Naderi R, Attar M. Dye Pigment 2009;80:349.
[157] Pokhmurs’kyi VI, Zin’ IM, Lyon SB. Mater Sci 2004;40:383.
[158] Simões AM, Fernandes JCS. Prog Org Coatings 2010;69:219.
[159] Yıldız R, Dehri İ. Arab J Chem 2013;8:821.
[160] Delucchi M, Barbucci A, Cerisola G. Electrochim Acta 1999;44:4297.
[161] Dehri I, Howard RL, Lyon SB. Corros Sci 1999;41:141.
[162] Mansfeld F. Electrochim Acta 1990;35:1533.
[163] Epelboin I, Keddam M, Takenouti H. J Appl Electrochem 1972;2:71.
[164] Bastos AC, Ferreira MGS, Simões AM. Prog Org Coatings 2005;52:339.
[165] Lamaka S, Souto RM, Ferreira MGS. In-Situ Visualization of Local Corrosion by Scanning Ion-Selective Electrode Technique ( SIET ), in:. Mendez-Vilas A, Diaz J (Eds.). Microsc. Sci. Technol. Appl. Educ. Formatex Research Center; 2010.
[166] Alvarez-Pampliega A, Lamaka SV, Taryba MG, Madani M, De Strycker J, Tourwé E, Ferreira MGS, Terryn H. Electrochim Acta 2012;61:107.
[167] Zdrachek EA, Karotkaya AG, Nazarov VA, Andronchyk KA, Stanishevskii LS, Egorov V V, Taryba MG, Kpoylovich SM, Lamaka S V. Sensors Actuators B Chem 2015;207B:967.
[168] Bernard MC, Hugot-Le Goff A, Phillips N. J Electrochem Soc 1995;142:2162.
[169] Muster TH, Cole IS. Corros Sci 2004;46:2319.
[170] Duchoslav J, Arndt M, Steinberger R, Keppert T, Luckeneder G, Stellnberger KH, Hagler J, Riener CK, Angeli G, Stifter D. Corros Sci 2014;83:327.
[171] Vu AQ, Vuillemin B, Oltra R, Allély C. Corros Sci 2011;53:3016.
[172] Hollander JM, Jolly WL. Acc Chem Res 1970;3:193.
[173] Aramaki K. Corros Sci 2001;43:1573.
[174] Kendig M, Jeanjaquet S, Addison R, Waldrop J. Surf Coatings Technol 2001;140:58.

88
[175] Arnold CG. Corrosion Testing Techniques, in:. Schweitzer PA (Ed.). Corrosion and Corrosion Protection Handbook. New York: Marcel Dekker, Inc.; 1983.
[176] Dudley WL. J Am Chem Soc 1908;30:247.
[177] Amadeh A, Pahlevani B, Heshmati-Manesh S. Corros Sci 2002;44:2321.
[178] Ju H, Li Y. Corros Sci 2007;49:4185.
[179] Mansfeld F, Tsai S. Corros Sci 1980;20:853.
[180] Lawson HH. Atmospheric Corrosion Test Methods, 4th ed. New York: NACE International; 1995.
[181] Rommal HEG, Lawson KM, Tiburcio AC, Lawson HH. Accelerated Test Development for Coil-Coated Steel Building Panels, in:. Corrosion 98. 1998.
[182] Singleton R. Met Finish 2012;110:12.
[183] Baldwin KR, Smith CJE. Aircr Eng Aerosp Technol 1999;71:239.
[184] Carter VE. Corrosion Testing for Metal Finishing. London: Butterworth Scientific; 1982.
[185] Hosking NC, Ström MA, Shipway PH, Rudd CD. Corros Sci 2007;49:3669.
[186] Howard RL, Lyon SB, Scantlebury JD. Prog Org Coatings 1999;37:99.

89
2 Chapter 2 - Materials and Methodology
Introduction 2.1In this section, the methodology behind the experimental results and the materials used
throughout this thesis are formally introduced. The details contained within are to be used
alongside the experimental sections of the relevant chapters in order to give a full picture of
the conditions in which the experiments were undertaken.
The materials section details any chemicals or other materials used either in sample
preparation or within the actual experiments. In either case, the name, supplier and any other
supplementary information will be given (purities, thicknesses etc.). In the experimental
section, the details of any equipment, chemicals and preparation steps will be given. It is
hoped that this section may help any person who wishes to perform these experiments by
giving the specifics that are likely to differ in any future attempts to either replicate or expand
upon these works.
It is important to note that the background theories and workings with regards to the
equipment that was utilised throughout this thesis are outlined in the ‘Literature Review’
section of this thesis. Furthermore, the relevant methodologies, containing more specific
details are laid out in the experimental section of each chapter.
Materials 2.2Metal Substrates
Metal substrates comprise an essential part of all experimentation done throughout this
thesis. For the three electrode set-up, the substrates used were mild steel rod (3mm diameter,
0.05% carbon steel), zinc rod (3mm diameter, 99.99+% purity zinc, Goodfellow) and aluminium
rod (3mm diameter, 99.95% purity aluminium, Goodfellow). For all other experiments, the

90
substrates used were mild steel sheet (0.8 mm thickness, Q-Labs, as received) and zinc sheet
(20 µm, Goodfellow). All substrates were used as received with no additional heat treatments
or other processing, other than those mentioned within the experimental procedures.
Corrosion Inhibitors
The corrosion inhibitors that were used throughout this work were selected to be of future
and historical relevance to industrial applications within coil coating. Strontium chromate
(SrCrO4) was selected as a readily available hexavalent chromium compound which is known to
be an effective corrosion inhibitor. First generation chromate replacements with fairly well
understood inhibitor behaviour were selected to be looked at in the initial tests. These were
calcium ion-exchanged silica (Shieldex CP4-7394, GRACE) and zinc molyphosphate (Actirox 106,
Nubiola), a second generation phosphate pigment. Finally, various modified aluminium
polyphosphates, third generation phosphate pigments of industrial relevance, were also
selected to be analysed. These were modified strontium aluminium polyphosphate, controlled
adjusted modified (HEUCOPHOS® SRPP, Heubach), calcium aluminium polyphosphate silicate
hydrate (HEUCOPHOS® CAPP, Heubach) and magnesium aluminium polyphosphate (Novinox®
PAM, SNCZ). All inhibitor pigments were used as received with no additional purification or
modifications, unless otherwise stated within the methodology.
Metal Chlorides
A number of metal chlorides were used throughout the experimental work given in this thesis.
Sodium chloride (NaCl) was used in large quantities to produce the solutions in which all
immersion tests were performed. In addition, zinc chloride (ZnCl2), calcium chloride (CaCl2),
magnesium chloride (MgCl2) and aluminium chloride (AlCl3) have all been used as solution
additions.

91
Methodology 2.3Mounting Metal Samples for Electrochemical Testing
The mounting of metal samples was done slightly differently, depending on whether it was for
use in the two working electrode system or the three working electrode system.
In the case of the two working electrode system, steel (2 cm x 1 cm x 0.8 mm) and zinc (2 cm x
1 cm x 25 μm) each had a wire attached to the corner of the largest flat face (steel by spot
welding, zinc by soldering). Each metal was separately mounted in a small circular mould stood
upright with the long, thin face flat at the bottom, allowing the wire to protrude upwards. The
wire was surrounded with a thin, plastic tube and the mould was filled with two part epoxy
resin (Araldite 3138 and Arudur 3140, in a 10:1 ratio), which was left to set at room
temperature for a minimum of 24 hours.
For the cut-edge geometry, the metals were mounted in parallel to each other. Double sided
adhesive tape was utilised at the top side (near the wire mounting) to ensure electrical
separation of the two metals whilst maintaining close geometry and the wires were
surrounded by the same plastic tubing. A diagram showing this configuration is given in Figure
2.3.1
Figure 2.3.1 - Orientation of working electrodes in the secondary segmented electrode impedance tests, designed to mimic an exposed cut edge.

92
In the case of the three working electrode system, steel, zinc and aluminium rod (3 mm
diameter, approx. 10 mm length) each have a wire attached by spot welding, soldering and
crimping, respectively. Each metal is surrounded in shrink wrap and then placed in a mould
around a piece of tubing in such a way as to produce three points of an equilateral triangle.
Each wire in this case is encased in its own individual plastic casing, and the mould is filled
using the two part epoxy resin, as previously described. A diagram showing this configuration
is given in Figure 2.3.2.
Figure 2.3.2 - Schematic representation of the geometry of the three working electrode setup utilised (1 – steel, 2 – zinc, 3 – aluminium, R – reference)
Preparing Solutions for Immersion
Solution preparation was slightly different, dependant on the experiment. For the
electrochemical measurements, sodium chloride was dissolved in deionised water to produce
a solution of concentration 0.6 M (3.5 wt%). This concentration is representative of the typical
salt concentration in seawater. Into 500 ml of sodium chloride solution, an excess of corrosion
inhibitor pigment was added. This mixture was then stirred using a magnetic stirrer and stirrer
bar for 24 hours, and then left to settle until cooled to room temperature. The solution was
93
then transferred to a clean 500 ml volumetric flask through a filter paper to remove any excess
solids, a process which was repeated until the solution ran clear (Note: for strontium
chromate, this process was repeated until no solid particles could be seen).
For the studies involved SEM-EDX or XPS, sodium chloride was dissolved in deionised water to
produce a solution of concentration 0.86 M (5 wt%). 0.1 M solutions of each of the metal
chlorides were also produced. A calculated volume of 0.1M metal chloride was added to a 500
ml volumetric flask, and brought up the mark using the sodium chloride solution. Into this
solution, an excess of corrosion inhibitor pigment was added. The preparation then proceeded
as outlined in the previous paragraph.
Surface Preparations for Electrochemical Studies
For electrochemical studies, firstly the set sample was removed and ground using 80 grit
silicon carbide paper until the full area of the metal was exposed to the environment. In the
case of the three working electrode set-up, additionally the inner tube circle was also needed
to be open and exposed. The sample was then ground using silicon carbide papers of
subsequent grades from 160 to 1200 grit. For samples with wires, following surface
preparation, the tube encasing the wires was then also heated until flexible and gently bent,
allowing for the sample to be exposed vertically during the immersion process.
Electrochemical Measurements (2 Working Electrodes)
For the electrochemical measurements utilising two working electrodes, an ACM Gill AC Weld
Tester was used for taking measurements. The ACM Gill AC Weld Tester is a potentiostat with
multiple working electrodes connected via zero resistance ammeters. This allows multiple
electrodes to be polarised whilst measuring the currents of each electrode independently. An
example schematic is shown in Figure 2.3.3.

94
Figure 2.3.3 - An example schematic for the ACM Gill AC Weld Tester utilising two working electrodes
The substrates were attached to the potentiostat intakes denoted as working electrodes 1 and
2. The electrodes were immersed in the relevant solution with a platinum auxiliary electrode
and saturated calomel reference electrode. The geometry of the immersion was dependent on
the experiment, and a more detailed explanation of the cell geometry is given in the particular
chapter section.
The experiment was controlled with the proprietary ACM potentiostat software. The standard
experimental procedure in this case used the “Weld Impedance” functionality. An impedance
measurement was taken every two hours with the experimental parameters using a frequency
range of 0.01 Hz to 10 MHz and perturbation amplitude of 10 mV from the measured coupled
corrosion potential. Following an impedance measurement, the procedure used the
“current/voltage” functionality to ensure the metals remained at the coupled potential. This
was then repeated until the experiment had completed the 72 hour observation period.
Selected spectra were then taken and analysed using Scriber’s ZView software.

95
Electrochemical Measurements (3 Working Electrodes)
For the electrochemical measurements utilising three working electrodes, an ACM Gill AC
Weld Tester was used for taking measurements. The substrates were attached to the
potentiostat intakes denoted as working electrodes 1, 2 and 3. The electrodes were immersed
in the relevant solution with a platinum auxiliary electrode and saturated calomel reference
electrode. The geometry of the cell was consistent across all experiments utilising three
working electrodes, and this set-up is explained in more details in the relevant chapter.
The experiment was controlled with the proprietary ACM potentiostat software. The standard
experimental procedure in this case used the “Weld Impedance” functionality. An impedance
measurement was taken every two hours with the experimental parameters using a frequency
range of 0.01 Hz to 10 MHz and perturbation amplitude of 10 mV from the measured coupled
potential of the system. Following an impedance measurement, the procedure used the
“current/voltage” functionality to ensure the metals remained at the coupled potential. This
was then repeated until the experiment had completed the 72 hour observation period.
Following the observation period, a potentiodynamic sweep was then measured. This was a
sweep from -1200 mV to -450 mV at a sweep rate of 0.3 mV s-1. Following the completion of
the full experiment, selected spectra were then taken and analysed using Scriber’s ZView
software. Potentiodynamic polarisation curves were exported as plain text and analysed in
Origin.
Immersing Samples for Scanning Electron Microscopy
Following surface preparation, samples were immersed in a small amount of sodium chloride
solution saturated with inhibitor pigment, with a small amount of additional metal chloride
added if the particular experiment required it. The sample was placed at the bottom of the
beaker with the exposed surface facing upwards to ensure the sample did not fall and become

96
covered or partially covered. Immersion lasted for 72 hours, upon which the sample was
removed from the solution and washed gently with deionised water. The sample was then
dried and placed under dry conditions until it could be analysed using the electron microscope.
Scanning Electron Microscopy and Energy Dispersive X-Ray Spectroscopy
Samples were attached to a metallic stub using conductive carbon adhesive stickers. For
samples that had been exposed to electrochemical tests, wires protruded from the substrate
sample through the thickness of epoxy resin mounting material, and therefore these wires
produced a conductive pathway. For samples that were not exposed to electrochemical testing
prior to electron microscopy, a conductive pathway down to the bottom side of the mounting
epoxy was produced using silver containing paint. All scanning electron microscope images and
EDX spectra were obtained from a Zeiss Evo 50 scanning electron microscope instrument with
EDX attachment. Electron microscope images and EDX spectra used an accelerating voltage of
12 keV.
Ex-situ Sample Preparation for X-Ray Photoelectron Spectroscopy
The x-ray photoelectron spectroscopy measurements were taken on a mild steel substrate.
Utilising mild steel panels cut to size (2 cm x 1 cm x 0.8 mm), the samples were ground and
polished to a mirror finish, on all faces, utilising silicon carbide paper of subsequent grit grades
from 400 to 4000, followed by polishing with 3 μm and 0.25 μm diamond suspension paste. A
wire was then spot welded to the corner of the largest face. The wire was encased within a
plastic tube which was affixed to the sample using a mixture of beeswax and colophony.
The sample was immersed in a solution containing sodium chloride and inhibitor pigments
and/or other metal chlorides as appropriate (the formation of these solutions was outlined
earlier in the chapter). The sample was attached to a potentiostat (ACM AC Gill Weld Tester or
ACM AC Gill Potentiostat) and potentiostatically polarised to the measured couple potential of

97
a steel and zinc couple, as measured from the EIS measurements for that particular inhibitor,
for a period of time (either 30 minutes, 5 hours or 12 hours, dependant on sample).
Following immersion, the sample is gently washed with deionised water and dried. The wire
and wax are then removed by cutting the sample with a guillotine. The remaining sample is
then covered in aluminium foil and placed in a desiccator until the sample can be analysed.
X-Ray Photoelectron Spectroscopy
For the initial experiments utilising zinc chloride as the metal chloride additive to the solution,
the measurements were carried out on a Kratos AXIS Ultra with a monochromated Al x-ray
source at the University of Manchester. Samples were placed on a sample bar and loaded into
the instrument chamber. Upon depressurisation of the chamber, each of the samples was
focussed using the C1s and O1s peaks. A survey spectrum was taken to determine the
presence of elements of interest. Using this, relevant areas for high resolution spectra could be
decided and programmed into the scan.
For the samples utilising metal chlorides other than zinc chloride, the measurements were
carried out on the Kratos AXIS Nova with a monochromated Al x-ray source at the AkzoNobel
site in Sassenheim. Following loading samples onto the sample plate, the process followed was
as described for the Kratos AXIS Ultra. In both cases, spectra were analysed using the CasaXPS
software package.

98
3 Chapter 3 - Electrochemical Impedance with Segmented
Electrodes for Modelling Zinc Coated Steel
Chapter 3
Electrochemical Impedance with Segmented
Electrodes for Modelling Zinc Coated Steel

99
Introduction 3.1As mentioned previously, in the literature review section, the environmental and legislative
issues surrounding hexavalent chromium compounds have resulted in a need for research into
chromate replacement inhibitor pigments. Unfortunately, these current chromate
replacements do not possess the same level of effectiveness and versatility. Furthermore, the
lack of mechanistic knowledge surrounding many of these pigments means the coatings
industry relies heavily on anecdotal evidence and long-term tests to determine paint
formulations.
One commonly used electrochemical method for analysing inhibitor mechanisms, especially
when contained in coatings, is electrochemical impedance spectroscopy (EIS). Through
observing the changes in how a system interacts with sinusoidal electrochemical perturbation,
various aspects of a system can be interpreted, including mechanistic information through the
analysis of time constants[1] and efficiency or effectiveness of each mechanism through
comparison of the analysed numbers[2]. However, by its nature EIS can only provide a
representation of the macroscopic system. Of particular concern, when dealing with complex
multiple metal systems, is that any areas where the impedance is lower will dominate the
obtained spectra, producing results that are not fully representative of the whole system.
Therefore developing an understanding of the electrochemistry of multi-phase alloys and
multiple metal systems necessitates an alternative approach.
One such approach that can be proposed is the use of spatially separated electrodes that are
attached to individual zero-resistance ammeters and then coupled through an overarching
potentiostat. Dawson et al[3] have previously described the use of multiple zero resistance
ammeters grounded through a singular potentiostat as a method capable of measuring the
response of individual electrodes as part of an overall coupled system. A simplified schematic
for this electrochemical set-up can be seen in Figure 2.3.3[4] (Methodology, Page 94) . This
particular methodology allows a number of different electrochemical experiments to be

100
performed on a set of segmented electrodes in order to determine information about each
individual segment in the system.
However, whilst this spatially separated electrode set up has been known for some time,
literature describing the practical application of this technique is scarce. Woollam et al[4] have
used the technique to determine the differences seen in erosion corrosion between electrode
surfaces that were are nominally identical. Segmented electrode electrochemical techniques
have also found use in the analysis of welded materials [5–9], whereby the weld is segmented
into its component parts (i.e. parent metal, heat affected zone and fusion zone) and the
influence of the corrosive environment as well as inhibition can then be studied on the
individual components of the welded system.
Much previous literature in this domain mainly concentrates on weld materials or nominally
similar materials and does not touch on the potential application of the technique for use in
macro-galvanic cells with distinct metals, such as galvanised steel.
This chapter will concentrate on analysing the applicability of using electrochemical impedance
with segmented electrodes within a macro-galvanic system. It will aim to verify the use of this
methodology by utilising inhibitor systems in which the mechanism of action is better
understood. Electrochemical impedance with segmented electrodes will then be applied to
modified aluminium polyphosphate corrosion inhibitors, a prevailing class of chromate
replacement pigments, in an attempt to understand better their mode of action.
Verification of Technique 3.2
3.2.1 Introduction
The aim of this preliminary study was to determine the feasibility of investigating corrosion
inhibition on complex multiple metal systems through a novel application of a previously
developed segmented electrode technique designed for observing welds. This was to be done
through testing inhibitor pigments which have behaviours that have previously been reported

101
in the literature for galvanised steel with a simple zinc coating. To obtain results in these tests
that were indicative of zinc coated steel, a simplified model was devised. The simplifications to
the model were as follows:
Separate electrodes of pure steel and pure zinc were to be used as an analogue for
the components of galvanised steel
The steel and zinc electrodes were of the same size and geometry to minimize any
geometrical effects
The steel and zinc electrodes were to be spatially separated on the macro scale to
minimize interference through local chemistry effects.
In doing this, it was hoped that the use of electrochemical impedance with segmented
electrode could be verified as a potential method for understanding the inhibition process on
various components of a complex multiple metal system.
3.2.2 Experimental
Experiments concentrated on following the effects of dissolved corrosion inhibitors on the
anodic (zinc) and cathodic (steel) electrodes simulating the cut edge of a galvanised steel
sheet. 1 cm2 samples of mild steel (Q-Labs, as received) and zinc (Goodfellow, as received)
were separately mounted in epoxy resin, and ground using incremental grades of silicon
carbide abrasive discs, up to and including 1200 grade, so as to leave a single flat surface
exposed to the environment.
The zinc and steel were then immersed in a 3.5 weight % (approximately 0.6M) sodium
chloride solution containing leached species from an inhibitor pigment. Thus, saturated
solutions of relevant inhibitors were prepared by introducing approximately 2 g of solid into 1
L of electrolyte, and stirred continuously for 24 h. The solution was then filtered to remove any
remaining excess solid from the solution. The concentrations of inhibitive species in solution
were not measured in this work as the solubility comparison between pigments was not

102
deemed to be of interest at this stage as the differences are likely to be similar from real world
pigment leaching.
A four-electrode cell was used and attached to an ACM AC Weld Test instrument, utilising steel
and zinc as two working electrodes, a saturated calomel reference electrode and a platinum
counter electrode. The electrode arrangement was as displayed in Figure 3.2.1. The system
was at laboratory temperature (18-21°C) monitored for 72 h, with electrochemical impedance
measurements taken every 2 h for the duration of the experiment. The impedance
measurements were taken in the frequency range of 10,000 Hz to 0.01 Hz with a signal
amplitude of 10 mV. These measurements were taken at the mixed potential of the iron and
zinc couple. This was determined automatically by the potentiostat immediately before the
spectrum was taken.
Figure 3.2.1 - The orientation of electrodes as used in the segmented electrode impedance tests (R - saturated calomel reference electrode, C - platinum counter electrode)
3.2.3 Results
EIS data for uninhibited steel and zinc are shown in Figure 3.2.2, while Figure 3.2.3 shows
similar data for steel and zinc in saturated strontium chromate, Figure 3.2.4 in saturated
calcium ion-exchanged silica, Figure 3.2.5 in saturated zinc molyphosphate and Figure 3.2.6 in
a mixture of saturated calcium ion-exchanged silica and zinc molyphosphate. It is re-stated

103
here that these measurements are carried out at the overall mixed couple potential and the
steel is therefore polarised net cathodically and the zinc polarised net anodically. The graphs
shown are from representative data that are, post processing, shown to have approximately
median values once anomalous results have been removed.
0 100 200 300 400
0
50
100
150
Z''
/ O
hm
cm
2
Z' / Ohm cm2
Uninhibited (Steel)
0 10 20 30 40
0
2
4
6
8
10
Z''
/ O
hm
cm
2
Z' / Ohm cm2
Uninhibited (Zinc)
Figure 3.2.2 - Nyquist plots obtained for the blank, uninhibited 0.6M sodium chloride solution for steel (cathodic, left) and zinc (right) electrodes of equal area.
0 500 1000 1500 2000 2500 3000 3500 4000 4500
0
200
400
600
800
1000
1200
1400
1600
1800
Z''
/ O
hm
cm
2
Z' / Ohm cm2
2 h
12 h
24 h
0 250 500 750 1000 1250 1500
0
100
200
300
400
500
2 h
12 h
24 h
Z''
/ O
hm
s c
m2
Z' / Ohms cm2
Figure 3.2.3 - Nyquist plots obtained for the strontium chromate inhibited 0.6M sodium chloride solution for steel (cathodic, left) and zinc (right) electrodes of equal area.
0 200 400 600 800 1000
0
100
200
300
400
Z''
/ O
hm
cm
2
Z' / Ohm cm2
2 h
12 h
24 h
0 50 100 150
0
25
50
Z''
/ O
hm
cm
2
Z' / Ohm cm2
2 h
12 h
24 h
Figure 3.2.4 - Nyquist plots obtained for the calcium exchanged silica inhibited 0.6M sodium chloride solution for steel (cathodic, left) and zinc (right) electrodes of equal area.
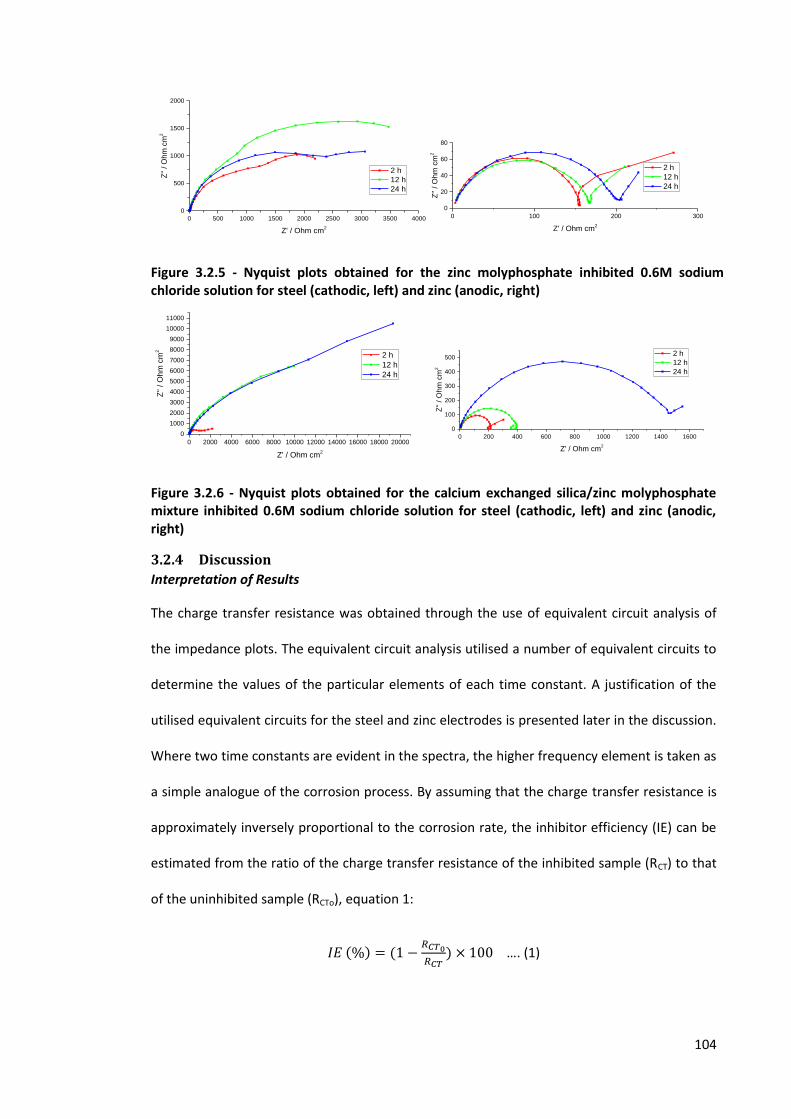
104
0 500 1000 1500 2000 2500 3000 3500 4000
0
500
1000
1500
2000
Z''
/ O
hm
cm
2
Z' / Ohm cm2
2 h
12 h
24 h
0 100 200 300
0
20
40
60
80
Z''
/ O
hm
cm
2
Z' / Ohm cm2
2 h
12 h
24 h
Figure 3.2.5 - Nyquist plots obtained for the zinc molyphosphate inhibited 0.6M sodium chloride solution for steel (cathodic, left) and zinc (anodic, right)
0 2000 4000 6000 8000 10000 12000 14000 16000 18000 20000
0
1000
2000
3000
4000
5000
6000
7000
8000
9000
10000
11000
Z''
/ O
hm
cm
2
Z' / Ohm cm2
2 h
12 h
24 h
0 200 400 600 800 1000 1200 1400 1600
0
100
200
300
400
500
Z''
/ O
hm
cm
2
Z' / Ohm cm2
2 h
12 h
24 h
Figure 3.2.6 - Nyquist plots obtained for the calcium exchanged silica/zinc molyphosphate mixture inhibited 0.6M sodium chloride solution for steel (cathodic, left) and zinc (anodic, right)
3.2.4 Discussion
Interpretation of Results
The charge transfer resistance was obtained through the use of equivalent circuit analysis of
the impedance plots. The equivalent circuit analysis utilised a number of equivalent circuits to
determine the values of the particular elements of each time constant. A justification of the
utilised equivalent circuits for the steel and zinc electrodes is presented later in the discussion.
Where two time constants are evident in the spectra, the higher frequency element is taken as
a simple analogue of the corrosion process. By assuming that the charge transfer resistance is
approximately inversely proportional to the corrosion rate, the inhibitor efficiency (IE) can be
estimated from the ratio of the charge transfer resistance of the inhibited sample (RCT) to that
of the uninhibited sample (RCTo), equation 1:
…. (1)

105
Table 3.2-1 gives the charge transfer resistances obtained through the equivalent circuit
analysis of the obtained impedance spectra. Table 3.2-2 gives the calculated inhibitor
efficiencies for all inhibitor pigments studied in this section.
Charge Transfer Resistance (Rct) / Ohm cm2
Time Uninhibited
Zinc
Molyphosphate
Calcium
Exchanged
Silica Mixture
Strontium
Chromate
Steel
2 h 650 1900 690 2200 3800
12 h
3400 1600 3600 3500
24 h
2600 1700 3800 4500
Zinc
2 h 45 63 46 130 760
12 h
71 43 140 980
24 h
98 45 150 1100
Table 3.2-1 - Obtained charge transfer resistances at selected time intervals for inhibited samples, and the value obtained for the initial uninhibited sample. Fitting errors for the values given were plus/minus less than 3%.
Inhibitor Efficiency / %
Time ZMP CES MIX CRO
Steel
2h 65 5 71 83
12h 81 59 82 81
24h 75 62 83 85
Zinc
2h 29 3 65 94
12h 37 -5 68 96
24h 55 1 71 96
Table 3.2-2 - Calculated inhibitor efficiency percentages for each inhibitor system tested at selected time intervals (ZMP – Zinc molyphosphate, CES – calcium exchanged silica, MIX – mixture of calcium exchanged silica and zinc molyphosphate, CRO – strontium chromate)
In previous studies[10,11], chromate has been found to provide corrosion protection through a
mixed-action inhibitor mechanism, acting as an anodic inhibitor for zinc dissolution and as a
cathodic inhibitor for steel. The results obtained in this set of experiments show high inhibitor
efficiency on both steel and zinc that begins at the earliest time frame analysed (2 hours). The

106
relatively high initial anodic inhibition is consistent with a proposed mechanism that requires
chromate conversion to Cr (III) for cathodic inhibition.
Calcium exchanged silica is known to act on the cathodic process by precipitation of a solid
film[12] and this is shown clearly here where only the steel component of the couple is
inhibited, which is consistent with previous evidence in the literature [13], Notably, this
inhibition was very limited after only 2 h exposure but increased to a more reasonable value
after 24 h. Zinc molyphosphate shows significant cathodic inhibition with a low level of anodic
inhibition also evident. The reports of cathodic inhibition are consistent with observations
made by previous reports[13,14]. The polarisation curves presented by Zin et al[14] also
appear to be shifted in the positive direction, suggesting that a degree of anodic protection
may be evident. This, again, would be consistent with the data obtained in the current study.
A mixture of calcium exchanged silica and zinc molyphosphate inhibitor pigments has been
previously researched as a potential chromate replacement. Studies have determined that
synergistic interactions between the two produce an inhibition mechanism which affects both
anodic and cathodic processes[13,15]. Experiments carried out on the pigment mixture in this
study showed a noticeable improvement in inhibitor efficiency over the component parts. This
is particularly evident when looking at the anodic inhibition of the zinc surface, where the
inhibitive efficiency approaches that of the steel.
Comparing these results, it is clear that chromate exhibits superior inhibition to all of the other
inhibitor systems studied. The zinc molyphosphate/calcium exchanged silica mixture shows
inhibition levels that approach the efficiency of chromate. Both of these comparative
observations can be considered to be consistent with the previous work of Zin et al[13].
Furthermore, the inhibition exhibited by zinc molyphosphate, when compared to calcium
exchanged silica, is greatly superior. This observation is also consistent with previously
published works[14].

107
Notably this novel experimental methodology, using EIS at the coupled potential of the mixed
metal system, produces the same relative findings as other approaches but does so more
rapidly. It has also been shown that, even with relatively crude analysis of the data, this
technique can correctly and quantitatively identify whether the inhibitor species of interest
affects only the anode, only the cathode, or both anode and cathode.
Justification of Equivalent Circuits
As mentioned in the introductory chapters, the interpretation of electrochemical impedance
spectra requires the utilisation of equivalent circuits with sufficient fitting parameters to
determine the overall meaning of the spectra. Furthermore, the makeup of the equivalent
circuits must also be justifiable, in that the components and structure of the circuit must be
representative of physical processes that could be, and are likely to be, taking place on the
surface.

108
Figure 3.2.7 - Representative equivalent circuits used for the analysis of electrochemical impedance obtained on the surface of steel – (a) a simplified Randles circuit, (b) modified Randles circuit and (c) an equivalent circuit containing two time constants
In Figure 3.2.7, the representative equivalent circuits that were utilised across this study (and
further studies presented in this chapter) for the analysis of the surface of steel samples are
shown. These are the simplest possible circuits that are consistent with the expected
electrochemistry. In all of the circuits, an initial resistor, Rsol (R1) can be seen. This is the
resistance that arises due to the resistive solution that is situated between the working and
reference electrodes, and is therefore more indicative of the set-up as opposed to the system
itself.
The first time constant, which is, again, present across all samples measured, is that which
represents the corrosion process. The elements seen in Figure 3.2.7 (a) are those which are
representative of the corrosion process, where the resistor (R2) represents the charge transfer
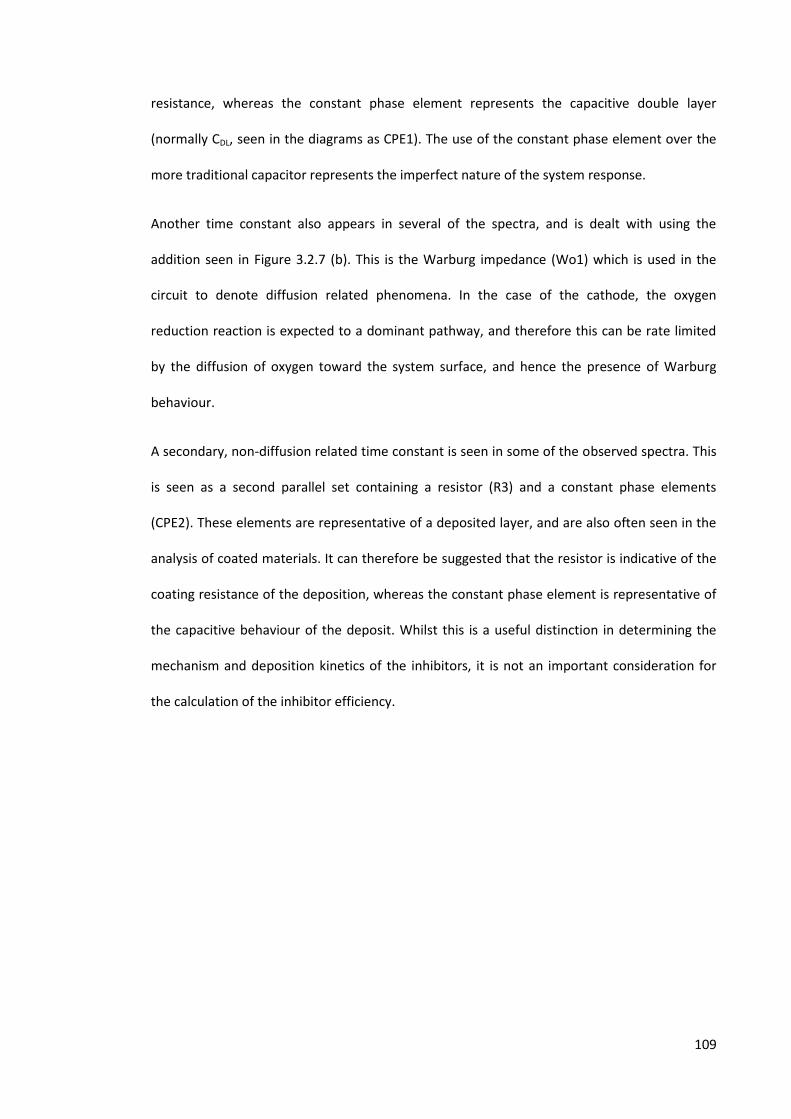
109
resistance, whereas the constant phase element represents the capacitive double layer
(normally CDL, seen in the diagrams as CPE1). The use of the constant phase element over the
more traditional capacitor represents the imperfect nature of the system response.
Another time constant also appears in several of the spectra, and is dealt with using the
addition seen in Figure 3.2.7 (b). This is the Warburg impedance (Wo1) which is used in the
circuit to denote diffusion related phenomena. In the case of the cathode, the oxygen
reduction reaction is expected to a dominant pathway, and therefore this can be rate limited
by the diffusion of oxygen toward the system surface, and hence the presence of Warburg
behaviour.
A secondary, non-diffusion related time constant is seen in some of the observed spectra. This
is seen as a second parallel set containing a resistor (R3) and a constant phase elements
(CPE2). These elements are representative of a deposited layer, and are also often seen in the
analysis of coated materials. It can therefore be suggested that the resistor is indicative of the
coating resistance of the deposition, whereas the constant phase element is representative of
the capacitive behaviour of the deposit. Whilst this is a useful distinction in determining the
mechanism and deposition kinetics of the inhibitors, it is not an important consideration for
the calculation of the inhibitor efficiency.

110
Figure 3.2.8 - Representative equivalent circuits used for the analysis of electrochemical impedance obtained on the surface of zinc.
Figure 3.2.8 shows each of the equivalent circuits that have been utilised for the analysis of
zinc surfaces throughout this body of work. Circuits b and c represent the simplest
representations of two discrete homogeneous layers and one heterogeneous layer
respectively[16]. A constant phase element has been used in place of a capacitor to allow for
non-ideal behaviour. The calculated n-values ranged from 0.78 to 0.91
The electrochemical impedance study presented herein initially showed the presence of two
time constants, where the time constant present at lower frequencies is suggested to
correspond to zinc polyphosphate deposition. We propose that this layer is subsequently
broken down, leading to the suppression of that time constant. For longer exposure times,
another second time constant becomes evident at lower frequencies, indicating further
coverage.
The presence of an inductive loop in some of the spectra can be modelled, however, it is
considered to be more likely that this is due to shifts in the mixed electrode potential that can
have a large effect on some values obtained, particularly in the low frequency areas.

111
3.2.5 Conclusions
The action of various inhibitors was determined using a segmented electrode technique. The
observed behaviour was then compared with that which has been previously reported.
Through equivalent circuit analysis of the electrochemical impedance spectra obtained, the
following conclusions could be drawn:
Strontium chromate acts as a mixed action inhibitor with an initial efficiency superior
to that of the other inhibitors tested
Calcium exchanged silica shows low initial inhibitor efficiency, with cathodic inhibition
evident in later tests.
Zinc molyphosphate shows mainly cathodic inhibition, with evidence of anodic
inhibition possible
Mixing zinc molyphosphate and calcium exchanged silica inhibitors results in mixed
inhibition that is superior to the component parts, and approaches the inhibitor
efficiency shown by chromate.
The results obtained for each of the inhibitor pigments studied appears consistent
with the behaviours as previously described in the literature
With this, it can be suggested that the segmented electrode technique may have potential for
following the corrosion of complex multiple metal systems. Furthermore, the ability to
determine processes occurring separately on both the cathodic and anodic surfaces of a
macro-galvanic cell allows for a simple and rapid classification of inhibitor actions and
mechanisms.

112
Application of Segmented Electrode Technique to Chromate 3.3
Replacement Pigments - Polyphosphates
3.3.1 Introduction
The aim of this study was to utilise electrochemical impedance with segmented electrodes, a
technique verified in the previous section of this chapter, to determine the behaviour of anti-
corrosive pigments that are proposed as potential replacements for hexavalent chromium
compounds. Anecdotal evidence provided by the industrial sponsors of this project suggested
that the modified aluminium polyphosphate inhibitors show differing levels of corrosion
performance depending on the composition of the underlying substrate.
By using the technique in this way, it was suggested that the inhibitor behaviour over the two
distinct areas can be measured, leading to a greater understanding of how the pigments work
with a simple zinc and steel couple mimicking galvanised steel. This would form the beginning
steps toward the fundamental understanding of the inhibitors that would be required to
explain the changes in behaviour when used on different alloy systems.
3.3.2 Experimental
The set-up for this experiment was identical to that as described in section 2.1.2. using
modified aluminium polyphosphate pigments. The pigments that were leached to form
saturated solutions were modified strontium aluminium polyphosphate (SAPP, Heubach, as
received), calcium aluminium polyphosphate (CAPP, Heubach, as received) and magnesium
aluminium polyphosphate (MAPP, SNCZ, as received). Concentrations were not measured
during this study as the study was designed to determine the effects of inhibitors at high
concentrations, similar to what would be expected with pigment leaching into a small volume
(e.g. a raindrop).
3.3.3 Results
Strontium Aluminium Polyphosphate
The charge transfer resistance was obtained through the use of equivalent circuit analysis of
electrochemical impedance plots. The equivalent circuit analysis employed a simplified

113
Randles circuit, shown in Figure 1.6.6 (Introduction, Page 65), to determine the values of the
particular elements of each time constant. In cases where two time constants appear, the
element situated within the higher frequencies is taken to be a simple analogue of the
corrosion process. The inhibitor efficiency can be estimated by assuming that the charge
transfer resistance is approximately inversely proportional to the corrosion rate. The inhibitor
efficiency (IE) can be estimated from the ratio of the charge transfer resistance of the inhibited
sample (RCT) to that of the uninhibited sample (RCTo). The data for an uninhibited sample is
taken from the previously presented work in section 3.1.2.
A numerical value can be assigned to the inhibitor efficiency through the application of
Equation 1 to the obtained charge transfer resistance[17].
(
)
Figure 3.3.1 and Figure 3.3.2 show a selection of the Nyquist plots that were obtained on steel
and zinc sides respectively following exposure to SAPP saturated salt solutions for 72 h.

114
0 500 1000 1500 2000 2500 3000 3500 4000 4500 5000
0
200
400
600
800
1000
1200
1400
1600
1800
2000
2200
2400
2600
2800
3000
3200
3400
Z''
/ O
hm
cm
2
Z' / Ohm cm2
2 h
12 h
24 h
36 h
48 h
60 h
72 h
Figure 3.3.1 - Selected Nyquist plots obtained for the strontium aluminium polyphosphate inhibited 0.6M sodium chloride solution immersed steel sample when coupled to zinc over a 72 hour period
0 50 100 150 200
0
10
20
30
40
50
60
Z''
/ O
hm
cm
2
Z' / Ohm cm2
2 h
12 h
24 h
72 h
Figure 3.3.2 - Selected Nyquist plots obtained for the strontium aluminium polyphosphate inhibited 0.6M sodium chloride solution immersed zinc sample when coupled to steel over a 72 hour period

115
From Figure 3.3.1, it can be seen that the steel electrode exhibits only a single time constant,
as expected due to the extent of cathodic polarisation. An initial reduction in the magnitude of
this time constant, visible as the major semi-circle within the Nyquist plot, indicates a
reduction in the charge transfer resistance and thus a reduction in the observed inhibitor
efficiency. This is followed by a recovery and then increase of the charge transfer resistance,
consistent with an improvement in corrosion inhibition following an induction period, this is
clearly observed by comparison of the 12 and 24 hour exposure plots. This effect is clearly
evident for the steel electrode, and whilst it is discernible on the zinc electrode, after a later
onset, the effect is less prominent.
Calcium Aluminium Polyphosphate
Figure 3.3.3 and Figure 3.3.4 show a selection of the Nyquist plots that were obtained on steel
and zinc sides respectively following exposure to CAPP saturated salt solutions for 72 h.
0 1000 2000 3000 4000 5000 6000 7000 8000 9000
0
500
1000
1500
2000
2500
3000
3500
4000
4500
Z''
/ O
hm
cm
2
Z' / Ohm cm2
2h
12h
24h
36h
48h
60h
72h
Figure 3.3.3 - Selected Nyquist plots obtained for steel in the electrochemical impedance with segmented electrodes experiment when coupled to zinc over a 72 hour period

116
0 100 200 300 400 500 600
0
50
100
150
200
Z''
/ O
hm
cm
2
Z' / Ohm cm2
2h
12h
24h
36h
48h
60h
72h
Figure 3.3.4 - Selected Nyquist plots obtained for zinc in the electrochemical impedance with segmented electrodes experiment when coupled to steel over a 72 hour period
From Figure 3.3.3, it can be seen that the steel electrode exhibits only a single time constant,
as expected due to the extent of cathodic polarisation. A second time constant is possibly
visible in the lower frequency regions, with a tail-like feature present. However, this secondary
time constant is too small for any meaningful interpretation. Unlike what is seen with the
strontium aluminium polyphosphate inhibitor pigment, the magnitude of the time constant
seen in the Nyquist plot shows an immediate increase, suggesting that the action of the
inhibitor is nominally immediate. A minor drop in the measured charge transfer resistance is
seen following a maximum value at around 48 hours.
Similarly, Figure 3.3.4 shows that the zinc electrode appears to display an inhibition profile that
increases consistently from the initial measurement through the final measurement. This
suggests that the calcium aluminium polyphosphate pigment is inhibiting the zinc surface, with
the efficiency in which this inhibition occurs improving consistently throughout the exposure
time. The extent of inhibition, or the overall improvement in inhibition throughout the test,
appears to be more significant for the steel surface than that of the zinc surface.

117
Magnesium Aluminium Polyphosphate
Figure 3.3.5 and Figure 3.3.6 show a selection of the Nyquist plots that were obtained on steel
and zinc sides respectively following exposure to PAM saturated salt solutions for 72 h.
0 1000 2000
0
200
400
600
800
Z''
/ O
hm
cm
2
Z' / Ohm cm2
2h
12h
24h
36h
48h
60h
72h
Figure 3.3.5 - Selected Nyquist plots obtained for steel in the electrochemical impedance with segmented electrodes experiment when coupled to zinc over a 72 hour period
0 100 200 300 400
0
20
40
60
80
100
120
Z''
/ O
hm
cm
2
Z' / Ohm cm2
2h
12h
24h
36h
48h
60h
72h
Figure 3.3.6 - Selected Nyquist plots obtained for zinc in the electrochemical impedance with segmented electrodes experiment when coupled to steel over a 72 hour period
From Figure 3.3.5, it can be seen that the steel electrode exhibits only a single time constant,
as expected due to the extent of cathodic polarisation. A second time constant is possibly

118
visible in the lower frequency regions, with a tail-like feature present. However, much like the
impedance measurements for the previously analysed inhibitor pigments, this secondary time
constant is too small for any meaningful interpretation.
The Nyquist plots for the magnesium aluminium polyphosphate inhibitor pigment show
similarities to the inhibition profile exhibited by calcium aluminium polyphosphate, where a
constant increase is evident from the initial measurement taken after 2 hours of exposure.
Therefore, it is suggested that the inhibition proceeds from the initial exposure. The increase in
calculated charge transfer resistance appears to halt following the 60 hours exposure
measurement, suggesting that the inhibition on the steel surface hits a maximum value after
this length of exposure. Overall, the difference between the initial and final impedance
measurements taken appears to be significantly lower than that of the other two inhibitor
pigments observed.
Figure 3.3.6 shows that the zinc electrode appears to display an inhibition profile that has
initial increases from the initial measurement for the first 24 hours of exposure, which is
followed by small decreases throughout the remaining measurements. This suggests that
whilst the magnesium aluminium polyphosphate pigment is inhibiting the zinc surface, the
effectiveness of this inhibition declines in longer exposure times. The extent of inhibition, or
the overall improvement in inhibition throughout the test, appears to be more significant for
the steel surface than that of the zinc surface, which has been a consistent observation across
all polyphosphate inhibitors examined in this set of experiments.
The impedances obtained from the zinc electrodes show two measurable time constants. Of
these, the lower frequency process appears to be stable, with very little effect shown from the
inhibition process. However, this time constant is seen to be different for the 2 hour exposure
spectra, which may suggest that the system has not have reached equilibrium following this
length of exposure.

119
3.3.4 Discussion
Initial Findings
From initial observations of the obtained impedance plots, some information can be gathered
regarding the behaviour of the inhibitor pigments. Calcium aluminium polyphosphate exhibits
an immediately prevalent, and relatively consistent, efficiency on both the zinc and steel
surface. Similarly, magnesium aluminium polyphosphate also exhibits inhibition which is
noticeable within the earliest exposure times measured and remains relatively consistent
throughout the test.
Strontium aluminium polyphosphate shows a delay before it provides a levels of inhibition that
matches that of the other two inhibitor pigments, particularly on the steel surface. This is seen
as an initial drop of inhibitor efficiency between the 2 hour and 12 hour exposure times, and is
followed by substantial increases in the calculated inhibitor efficiency after 24 hours exposure.
This phenomenon is also demonstrable in the measurements obtained on the zinc surface too.
Figure 3.3.7 - Graph displaying calculated inhibitor efficiencies for the modified aluminium polyphosphate inhibitors on the surfaces of coupled steel and zinc
0
10
20
30
40
50
60
70
80
90
100
Zinc Steel Zinc Steel Zinc Steel
CAPP PAM SRPP
Inh
ibit
or
Effi
cie
ncy
/ %
Calculated Inhibitor Efficiencies Over 72 Hours Exposure
2h
12h
24h
48h
72h

120
A comparison of the inhibitor efficiencies, on both the steel and zinc surfaces, at a number of
different exposure times for each of the polyphosphate inhibitor pigments observed is shown
in Figure 3.3.7.
In the initial inhibition stages, taken in these experiments as following 2 hours exposure, it can
be seen that magnesium aluminium polyphosphate is the most effective inhibitor measured,
with a notable superiority in inhibiting the zinc surface over the other two inhibitor pigments.
Calcium aluminium polyphosphate exhibits near identical levels of corrosion inhibition for the
steel surface, when compared to magnesium aluminium polyphosphate, but lower zinc surface
inhibition, at approximately 30% efficiency. Strontium aluminium polyphosphate shows lesser,
but similar, steel surface inhibition at early stages of exposure. Initially, the results also suggest
that it does not exert any notable inhibitive action on the zinc surface.
The calculations suggest that magnesium aluminium polyphosphate is the pigment which is the
quickest to reach the maximum inhibitor efficiency, with only minor increases visible on the
steel surface after the initial results, and the same seen on the zinc surface following 12 hours
exposure. Calcium aluminium polyphosphate appears to be roughly consistent after 12 hours
exposure across both surfaces, whereas strontium aluminium polyphosphate does not give an
indication of reaching the highest level of inhibition it is capable of within the 72 hour
exposure time.
This suggests that magnesium aluminium polyphosphate has the quickest mechanism of action
of the three polyphosphate pigments measured, with strontium aluminium polyphosphate
being the slowest, and even showing negative inhibition trends in the earlier exposure times.
The reasons behind this will be discussed later in this section. However, whilst magnesium
aluminium polyphosphate can be considered to be the fastest, both calcium aluminium
polyphosphate and strontium aluminium polyphosphate are capable of providing greater
inhibition to the steel surface over longer exposure periods. Calcium aluminium polyphosphate

121
is also capable of providing superior zinc surface corrosion inhibition, but strontium aluminium
polyphosphate displays relatively weak zinc inhibition throughout the test period when
compared to the other pigments tested.
Strontium Aluminium Polyphosphate Inhibition Profile
As mentioned previously, exposure to solutions saturated with the strontium aluminium
polyphosphate inhibitor pigment exhibited corrosion behaviour that was distinctly different
than those measured for the other polyphosphate inhibitor pigments that were used. A
reproducible and not insignificant delay in the increasing of the calculated charge transfer
resistance was observed in the electrochemical impedance for both the steel and zinc
electrodes, suggesting a delay in inhibitor action. It was also noted that the delay in inhibition
was not equal between the two electrodes, with inhibition on the steel surface proceeding
before it is observed on the zinc surface.
One theory for the observed delay of inhibition on the steel surface relates to the secondary
counter ion in the pigment. If the “metallic aluminium polyphosphate” pigment exists as a
modified aluminium polyphosphate, meaning that upon dissolution, this is released as
aluminium polyphosphate and the secondary counter ion is released as the metallic cation. In
the case of the three polyphosphate inhibitors, this would be as Sr2+, Ca2+ and Mg2+. It could be
suggested that ion exchange between the aluminium polyphosphate and the metallic cationic
species could occur in solution. It has been previously reported in the literature[18] that the
presence of divalent cationic species in solution improves the inhibition of mild steel by
polyphosphates.
In the case of these polyphosphate inhibitors, it is suggested that presence of a secondary
species is essential for an effective inhibitor action. In analysing the results from lower
exposure times, it can be proposed that calcium and magnesium are divalent cationic species

122
that can produce effective polyphosphate inhibition. Conversely, the results suggest that the
presence of strontium is not sufficient to provide the same effect.
However, this alone does not explain the significant improvement in the inhibitor efficiency
that is observed following longer exposure times, as it is unlikely that inhibition of this
effectiveness would begin after a delay without another process occurring. It is therefore
suggested that the presence of another cationic species, namely Zn2+ produced by anodic
dissolution of the zinc electrode, acts with the polyphosphate to produce effective inhibition.
In this case, the delay between first exposure and the action of the inhibitor can be explained
through firstly the extended diffusion pathway between the two working electrodes, and
secondly a minimum concentration requirement of the cation at the surface of the steel for
noticeable inhibitor efficiency.
The Usage of Polyphosphates in Galvanised Steel
The usage of hexavalent chromium compounds in galvanised steel can be considered to be
driven by the attributes that those compounds are known to have. As previously mentioned in
the literature review chapter, the main benefits of using chromium based anticorrosive
pigments can be considered to be a high efficacy, unrivalled flexibility and a rapid onset of
inhibition. Additionally, with zinc coated steel being a galvanic couple, the mixed inhibition
action of hexavalent chromium is also an important consideration where distinct areas of
cathodic and anodic activity will be present.
Phosphates are primarily referred to as non-oxidizing anodic inhibitors[13,19]. However, this is
not the behaviour that was observed in this set of experiments. Indeed, inhibition on the
cathodic steel surfaces is seen at higher percentage efficiencies in all cases. It can therefore be
suggested that the pigments examined in this study can be considered as mixed action
inhibitors in this case. However, it is also important to consider what processes may be

123
occurring on each of the surfaces to gain a greater understanding in the usefulness and
limitations of these inhibitor pigments.
As was previously mentioned, the inhibition provided by phosphate species in solution is
improved by the presence of certain divalent cationic species. It has also been reported that
the presence of calcium cations is an essential component in producing a cathodic inhibitor
response from phosphates[20]. The chemical process which produces the inhibitive species in
orthophosphates is as given by the following chemical equation:
This, alongside a reduction in the solubility due to the local increase in pH from the release of
hydroxide at the cathodic site resulting in surface deposition, explains the strong cathodic
inhibition exhibited by the calcium aluminium polyphosphate inhibitor pigment, as it is capable
of providing the calcium cations required for the mechanism of inhibition shown for the
cathode.
In the discussion taking into consideration the distinct inhibitor behaviour of the strontium
aluminium polyphosphate inhibitor, it was suggested that strontium does not have the
capability of producing an inhibitive film in this way. It is possible that this is due to greater
solubility in the local alkaline environment of the strontium phosphate compound. From the
results obtained, it would be suggested that the influence of cationic species on the efficacy of
inhibition, without taking into account any possible effects with regards to the strontium
aluminium polyphosphate inhibitor, would be Ca > Mg > Sr.
Corrosion protection by phosphate containing inhibitors on the zinc surface has been more
extensively studied, with Simões et al[20] indicating the incorporation of the anodically
produced zinc ions into a zinc phosphate deposit on the surface. The electrochemical
impedance study presented showed initially the presence of two time constants. The time

124
constant present at lower frequencies is suggested to be due to the deposition of a
polyphosphate-based layer. Subsequent damage or break down of this layer leads to the
suppression of that time constant. For longer exposure times, another second time constant
becomes evident at lower frequencies, indicating further surface coverage.
Experimental Limitations
In the previous chapter section, the ability of electrochemical impedance utilising segmented
electrodes to determine inhibition on metallic systems containing multiple components
showed that the site of inhibitor action could be determined quickly using only crude analysis
of the impedance data. In this work, the segmented electrode technique was utilised to
determine the effectiveness of three modified aluminium polyphosphate inhibitor pigments
and has been able to determine some differences between pigments which nominally would
have been expected to work similarly on the analysed system. It is clear, therefore, that the
technique has potential for more explorative studies in the inhibition of complex systems
However, despite this potential, it is also important to call attention to possible limitations of
the technique moving forward.
Electrochemical impedance spectroscopy is, in most cases, performed at the open circuit
potential. As the segmented electrochemical impedance experiments are run at the mixed
corrosion potential, it is unlikely to fall over the individual open circuit potential of any of the
constituent components of the model. This appears to often result, particularly for the steel
surface in the case of the steel and zinc couple, in the lowering of time constants visible within
the spectrum.
It is suspected that this is due to the dominance of a particular electrochemical reaction
following polarisation away from the open circuit potential. Indeed, many of the spectra
obtained contain low frequency tails that could potentially be the embryonic stages of a

125
further time constant. However, there are not enough data points present for any meaningful
analysis. Consequently, many of the mechanistic traits that can be, in the normal situations,
elucidated through the application of model electrochemical circuits and comparing
simulations to the real data are unobtainable. However, as this technique is used to look at
galvanic cells, the loss of the information can be considered to not be a significant drawback.
3.3.5 Conclusions
The inhibition of modified aluminium polyphosphate pigments on a steel and zinc metallic
couple has been measured. From the results obtained and the subsequent analysis, the
following conclusions could be made:
Calcium aluminium polyphosphate and magnesium aluminium polyphosphate show
inhibition profiles that are distinctly different from that of strontium aluminium
polyphosphate, potentially suggesting alternative inhibition mechanisms between the
different modified aluminium polyphosphate inhibitor pigments.
It was indicated that magnesium aluminium polyphosphate is the inhibitor pigment
measured with the quickest inhibitor onset, with the highest inhibition efficiency at
initial stages of experiments, but with the lowest effectiveness in the latter stages.
Calcium aluminium polyphosphate is a highly effective mixed corrosion inhibitor, with
the highest measured inhibition efficiency of the polyphosphate inhibitors on both the
steel and zinc electrodes in the latter stages of exposure.
Strontium aluminium polyphosphate is the weakest inhibitor in the initial stages of
exposure, with inhibition improving at a high rate following longer periods of
exposure.
Overall trends in inhibitor efficiency do not appear to fit well with trends in other
parameters such as solubility of the suspected compound deposits.

126
Effects of Changing Spatial Geometry 3.4
3.4.1 Introduction
In the previous section, the experiments utilising electrochemical impedance spectroscopy on
segmented zinc and steel electrodes showed an unusual inhibition profile for the strontium
aluminium polyphosphate inhibitor pigment. This profile can be summarised as the inhibitor
remaining inefficient on the cathodic surface for the initial period of the test, followed by a
sustained period of increasing efficiency.
It was suggested that this phenomenon occurs due to the time taken for anodically dissolved
zinc ions to diffuse to the cathode surface. If the presence of zinc, in sufficient concentrations,
is a major component of the inhibitor mechanism, then the previously observed delay in
inhibition could be explained by the presence of a diffusion pathway.
Therefore, the aim of this study was to examine the proposed cause of the inhibition profile
through the modification of experimental parameters. This was done through employing a
previously devised geometrical model of the cut edge of galvanised steel which maintains the
segmentation of the incorporated metals. In using this geometric set up, the diffusion pathway
for the zinc ions released into the solution through anodic dissolution to the steel surface is
significantly reduced. Therefore, if the proposed explanation is true, a change in the inhibition
profile for the strontium aluminium polyphosphate inhibitor pigment would be observed,
foregoing the initial period of lessened inhibitor efficiency.
3.4.2 Experimental
The experimental set-up for this experiment followed the same sample preparation and
solution preparation methodology as given in the section 2.1.2., whilst utilising modified
working electrode geometry. The working electrodes were mounted so as to attempt to
geometrically mimic the cut edge of galvanised steel. This set-up was based on a model
electrochemical cell that has been previously shown in the literature, and is shown in Figure
2.3.1[13] (Methodology, Page 91).

127
The system was maintained at the laboratory temperature (18-21°C), and monitored for a 72
hour period. Electrochemical impedance measurements were taken for each individual
electrode at 2 hour intervals for the observation period. Impedance measurements were taken
at the measured system coupled corrosion potential in the frequency range of 10,000 to 0.01
Hz with a signal amplitude of 10 mV.
3.4.3 Results
The proposed mechanistic change being studied in this particular section was prevalent in the
results obtained for the strontium aluminium polyphosphate pigment inhibited samples.
Therefore, it is with this pigment that this particular study concentrates on. Figure 3.4.1 and
Figure 3.4.2 show a selection of the Nyquist plots that were obtained utilising the model cut
edge electrochemical cell with the SAPP inhibitor pigment, for the steel and zinc electrodes
respectively.
0 200 400 600 800 1000 1200 1400 1600 1800 2000 2200 2400 2600
0
100
200
300
400
500
600
700
800
900
1000
Z''
/ O
hm
cm
2
Z' / Ohm cm2
2 h
12 h
24 h
Figure 3.4.1 - Selected Nyquist plots obtained for steel in the electrochemical impedance with segmented electrodes experiment when coupled to zinc over a 24 hour period in the model cut edge geometry cell

128
10 20 30 40 50 60 70
02468
10121416
Z''
/ O
hm
cm
2
Z' / Ohm cm2
2 h
12 h
24 h
Figure 3.4.2 - Selected Nyquist plots obtained for zinc in the electrochemical impedance with segmented electrodes experiment when coupled to steel over a 24 hour period in the model cut edge geometry cell
The plots for both the steel and zinc electrodes only exhibit one fully analysable time constant.
Whilst some of the samples appear to show tails at low frequencies that may imply the
presence of a secondary time constant, it is suggested that no meaningful analysis could be
taken from these.
Each plot appears to show consistent increases in the size of the visible semi-circle within the
Nyquist plot. In contrast to the original geometry, the plots from the model cut edge show no
evidence of a delay in inhibitor performance improvement, with an apparent instantaneous
increase in charge transfer resistance observed. This effect is observed on both the zinc and
steel surfaces, with the effect being more pronounced on the steel electrode.
3.4.4 Discussion
The hypothesis given in the previous section proposed that the inhibition delay observed in the
SAPP inhibited samples for the original working electrode geometry was due to mechanistic
changes that lead to improved phosphate deposition on the surface when a sufficient
concentration of zinc cations are available at the steel surface. Figure 3.4.3 shows a
comparison of the development of the calculated inhibitor efficiencies over time, calculated
from the electrochemical impedance spectra that were obtained on the steel electrode, for the

129
strontium aluminium polyphosphate inhibitor pigment utilising both working electrode
geometries.
0 5 10 15 20 25 30 35 40 45 50 55 60 65 70 75
45
50
55
60
65
70
75
80
85
90
95
Inhib
itor
Effic
iency (
%)
Time (Hours)
Spatially Seperated Electrodes
Cut Edge Geometry
Figure 3.4.3 - Scatter graph showing the progression of inhibitor efficiency on the steel surface over time for both the original cell geometry and the cut edge mimic
In looking at the comparison between the two electrode geometries, it was observed that
reducing the distance between the steel and zinc electrodes resulted in the absence of a delay
in inhibitor action. The extent of corrosion protection at the initial stages of the experiments
can also be seen to be approximately equivalent for both geometries. Additionally, upon the
conclusion of the observation period, it can be seen that the extent of inhibition is
approximately the same for both geometries. This observation is consistent with what would
have been an expected result with the suggested hypothesis.

130
A greater rate of corrosion inhibition improvement is also seen in the initial stages of the cut
edge geometry measurements. There are two potential explanations for this finding. One is
that the surface of the steel electrode is cleaner due to the lesser exposure times required
before the inhibitor and anodically dissolved zinc can interact, in which the deposition
mechanism is more effective with a cleaner substrate. Alternatively, despite the lower area of
zinc used in the geometry used for the cut edge mimic, the initial anodic reaction results in a
local enrichment of zinc ions at the surface of the steel sample that is of sufficient
concentration to result in a large improvement in the inhibitor efficiency.
However, it is clear that whilst the results can be explained by the hypothesis presented, the
current results are insufficient to confirm it. One suggestion is that in the case of the presence
of zinc being important in surface deposition mechanisms, the surface deposition structure
and composition could be different between samples exposed to inhibited solutions in zinc-
free and zinc-rich environments.

131
3.4.5 Conclusions
In this study, the effects of changing the spatial separation between zinc and steel electrodes
on the inhibition by strontium aluminium polyphosphate were analysed. From these results,
the following conclusions could be made:
The reduction in distance between the steel and zinc electrodes results in the absence
of any notable delays in increasing inhibitor efficiency with the strontium aluminium
polyphosphate inhibitor pigment
The strontium aluminium polyphosphate pigment appears to require additional
elements to be present before it can act as an effective inhibitor. It is suggested from
these experiments that the presence of anodically released zinc ions is one particular
change that can result in inhibitor improvements
Modifying the spatial geometry of the electrochemical cell is sufficient to change the
obtained results, suggesting that this may be an experimental parameter that can be
changed with this technique for greater understanding of how a particular system may
work

132
Chapter Summary and Conclusions 3.5In this chapter, the inhibition of galvanised steel was explored through the use of an
electrochemical set-up which utilises segmented electrodes of distinct composition. From the
work presented in this chapter, the following conclusions have been made:
Electrochemical impedance utilising segmented electrodes is capable of quickly
producing results that can indicate inhibition on dissimilar metals which represent the
cathodic and anodic materials of a galvanic couple
Consistency was seen between the analysis of inhibitor behaviours reported in the
literature and the results obtained using the segmented electrode electrochemical
impedance technique in Chapter 2.1
The electrochemical impedance plots obtained through the segmented electrode
technique are somewhat limited as they appear to be mostly limited to single time
constants, reducing the amount of information that can be gathered from the results
The three aluminium polyphosphate based inhibitors tested during these studies
appear to show non-identical behaviour, potentially indicating differences in the
inhibition mechanisms
Strontium aluminium polyphosphate shows distinct behaviours between different
electrode geometries. Changing the cell geometry is therefore an option for looking at
obtaining information of the corrosion inhibition of the overall system.

133
Chapter References 3.6[1] Tan YJ, Bailey S, Kinsella B. Corros Sci 1996;38:1545.
[2] Bastos AC, Zheludkevich ML, Ferreira MGS. Port Electrochim Acta 2007;26:47.
[3] Dawson JL, Gill JS, Al-Zanki IA, Woolam RC. Dechema Monogr 1985;101:235.
[4] Woollam RC, Gill JS, Dawson JL. Mater Sci Forum 1986;8:53.
[5] Alawadhi K, Robinson MJ. Corros Eng Sci Technol 2011;46:318.
[6] Rebak RB. Preferential Weld Corrosion: Effects of Weldment Microstructure and
Composition, in:. Corros. 2005. 2005.
[7] Mok WY, Gamble CG, Jenkins AE, Keenan SR. Control of Localized Corrosion Using
Green Corrosion Inhibitors, in:. Corros. 2005. 2005.
[8] Winning IG, Bretherton N, McMahon A, McNaughtan D. Evaluation of Weld Corrosion
Behavior and the Application of Corrosion Inhibitors and Combined Scale/corrosion
Inhibitors, in:. Corrosion 2004. 2004.
[9] McNaughtan D, Winning IG, Clariant Oil Services. Comparison of Segmented Weld
Corrosion Tests with Short and Long Pre-Corrosion and The Influence of Synergist in
Corrosion Inhibitors, in:. 1st Int. Symp. Oilf. Corros. 2004.
[10] Stern M. J Electrochem Soc 1958;105:638.
[11] Zin IM, Howard RL, Badger SJ, Scantlebury JD, Lyon SB. Prog Org Coatings 1998;33:203.
[12] Deflorian F, Fedrizzi L, Rossi S. Corros Sci 2000;42:1283.
[13] Zin IM, Pokhmurskii VI, Scantlebury JD, Lyon SB. J Electrochem Soc 2001;148:B293.
[14] Zin IM, Lyon SB, Pokhmurskii VI. Corros Sci 2003;45:777.
[15] Pokhmurs’kyi VI, Zin’ IM, Layon SB, Bilyi LM. Mater Sci 2003;39:153.
[16] Jüttner K. Electrochim Acta 1990;35:1501.
[17] Epelboin I, Keddam M, Takenouti H. J Appl Electrochem 1972;2:71.
[18] Lahodny-Ŝarc O, Kaštelan L. Corros Sci 1976;16:25.
[19] Pryor MJ, Cohen M. J Electrochem Soc 1953;100:203.
[20] Simões AM, Torres J, Picciochi R, Fernandes JCS. Electrochim Acta 2009;54:3857.

134
4 Chapter 4 – Analysis of Polyphosphate Inhibitor Film
Formation
Chapter 4
Analysis of Polyphosphate Inhibitor Film
Formation

135
Introduction 4.1
The formation of films on the surface of a metal is a commonly observed action for inhibitive
species. Understanding the nature of this film can be important in determining how to
produce, or formulate, the most effective inhibitor or inhibitor mixture for a particular
scenario or environment.
In the previous chapter, it was shown that the spatial separation between steel and zinc
electrodes had an effect on the measured effectiveness of inhibition when using the SAPP
inhibitor pigment. A potential explanation was provided for this effect in the interaction of zinc
ions released from the anodic process with the inhibitor to produce a different inhibiting
species. In this chapter, the potential effects of the presence of cationic species within the
inhibited solution on the produced surface deposits.
This chapter will initially aim to look at the effects of dissolved zinc ions on the corrosion
behaviour and surface structure on exposure to bare steel substrates by utilising scanning
electron microscopy and combining this with energy dispersive x-ray spectroscopy. The effect
of dissolved zinc ions on the surface composition and deposit thickness will then be analysed
for exposure on cathodically polarised steel substrates through the use of x-ray photoelectron
spectroscopy. Finally, further x-ray photoelectron spectroscopy analysis will be obtained for
the surfaces of cathodically polarised steel samples exposed to modified aluminium
polyphosphate inhibitor pigment solutions containing alternative cationic species to determine
any further synergistic or antagonistic relationships.

136
Scanning Electron Microscopy and Energy Dispersive X-Ray 4.2
Spectroscopy
4.2.1 Introduction
The first part of this chapter will be dealing with initial experiments that concentrated on
observing the interaction of dissolved commercial “modified aluminium polyphosphate”
inhibitor pigments on the surface of mild steel. Modified aluminium polyphosphates are
considered to be a promising set of corrosion inhibitors for replacing hexavalent chromium
based corrosion inhibitors in coil coated applications. However, as they are available as
industrially produced pigments, they are ultimately poorly defined, comprised of a mixture of
components, as opposed to a well-defined single chemical component. As such, when studying
these materials, it is important to take into consideration the possibility that the nominal
composition and structure of these pigments may differ from the reality.
Therefore, the intentions of this set of experiments were to initially scope and qualitatively
understand the differences in morphology and elements which comprise the surface deposits
on steel for each of the pigments. A secondary aim was to determine the effects, if any, of the
addition of zinc ions to the solution to these properties.
To do this, the surfaces of steel samples were exposed to polyphosphate inhibitor solutions
without electrochemical perturbation. These samples were then initially analysed optically,
observing the formation, colour and general cohesive and adherence properties of the
overlying corrosion products and surface deposits. Scanning electron microscopy was used to
discern the morphology of the deposited layer, whilst energy dispersive x-ray spectroscopy
was utilised to determine the elemental composition of the layer.

137
4.2.2 Experimental
Steel specimens of approximate dimensions 1 cm x 2 cm were cut from a mild steel Q panel
and mounted in two part epoxy. The steel surface was exposed and ground using silicon
carbide paper down to a 1200 grade. Samples were immersed for 72 hours, without any
external electrochemical perturbation, in a solution of 0.62M sodium chloride either
uninhibited or containing an inhibitor pigment added to saturation. In samples that were to be
exposed to a zinc-rich environment, zinc chloride was added until a concentration of 2 mM
was achieved.
Following exposure, the samples were dried and washed gently with deionised water, with
images taken before and after washing for comparison. Samples were then analysed using a
Zeiss Evo 50 Scanning Electron Microscope with Energy Dispersive X-Ray Spectroscopy
addition. EDX spectroscopy was performed at an accelerating voltage of 12 keV. This particular
accelerating voltage was chosen to reduce the interaction volume of the electron beam whilst
maintaining a sufficient energy to excite the generation of x-rays.
4.2.3 Results
To first understand the effect of the presence of zinc ions on the general corrosion of steel,
initial experiments were done on steel samples exposed to salt solutions containing no
inhibitor with and without the addition of zinc chloride.
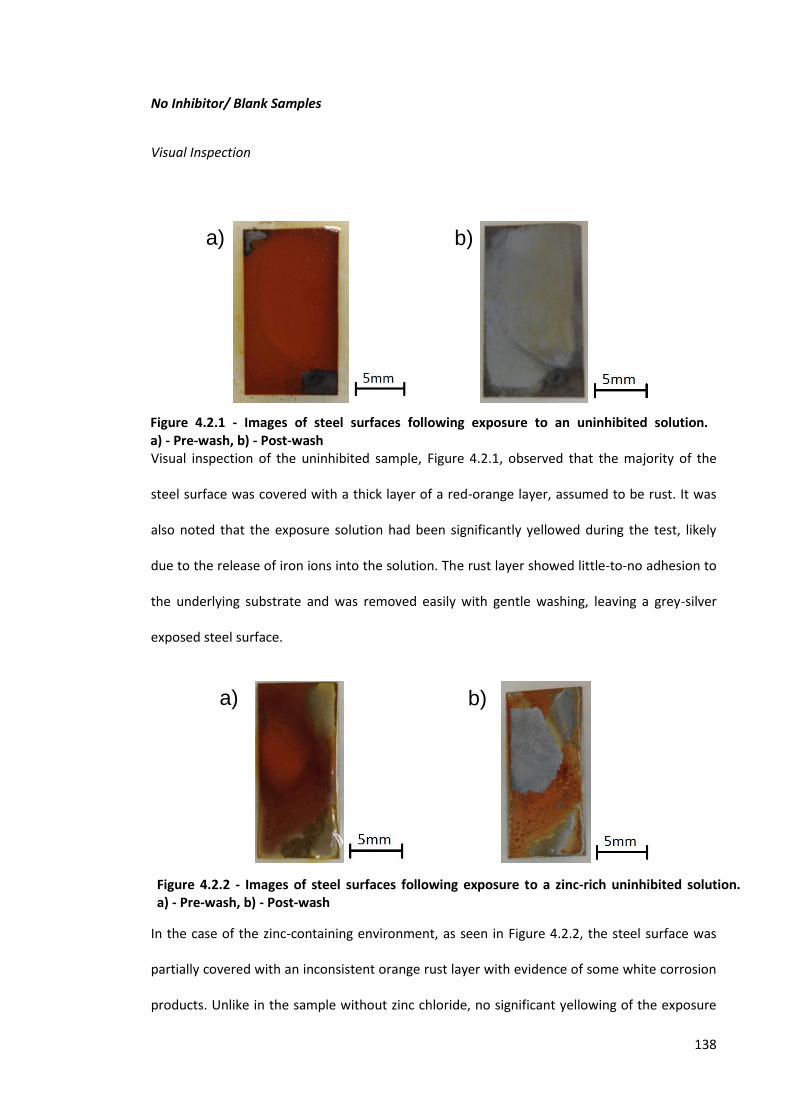
138
No Inhibitor/ Blank Samples
Visual Inspection
Visual inspection of the uninhibited sample, Figure 4.2.1, observed that the majority of the
steel surface was covered with a thick layer of a red-orange layer, assumed to be rust. It was
also noted that the exposure solution had been significantly yellowed during the test, likely
due to the release of iron ions into the solution. The rust layer showed little-to-no adhesion to
the underlying substrate and was removed easily with gentle washing, leaving a grey-silver
exposed steel surface.
In the case of the zinc-containing environment, as seen in Figure 4.2.2, the steel surface was
partially covered with an inconsistent orange rust layer with evidence of some white corrosion
products. Unlike in the sample without zinc chloride, no significant yellowing of the exposure
Figure 4.2.2 - Images of steel surfaces following exposure to a zinc-rich uninhibited solution. a) - Pre-wash, b) - Post-wash
Figure 4.2.1 - Images of steel surfaces following exposure to an uninhibited solution. a) - Pre-wash, b) - Post-wash
a) b)
a) b)

139
solution was observed. Loss of some of the covering material was observed on gentle washing
of the surface; however some orange, yellow and white products were seen to maintain
adhesion to the steel surface.

140
SEM/EDX Results
0 1 2 3 4 5 6 7
0
100
200
300
400
500
C
Fe
O
Inte
nsity /
Cou
nts
Pe
r S
eco
nd
Energy / keV
No Inhibitor
Fe
Figure 4.2.3 – a) - A representative image of the steel surface after washing from the
electron microscopy. b) - A measured EDX spectrum representative of the surface shown on
SEM, cut to show observed elements
The scanning electron microscope images of post-washed uninhibited samples exposed to a
sodium chloride solution without any additions, shown in Figure 4.2.3, appears to show a
a)
b)

141
rough surface morphology. This could potentially be from corrosion occurring at the surface.
EDX analysis was only able to detect iron and traces of carbon at the surface, which is
consistent with the steel composition. This suggests that any potential corrosion products
deposited on the surface, and still remaining following the washing procedure, would be too
thin to be detectable through this technique, due to the penetration depth of EDX.
Electron microscope images and the EDX spectrum obtained from the sample exposed to the
environment containing zinc chloride with no inhibitors are shown in Figure 4.2.4. Two distinct
structures were evident, a rough surface morphology, similar to that observed for the non-zinc
exposed sample and a rougher morphology with apparent porosity that was not present within
the other uninhibited sample. EDX analysis determined that the surface composition appears
similar to that of zinc-free environment sample. However, the areas displaying the porous-like
surface structure gave EDX spectra as in Figure 4.2.4. As such, it can be considered that these
areas may be zinc-rich, which implies that this is likely an area of zinc oxide or zinc hydroxide
deposition. On the sample, this may be due to activity at cathodic sites, where the local pH
would be increased due to the development of the hydroxide species. In the presence of zinc
ions, this could produce zinc oxide and zinc hydroxide species that have low solubility and
therefore deposit on the surface.
The peak seen at approximately 1 keV is labelled as both zinc and sodium, which will be seen
as a consistent label throughout this chapter. The Kα for sodium is situated at 1.041 keV, whilst
the Lα for zinc is situated at 1.012 keV, and therefore the peaks are overlapping within the
spectrum and unlikely to be distinct. Usually, the presence of zinc will be confirmed through
the presence of a Kα peak (8.630 keV), however the selected excitation energy of 12 keV
means that this peak is generally only detected when the Lα is seen at high intensity.
Therefore, the presence of zinc is assumed in spectra without the zinc Kα peak in examples
where zinc has been shown to be present in later experiments.

142
0 5 10
0
100
200
300
400
500
600
700
Zn
Zn
Na
Cl
C
Fe
O
Inte
nsity / C
ounts
Per
Second
Energy / keV
No Inhibitor + ZnCl2
Fe
Figure 4.2.4 – Results obtained from exposure to electrolyte containing sodium chloride and
zinc chloride. a) - Electron microscope image showing the general structure of the surface
without visually detectable adhered deposits. b) - Electron microscope image showing the
general structure of the surface containing adhered deposit. c) – EDX spectrum showing the
detectable species in the adhered deposit.
a)
b)
c)

143
Strontium Aluminium Polyphosphate (SAPP)
Visual Inspection
Figure 4.2.5 - Images of steel surfaces following exposure to SAPP inhibited solution. a) - Pre-
wash, b) - Post-wash
Through visual inspection of the zinc-free environment exposure to SAPP inhibited solution, it
can be seen that a dark orange deposit is present on the surface, albeit with incomplete
coverage, meaning some steel surface is still exposed. Yellowing of the solution during the
experiment was also noted. Following gentle washing, it can be seen that the orange
substance has been removed, and was therefore poorly adherent. The washing process left
further exposed steel segments surrounded by an adherent brown-red product.
Figure 4.2.6 - Images of steel surfaces following exposure to SAPP inhibited solution
containing zinc. a) - Pre-wash. b) - Post-wash
a) b)
a) b)

144
Inspection of the sample exposed to the zinc-containing SAPP inhibited solution showed a
thick yellow to orange surface layer that had developed on the surface of the steel, suggesting
that the inhibition of the surface is poor. Gentle washing of the sample implied that this layer
was adherent to the surface as no visual change could be observed. Therefore, it can be
suggested that whilst the inhibition is poor, there is an effect of the inhibitor and zinc
combination that results in changes to the nature of the corrosion product.

145
SEM/EDX Results
0 2 4 6 8
0
25
50
75
100
125
150
175
200
ClAl
Fe
Zn
Na
P
O
Inte
nsity / C
ounts
Per
Second
Energy / keV
SAPP
Fe
Figure 4.2.7 – a) - A representative electon microscopeimage of the steel surface exposed to
a sodium chloride solution containing strontium aluminium polyphosphate inhibitor
pigment, after washing. b) - A measured EDX spectrum representative of the surface shown
on SEM, with the observed element peaks labelled
a)
b)

146
EDX of the surface from the sample exposed to a sodium chloride environment containing the
SAPP inhibitor pigment showed the presence of aluminium and phosphorus, but an absence of
strontium. This gives an indication that in this particular test, the deposited layer on the steel
surface is most likely to be comprised of aluminium and phosphorus, with no involvement
from the strontium component of the inhibitor pigment. No quantification analysis was carried
out at this stage to determine the likely chemistry of this mixture. A weak signal referring to
zinc was also detected. This suggests that zinc may be present as an inclusion within the SAPP
inhibitor pigment, and may also imply that this also plays a role in the deposition. The
morphology of the deposit as seen in the SEM images can be described as appearing as a
particulate as opposed to the formation of a thin film.
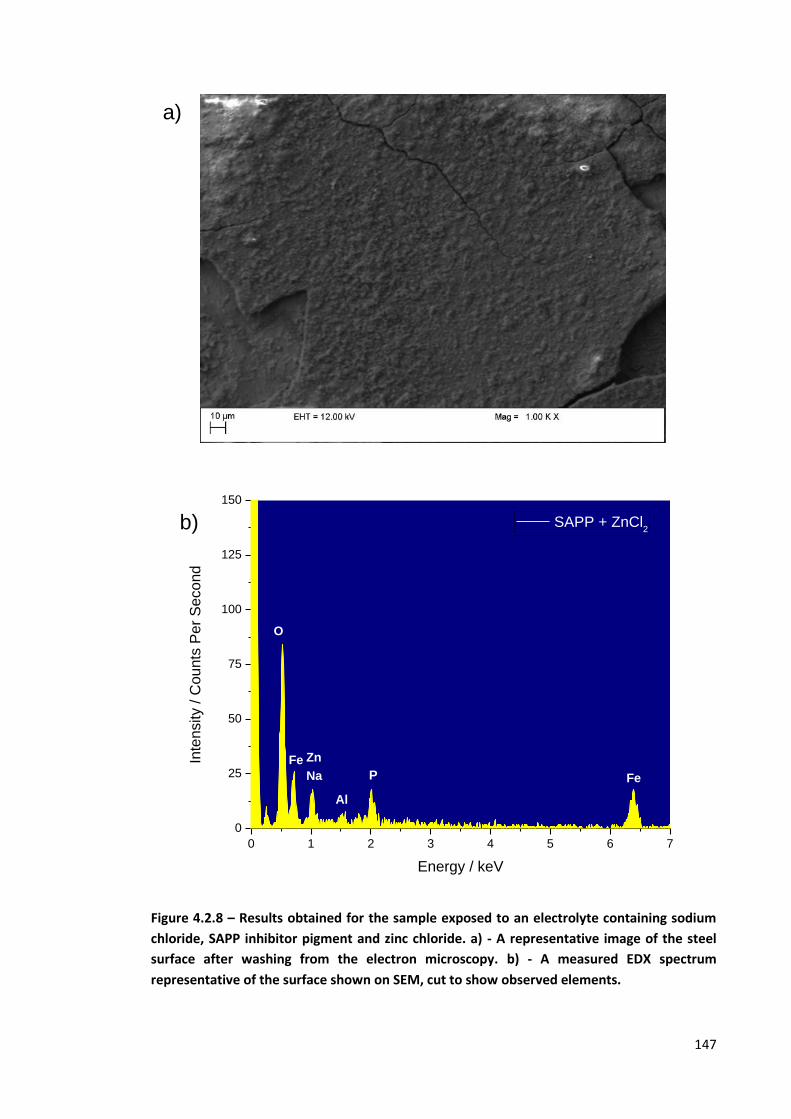
147
0 1 2 3 4 5 6 7
0
25
50
75
100
125
150
Al
Fe
Zn
Na P
O
Inte
nsity / C
ounts
Per
Second
Energy / keV
SAPP + ZnCl2
Fe
Figure 4.2.8 – Results obtained for the sample exposed to an electrolyte containing sodium
chloride, SAPP inhibitor pigment and zinc chloride. a) - A representative image of the steel
surface after washing from the electron microscopy. b) - A measured EDX spectrum
representative of the surface shown on SEM, cut to show observed elements.
a)
b)

148
In comparison, the results obtained from exposure to the solution containing both zinc
chloride and SAPP also show an absence of strontium, with aluminium also dropping to low-to-
undetectable levels. A strong zinc peak is present in the EDX spectra. It can be suggested that
the deposited is comprised of a structure that contains zinc and phosphorus, with some
evidence of aluminium. This is somewhat different to what is observed when zinc chloride is
not present within the environment.
Additionally, a change in the morphology observed on the surface is also observed. The
structure of the surface deposit is seen to be more plate-like in nature, compared to the
particulate nature of the deposit seen previously. These observations put forward the
possibility of a working hypothesis regarding the inhibition mechanism of the SAPP inhibitor
pigment, namely that the presence of a concentration of zinc ions within the solution changes
the final structure and composition of the deposition. However, the full nature of this effect
cannot be discerned using these results alone.
Calcium Aluminium Polyphosphate (CAPP)
Visual Inspection
Figure 4.2.9 - Images of steel surfaces following exposure to CAPP inhibited solution. a) - Pre-
wash, b) - Post-wash
Through visual inspection of the zinc-free environment exposure to CAPP inhibited solution, it
can be seen that a brown deposit appears with near-to-full coverage of the steel surface, with
a) b)

149
some steel surface still exposed. Following gentle washing, it can be seen that some of the
deposit had been removed, leaving a small proportion of the steel surface exposed,
surrounded by remaining adherent orange-brown product.
Figure 4.2.10 - Images of steel surfaces following exposure to CAPP inhibited solution
containing zinc. a) - Pre-wash, b) - Post-wash
In the case of the zinc-containing CAPP solution, a shiny steel surface was evident upon
removal from the electrolyte, suggesting effective inhibition of the surface However, upon
cleaning there was some evidence of corrosion spots. It is possible that this is due to flash
corrosion of the steel when exposed to the air during the cleaning procedure. Alternatively,
this could be due to residual anodic activity that becomes evident following the cleaning
procedure.
a) b)

150
SEM/EDX Results
0 1 2 3 4 5 6 7 8
0
50
100
150
200
250
300
350
400
ClAl
Si
Na
FeCa
P
O
Inte
nsity /
Cou
nts
Pe
r S
eco
nd
Energy / keV
CAPP
Fe
Figure 4.2.11 – Results obtained for steel exposed to a sodium chloride solution containing
the CAPP inhibitor pigment. a) - A representative image of the steel surface after washing
from the electron microscopy. b) - A measured EDX spectrum representative of the surface
shown on SEM, cut to show observed elements
a)
b)

151
EDX results from the zinc-free environment showed the presence of aluminium, phosphorus,
calcium and silicon. As the industrial pigment used for this test is referred to as calcium
aluminium polyphosphate silicate, the presence of silicon is not unaccountable for. However,
with some presence within the surface deposit, it can be considered likely that the silicon
component of the pigment is a component with an active role to play in the inhibition
mechanism. From literature around inhibition on coil coated materials, there is a possibility
that this calcium and silicon containing species would be a type of ion-exchanged silica, which
are well known for use as inhibitors, alongside use in the coil coating industry[1].
With calcium aluminium polyphosphate showing a similar, albeit less extreme, time-dependant
inhibition profile to that of strontium aluminium polyphosphate within the electrochemical
results, it is suspected that the inhibitor layer formed may be similar. However, the presence
of aluminium in the zinc containing x-ray spectrum for the CAPP inhibitor shows that there is
certainly a difference in the way the inhibitor is deposited from solution in the presence of zinc
chloride.

152
0 1 2 3 4 5 6 7 8
0
100
200
300
400
500
ClFe
Zn
Na Si
Al
Fe
Ca
P
O
Inte
nsity / C
ounts
Per
Second
Energy / keV
CAPP + ZnCl2
Figure 4.2.12 – Results obtained for steel exposed to a sodium chloride solution containing
the CAPP inhibitor pigment and zinc chloride. a) - A representative image of the steel surface
after washing from the electron microscopy. b) - A measured EDX spectrum representative
of the surface shown on SEM, cut to show observed elements
a)
b)

153
Magnesium Aluminium Polyphosphate (MAPP)
Visual Inspection
Figure 4.2.13 - Images of steel surfaces following exposure to MAPP inhibited solution. a) -
Pre-wash, b) - Post-wash
Through visual inspection of the sample exposed to the MAPP inhibited solution containing no
zinc chloride, it can be seen that an orange-to-white deposit appears with inconsistently
coverage of the steel surface. It was clear from initial inspection that this product was not
adhered to the underlying steel. This was confirmed as, following gentle washing of the
sample, it could be seen that the majority of the covering material had been removed, leaving
a yellowed surface, suspected to be an inhibitor deposit alongside a small area of residual
anodic activity which is covered by a yellow-brown corrosion product.
Figure 4.2.14 - Images of steel surfaces following exposure to MAPP inhibited solution
containing zinc. a) - Pre-wash, b) - Post-wash
a) b)
a) b)

154
Analysing the zinc-containing environment for MAPP inhibited solution, it can be seen that
there is a prominent corrosion spot alongside some white deposits seen on the unwashed
sample. Following gently washing, a miscoloured steel surface can be seen in the absence of
the white deposits. The orange-brown corrosion spot appears to have maintained adherence
to the surface.

155
SEM/EDX Results
0 1 2 3 4 5 6 7 8
0
50
100
150
200
250
Al
Fe
Mg P
O
Inte
nsity /
Cou
nts
Pe
r S
eco
nd
Energy / keV
MAPP
Fe
Figure 4.2.15 – Results obtained for steel exposed to a sodium chloride solution containing
the MAPP inhibitor pigment in the absence of zinc chloride. a) - A representative image of
the steel surface after washing from the electron microscopy, showing a deposit (darker
areas) alongside areas where only iron and oxygen could be observed. b) - A measured EDX
spectrum representative of the surface shown on SEM, cut to show observed elements
a)
b)

156
Figure 4.2.15 shows a representative SEM image and EDX result from the zinc-free MAPP
inhibited sample. In this, it can be seen that the surface is coated by layer that appears to be
somewhat cracked and removed in the image. The EDX of the darker regions show the
presence of magnesium, aluminium and phosphorus, whereas the elemental analysis of the
lighter regions is only able to detect iron, oxygen and carbon, suggesting a bare steel surface,
or alternatively deposits that are of a thickness below the detection limit of the technique. It is
difficult to fully understand the structure of the inhibitor layer deposited in this particular case;
however, it is suspected that both the magnesium and aluminium are incorporated in a layer
containing magnesium/aluminium phosphate/polyphosphate type character.
In the presence of zinc, the presence of the MAPP inhibitor layer appears to be difficult to
notice with the electron microscope images alone, with the visible morphology being similar to
that of polished steel. Some darker areas appear as either pits or particulates on the surface,
and the EDX spectra obtained for each area appear to be distinct in regards to observed
element intensity. Within the two contrasting regions (appearing lighter and darker within the
electron microscope image), the elemental make-up is similar, with oxygen, magnesium, zinc
and phosphorus present. Whilst there is notable differences in the intensities of the elements
shown, with the lighter areas having less pronounced oxygen peaks and more pronounced zinc
peaks seen across the sample, quantitative analysis was not done to determine whether this
was an actual effect.

157
Figure 4.2.16 - Results obtained for steel exposed to a sodium chloride solution containing
the MAPP inhibitor pigment and zinc chloride. a) - A representative image of the steel
surface after washing from the electron microscopy. b) - Measured EDX spectra
representative of the particulate surface shown on SEM.
0 1 2 3 4 5 6 7 8 9 10
0
200
400
600
800
ClZn
Zn
Na
Al
Fe
Mg
P
O
Inte
nsity / C
ounts
Per
Second
Energy / keV
MAPPFe
a)
b)

158
Strontium Aluminium Polyphosphate (SAPP) with Cathodic Polarisation
In each of the studies seen so far in this chapter, the effect of the inclusion of zinc on the visual
corrosion, surface morphology and elemental composition of deposit has been noted on a
steel surface. However, it is worth noting that the behaviour of the inhibitor systems is likely to
differ in a situation where the metal surface is coupled, such as in galvanised steel. Therefore,
a further experiment was added to look at the effects of strontium aluminium polyphosphate
on steel when a cathodic potential is imparted during the immersion period.
Figure 4.2.17 shows a representative image obtained through electron microscopy, and an EDX
spectrum obtained from the surface. Outside of the surface imperfection seen within the
image provided, there appears to be little of interest with regards to surface morphology.
Indeed, much of the surface seems to have an appearance similar to that of ground steel.
Additionally, the peaks present on the EDX are mainly iron, with potentially a low intensity
peak present for zinc. This is consistent with what would be expected for a cathodically
protected steel sample.
In this case, it can be suggested that there is no evidence within these results for the
deposition of any material from the inhibitor in solution. However, the penetration depth of
EDX is high, and there is certainly the potential for thin layer deposition which would be at
concentrations and thicknesses beyond the detection limit for this technique. Therefore, it is
suggested that a more sensitive technique may need to be employed to gain any meaningful
insight into the cathodically polarised systems.
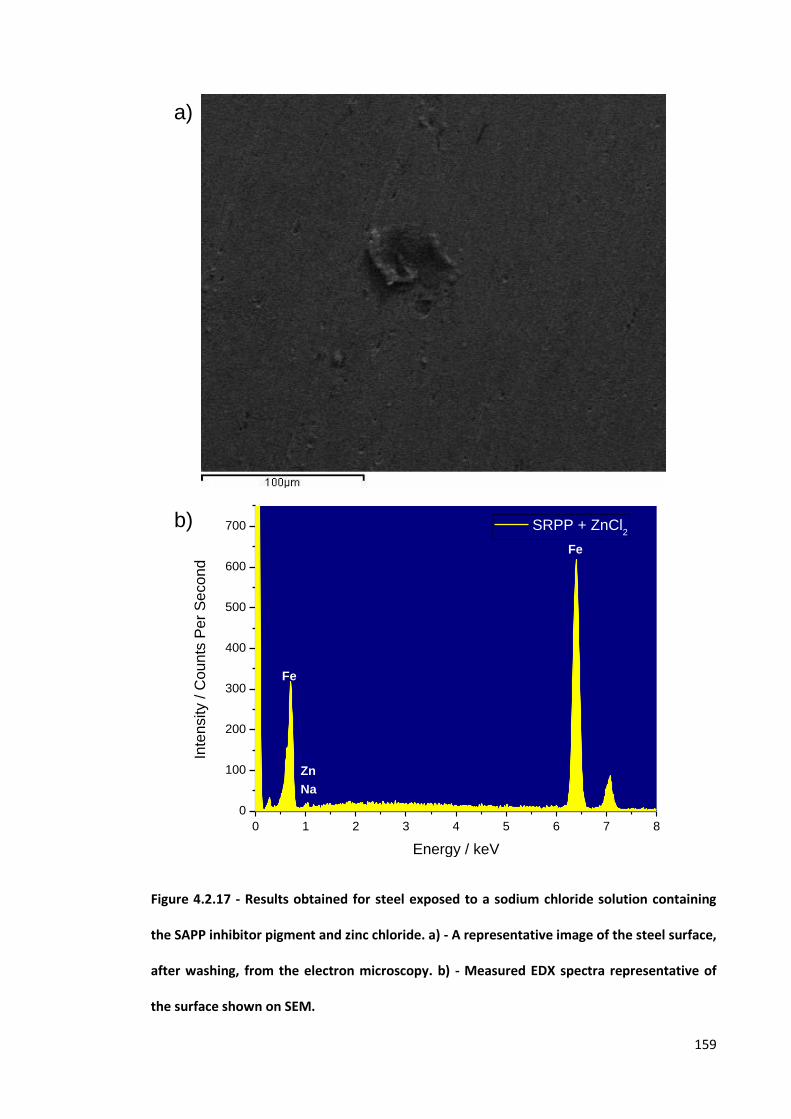
159
0 1 2 3 4 5 6 7 8
0
100
200
300
400
500
600
700
Fe
Zn
Na
Inte
nsity / C
ou
nts
Per
Se
co
nd
Energy / keV
SRPP + ZnCl2
Fe
Figure 4.2.17 - Results obtained for steel exposed to a sodium chloride solution containing
the SAPP inhibitor pigment and zinc chloride. a) - A representative image of the steel surface,
after washing, from the electron microscopy. b) - Measured EDX spectra representative of
the surface shown on SEM.
a)
b)
160
4.2.4 Discussion
In the results presented, differences between the deposited layers, with and without the
presence of zinc, can be seen. The effect of zinc on these three polyphosphate inhibitors, and
the overall way that these inhibitors appear to work, is seen to be different.
Strontium aluminium polyphosphate shows noteworthy changes when zinc has been
introduced to the solution. The adherence of the corrosion products to the surface appear to
have improved, with a morphological change of the overlying layer also evident, shifting from a
particulate structure to a plate-like structure.
Analysing the elemental composition measured at the surface, a few points of interest can be
discerned. Firstly, the absence of strontium from the spectra of both samples suggests that
strontium is not incorporated into the surface inhibitive film and therefore plays no part in the
anti-corrosion mechanism for SAPP. Secondly, the addition of zinc to the solution also has an
effect on the SAPP deposits beyond the detection of zinc at the surface, which may be an
expected outcome. The peak attributed to aluminium within the EDX spectra is seen to
become lower in intensity, potentially suggesting less incorporation of aluminium into the
surface deposit.
One potential explanation for this occurrence is a reaction or ion-exchange with aluminium
polyphosphate producing a zinc phosphate or zinc polyphosphate that is the major
contributing species to the inhibitor mechanism. In this case, it is important to understand why
deposition of these materials may occur.
Through the visual observations laid out in this chapter, and linking back to the
electrochemical results presented in the previous chapter, it can be suggested that the main
action of the inhibitors is at the cathodic sites. At the cathodic sites, it would be expected that
the oxygen reduction reaction would predominantly occur, particularly as the tests were
carried out in aerated conditions. Therefore, the local microenvironment at the metal interface

161
would be subject to an increase in pH which would subsequently lead to the solubility product
of the deposited species being exceeded within this microenvironment. With the inhibitors
that have been observed, it is likely that the formation of calcium phosphate and zinc
phosphate based deposited are due to low solubility and therefore have an increased
likelihood to deposit earlier.
The visual inspection of the samples exposed to solutions containing calcium aluminium
polyphosphate suggested that there was a reduction in the presence of corrosion at the steel
surface with zinc present. This potentially indicates an improvement in corrosion inhibitor
efficacy. When using electron microscopy to analyse the morphology of the surface, a change
can be seen between the two samples. With the zinc free environment, a thick deposit with a
rough morphology forms on the surface. Whereas when zinc is present, the surface deposit
morphology appears both thinner and more compact, lacking the roughness of the other
specimen.
Elemental analysis of the CAPP exposed steel sample surfaces showed a secondary set of
elements, with silicon being easily detectable on the surface. This suggests that the CAPP
corrosion inhibitor pigments include an active silicon-based compound alongside the
polyphosphate component. One suggestion is that this species is a calcium exchanged silica
inhibitor, similar to Shieldex, giving this inhibitor pigment a secondary method of inhibition.
In contrast to the observations made with SAPP, CAPP shows no significant reduction in the
levels of aluminium seen at the surface when zinc is incorporated. This suggests that the
inhibitor interaction with the zinc species in solution is likely to be different to that of SAPP,
where aluminium is not detected on the surface. It is possible that this is indicative of a
mechanistic difference overall with the inhibitor action between the two species, but it is
impossible to say that for certain with just these results.

162
Magnesium aluminium polyphosphate, in the absence of zinc chloride, is seen to corrode
slightly, with the electron microscope images following cleaning showing a thin surface deposit
with a tendency to crack. However, similar to CAPP, the MAPP inhibitor shows a reduction in
the level of visible corrosion products on the surface in the presence of zinc, suggesting an
improvement in the corrosion resistance of the system.
Electron microscopy showed the presence of thin surface layers on top of the steel substrate in
both cases. However, subtle differences between the two environments were evident.
Inclusion of the zinc species appears to either improve the adherence properties or reduce the
tendency to cracking of the thin deposited layer, as there was no evidence of the clear cracking
of the deposited layer that was present on the zinc free sample. Additionally, the zinc
containing sample included some particle structures within the deposit layer which were
absent on the zinc free surface, suggesting that the presence of zinc may promote the
agglomeration of deposits as opposed to producing a simple layer.
Elemental analysis of the two surfaces suggests that the overall layer composition is relatively
unchanged, besides the addition of levels of zinc, with no obvious reductions in levels of
aluminium or magnesium compared to the sample exposed to magnesium aluminium
polyphosphate inhibitor only. However, analysis of the particles present on the zinc exposed
surfaces suggests that the particles are enriched in magnesium and phosphorus.
One potential drawback of this experiment is the well-known behaviour of the zinc cation as a
cathodic corrosion inhibitor. By incorporating the zinc cation, the behaviour of the solution can
be considered to have changed, independent of any interactions the polyphosphate may have
with the zinc. Certainly, differences can be seen between the two samples without
polyphosphate incorporated, suggesting an effect of zinc.

163
However, the differences observed between the two uninhibited samples and the pairs of
samples containing polyphosphate pigments are distinctly dissimilar. The addition of zinc
improves the adhesion of the corrosion products inconsistently on the surface, meaning that
whilst the adhesion of the corrosion product to the surface is improved, there were still areas
in the tests done within this chapter where the corrosion product is still removed during gentle
washing.
Whilst this behaviour is observed in the case of SAPP, albeit with a more consistent film, the
same cannot be said for the other polyphosphate inhibitors. Other behaviours, such as the
aggregation of magnesium into particles and the reduction of surface aluminium concentration
for SAPP, are occurrences in which the presence of zinc, and the interaction of this species
with the polyphosphate inhibitor, can be considered to be a major contributor.
Whilst these results suggest differences in deposition structure and elemental composition
when zinc is added to the solution, the experimental methodology means that these results
may not be directly applicable. By exposing a steel sample to the environment without
electrochemical perturbation, the local environment and reactivity of the surface is likely to be
different to that of the cut edge of galvanised steel, where the steel will be polarised
cathodically by the sacrificial anode.
However, as it was shown in the final experiment in this section, the techniques used in this
section may not be suitable for observing the behaviour of these inhibitors on a surface which
has been polarised cathodically away from open circuit potential, as neither electron
microscopy nor energy dispersive x-ray spectroscopy are able to detect morphological or
elemental deposits.

164
4.2.5 Conclusions
The results shown in this section have shown that the addition of zinc makes changes to the
phosphate-substrate interactions above and beyond the differences observed rom the
addition of zinc by itself. Notably, this includes changes in the colour and adherence properties
of the corrosion products present on the surface. Analysis of the surface has also determined
changes in both the elemental composition and structure of the deposits on the surface in
which the polyphosphate inhibitor pigments are incorporated.
Behaviour of three polyphosphate inhibitors is distinct, and the following conclusions could be
made:
The presence of some residual anodic activity suggests that the observed inhibitors are
predominantly cathodic in nature.
SAPP, CAPP and MAPP all show changes to the overall surface deposit structure, when
compared with the uninhibited samples, with varying degrees of changes to the
elemental composition of those deposits
Elemental analysis of the surfaces determined the presence of aluminium and
phosphorus, as well as calcium and silicon for CAPP and magnesium for MAPP
Strontium was not detected in either SAPP sample, suggesting that it is does not play a
significant role in the inhibition mechanism of SAPP.
Zinc was detected on the surface for CAPP and MAPP following exposure to the
solutions containing both the inhibitor and zinc chloride, with little effect noted to
other elements present.
Zinc appears to be an additive constituent in the CAPP deposition layers, with no
significant changes observed to the intensity of peaks for other elements measured on
the surface

165
The surface of the MAPP sample appears to show a secondary particulate deposit in
the presence of zinc, which was determined as a magnesium-rich phosphate-
containing particle through EDX.
The addition of zinc improves the corrosion inhibition properties of CAPP and MAPP,
as seen by corrosion product coverage on the surface.
A reduction in the intensity of the aluminium peaks detected on the surface of the
SAPP samples to near-zero levels was seen, suggesting a change to the elemental
composition of the deposits on the steel surface when zinc chloride is present.
These results give insight into some of the ways in which the polyphosphate inhibitors interact
with the steel surface. However, it is clear that, whilst they do give some insight into the
behaviour of these polyphosphate inhibitors, they are not directly applicable to the real-world
scenario of galvanically coupled zinc and steel, where the couple corrosion potential is
cathodic to that of the open circuit potential of mild steel.
In the case of exposing cathodically polarised steels to polyphosphate containing solutions, the
deposition on the surface was not visible through SEM and was not detectable by EDX. This
suggests that the deposit on a cathodic surface is of a thickness below the detection limit of
the EDX, and therefore a technique with greater resolution would be required.

166
X-Ray Photoelectron Spectroscopy – The Effect of Zinc on Inhibitor 4.3
Film Formation
4.3.1 Introduction
In the previous section of this chapter, the morphology and elemental composition of surface
deposits on steel arising from corrosion inhibition were shown to be changed by the presence
of zinc chloride in polyphosphate inhibitor containing solutions through the use of scanning
electron microscopy and energy dispersive x-ray spectroscopy. However, this combination of
techniques was not able to determine unambiguously the film compositions that deposited on
a cathodically polarised steel sample, presumably because the interaction depth of the
incident electron beam at 12 keV (approximately 1 micron) greatly exceeded the deposited
film thickness.
Therefore, in this section, the surfaces of cathodically polarised steel samples exposed to
polyphosphate inhibitor saturated salt solutions were analysed using x-ray photoelectron
spectroscopy, which has both the ability to analyse quantitatively and a specific surface
sensitivity, to understand the elemental composition of the inhibitor films deposited, alongside
any structural information that may also be concluded from the data gathered. It was
therefore anticipated that the effect of zinc cations have on the modified aluminium
polyphosphate inhibitors could be ascertained.
4.3.2 Experimental
Samples for x-ray photoelectron spectroscopy analysis were created from mild steel of
approximate dimensions 1 cm x 2 cm and given a consistent surface finish using incremental
grades of silicon carbide abrasive discs up to and including 4000 grade, followed by subsequent
polishing utilising diamond suspensions of size 3 micron, 1 micron and ¼ micron successively.
Samples were immersed in the relevant inhibitor-saturated sodium chloride solution and
polarised cathodically to the potential of the zinc and steel couple, which was measured during
the electrochemical impedance measurements, which is shown in the table below.

167
Inhibitor System Measured Mixed Corrosion Potential
Strontium Aluminium Polyphosphate - 1035 mV
Calcium Aluminium Polyphosphate - 1050 mV
Magnesium Aluminium Polyphosphate - 1045 mV
Table 4.3-1 - Measured mixed corrosion potentials that were used as the polarisation values for steel in the XPS study.
In order to mimic the effects of the changing composition of the microenvironment caused by
dissolution of zinc in a genuinely coupled sample, zinc chloride was added to the inhibitor
containing solution at a concentration of 2 mM. Control samples, without zinc chloride added,
were also ran and analysed. Following exposure, the samples were air dried and washed with
deionised water. The preparation and exposure of XPS samples was completed ex-situ.
Samples were then analysed using Kratos Axis Ultra X-Ray Photoelectron Spectroscope with a
monochromated aluminium X-ray source.
4.3.3 Results
The surfaces of steel samples were polarised cathodically and exposed to polyphosphate
saturated solutions for periods of time. Spectra were calibrated against charging to the C 1s
peak of adventitious carbon, introduced to the sample surface upon contact with air, at 284.8
eV.
Strontium Aluminium Polyphosphate
A representative example survey spectra is shown in Figure 4.3.1, highlighting major elements
detected on the surface – zinc, oxygen, phosphorus and carbon. As with the EDX study, the
presence of strontium was not detected in any of the obtained XPS spectra. Additionally, none
of the spectra showed levels of aluminium that could be considered significant. This is directly
contradictory of the EDX study, and will be discussed later in the chapter.

168
The presence of the iron 2p peak was detected for the samples without zinc chloride added,
and the 30 minutes exposure time with added zinc chloride. This is suspected to be due to the
low thickness or inconsistent deposition of the phosphate inhibition layer in these samples.
The phosphorus content on the surface was followed by taking high resolution spectra across
the range of binding energies in which the phosphorus 2p band is located. This is shown in
Figure 4.3.2
05001000
0
100000
200000
Zn LMMFe 2p
Na 1s
O 1s
P 2pCl 2p
C 1s
Inte
nsity /
Cou
nts
Binding Energy / eV
SAPP 30m ZnCl2
Zn 2p
Figure 4.3.1 - An example wide scan XPS spectrum for a steel surface cathodically polarised and exposed to a sodium chloride solution containing SAPP and 2 mM zinc chloride.

169
130131132133134135136137
0
500
1000
1500
2000
2500
Inte
nsity (
Ba
ckg
roun
d R
em
oved
) /
Cou
nts
Binding Energy / eV
SAPP 30m
SAPP 5h
SAPP 12h
SAPP+ZnCl2 30m
SAPP+ZnCl2 5h
SAPP+ZnCl2 12h
Figure 4.3.2 - High resolution, background-subtracted XPS spectrum of the region containing the phosphorus 2p peak, showing samples obtained with and without zinc chloride. Spectra are shown as obtained, i.e. without smoothing by deconvolution summation.
In this study, the intensity of the phosphorus 2p peak is used as a quantitative measure of the
surface coverage and thickness of deposited phosphate layer. As can be seen, the peaks
obtained for samples exposed to zinc chloride are all larger than those without zinc chloride
present, even after short exposure times. The difference in detected phosphorus between the
12 hour zinc chloride free and 30 minute zinc chloride containing samples is significant, with
calculated atomic concentrations of phosphorus of 3 at% and 9 at% respectively.
Low levels of phosphorus, likely from a phosphate source, are consistently observed on the
surfaces of samples without the presence of zinc chloride. However, the XPS spectra for non-
zinc chloride exposed samples also shows the presence of peaks around 500 eV binding
energy, characteristic of the Zn LMM auger peak, which indicates the presence of zinc on the

170
surface, albeit this has been calculated at low levels (between 0.9 and 1.8 at%). It is therefore
possible that zinc impurities within the industrially produced SAPP pigment are a contributing
factor to the presence of phosphorus on the surface. Indeed, whilst the structure may not be
exactly the same, the binding energies associated with the results link well with previously
reported values for zinc phosphate glasses[2].
Deconvolution of the phosphorus peak suggested only a single binding state was present in
each spectrum, with peak positions of the P 2p 3/2 and P 2p 1/2 peaks generally lying within
0.5 eV of 133.7 eV and 134.6 eV respectively. However, the sample with 30 minutes exposure
to the zinc chloride containing solution was shifted by around 1 eV with respect to these
values, which implies that the phosphorus was present with differing chemistry. The discussion
section of this chapter will deliberate over the exact composition for these, and those
determined in the coming segments.
Calcium Aluminium Polyphosphate
A representative example survey spectra is shown in Figure 4.3.3, highlighting major elements
detected on the surface – calcium, zinc, oxygen, phosphorus and carbon. Aluminium was not
observed at noteworthy concentrations.
The presence of the iron 2p peak was detected for three samples, both 30 minute samples,
and the 5 hour sample without zinc chloride. Again, this is suspected to be due to either thin or
incomplete deposition of the phosphate inhibition layer in these samples.

171
02505007501000
0
25000
50000
75000
100000
125000
Cl 2p
Ca 2p
C 1sP 2p
Zn 2p
CP
S
Binding Energy (eV)
12h CAPP ZnCl2
O 1s
Figure 4.3.3 - An example survey scan XPS spectrum for a steel surface cathodically polarised and exposed to a sodium chloride solution containing CAPP and 2 mM zinc chloride
The phosphorus content on the surface was followed by taking high resolution spectra across
the range of binding energies in which the phosphorus 2p band is located. This is shown in
Figure 4.3.4.

172
130132134136138
-100
0
100
200
300
400
500
600
700
800
900
1000
1100
1200
1300
1400
Inte
nsity / C
ounts
Binding Energy / eV
30 m
5 h
12 h
Zn 30 m
Zn 5 h
Zn 12 h
Figure 4.3.4 - High resolution, background-subtracted XPS spectrum of the region containing the phosphorus 2p peak, showing CAPP samples obtained with and without zinc chloride. Spectra shown are summations of the deconvoluted spectra.
The phosphorus profile for CAPP differs to that of SAPP. The phosphorus deposition on the
surface for both 30 minute exposures and 12 hour exposures are similar. A difference between
the two environments can be seen by comparing the 5 hour exposure peaks, in which the zinc
containing sample displays a significantly higher concentration (20 at%) of phosphorus than
that of the zinc free sample (5 at%).
Deconvolution of the CAPP P 2p peaks suggests a single binding state present for all samples
for the phosphorus 2p peak. The analysed binding states showed a P 2p peak with a binding
energy at approximately 133.9 eV for each sample in this set of experiments, within a 0.5 eV
tolerance. This binding energy fits well with the understood value for a metallic phosphate.

173
Magnesium Aluminium Polyphosphate
A representative example survey spectra is shown in Figure 4.3.5, highlighting major elements
detected on the surface – magnesium, oxygen, phosphorus and carbon. Aluminium was not
observed at noteworthy concentrations in any of the obtained spectra.
The presence of the iron 2p peak was detected for only one sample, the 30 minutes exposure
time with added zinc chloride, an indication of low or poor surface coverage.
025050075010001250
0
20000
40000
60000
80000
100000
120000
Mg 2p
Cl 2p
O KLL
Mg KLL
O 1s
C 1s
P 2p
CP
S
Binding Energy / eV
12h PAM ZnCl2
Mg 1s
Figure 4.3.5 - An example wide scan XPS spectrum for a steel surface cathodically polarised and exposed to a sodium chloride solution containing MAPP and 2 mM zinc chloride
The phosphorus content on the surface was followed by taking high resolution spectra across
the range of binding energies in which the phosphorus 2p band is located. This is shown in
Figure 4.3.6.

174
130132134136138
0
50
100
150
200
250
300
Inte
nsity / C
ounts
Binding Energy / eV
PAM 30m
PAM 5h
PAM 12h
PAM+ZnCl2 30m
PAM+ZnCl2 5h
PAM+ZnCl2 12h
Figure 4.3.6 - High resolution, background-subtracted XPS spectrum of the region containing the phosphorus 2p peak, showing MAPP samples obtained with and without zinc chloride. Spectra shown are summations of the deconvoluted spectra.
The results show approximately equivalent phosphorus peak intensities on the surface, with
minor differences in peak binding energy that can be considered to be subtle differences in
overall chemistry within the surface chemistry over the observation area that is unlikely to be
significant. This will be discussed in more detail in the next section.
The presence of zinc was noted at between 0.1 and 0.4 at% as measured by the stronger Zn 2p
peaks, which were seen at just above the noise threshold. Therefore, whilst a zinc peak (Zn 3s)
would be expected close the P 2p peak, it is not observed due to the low concentration of zinc.

175
4.3.4 Discussion
Initial Discussions
In this set of experiments, the detected concentration of phosphorus at the surface using x-ray
photoelectron spectroscopy was used as an indicator of both the thickness and degree of
surface coverage following exposure. This gives an indication of the overall effect of the
presence of zinc ions in solution on the deposition kinetics of phosphate species.
The strontium aluminium polyphosphate samples showed consistently low levels of
phosphorus in the samples free of zinc ions. Upon the addition of zinc ions, the detected levels
of phosphorus on the surface are noticeably increased. One important observation in this
sample set is that the detected phosphorus levels are higher after 30 minutes exposure with
zinc than any samples detected throughout 12 hours exposure in the zinc free environment.
This suggests that the presence of zinc is important to the mechanism in which phosphate
deposits on the surface from the strontium aluminium polyphosphate inhibitor pigment.
Additionally, trace levels of zinc have been detected in the inhibitor pigment itself, suggesting
that the samples without added zinc chloride may still contain low levels of zinc within the
solution. It is possible that this background level of zinc is a contributing factor into why
phosphorus is detectable at the surface at all in the nominally zinc free environments.
One further observation of interest is seen through analysing the binding energy of the
phosphorus peak when fitting the constituent 2p components. Only one sample, the 30 minute
exposure with zinc chloride sample, had a peak binding energy outside of a deviation of
approximately 0.5 eV from the mean value. This potentially suggests a slightly different
chemistry of the phosphate layer in the initial stages of deposition.
For the calcium aluminium polyphosphate inhibitor pigment, it can be seen that the
phosphorus levels are similar for both the short term and long term exposure samples. This is

176
true in terms of both the corrected area and overall peak intensity of the P 2p peak. This
suggests that the overall deposition is unaffected by the presence of zinc in the solution.
However, there is a notable difference seen between the samples with and without added zinc
chloride for the samples exposed to the environment for a period of 5 hours. In this case, the
zinc chloride containing solution is shown to have greater phosphorus deposition than the zinc
chloride free sample. One potential explanation for this observation is that the phosphate
deposition on the steel surface has a distinct, faster mechanism involving zinc which results in
a chemically similar deposit.
Surface zinc levels are relatively consistent, in terms of concentration detected by XPS, for the
CAPP exposed sample, staying at approximately 2 at%. The suggestion being that zinc is not a
major constituent of the deposited phosphate layer. One possible suggestion is that zinc, in
this case, acting as more of a catalyst for the phosphate layer, improving speed of uptake but
having no effect on the maximum levels deposited. Indeed, Rangel et al determined that the
presence of both calcium and zinc ions produces a more compact film which would be
consistent with a greater overall phosphate concentration, as seen in the spectra obtained[3].
However, there is some evidence to suggest that zinc is capable of substituting for calcium
within calcium phosphate structures (hydroxyapatite), and thus there is the potential for a
chemical structure similar to that with a relatively low level of zinc uptake[4].
Despite being noted as present when analysing the surface through EDX, the presence of
silicon was also absent from the XPS spectrum. The presence of silicon within the steel would
appear a likely source for these peaks within the EDX spectra, however, that would be
expected within all spectra and wasn’t observed. The most likely explanation for the presence
of silicon within the EDX spectra, therefore, is pigment encapsulation within the corrosion
product formed on the surface.

177
Unlike the other two pigments examined within this study, magnesium aluminium
polyphosphate appears to show little difference between the two environments. When
considering the phosphorus peak, it can be seen that the detected concentration at the
surface shows little change. Similarly, the difference in the binding energies can be considered
to be insignificant.
Indeed, analysis of any peaks not considered to be affected by external contamination (carbon
is suspected to be entirely adventitious, some oxygen may also be) shows that the difference
between samples with and without zinc chloride added is minimal across most elements. Even
in the case of the spectral peak for zinc, where the difference might be expected to be most
pronounced, only trace levels are observed on the surface. This suggests that the role of zinc in
the phosphate deposition for the MAPP inhibitor pigment is insignificant, with seemingly zero
overall effect on the surface.
In all cases, the XPS spectra lacked the presence of aluminium, suggesting a considerable
modification to the proposed aluminium polyphosphate structure of the inhibitor pigments. In
the cases of CAPP and MAPP, this finding is in direct contrast to that observed in the SEM-EDX
study that has been reported in the previous section of this chapter. There are two possible
explanations for this observation. One suggestion could be that the aluminium content
measured by EDX was from pigments that have been incorporated within the corrosion
product as opposed to ones which have acted on the surface, and therefore would not be
present on a sample which has been cathodically polarised. Alternatively, the aluminium
containing part of the industrial pigments may have a mode of action on anodic sites, which
would also result in a discrepancy between XPS and EDX data.

178
XPS Quantification and Suggested Structures
The calculations to determine the quantities of the elements on the surface, as obtained by x-
ray photoelectron spectroscopy, dismissed elements that were likely to be not included in the
surface deposits of interest, such as adventitious carbon. Figure 4.3.7 shows the calculated
atomic percentages of the detected phosphate, oxygen, and major secondary element (zinc,
calcium or magnesium.)
By analysing the atomic ratios, a structure of each of the deposited phosphates can be
suggested. For this, it is expected that the samples with the longest exposure time (12 hours)
will be the most representative of the final composition, and thus it is for this exposure time
that the composition will be predicted.
In the case of the strontium aluminium polyphosphate inhibitor pigment, even without the
addition of zinc chloride, the zinc/phosphorus ratio is around 0.6, suggesting a chemical
formula that contains approximately one zinc atom for every two phosphorus atoms present.
However, the overall percentage of oxygen seen at the surface is very high, so it is impossible
for the oxygen detected to be entirely from deposited phosphates. It is likely that much of the
oxygen is incorporated into metal hydroxides on the surface.
The oxygen to phosphorus ratio is maintained at too high a level to realistically be
appropriated to entirely phosphate, with a large proportion likely to be attributed to surface
hydroxides. However, with the addition of zinc chloride, the oxygen to phosphorus ratio
reduces over time from 7:1 to closer to 4:1 and a reduction of the secondary O 1s peak to zero
area. This suggests that the oxygen has a greater proportion of phosphate character.
Over the test period, the P 3p 3/2 peak is seen to shift from 134.7 to 133.9, suggesting a shift
towards a less positively charged phosphorus environment. It is thought that this coincides
with an increased influence of the zinc counter ion on the phosphate.

179
Figure 4.3.7 - Graph showing the concentrations of selected elements deposited on the steel surface, as determined by X-ray photoelectron spectroscopy (M.S.E. – major secondary element(s) including zinc, calcium and magnesium)
0
10
20
30
40
50
60
70
80
90
100
30m 5h 12h 30m 5h 12h 30m 5h 12h 30m 5h 12h 30m 5h 12h 30m 5h 12h
SAPP SAPP Zn CAPP CAPP Zn MAPP MAPP Zn
Surf
ace
Co
nce
ntr
atio
n /
at%
Exposure Time / h Inhibitor
Concentration of Selected Surface Deposited Elements
Phosphorus
Oxygen
M.S.E

180
With this data, the general chemical formula of the deposit from strontium aluminium
phosphate and zinc chloride has been calculated to be most likely zinc metaphosphate
( ), as this fits best with the behaviours and results as observed and mentioned in this
section.
For calcium aluminium polyphosphate, the calcium/phosphorus ratio sits at approximately 1.
However, there is a slight deviation from this in the early exposure times for samples
containing zinc chloride, where there is a significant presence of zinc observed. In this case, the
addition of the concentrations of zinc and calcium in this case maintains the 1:1 ratio of
phosphorus and potentially significant counter ions (in this case, zinc and calcium).
In the earlier exposure times, similar to what is observed with strontium aluminium
polyphosphate, the oxygen concentration is seen to be in excess of what could realistically be
incorporated into the inhibitor deposits. However, the oxygen/phosphorus ratio for longer
exposures (and the middle exposure for the zinc chloride containing solution) tends to an
approximate value of 3.
The phosphorus 3p 3/2 peak is seen to shift from approximate values of 134.5 to 133.8, again
suggesting a shift to a less positively charged environment, which again coincides to a greater
influence of the calcium and/or zinc counter ions in the phosphate environment over time.
Following this analysis, the composition of the surface deposit appears to be something
approaching that of calcium pyrophosphate ( ), as this most fits with the results as
presented. However, for the early stages of the samples exposed to the zinc chloride
containing solution, it is likely that this may be somewhat substituted. A potential suggested
structure of the deposit in this case may well be along the lines of . However,
the implications of this structure are not necessarily clear, albeit with the results presented, it

181
is possible this is an intermediate stage for the catalyst-like effect that the presence of zinc
ions has on the calcium aluminium polyphosphate inhibition.
An alternative theory may be presented in the literature. It has been reported that
hydroxyapatite, , a common calcium-phosphorus compound, undergoes an
ion-exchange process in the presence of zinc to produce zinc exchanged calcium
hydroxyapatite[5]. In this case, the structure would approximate to ,
although the secondary element (zinc, calcium) to phosphorus ratio would be away from the
calculated ratio in this case.
In the case of magnesium aluminium polyphosphate, the magnesium/phosphorus ratio has a
sample to sample variation between 1 and 1.5. It was observed that the composition ratio
tends towards 1 in the absence of zinc chloride, whilst the presence of zinc chloride tends
towards 1.5. Unfortunately, the concentration of oxygen maintains a value above that which
could be considered useful for determining the composition using the ratio of this and
phosphorus.
In analysing the phosphorus 3p 3/2 peak, it does not appear to change much over the course
of the experiment, and maintains a value around 133.8 eV. This suggests that there isn’t much
change to the phosphorus environment throughout the tests, or that any changes to the
chemical environment that phosphorus is exposed to are similar.
With the variation in results over the test period, and few notable trends, it’s difficult to
ascertain a likely composition of the deposits. However, the one realistic composition
suggestion for the deposit in this case is magnesium phosphate ( ), as this has been
previously reported in phosphate inhibition[6]. It could be suggested from the obtained data
that the presence of zinc stabilises this particular form. In the case of the zinc chloride free
environment, it could be considered that a suggested chemical composition of
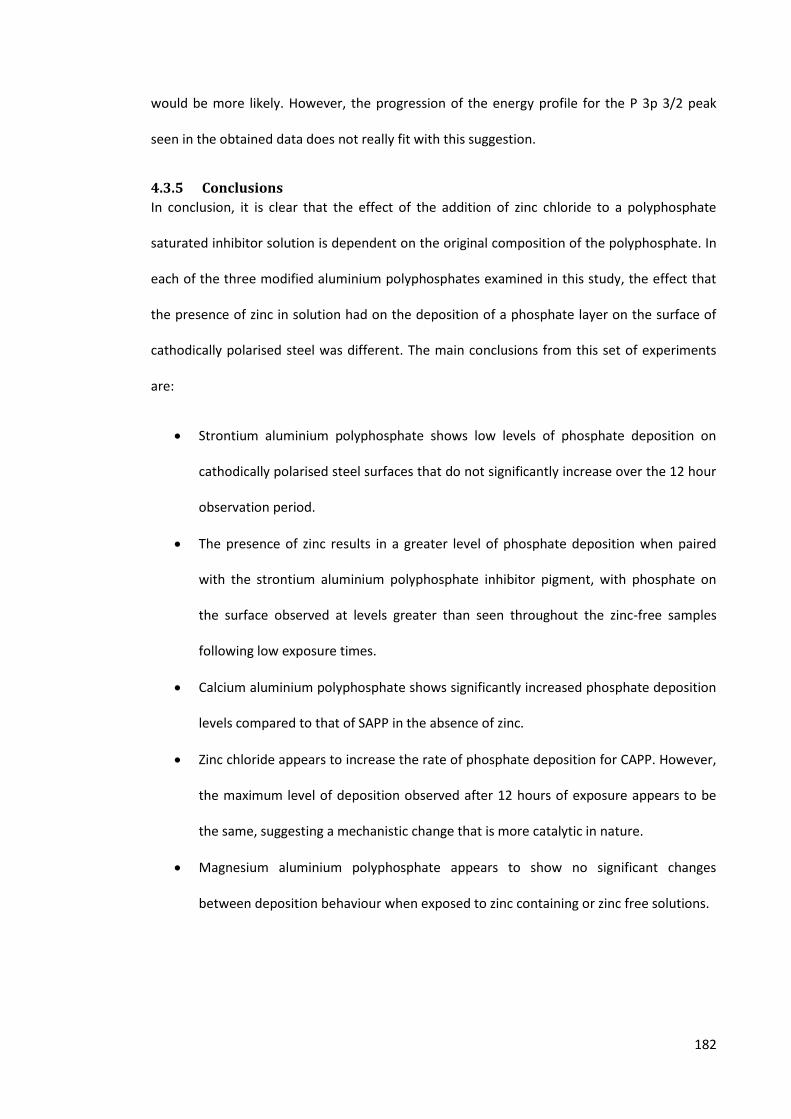
182
would be more likely. However, the progression of the energy profile for the P 3p 3/2 peak
seen in the obtained data does not really fit with this suggestion.
4.3.5 Conclusions
In conclusion, it is clear that the effect of the addition of zinc chloride to a polyphosphate
saturated inhibitor solution is dependent on the original composition of the polyphosphate. In
each of the three modified aluminium polyphosphates examined in this study, the effect that
the presence of zinc in solution had on the deposition of a phosphate layer on the surface of
cathodically polarised steel was different. The main conclusions from this set of experiments
are:
Strontium aluminium polyphosphate shows low levels of phosphate deposition on
cathodically polarised steel surfaces that do not significantly increase over the 12 hour
observation period.
The presence of zinc results in a greater level of phosphate deposition when paired
with the strontium aluminium polyphosphate inhibitor pigment, with phosphate on
the surface observed at levels greater than seen throughout the zinc-free samples
following low exposure times.
Calcium aluminium polyphosphate shows significantly increased phosphate deposition
levels compared to that of SAPP in the absence of zinc.
Zinc chloride appears to increase the rate of phosphate deposition for CAPP. However,
the maximum level of deposition observed after 12 hours of exposure appears to be
the same, suggesting a mechanistic change that is more catalytic in nature.
Magnesium aluminium polyphosphate appears to show no significant changes
between deposition behaviour when exposed to zinc containing or zinc free solutions.

183
The results suggest that the composition of the solution, and the cationic species contained
within, can potentially be manipulated to improve the efficiency of the polyphosphate
inhibition through producing a thicker or more coherent phosphate layer.
Surface Analysis – The Effects of Competing Cationic Species on 4.4
Inhibitor Film Formation
4.4.1 Introduction
In the previous section of this chapter, the addition of zinc chloride was shown to have varying
degrees of effectiveness on improving the deposition characteristics of modified aluminium
polyphosphate inhibitor pigments. Strontium aluminium polyphosphate showed a clear
increase in the overall phosphate deposition observed when zinc chloride was present.
Conversely, magnesium aluminium polyphosphate was shown to be relatively unaffected by
the presence of zinc chloride in solution, with phosphate deposition observed to be similar in
terms of concentration, and surface uptake of zinc was determined to be low.
Following these observations, it can be suggested that the addition of a secondary species
could be utilised to improve the corrosion inhibitor efficiency of these pigments. In this
chapter section, the initial steps towards understanding the effects of the addition of several
different metallic chlorides on the composition of surface depositions on cathodically polarised
steel samples were taken, by observing the behaviour using x-ray photoelectron spectroscopy.
4.4.2 Experimental
Samples for x-ray photoelectron spectroscopy analysis were created from mild steel of
approximate dimensions 1 cm x 2 cm and given a consistent surface finish using incremental
grades of silicon carbide abrasive discs up to and including 4000 grade, followed by subsequent
polishing utilising diamond suspensions of size 3 micron, 1 micron and ¼ micron successively.
Samples were immersed in an inhibitor saturated sodium chloride solution and polarised
cathodically to the potential of the zinc and steel couple, which was measured during the
electrochemical impedance measurements.

184
For the specimens requiring a zinc-rich environment, zinc chloride was added to the solutions,
prior to exposure, until a relative zinc ion concentration of 2 mM was obtained. Following
exposure, the samples were air dried and washed gently with deionised water. The
preparation and exposure of XPS samples was completed ex-situ. Samples were then analysed
using Kratos Axis Nova X-Ray Photoelectron Spectroscope with a monochromated aluminium
X-ray source.
4.4.3 Results
The initial experiments for this section looked at replacing the zinc chloride addition from the
previous chapter section with equal concentrations of other metal chlorides to determine the
differing effects, if any. This concentrated on two of the inhibitor pigments observed
previously, strontium aluminium polyphosphate and calcium aluminium polyphosphate.
Effect of Calcium
Strontium Aluminium Polyphosphate
A representative example survey spectra is shown in Figure 4.4.1, highlighting major elements
detected on the surface – zinc, oxygen, phosphorus, calcium and carbon.

185
025050075010001250
0
25000
50000
75000
100000
125000
150000
P 2pCl 2p
C 1s
Ca 2p
Na 1s
Zn 2p
O 1s
Inte
nsity /
Cou
nts
Pe
r S
eco
nd
Binding Energy / eV
SRPP + CaCl2 30m
Fe 2p
Figure 4.4.1 - An example wide scan XPS spectrum for a steel surface cathodically polarised and exposed to a sodium chloride solution containing SAPP and calcium chloride.
The presence of a peak associated with metallic iron within the spectra is used to determine
the depth and surface coverage of the deposited layer. With the penetration depth of the XPS
technique being approximately 10 nm, and the spot size being on the order of mm, the
detection of metallic iron can be considered to show either incomplete coverage or thin layer
deposition. In this case, iron was observed only on the short exposure time sample.
For these samples, the high resolution spectra for the calcium 2p and phosphorus 2p peaks
were followed to determine the development of the surface layer.

186
346348350352354
0
1000
2000
3000
4000
5000
6000
7000
8000
9000
10000
11000
12000
Inte
nsity / C
ounts
Per
Seco
nd
Binding Energy / eV
SRPP + CaCl2 30m
SRPP + CaCl2 12h
Figure 4.4.2 - High resolution, background-subtracted XPS spectrum of the region containing the calcium 2p peak. Spectra shown are summations of the deconvoluted spectra.
Figure 4.4.2 shows the XPS spectra over the region of binding energies in which the calcium 2p
peak is situated. In these spectra, calcium was shown to exist in a single binding state over
both the exposure times examined, with the observed concentration increasing from 3.8 at%
to 6.2at% at the longer exposure time. It was also noted that there was only a small shift in the
observed binding energies for this peak between the two exposure times.

187
130132134136138
0
5000
10000
15000
20000
Inte
nsity / C
ou
nts
Per
Second
Binding Energy / eV
SRPP + CaCl2 30m
SRPP + CaCl2 12h
Figure 4.4.3 - High resolution, background-subtracted XPS spectrum of the region containing the phosphorus 2p peak. Spectra shown are summations of the deconvoluted spectra.
Figure 4.4.3 shows the observed XPS spectra for the phosphorus 2p peak. In this case, a large
increase in concentration between the short exposure time and longer exposure time is
observed. Component fitting for this peak showed two binding states present for the
phosphorus peak. In the fitting, the phosphorus 2p 3/2 peaks are observed at binding energies
of 133.3 eV and 135.3 eV, with a peak splitting of approximately +0.87 eV to the relevant 2p
1/2 peak. The area ratio between the two binding states changes from 6:1 in the short
exposure time sample to 3:1 in the longer exposure time sample.
Calcium Aluminium Polyphosphate
A representative example survey spectra is shown in Figure 4.4.4, highlighting major elements
detected on the surface – oxygen, phosphorus, calcium and carbon.

188
020040060080010001200
0
50000
100000
150000
200000
O KLL
Ca 2s
P 2s
P 2p
C 1s
Ca 2p
Inte
nsity / C
ounts
Per
Second
Binding Energy / eV
CAPP + CaCl2 12h
O 1s
Figure 4.4.4 - An example wide scan XPS spectrum for a steel surface cathodically polarised and exposed to a sodium chloride solution containing CAPP and calcium chloride.
The iron 2p peak, which is used as an indicator for deposition thickness and surface coverage,
is present only at the lowest exposure time sample, and is only present at a low concentration.
This suggests that the deposition layer on the steel surface is relatively quick.

189
344346348350352354
0
5000
10000
15000
20000
25000
30000
35000
Inte
nsity / C
ounts
Per
Second
Binding Energy / eV
CAPP + CaCl2 30m
CAPP + CaCl2 5h
CAPP + CaCl2 12h
Figure 4.4.5 - High resolution, background-subtracted XPS spectrum of the region containing the calcium 2p peak. Spectra shown are summations of the deconvoluted spectra.
Figure 4.4.5 shows the calcium 2p XPS spectra. Calcium is observed in a singular binding state
across all observed samples at a consistent binding energy throughout. No clear trend in
surface calcium concentration could be determined from the XPS spectra.
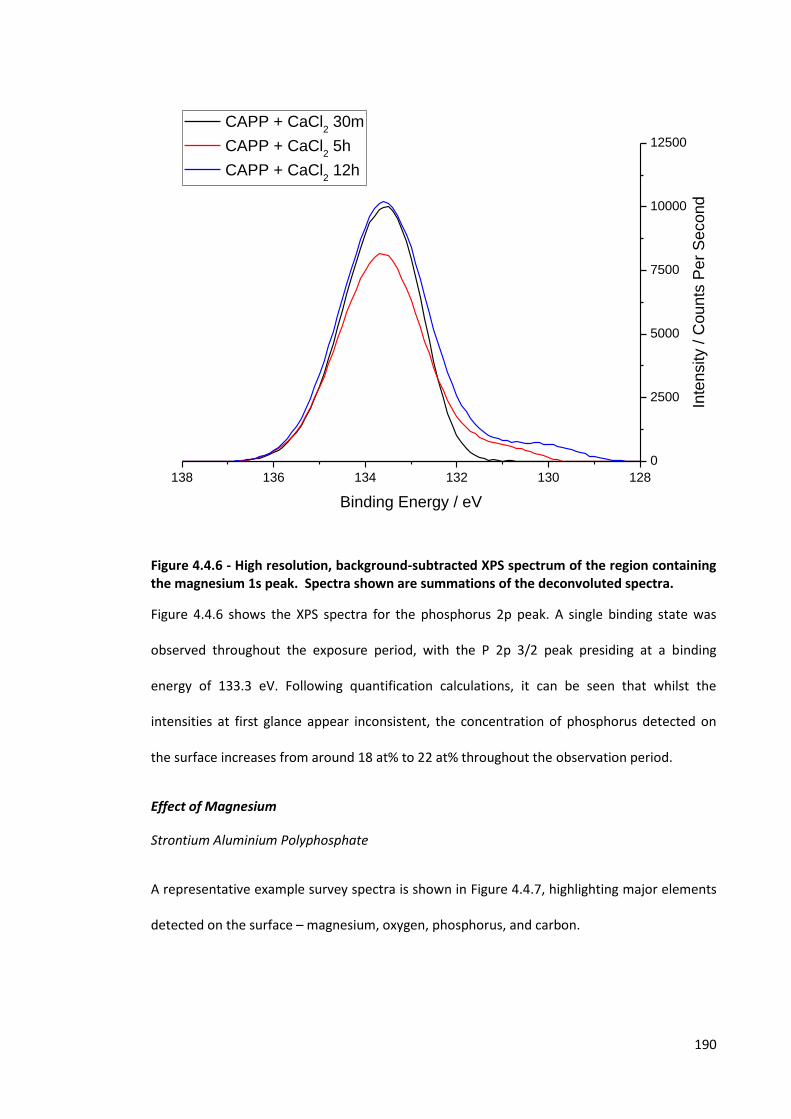
190
128130132134136138
0
2500
5000
7500
10000
12500
Inte
nsity / C
ounts
Per
Second
Binding Energy / eV
CAPP + CaCl2 30m
CAPP + CaCl2 5h
CAPP + CaCl2 12h
Figure 4.4.6 - High resolution, background-subtracted XPS spectrum of the region containing the magnesium 1s peak. Spectra shown are summations of the deconvoluted spectra.
Figure 4.4.6 shows the XPS spectra for the phosphorus 2p peak. A single binding state was
observed throughout the exposure period, with the P 2p 3/2 peak presiding at a binding
energy of 133.3 eV. Following quantification calculations, it can be seen that whilst the
intensities at first glance appear inconsistent, the concentration of phosphorus detected on
the surface increases from around 18 at% to 22 at% throughout the observation period.
Effect of Magnesium
Strontium Aluminium Polyphosphate
A representative example survey spectra is shown in Figure 4.4.7, highlighting major elements
detected on the surface – magnesium, oxygen, phosphorus, and carbon.

191
020040060080010001200
0
25000
50000
75000
100000
125000
P 2pCl 2p
C 1s
O 1s
Fe 2p
Na 1s
Zn 2p
Mg 1s
Inte
nsity /
Cou
nts
Pe
r S
eco
nd
Binding Energy / eV
SRPP + MgCl2 12h
Ca 2p
Figure 4.4.7 - An example wide scan XPS spectrum for a steel surface cathodically polarised and exposed to a sodium chloride solution containing SAPP and magnesium chloride.
The overall quality of deposition in this system is suggested to be poor. Iron detected in the
XPS spectra for these systems is assumed to be from the substrate surface, and a strong iron
peak is observed across all exposure times tested for this particular environment.

192
13001302130413061308
-500
0
500
1000
1500
2000
2500
3000
3500
4000
4500
5000
5500
6000
6500
7000
7500
8000
Inte
nsity / C
ounts
Per
Se
cond
Binding Energy / eV
SRPP + MgCl2 30m
SRPP + MgCl2 5h
SRPP + MgCl2 12h
Figure 4.4.8 - High resolution, background-subtracted XPS spectrum of the region containing the magnesium 1s peak. The spectra displayed in this figure are as obtained without additional processing.
Figure 4.4.8 shows the XPS spectra for the magnesium 1s peak. The peak has a single binding
state across all measured exposure times at approximately 1303.6 eV. This peak appears to
increase consistently across the exposure times, suggesting an uptake of magnesium on the
substrate surface.

193
130132134136
0
500
1000
1500
2000
2500
3000
3500
Inte
nsity /
Cou
nts
Pe
r S
eco
nd
Binding Energy / eV
SRPP + MgCl2 30m
SRPP + MgCl2 5h
SRPP + MgCl2 12h
Figure 4.4.9 - High resolution, background-subtracted XPS spectrum of the region containing the phosphorus 2p peak. The spectra displayed in this figure are as obtained without additional processing.
Figure 4.4.9 shows the XPS spectra for the phosphorus 2p peak. There are two observed
binding energies for this peak over the observation period, with the 2p 3/2 peak situated at
133.1 eV and 135.1 eV. A clear trend for the area ratio between the phosphorus bound in
these states is not apparent, with the ratio proceeding from 6:1, to 11:1 and finalising at 4:1 at
the longest exposure time. There is, however, a clear increase in the observed concentration
from the shortest to the longest exposure times observed.
Within this set of experiments, a large calcium impurity was observed. It is suspected that this
may have been an inherent impurity within the magnesium chloride that was used. It is noted
that this impurity was most prominent on the 30 minute sample. Therefore, it is possible that
this accounts for the secondary binding state and overall movement of the binding energy.

194
Calcium Aluminium Polyphosphate
A representative example survey spectra is shown in Figure 4.4.10, highlighting major
elements detected on the surface – magnesium, oxygen, phosphorus, calcium and carbon.
020040060080010001200
0
20000
40000
60000
80000
100000
O KLL
Mg 1s
P 2s
P 2p
Ca 2s
Ca 2p
C 1s
Inte
nsity /
Cou
nts
Pe
r S
eco
nd
Binding Energy / eV
CAPP + MgCl2 12h
O 1s
Figure 4.4.10 - An example wide scan XPS spectrum for a steel surface cathodically polarised and exposed to a sodium chloride solution containing CAPP and magnesium chloride.
The presence of iron within the spectra is used to determine the depth and surface coverage
of the deposited layer. In this case, iron was observed on the short exposure time sample only.
For this system, high resolution spectra were obtained for the regions containing magnesium,
calcium and phosphorus peaks to determine the nature of the deposited layer.

195
13001302130413061308
0
1000
2000
Inte
nsity /
Cou
nts
Pe
r S
eco
nd
Binding Energy / eV
CAPP + MgCl2 30m
CAPP + MgCl2 5h
CAPP + MgCl2 12h
Figure 4.4.11 - High resolution, background-subtracted XPS spectrum of the region containing the magnesium 1s peak. Spectra shown are summations of the deconvoluted spectra.
Figure 4.4.11 shows the magnesium 1s peak at the selected observation times. This peak
exhibits a singular binding state, which shifts to higher binding energies between the early and
mid-length exposure times. This suggests molecular bonding with an electronegative species,
potentially greater phosphate character. At this point, the level of magnesium detected at the
surface can be considered to be approximately consistent throughout the remainder of
exposure.

196
344346348350352354
0
2000
4000
6000
8000
10000
12000
14000
16000
18000
20000
22000
24000
26000
28000
Inte
nsity /
Cou
nts
Pe
r S
eco
nd
Binding Energy / eV
CAPP + MgCl2 30m
CAPP + MgCl2 5h
CAPP + MgCl2 12h
Figure 4.4.12 - High resolution, background-subtracted XPS spectrum of the region containing the calcium 2p peak. Spectra shown are summations of the deconvoluted spectra.
Figure 4.4.12 shows the high resolution spectra for the calcium 2p peak. The calcium peak
contains a singular binding state at approximately 347.4 eV and is relatively consistent at this
value throughout the test. With regards to the concentration levels of calcium on the surface,
the profile follows similar to that of the magnesium peak.

197
130132134136138
0
2000
4000
6000
8000
10000
Inte
nsity / C
ounts
Per
Second
Binding Energy / eV
CAPP + MgCl2 30m
CAPP + MgCl2 5h
CAPP + MgCl2 12h
Figure 4.4.13 - High resolution, background-subtracted XPS spectrum of the region containing the phosphorus 2p peak. Spectra shown are summations of the deconvoluted spectra.
Figure 4.4.13 shows the high resolution spectra for the phosphorus 2p peak. The phosphorus
peak also exhibits a singular binding state that can be considered to be situated at a consistent
binding energy of 133.4 eV, within experimental error. This peak also follows the same trends
with regards to concentration levels as the other elements mentioned within this sample
environment.
Effect of Aluminium
Strontium Aluminium Polyphosphate
A representative example survey spectra is shown in Figure 4.4.14, highlighting major
elements detected on the surface – zinc, oxygen, phosphorus and carbon.
198
020040060080010001200
0
50000
100000
150000
Fe 2p
P 2p
O 1s
C 1s
Inte
nsity /
Cou
nts
Pe
r S
eco
nd
s
Binding Energy / eV
SRPP + AlCl3 12h
Fe 3s
Zn 2p
Figure 4.4.14 - An example wide scan XPS spectrum for a steel surface cathodically polarised and exposed to a sodium chloride solution containing SAPP and both aluminium chloride.
The presence of iron within the spectra is used to determine the depth and surface coverage
of the deposited layer. In this case, iron was observed on all measured spectra. This suggests
poor surface coverage of phosphate in this system. For this system, high resolution spectra of
the phosphorus 2p area, including the zinc 3s area, was followed to determine the quality and
composition of surface deposits.

199
130132134136138140142144
0
200
400
600
800
1000
Inte
nsity /
Cou
nts
Pe
r S
eco
nd
Binding Energy / eV
SRPP + AlCl3 30m
SRPP + AlCl3 5h
SRPP + AlCl3 12h
Figure 4.4.15 - High resolution, background-subtracted XPS spectrum of the region containing the phosphorus 2p and zinc 3s peaks. Spectra shown are summations of the deconvoluted spectra.
Figure 4.4.15 shows the high resolution spectra containing the phosphorus 2p and zinc 3s
peaks. Both show singular binding states, with the phosphorus peak situated at around
133.5eV and the zinc peak situated at around 140.1 eV. It can be considered that, with regards
to the levels of phosphate, an initial deposition may be present that is unaffected within mid-
term exposure times. A small increase is evident for the longest exposure time.
The levels of zinc on the surface appears to show no logical progression throughout the test,
with the measured concentrations initially dropping from 5.1 at% to 1.7 at% and then raising
to 7.2 at% in the longest exposure time. This observation could suggest that there is an
inconsistent surface deposition and the 5 hour exposure sample spectra obtain positions have
taken place on areas of poor surface coverage.

200
One other possible explanation can be suggested from the presence of aluminium on the
surface, at 3.1 at% for the 5 hour exposure compared to 1.7 at% for the 12 hour exposure and
none noted at 30 minutes. In this case, it could be considered that whilst the presence of
aluminium appears to aid the deposition of phosphate overall compared to the no additives
strontium aluminium polyphosphate, there is a competitive nature between aluminium and
zinc based surface deposits.
Calcium Aluminium Polyphosphate
A representative example survey spectra is shown in Figure 4.4.16, highlighting major
elements detected on the surface – oxygen, phosphorus, calcium and carbon.
020040060080010001200
0
20000
40000
60000
80000
100000
P 2s
P 2p
C 1s
Ca 2p
Ca 2s
O KLL
Fe 2p
O 1s
Inte
nsity /
Cou
nts
Pe
r S
eco
nd
Binding Energy / eV
CAPP + AlCl3 12h
Na 1s
Figure 4.4.16 - An example wide scan XPS spectrum for a steel surface cathodically polarised and exposed to a sodium chloride solution containing CAPP and both aluminium chloride.
.

201
The presence of iron within the spectra is used to determine the depth and surface coverage
of the deposited layer. In this case, iron was observed on all measured spectra, albeit at low
levels for the longest exposure time. This suggests poor, or slow, surface coverage of surface
deposits in this system. For this system, the major components followed in high resolution
were calcium and phosphorus.
344346348350352354
0
2000
4000
6000
8000
10000
12000
14000
16000
18000
20000
22000
24000
26000
28000
30000
Inte
nsity /
Cou
nts
Pe
r S
eco
nd
Binding Energy / eV
CAPP + AlCl3 30m
CAPP + AlCl3 5h
CAPP + AlCl3 12h
Figure 4.4.17 - High resolution, background-subtracted XPS spectrum of the region containing the calcium 2p peak. Spectra shown are summations of the deconvoluted spectra.
Figure 4.4.17 shows the high resolution spectra for the region containing the calcium 2p peak.
The calcium peak exhibits a singular binding state, in which the 2p 3/2 peak has a binding
energy of approximately 347.3 eV, which remains consistent within experimental error
throughout the exposure period. With regards to the measured concentration of calcium at
the surface, it can be see that there is some inconsistency, however, it can be suggested that
there are significant increases from the initial measurement. This observation can be

202
considered to be somewhat consistent with expectations arising from the analysis of the
presence of iron.
130132134136
0
1000
2000
3000
4000
5000
6000
7000
8000
9000
Inte
nsity /
Cou
nts
Pe
r S
eco
nd
Binding Energy / eV
CAPP + AlCl3 30m
CAPP + AlCl3 5h
CAPP + AlCl3 12h
Figure 4.4.18 - High resolution, background-subtracted XPS spectrum of the region containing the phosphorus 2p peak. Spectra shown are summations of the deconvoluted spectra.
Figure 4.4.18 shows the high resolution spectra for the region containing the phosphorus 2p
peak. The phosphorus peak contains a singular binding state in which the binding energy is
consistent between exposure times, with the binding energy of the 2p 3/2 peak situated at
approximately 133.1 eV, suggesting a metallic phosphate.
Similarly to the observations on the calcium peak, the phosphorus peak is again inconsistent
with the calculated concentrations or peak areas. This result may be consistent with a
relatively heterogeneous surface which could lead to discrepancy within the results.

203
Effect of Calcium and Zinc Combination
Strontium Aluminium Polyphosphate
A representative example survey spectra is shown in Figure 4.4.19, highlighting major
elements detected on the surface – zinc, oxygen, phosphorus, calcium and carbon.
020040060080010001200
0
50000
100000
150000
P 2p
C 1s
Ca 2p
Zn LMM
O 1s
Na 1s
Zn 2p
Inte
nsity / C
ounts
Per
Seconds
Binding Energy / eV
SRPP + CaCl2 + ZnCl
2 12h
Fe 2p
Figure 4.4.19 - An example wide scan XPS spectrum for a steel surface cathodically polarised and exposed to a sodium chloride solution containing SAPP and both calcium chloride and zinc chloride at 1mM concentration.
The presence of iron within the spectra is used to determine the depth and surface coverage
of the deposited layer. In this case, iron was observed on all measured spectra. This suggests
poor coverage of surface deposits in this system.

204
1019102010211022102310241025
0
5000
10000
15000
20000
25000
30000
35000
40000
Inte
nsity /
Cou
nts
Pe
r S
eco
nd
Binding Energy / eV
SRPP + CaCl2 + ZnCl
2 30m
SRPP + CaCl2 + ZnCl
2 5h
SRPP + CaCl2 + ZnCl
2 12h
Figure 4.4.20 - High resolution, background-subtracted XPS spectrum of the region containing the zinc 2p (3/2) peak. Spectra shown are summations of the deconvoluted spectra.
Figure 4.4.20 displays a high resolution XPS spectra for the region containing the zinc 2p 3/2
peak. It can be seen that this peak displayed a singular binding state, which has a binding
energy situated at around 1021.7 eV, with a small trend towards higher binding energies
following longer exposure times. A consistent increase in the levels of zinc present on the
surface is seen throughout the testing period.

205
346348350352
0
200
400
600
800
1000
1200
1400
1600
1800
2000
2200
2400
2600
2800
Inte
nsity / C
ounts
Per
Second
Binding Energy / eV
SRPP + CaCl2 + ZnCl
2 30m
SRPP + CaCl2 + ZnCl
2 5h
SRPP + CaCl2 + ZnCl
2 12h
Figure 4.4.21 - High resolution, background-subtracted XPS spectrum of the region containing the calcium 2p peak. The spectra displayed in this figure are as obtained.
Figure 4.4.21 displays a high resolution XPS spectra for the region containing the calcium 2p
peak. Component analysis suggested that calcium exhibited a singular binding state, with the
2p 3/2 peak being situated at a binding energy of approximately 374.5 eV. Similarly to the
trend observed with zinc, the levels of calcium on the surface are seen to increase consistently
across the observation period, albeit at relatively low intensities.

206
130132134136
0
200
400
600
800
1000
1200
1400
1600
1800
2000
Inte
nsity /
Cou
nts
Pe
r S
eco
nd
s
Binding Energy / eV
SRPP + CaCl2 + ZnCl
2 30m
SRPP + CaCl2 + ZnCl
2 5h
SRPP + CaCl2 + ZnCl
2 12h
Figure 4.4.22 - High resolution, background-subtracted XPS spectrum of the region containing the phosphorus 2p peak. Spectra shown are summations of the deconvoluted spectra.
Figure 4.4.22 shows a high resolution spectra for the region containing the phosphorus 2p
peak. With component fitting, two binding states are evident, with the 2p 3/2 peaks of these
components situated at approximate binding energies of 133.1 eV and 135.1 eV. The possible
sources of these multiple binding states will be discussed in detail later. The area ratios for
these two binding energies vary throughout the measurements, with 5 hours exposure
showing a large ratio difference of approximately 16:1, whereas the 12 hour exposure sample
exhibits a smaller ratio of approximately 12:1. However, one distinction within this system can
be suggested, with the concentration of phosphate at the surface clearly increasing over the
observation period.

207
Calcium Aluminium Polyphosphate
A representative example survey spectra is shown in Figure 4.4.23, highlighting major
elements detected on the surface – zinc, oxygen, phosphorus, calcium and carbon.
020040060080010001200
0
20000
40000
60000
80000
100000
120000
140000
160000
180000
200000
220000
Zn 3pP 2p
C 1s
Ca 2p
O 1s
Na 1s
Inte
nsity / C
ounts
Per
Second
Binding Energy / eV
CAPP + CaCl2 + ZnCl
2 12h
Zn 2p
Figure 4.4.23 - An example wide scan XPS spectrum for a steel surface cathodically polarised and exposed to a sodium chloride solution containing CAPP and both calcium chloride and zinc chloride at 1 mM concentration.
The presence of iron within the spectra is used to determine the depth and surface coverage
of the deposited layer. In this case, iron was observed at only low concentrations in the earliest
spectra. This suggests that this system has a mechanism of surface deposition which has a
quick mode of action. High resolution spectra of areas containing calcium and phosphorus are
were taken to determine the properties of the surface deposits in this system.

208
10181020102210241026
0
10000
20000
30000
40000
50000
60000
70000
80000
90000
Inte
nsity /
Cou
nts
Pe
r S
eco
nd
Binding Energy / eV
CAPP + CaCl2 + ZnCl
2 30m
CAPP + CaCl2 + ZnCl
2 12h
Figure 4.4.24 - High resolution, background-subtracted XPS spectrum of the region containing the zinc 2p 3/2 peak. Spectra shown are summations of the deconvoluted spectra.
Figure 4.4.24 shows the high resolution spectra showing the zinc 2p 3/2 peak. This shows a
singular binding state which shifts to higher binding energy over time, from 1021.8 eV to
1022.4 eV, suggesting a greater degree of phosphate binding to the zinc in this case.

209
346348350352354
0
500
1000
1500
2000
2500
3000
Inte
nsity /
Cou
nts
Pe
r S
eco
nd
Binding Energy / eV
CAPP + CaCl2 + ZnCl
2 30m
CAPP + CaCl2 + ZnCl
2 12h
Figure 4.4.25 - High resolution, background-subtracted XPS spectrum of the region containing the calcium 2p peak. The spectra displayed in this figure are as obtained without additional processing.
Figure 4.4.25 shows the high resolution spectra for the area containing the calcium 2p peak. A
singular binding state was determined to be present follow component analysis, with the 2p
3/2 peak situated at approximately 347.5 eV binding energy, which moves to a higher binding
energy of 348.0 eV upon completion of the test. The overall concentration of calcium seen
within the sample remains approximately the same throughout the test (3 at%).

210
130132134136
0
2000
4000
6000
8000
10000
Inte
nsity /
Cou
nts
Pe
r S
eco
nd
Binding Energy / eV
CAPP + CaCl2 + ZnCl
2 30m
CAPP + CaCl2 + ZnCl
2 12h
Figure 4.4.26 - High resolution, background-subtracted XPS spectrum of the region containing the phosphorus 2p peak. Spectra shown are summations of the deconvoluted spectra.
Figure 4.4.26 shows the high resolution spectra for the area containing the phosphorus 2p
peak. Component fitting of the peak determined that there was a singular binding state
present, with the 2p 3/2 peak being situated at approximately 133.4 eV, with this value shifting
to 133.9 eV throughout the test, suggesting a change in the overall chemistry of the deposited
layer. The calculated concentration of phosphorus at the surface is seen to increase from
approximately 4 at% at earliest times to 17 at% at the final exposure time. This is comparable
to that seen with CAPP with no additional ionic species present, and therefore it can be
suggested that with CAPP the 1 mM addition of both calcium and zinc chlorides does not result
in the same behaviour that is seen with 2 mM of either.

211
4.4.4 Effect of Zinc Ion Concentration
One additional effect which was looked at in this set of experiments was the effect of the
secondary ion concentration on phosphate deposition. In experiments shown in the previous
chapter, the addition of 2 mM of zinc chloride was shown to improve the extent of surface
deposition significantly in the case of the strontium aluminium polyphosphate inhibitor
pigment. Therefore, a number of different concentrations of zinc chloride addition were
looked at to investigate whether the addition of further zinc ions would result in further
improvements to the surface deposition, and if lower concentrations of zinc addition could
produce similar results.
Figure 4.4.27, Figure 4.4.28, Figure 4.4.29 and Figure 4.4.30 show the XPS spectrum region for
the phosphorus 2p and zinc 3s peaks for the environments containing 0.1 mM, 0.5 mM, 1 mM
and 4 mM respectively.
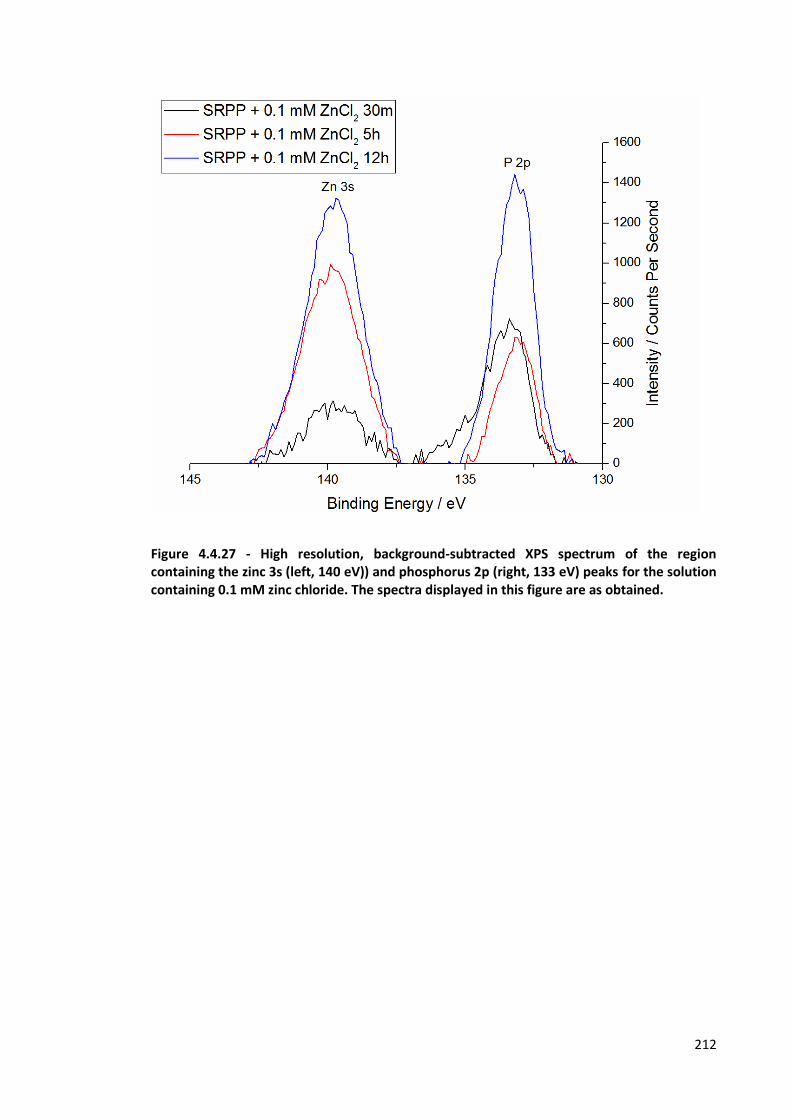
212
Figure 4.4.27 - High resolution, background-subtracted XPS spectrum of the region containing the zinc 3s (left, 140 eV)) and phosphorus 2p (right, 133 eV) peaks for the solution containing 0.1 mM zinc chloride. The spectra displayed in this figure are as obtained.

213
Figure 4.4.28 - High resolution, background-subtracted XPS spectrum of the region containing the zinc 3s (left, 140 eV)) and phosphorus 2p (right, 133 eV) peaks for the solution containing 0.5 mM zinc chloride. The spectra displayed in this figure are as obtained

214
Figure 4.4.29 - High resolution, background-subtracted XPS spectrum of the region containing the zinc 3s (left, 140 eV)) and phosphorus 2p (right, 133 eV) peaks for the solution containing 1 mM zinc chloride. The spectra displayed in this figure are as obtained.

215
Figure 4.4.30 - High resolution, background-subtracted XPS spectrum of the region containing the zinc 3s (left, 140 eV)) and phosphorus 2p (right, 133-134 eV) peaks for the solution containing 4 mM zinc chloride. The spectra displayed in this figure are as obtained.

216
Figure 4.4.31 - High resolution, background-subtracted XPS spectrum of the region containing the zinc 3s (left, 140 eV)) and phosphorus 2p (right, 133 eV) peaks, showing a comparison of the 12 hour exposure times for each of the zinc concentrations measured. The spectra displayed in this figure are
Figure 4.4.31 shows the comparison of the zinc 3s and phosphorus 2p peaks for the different
concentrations observed in this study following 12 hours exposure. Both zinc and phosphorus
show singular binding states across all measured concentrations, which are slightly shifted to
higher binding energies for the highest concentration of zinc chloride The concentration of zinc
is seen to increase consistently with greater concentrations of added zinc chloride. However,
the same does not apply to the phosphorus concentration, which is seen to drop from 5.3 at%
for the 0.1 mM zinc chloride addition down to 0.9 at% for the 1 mM zinc chloride addition. This
will be discussed in more detail in the next section.

217
4.4.5 Discussion
Initial Observations
The effects of the metal cationic species magnesium, calcium and aluminium, alongside a
combination of zinc and calcium cations, introduces as concentrations of the relevant metal
chloride on the surface deposits of strontium aluminium polyphosphate and calcium
aluminium polyphosphate were determined using XPS.
In the case of the addition of magnesium, there were distinct differences present between the
two polyphosphate inhibitor pigments. In the case of strontium aluminium polyphosphate, the
quality of the surface phosphate deposits can be considered to be fairly poor. The presence of
the Fe 2p peak was clearly observable throughout the tests, which for these experiments is an
indication that the incident x-ray beam is able to penetrate through the deposit down to the
underlying substrate. It is possible that this is a thin but well protecting layer. However, this is
unlikely to be the case if taking into consideration the properties of the phosphate layers
deposited in the initial SAPP study and the corresponding electrochemical impedance.
Whilst the addition of magnesium cations to strontium aluminium polyphosphate containing
solutions appears to make no significant improvements to the rate or overall quality of surface
deposition, the effect of magnesium on calcium aluminium polyphosphate is minimal. Calcium
aluminium polyphosphate can be considered to be fairly effective without the addition of
additional cationic species, and in this case the addition of magnesium appears to make little
difference to the overall composition or rate of deposition compared to that of the magnesium
free sample shown in the previous chapter.
With the calcium aluminium polyphosphate pigment, the addition of calcium chloride exhibits
an acceleration in deposition kinetics, with phosphorus content after 12 hours being similar to
that of what is seen without additions (as shown in the previous chapter). However, after 30
218
minutes exposure, the spectra for samples exposed to this environment are also exhibiting
deposition at similar levels (18 at% phosphorus vs. approximately 20 at% after 12 hours
exposure).
The addition of additional calcium cations to the inhibitor solutions appears to also have a
positive effect on the deposition of the SAPP pigment exposed sample, with a notable increase
in the phosphorus content at the surface and a suppression of the metallic iron peaks within
the spectra. This suggests a thicker phosphate deposition on the surface. However, it is also
worth noting that the phosphorus 2p peak also displays peak multiplicity, which suggests that
there are two phosphorus binding states, likely arising from the presence of both calcium and
zinc within the deposition structure. The presence of zinc within the spectra is noted, and that
is most likely due to the previously mentioned zinc impurities that are within the SAPP
inhibitor pigment.
The addition of lower levels of both calcium and zinc chlorides to the SAPP pigment shows the
same peak duplicity within the spectra. There are suggestions within the literature that a
mixture of zinc and calcium cations with a phosphate deposition system will result in a more
effective and more compact film production[7]. This will be discussed in more detail later in
the following section.
SAPP Peak Multiplicity
SAPP shows phosphate peak multiplicity (i.e. more than one P 2p 3/2 peak present) in all
solutions besides those containing just zinc chloride as the solution dopant, at binding energies
of approximately 133.3 eV, consistent with metallic phosphate, and 135.1 eV. One explanation
for this observation would be that the presence of a secondary metallic cation that is active
within the mechanism of deposition, as it has been previously reported that strontium shows
no significant inhibitive actions[8]. It has been previously mentioned that zinc is observed

219
within the SAPP pigment and thus can be considered to not be a “secondary metallic cation” in
this case.
However, with this explanation, it would have been expected that phosphate peak multiplicity
would have been observed in the calcium aluminium polyphosphate and magnesium
aluminium polyphosphate. This is not the case, with neither exhibiting multiple binding states
in the phosphorus peak in the previous study with zinc chloride. Additionally, in the present
study, none of the cationic additions to calcium aluminium polyphosphate result in the
presence of further binding states.
This means that alternative explanations have to be sought. One potential alternative theory is
that the structure of strontium aluminium polyphosphate is different to that of the other two
polyphosphate inhibitors, potentially due to the higher solubility of strontium, which facilitates
a secondary binding state when alternative cationic species, such as zinc or calcium, are
present.
Another theory is that the initially presented hypothesis is correct, however, the overall
stability of the calcium and magnesium complexes with polyphosphates is of a magnitude that
is sufficiently greater than that of zinc, resulting in an inability for zinc to displace either
calcium or magnesium in this case. In the case of strontium aluminium polyphosphate, the zinc
content of the pigment itself is sufficient to initially form the zinc phosphate.
Chemical formula of aluminium polyphosphate is suspected to be Al5(P3O10)3. A source in the
literature[9] suggests that in the case of sodium polyphosphate (Na(PO3)x) that the presence of
calcium facilitates the conversion of the polyphosphate to calcium orthophosphate, Ca3(PO4)2.
This opens up another possible explanation for the behaviour seen on the strontium
aluminium polyphosphate inhibitors.

220
The primary phosphorus binding states for the P 2p 3/2 peak are situated at around 133.3 eV
binding energy. This is consistent with metallic phosphate XPS peak values. Examples are
available in the literature for both calcium orthophosphate[10] and zinc orthophosphate[11].
No literature values regarding a magnesium orthophosphate or other likely compositions
containing magnesium and phosphorus were available at the time of writing.
With the secondary binding state for this peak having a binding energy at approximately 135.1
eV, this suggests that the strength of attraction of the internal electrons to the phosphorus
nucleus has increased. This would be consistent with the reduction in the ratio of oxygen to
phosphorus in the molecule. High binding energies for phosphorus compounds in the literature
that are somewhat likely to be similar in composition to realistic deposits from the available
solution could be considered to be a polyphosphate[12] that either contains, or is stabilised by,
the presence of zinc. It is possible that the polyphosphate component of strontium aluminium
polyphosphate is more stable than that seen in calcium aluminium polyphosphate or
magnesium aluminium polyphosphate, and thus the secondary binding state can be in this
case considered to be a polyphosphate.
For any of these cases, literature on the composition of deposited layers is scarce, and thus
most of the assumptions made previously rely on literature values from materials that can be
considered significantly different to that which would be situated on the steel surfaces
measured.
Effect of Zinc Chloride concentration
The study in the previous chapter showed that doping an SAPP saturated solution with zinc
chloride, providing a nominal zinc concentration within the solution of 2 mM, was sufficient to
improve the surface phosphate deposition on the cathodically polarised steel surface. This
study was designed to determine a few parameters. Firstly, the minimum concentration of

221
additional zinc required, above that which is provided by the SAPP pigment, for notable
improvements in phosphate deposition compared to blank solutions. The second is to
determine whether an increase in the level of zinc above the 2mM level from the previous
study provides further improvements in phosphate deposition.
Results suggest that the presence of zinc ions in solution at concentrations of 1 mM appear to
have little effect on the phosphate deposition with SAPP, with an overall deposition of 0.9 at%
measured in this case. From the results, it would appear that there is some argument to
suggest that there is some correlation to suggest that the effectiveness of the phosphate
deposition improves with lower zinc content below the 1 mM level, with a phosphate
concentration observed of approximately 5 at% with 0.1 mM zinc chloride added.
Despite this, there is a strong argument to make the suggestion that the minimum
concentration of zinc ions required in solution for efficient polyphosphate inhibition by
strontium aluminium polyphosphate can be determined to be at a value between 1 mM and 2
mM. Indeed, the chemical nature of the phosphorus peak can be suggested to change
significantly with a binding energy shift detected from approximately 133.0 mV for lower zinc
content samples to approximately 134.0 mV for samples containing 2 mM or more zinc
chloride. Potential future experimentation may be able to more accurately define the required
zinc level for effective phosphate deposition.
For the sample that was prepared at 4 mM concentration of zinc chloride, the suggestion from
the results is that the increase in zinc concentration in solution does improve the ability for the
polyphosphate inhibitor to deposit on the steel surface, compared to the result obtained for
the 2 mM concentration that was given in the previous chapter section.
With this preliminary study showing further increases are possible with greater addition of zinc
beyond the initially selected 2 mM level, one worthwhile future study may look at the impact

222
of further increases in the zinc content of the solution. This could then be expanded to
determine at what point increased zinc loading becomes less effective for improved
phosphorus deposition.
4.4.6 Conclusions
In this section, the effects of the addition of several different cationic species on the surface
deposits on cathodically polarised steel were analysed through the use of x-ray photoelectron
spectroscopy. Additionally, the effect of the concentration of metal chlorides was also studied
by varying the amount of zinc chloride present in solutions containing strontium aluminium
polyphosphate inhibitor pigment. Despite the absence of some results, due to either machine
malfunction or restricted machine time, several tentative conclusions can still be made with
the reported results:
The addition of metallic cationic species into solution can be seen, in some cases, to
improve phosphate deposition on the cathodic steel surface.
o The addition of calcium chloride shows a large increase in the presence of
phosphorus (to approximately 45 at%) for SAPP, and an acceleration when
added to CAPP (phosphorus at approximately 18 at% following 30 minutes
exposure).
o The addition of magnesium chloride shows similar phosphate deposition
kinetics to the same concentration addition of zinc chloride, albeit slower at
earlier exposure times for SAPP (4.4 at% at 30 minutes to 13.6 at% at 12 hours
exposure, compared to 9 at% and 13.6 at% for zinc chloride), and a similar
acceleration effect as seen with zinc chloride on CAPP.
The extent of the improvement appears to be dependent both on the particular
metallic species and initial inhibitor pigment used.
o The acceleration effect shown on CAPP pigment by zinc chloride is also
displayed with aluminium chloride. However, the effect of aluminium chloride

223
on SAPP is less evident (surface phosphorus concentration of 3.5 at% following
12 hours exposure).
Strontium aluminium polyphosphate is the only inhibitor pigment which exhibits
multiple phosphorus binding states, but insufficient evidence is currently presented to
determine the reasoning behind this observation beyond doubt.
o It has been suggested that the structure or chemical composition of the
strontium aluminium polyphosphate pigment differs sufficiently from that of
calcium aluminium polyphosphate or magnesium aluminium polyphosphate to
allow stabilisation of a polyphosphate component as a surface deposit.
The minimum concentration of zinc ions required for a notable improvement in the
rate and concentration of phosphorus deposited at the surface appears to be between
1 and 2 mM.
o It is suspected that this will likely be closer to 2 mM as a concentration of 1
mM zinc chloride appeared to be ineffective in producing phosphate
deposition.
o However, there is also an apparent improving of deposition when reducing the
level of zinc chloride from 1 mM (0.9 at% surface phosphorus) down to 0.1
mM (5.3 at% surface phosphorus), suggesting there may be an inhibition
improvement curve that has a minima around 1 mM zinc chloride.
The addition of further zinc chloride beyond the 2 mM level appears to have little-to-
no beneficial effect to the phosphate deposition.

224
Chapter Summary and Conclusions 4.5The main points to take away from the results shown in this chapter are as follows:
The addition of dissolved zinc cations was shown to alter the composition and
structure of surface deposits on the steel surface by the strontium aluminium
polyphosphate inhibitor pigment, utilising SEM-EDX and XPS analysis
Surface deposition was not detectable by SEM-EDX for cathodically polarised steel
samples. The detection of phosphorus and other elements related to the inhibitor
pigment at the surface was possible on cathodically polarised samples using XPS
analysis, suggesting that the deposited layer is sub 1 micron in thickness, most likely
on the scale of 10 to 100 nm in thickness.
The presence of strontium on the surface was not detected in any method. This means
that strontium appears to have no influence on the mechanism of inhibition on steel
for the strontium aluminium polyphosphate inhibitor pigment, regardless of potential
shift.
A minima for externally introduced concentrations of zinc ions to make a discernible
difference on the deposition mechanics of the strontium aluminium polyphosphate
inhibitor pigment was determined to be between 1 and 2 mM bulk zinc cation
concentration
o Some evidence was shown for a range of concentrations where the effect of
zinc is substantially reduced, as the 0.1 mM zinc chloride solution showed a
much greater concentration of phosphorus (5.25 at%) than that of either 0.5
mM (2.7 at%) or 1 mM (0.9 at%) during the test period.
The effects of zinc cations on cathodically polarised depositions are less pronounced
for the calcium aluminium polyphosphate inhibitor pigment, where it appears to be
catalytic, and for magnesium aluminium polyphosphate, where there appears to be an
absence of any real effects.

225
Chapter References 4.6
[1] Zin IM, Lyon SB, Hussain A. Prog Org Coatings 2005;52:126.
[2] Brow RK. J Non Cryst Solids 1996;194:267.
[3] Rangel CM, De Damborenea J, De Sá AI, Simplício MH. Br Corros J 1992;27:207.
[4] Zin IM, Lyon SB, Pokhmurskii VI. Corros Sci 2003;45:777.
[5] Zin IM, Lyon SB, Pokhmurskii VI, Simmonds MC. Corros Eng Sci Technol 2004;39:167.
[6] Phuong N Van, Lee K, Chang D, Kim M, Lee S, Moon S. Met Mater Int 2013;19:273.
[7] Zeng R, Lan Z, Kong L, Huang Y, Cui H. Surf Coatings Technol 2011;205:3347.
[8] Baghni I., Lyon S., Ding B. Surf Coatings Technol 2004;185:194.
[9] Koudelka M, Sanchez J, Augustynski J. J Electrochem Soc 1982;129:1186.
[10] Demri B, Muster D. J Mater Process Technol 1995;55:311.
[11] Franke R, Chassé T, Streubel P, Meisel A. J Electron Spectros Relat Phenomena
1991;56:381.
[12] Onyiriuka EC. J Non Cryst Solids 1993;163:268.

226
5 Chapter 5 - Electrochemical Experiments Utilising Segmented
Electrode for Modelling a High Percentage Aluminium Alloyed
Zinc Coated Steel
Chapter 5
Electrochemical Experiments Utilising
Segmented Electrode for Modelling a High
Percentage Aluminium Alloyed Zinc Coated
Steel

227
Introduction 5.1In a previous chapter, the utilisation of segmented electrochemical impedance for looking at
the inhibition of galvanised steel, using a pure steel and zinc model, was explored. The results
obtained showed that the results can be rapidly analysed to quickly understand sites of action
for inhibitor molecules. In addition to this, it was determined that some basic mechanistic
information can be obtained through observation of electrochemical changes that occur upon
changing of experimental parameters.
However, the composition of the sacrificial galvanising layer has been modified and made
increasingly more complex. Common alloying additions include aluminium and magnesium,
meaning that the local chemistries and overall electrochemistry of the coating is changed
significantly. It can be considered, therefore, that the effects of the inhibitor pigments on
these galvanising alloys will be significantly different to that of the simpler steel and zinc
system explored previously.
As such, in this chapter, the potential for utilising modifications to the initial testing of
segmented electrode electrochemical impedance experiments as a method of understanding
inhibition on complex alloys was explored.
A three electrode segmented cell, comprising of zinc, aluminium and mild steel rods arranged
in a circle was devised to best ensure consistent distance between each working electrode and
the reference electrode. The overall system was to be exposed to each of the inhibitor systems
that have been previously used in this body of work in an attempt to understand the influence
of aluminium on the inhibition of the metallic sacrificial protection layer.
Experimental 5.2Experiments concentrated on following the effects of dissolved corrosion inhibitors on the
triple working electrode cell utilising zinc, aluminium and mild steel electrodes. 3 mm diameter
rods of mild steel (0.05% carbon steel), zinc (99.99+% purity zinc) and aluminium (99.95%

228
purity aluminium) were mounted in epoxy resin and ground using incremental grades of silicon
carbide abrasive discs up to and including 1200 grade so as to leave a single flat surface
exposed to the environment.
The mounted metals were then immersed in a 3.5 weight % (approximately 0.6M) sodium
chloride solution containing leached species from an inhibitor pigment. Thus, saturated
solutions of relevant inhibitors were prepared by introducing approximately 2 g of solid into 1
L of electrolyte, and stirred continuously for 24 h. The solution was then filtered to remove any
remaining excess solid from the solution. The following inhibitor pigments and combinations
were utilised in this work, and were added as received:
Strontium Chromate (SrCrO4)
Zinc Molyphosphate (ZMP)
Calcium-exchanged Silica (CES)
Zinc Molyphosphate and Calcium-exchanged Silica Mixture
Strontium Aluminium Polyphosphate Hydrate (SAPP)
Calcium Aluminium Polyphosphate (CAPP)
Magnesium Aluminium Polyphosphate (MAPP)
A five-electrode cell was used and attached to an ACM AC Weld Test instrument, utilising steel,
zinc and aluminium as three working electrodes, a saturated calomel reference electrode and
a platinum counter electrode. The electrode arrangement was as displayed in Figure 5.2.1. The
system was at laboratory temperature (18-21 °C) monitored for 72 h, with electrochemical
impedance measurements taken every 2 h for the duration of the experiment. Impedance
measurements were taken at the measured system coupled corrosion potential in the
frequency range of 10,000 to 0.01 Hz with a signal amplitude of 10 mV.

229
Figure 5.2.1 - Schematic representation of the geometry of the three working electrode setup utilised (1 – steel, 2 – zinc, 3 – aluminium, R – reference)
Following the electrochemical impedance measurements, the samples were then subjected to
potentiodynamic polarisation. The measurement began at a potential cathodic to the overall
system, chosen to be at -1200 mV, and was swept to a potential value of -400 mV, with an
overall sweep rate of 20 mV per minute.
Results 5.3Potentiodynamic Polarisation
Potentiodynamic polarisation curves were obtained for each of the inhibitor systems that were
measured in Chapter 2 for the three electrode set-up following an exposure period of 72
hours. The obtained polarisation curves for each individual component, along with the overall
responses, are presented overlaid for each inhibitor are shown from Figure 5.3.1 through
Figure 5.3.8.

230
-1200 -1000 -800 -600 -400
1E-6
1E-5
1E-4
1E-3
0.01
0.1
1
10
100
|Curr
ent| / m
A c
m-2
Potential / mV
Steel
Zinc
Aluminium
Overall
Figure 5.3.1 - The split cell potentiodynamic polarisation graph for the three electrode system in an uninhibited solution
In Figure 5.3.1, it can be seen that potential of the overall system sits close (within 50 mV) to
the corrosion potential of zinc, suggesting that the overall system is anodically controlled. Both
steel and aluminium are shown to be cathodes in this environment, with the magnitude of
oxygen reduction occurring on the steel being roughly two orders of magnitude more than on
the aluminium. At an approximate potential of -730 mV, aluminium is seen to pit, which is
behaviour not observed on the steel surface.

231
-1200 -1000 -800 -600 -400
1E-6
1E-5
1E-4
1E-3
0.01
0.1
1
10
100
|Curr
ent| / m
A c
m-2
Potential / mV
Steel
Zinc
Aluminium
Overall
Figure 5.3.2 - The split cell potentiodynamic polarisation graph for the three electrode system in a zinc molyphosphate inhibited salt solution
In Figure 5.3.2, it can be seen that potential of the overall system sits close (within 50 mV) to
the corrosion potential of zinc, suggesting that the overall system is anodically controlled. Both
steel and aluminium are shown to be cathodes in this environment, with the magnitude of
oxygen reduction occurring on the steel being roughly one and a half to two orders of
magnitude more than on the aluminium. At an approximate potential of -750 mV, aluminium is
seen to pit, which is behaviour not observed on the steel surface, although some unstable
events do appear to be occurring around that potential range.

232
-1200 -1000 -800 -600 -400
1E-6
1E-5
1E-4
1E-3
0.01
0.1
1
10
100
|Cu
rre
nt| /
mA
cm
-2
Potential / mV
Steel
Zinc
Aluminium
Overall
Figure 5.3.3 - The split cell potentiodynamic polarisation graph for the three electrode system in an calcium exchanged silica inhibited salt solution
In Figure 5.3.3, it can be seen that potential of the overall system sits close (within 50 mV) to
the corrosion potential of zinc, suggesting that the overall system is anodically controlled. Both
steel and aluminium are shown to be cathodes in this environment, with the magnitude of
oxygen reduction occurring on the steel being roughly an order of magnitude more than on
the aluminium. At an approximate potential of -730 mV, aluminium is seen to pit, which is
behaviour not observed on the steel surface.

233
-1200 -1000 -800 -600 -400
1E-6
1E-5
1E-4
1E-3
0.01
0.1
1
10
100
|Cu
rre
nt| /
mA
cm
-2
Potential / mV
Steel
Zinc
Aluminium
Overall
Figure 5.3.4 - The split cell potentiodynamic polarisation graph for the three electrode system in a zinc molyphosphate and calcium exchanged silica mixed inhibitor salt solution
In Figure 5.3.4, it can be seen that potential of the overall system sits close (within 50 mV) to
the corrosion potential of zinc, suggesting that the overall system is anodically controlled. Both
steel and aluminium are shown to be cathodes in this environment, with the magnitude of
oxygen reduction occurring on the steel being roughly two orders of magnitude more than on
the aluminium. Metastable pitting of aluminium is seen to occur at potentials slightly more
positive than the mixed potential. At an approximate potential of -730 mV, aluminium is seen
to begin an unstable pitting process, which is behaviour not observed on the steel surface.

234
-1200 -1000 -800 -600 -400
1E-6
1E-5
1E-4
1E-3
0.01
0.1
1
10
100
1000
|Cu
rre
nt| /
mA
cm
-2
Potential / mV
Steel
Zinc
Aluminium
Overall
Figure 5.3.5 - The split cell potentiodynamic polarisation graph for the three electrode system in a strontium chromate inhibited salt solution
In Figure 5.3.5, it can be seen that potential of the overall system is relatively far positive
(around 150-200 mV) to the corrosion potential of zinc, particularly when compared to the
samples shown so far. This suggests that the overall system is not as strongly anodically
controlled. Indeed, it appears that the mixed potential sits at around the potential in which
aluminium begins metastable pitting (approximately -1000 mV).
In the cathodic environment, aluminium is shown to participate in oxygen reduction
approximately three orders of magnitude less than steel. The steel surface is shown to become
passive until around -500 mV. At an approximate potential of -730 mV, aluminium is seen to
pit, which is behaviour not observed on the steel surface.

235
-1200 -1000 -800 -600 -400
1E-6
1E-5
1E-4
1E-3
0.01
0.1
1
10
100
|Cu
rre
nt| /
mA
cm
-2
Potential / mV
Steel
Zinc
Aluminium
Overall
Figure 5.3.6 - The split cell potentiodynamic polarisation graph for the three electrode system in a strontium aluminium polyphosphate inhibited salt solution
In Figure 5.3.6, it can be seen that potential of the overall system sits close (within 100 mV) to
the corrosion potential of zinc, suggesting that the overall system is anodically controlled. Both
steel and aluminium are shown to be cathodes in this environment, with the magnitude of
oxygen reduction occurring on the steel being roughly two and a half orders of magnitude
more than on the aluminium. Aluminium is shown to passivate at around -950 mV, and is seen
to begin pitting at an approximate potential of -730 mV. No pitting behaviour is observed on
the steel surface.

236
-1200 -1000 -800 -600 -400
1E-6
1E-5
1E-4
1E-3
0.01
0.1
1
10
100
|Curr
ent| / m
A c
m-2
Potential / mV
Steel
Zinc
Aluminium
Overall
Figure 5.3.7 - The split cell potentiodynamic polarisation graph for the three electrode system in a calcium aluminium polyphosphate inhibited salt solution
In Figure 5.3.7, it can be seen that potential of the overall system sits close (within 50 mV) to
the corrosion potential of zinc, suggesting that the overall system is anodically controlled. Both
steel and aluminium are shown to be cathodes in this environment, with the magnitude of
oxygen reduction occurring on the steel being roughly one order of magnitude more than on
the aluminium. At an approximate potential of -730 mV, aluminium is seen to pit. Steel
appears to become passive at a potential around -1000 mV, and this passive layer was not
shown to break down during this test.

237
-1200 -1000 -800 -600 -400
1E-6
1E-5
1E-4
1E-3
0.01
0.1
1
10
100
|Cu
rre
nt| /
mA
cm
-2
Potential / mV
Steel
Zinc
Aluminium
Overall
Figure 5.3.8 - The split cell potentiodynamic polarisation graph for the three electrode system in a magnesium aluminium polyphosphate inhibited salt solution
In Figure 5.3.8, it can be seen that potential of the overall system sits close (within 50 mV) to
the corrosion potential of zinc, suggesting that the overall system is anodically controlled. It is
also seen that the passivity region of aluminium is shown to be shifted to values more negative
than that of the mixed potential, an observation which is unique to this particular inhibitor
system within the current study. However, at an approximate potential of -730 mV, the
passivity breaks down and aluminium is seen to pit, which is behaviour not observed on the
steel surface.

238
-1200 -1000 -800
1E-6
1E-5
1E-4
1E-3
0.01
0.1
1
10
100
|Cu
rrent|
Potential
Uninhibited
SAPP
CAPP
MAPP
SrCrO4
CES
ZMP
Mixture
Figure 5.3.9 - A comparison of the potentiodynamic polarisation measurements for overall system in each of the inhibitor solutions measured
Electrochemical Impedance
All electrochemical impedance plots within this section are taken at the measured mixed
galvanic potential. The potential in which this sits is likely to be cathodic of steel and anodic of
zinc. With regards to aluminium, it is suspected that the potential will be anodic to aluminium
metal, but cathodic to the pitting/passivating potential of aluminium oxide.
Uninhibited System
As in Chapter 2.1, the first experiments undertaken involved obtaining results for the three
electrode cell for an uninhibited system, as this is required for the inhibitor efficiency
calculations. Selected Nyquist plots acquired from these initial experiments are shown in
Figure 5.3.10, Figure 5.3.11 and Figure 5.3.12 for steel, zinc and aluminium respectively. As in
the previous cases, the impedance plots were taken at the measured mixed galvanic potential
of the system.

239
0 500 1000 1500
0
500
1000
1500
Z''
/ O
hm
cm
2
Z' / Ohm cm2
2 h
12 h
24 h
Figure 5.3.10 - Selected Nyquist plots obtained for the steel surface in an uninhibited 0.6M sodium chloride solution for the three electrode system
The impedance appearing on the steel shows a bias towards diffusion based kinetics, with the
Warburg element being a large part of the overall spectrum for each of the shown exposure
times, although the influence is shown to wane in the latter stages of exposure.

240
0 50 100 150
0
10
20
30
40
50
Z''
/ O
hm
cm
2
Z' / Ohm cm2
2 h
12 h
24 h
Figure 5.3.11 - Selected Nyquist plots obtained for the zinc surface in an uninhibited 0.6M sodium chloride solution for the three electrode system
The impedance obtained on the zinc surface shows relatively low impedance, consistent with
the anodic nature of the electrode within this particular arrangement. The depression of the
capacitive semi-circle suggests that the electrode tends toward less ideal behaviour. It is also
suggested that the corrosion rate on the zinc electrode increases with longer exposure times.
0 100000 200000 300000
0
20000
40000
60000
80000
100000
120000
140000
160000
180000
Z''
/ O
hm
cm
2
Z' / Ohm cm2
2 h
12 h
24 h
Figure 5.3.12 - Selected Nyquist plots obtained for the aluminium surface in an uninhibited 0.6M sodium chloride solution for the three electrode system

241
The aluminium surface shows large resistance within the impedance spectra, consistent with
the presence of aluminium oxide on the surface, which becomes more protective at later
timeframes. Whilst the uninhibited system was followed for the full 72 hour observation
period, only results obtained for the initial 2 hour exposure will be used in the inhibitor
efficiency calculations, as per previous chapters.
Strontium Aluminium Polyphosphate
Figure 5.3.13, Figure 5.3.14 and Figure 5.3.15 show selected Nyquist plots obtained on the
steel, zinc and aluminium surfaces respectively for the strontium aluminium polyphosphate
inhibited system.
0 500 1000 1500 2000 2500 3000 3500 4000
0
500
1000
1500
Z''
/ O
hm
cm
2
Z' / Ohm cm2
2 h
12 h
24 h
Figure 5.3.13 - Selected Nyquist plots obtained for the steel surface in a saturated strontium aluminium polyphosphate inhibited 0.6M sodium chloride solution for the three electrode system.
After adding SAPP inhibitor to the environment, the resistance shown is seen to increase
compared to the uninhibited environment. However, it is also worth noting that there is also a
depression of the capacitive semi-circle.

242
0 50 100 150 200
0
20
40
60
Z''
/ O
hm
cm
2
Z' / Ohm cm2
2 h
12 h
24 h
Figure 5.3.14 - Selected Nyquist plots obtained for the zinc surface in a saturated strontium aluminium polyphosphate inhibited 0.6M sodium chloride solution for the three electrode system.
The zinc electrode, when the SAPP pigment is introduced, also shows relatively low resistance,
which reduces over longer exposure times. Inductive loops are also seen to be present on the
low frequencies at earlier exposure times. This is expected to be due to small changes in
corrosion potential.

243
0 10000 20000 30000 40000 50000 60000
0
5000
10000
15000
20000
25000
30000
35000
40000
45000
50000
55000
60000
65000
Z''
/ O
hm
cm
2
Z' / Ohm cm2
2 h
12 h
24 h
Figure 5.3.15 - Selected Nyquist plots obtained for the aluminium surface in a saturated strontium aluminium polyphosphate inhibited 0.6M sodium chloride solution for the three electrode system.
The aluminium surface shows large resistance within the impedance spectra, consistent with
the presence of aluminium oxide on the surface, which becomes more protective at later
timeframes. The inhibitor efficiency of strontium aluminium polyphosphate on the aluminium
surface is calculated to be approximately 66%.
Calcium Aluminium Polyphosphate
Figure 5.3.16, Figure 5.3.17 and Figure 5.3.18 show selected Nyquist plots obtained on the
steel, zinc and aluminium surfaces respectively for the calcium aluminium polyphosphate
inhibited system.

244
0 500 1000 1500 2000
0
200
400
600
800
1000
1200Z
'' / O
hm
cm
2
Z' / Ohm cm2
2h
12h
24h
Figure 5.3.16 - Selected Nyquist plots obtained for the steel surface in a saturated calcium aluminium polyphosphate inhibited 0.6M sodium chloride solution for the three electrode system.
The steel surface when calcium aluminium polyphosphate is added shows an increase in
resistance in the initial stage compared to the uninhibited environment. However, it can also
be seen that the behaviour observed on the steel surface remained consistent throughout the
first 24 hours of exposure.
0 20 40 60 80 100 120 140
0
10
20
30
Z''
/ O
hm
cm
2
Z' / Ohm cm2
2h
12h
24h
Figure 5.3.17 - Selected Nyquist plots obtained for the zinc surface in a saturated calcium aluminium polyphosphate inhibited 0.6M sodium chloride solution for the three electrode system.

245
With calcium aluminium polyphosphate added to the environment, the impedance spectra
obtained exhibit heavily depressed semi-circles. The calculated resistances are larger than that
exhibited by the uninhibited samples, and the resistance is shown to increase over longer
exposure times.
0 5000 10000 15000 20000 25000 30000 35000
0
2000
4000
6000
8000
10000
12000
14000
16000
18000
20000
Z''
/ O
hm
cm
2
Z' / Ohm cm2
2h
12h
24h
Figure 5.3.18 - Selected Nyquist plots obtained for the aluminium surface in a saturated calcium aluminium polyphosphate inhibited 0.6M sodium chloride solution for the three electrode system.
The aluminium impedance with calcium aluminium polyphosphate introduced into the
environment exhibits a small reduction in the polarisation resistance at early exposure times.
This resistance increases on the later exposure times.
Magnesium Aluminium Polyphosphate
Figure 5.3.19, Figure 5.3.20 and Figure 5.3.21 show selected Nyquist plots obtained on the
steel, zinc and aluminium surfaces respectively for the strontium aluminium polyphosphate
inhibited system.

246
0 200 400 600 800
0
100
200
300
Z''
/ O
hm
cm
2
Z' / Ohm cm2
2 h
12 h
24 h
Figure 5.3.19 - Selected Nyquist plots obtained for the steel surface in a saturated magnesium aluminium polyphosphate inhibited 0.6M sodium chloride solution for the three electrode system.
The steel surface when magnesium aluminium polyphosphate is added shows an increase in
resistance in the initial stage compared to the uninhibited environment. However, it can also
be seen that the behaviour observed on the steel surface remained approximately consistent
throughout the first 24 hours of exposure.

247
0 50 100 150
0
20
40
60
80
Z''
/ O
hm
cm
2
Z' / Ohm cm2
2 h
12 h
24 h
Figure 5.3.20 - Selected Nyquist plots obtained for the zinc surface in a saturated magnesium aluminium polyphosphate inhibited 0.6M sodium chloride solution for the three electrode system.
With magnesium aluminium polyphosphate added to the environment, the impedance spectra
obtained exhibit heavily depressed semi-circles. The calculated resistances are lower than that
exhibited by the uninhibited samples, suggesting a negative inhibitor efficiency, which remains
approximately the same throughout the first 24 hours of exposure.

248
0 5000 10000 15000 20000 25000 30000 35000
0
2000
4000
6000
8000
10000
12000
14000
16000
18000
20000
22000
Z''
/ O
hm
cm
2
Z' / Ohm cm2
2 h
12 h
24 h
Figure 5.3.21 - Selected Nyquist plots obtained for the aluminium surface in a magnesium aluminium polyphosphate inhibited salt solution for the three electrode system.
The aluminium impedance with magnesium aluminium polyphosphate introduced into the
environment exhibits a large reduction in the polarisation resistance at early exposure times.
Looking at the potentiodynamic polarisation curve presented earlier, it can be seen that these
are potentially impedance measurements done at an anodic potential as opposed to a
cathodic one. It is also seen that the polarisation resistance of these samples increases with
longer exposure times.
Discussion 5.4Potentiodynamic Polarisation
General Observations
In this set of experiments, an additional experimental step, potentiodynamic polarisation, was
added to take place following the 72 hour exposure period. For the initial analysis of the
potentiodynamic polarisation results, the effects of the inhibitors on the individual metallic
components are taken into consideration.

249
In the case of the steel surfaces, calcium aluminium polyphosphate exhibits the strongest
cathodic inhibition, with a corrosion potential shift from -770 mV for the uninhibited solution
to -900 mV. Cathodic inhibition is also clearly exhibited, to lesser extents, by strontium
chromate, MAPP and the CES/ZMP mixture. Across the potential range, there are no notable
changes in the measured currents, except for the calcium aluminium polyphosphate inhibitor
pigment, which demonstrates a notable drop in measured current across the entire range of
potentials. It is also worth noting that anodic areas with reduced rates of current increase are
present for the CAPP, MAPP and strontium chromate inhibitors, suggesting areas approaching
low levels of passivity.
For the zinc surface, strontium chromate shows an extended period of low corrosion current
increase. It can be suggested that this represents efficacious anodic inhibition of the zinc
surface, as opposed to an area of true passivity. Calcium aluminium polyphosphate also
exhibits a reduction for the currents exhibited on the cathodic and anodic branches of the
potentiodynamic polarisation curve by approximately one decade, similar in magnitude to that
seen by strontium chromate, but with a corrosion potential that is not shifted to as negative
values. For the remaining inhibitor systems, there are general negative shifts in the measured
corrosion potential, but the magnitude of the cathodic and anodic branch currents are shown
to be fairly similar to that of the uninhibited sample.
For the aluminium surface, a clear corrosion potential, through the presence of Tafel
behaviour, is not evident in the case of the uninhibited system, as well as systems inhibited by
ZMP and CES. These appear to exhibit similar behaviours with a sharp current increase evident
at approximately -730 mV. This has been previously reported as the upper limit for the
corrosion potential for pure aluminium[8]. This behaviour suggests that ZMP and CES have no
effect on the corrosion behaviour of the aluminium component of this system.

250
In the case of the other inhibitors, the interpretation of their inhibitive behaviour requires
further analysis of the curve behaviour. In the case of strontium chromate, this appears to
exhibit an extended period of instable passivity in the anodic branch of the potentiodynamic
polarisation curve. It is suggested that this has a physical manifestation through the pitting and
subsequent repassivation of the surface.
However, in all but the calcium aluminium polyphosphate case, a full breakdown and increase
in current is observed at potentials lower than -730 mV, as is seen in the cases of the
uninhibited and poorly inhibited systems.
Calcium aluminium polyphosphate shows interesting behaviour on aluminium. The current
branches seen on the potentiodynamic polarisation curve for the cathodic side can be
considered to be at a relatively expected level, with suppression of the current down to levels
seen for strontium aluminium polyphosphate, but slightly worse than that for strontium
chromate. However, the anodic branch shows significantly modified behaviour to that of the
other systems observed, with currents seen at a magnitude of approximately 1 decade lower
than all other systems measured. As mentioned previously, calcium aluminium polyphosphate
also exhibits a long, stable area of passivity, which only shows slight instabilities at potentials
less negative than -680 mV.
The strontium aluminium polyphosphate inhibited aluminium surface shows similar profile to
that seen by strontium chromate. Comparatively, the open circuit potential is seen to be
shifted to less negative potentials by approximately 50 mV.
Magnesium aluminium polyphosphate is shown to provide the strongest cathodic potential
shift within the inhibitors observed on the aluminium substrate. Strong inhibiting behaviour of
the cathodic reaction on the aluminium surface, which would likely be the oxygen reduction
reaction, could be influential on the production of the protective aluminium oxide. Therefore,

251
this observation may support the theory brought up in the discussion of the electrochemical
impedance results that corrosion acceleration by magnesium aluminium polyphosphate is a
result of the inhibitor interfering with the production of a coherent passivating layer. However,
one consequence of the potential shift on the aluminium surface is that the mixed corrosion
potential of the system in this case results in the aluminium electrode being polarised
anodically. Within the inhibitor systems measured, this situation is unique and results in
distinct behaviour for this pigment.
Analysing the general shapes of the potentiodynamic polarisation comparison for the overall
responses, it can be seen that CAPP has the most significant shift to negative potentials,
indicating strongest inhibition of the cathodic site. Indeed, all polyphosphates observed show a
tendency towards cathodic inhibition. Strontium chromate has the greatest shift to more
positive potentials, indicating strongest inhibition of the anodic sites. What can also be seen is
that the observed current for the CAPP inhibitor are almost a level of magnitude lower than
that of all other systems.
As per previous literature that was utilised in Chapter 2.1 for the inhibitors used for
verification, ZMP displays cathodic inhibition whilst CES, and the inhibitor mixture containing
both ZMP and CES exhibit mixed corrosion inhibition.
Using Tafel interpolation where appropriate, the corrosion potentials and corrosion currents
were obtained for each individual electrode, alongside the overall system. Table 5.4-1 shows
the values obtained.

252
Electrode Steel Zinc Aluminium Full System
Icorr Ecorr Icorr Ecorr Icorr Ecorr Icorr Ecorr
/ mA / mV / mA / mV / mA / mV / mA / mV
UI 4.27E-03 -776 2.20E-02 -1064 N/A N/A 1.66E-01 -1036
ZMP 2.79E-03 -718 1.22E-02 -1133 N/A N/A 2.57E-01 -1083
CES 1.41E-03 -813 8.65E-03 -1080 N/A N/A 8.36E-02 -1049
Mixture 4.20E-03 -845 2.26E-02 -1068 1.11E-03 -1003 1.65E-01 -1035
SAPP 9.95E-03 -752 1.26E-02 -1127 1.40E-04 -945 1.36E-01 -1062
CAPP 3.33E-03 -903 8.48E-04 -1171 1.03E-04 -868 2.35E-02 -1078
MAPP 1.82E-03 -790 2.06E-02 -1114 1.18E-04 -1120 1.93E-01 -1092
Chromate 1.28E-02 -883 8.76E-04 -1168 2.33E-04 -1006 5.88E-02 -972
Table 5.4-1 - A table showing the corrosion potential and corrosion currents calculated through Tafel interpolation of the potentiodynamic polarisation plots obtained. In the case of the uninhibited, zinc molyphosphate and calcium exchanged silica samples, no areas of Tafel behaviour were observed for the aluminium surface as it pits.
In some cases, Tafel interpolation was difficult or impossible as there were no activation state
controlled processes occurring. For spectra obtained on some steel surfaces, the regions
where Tafel behaviour might be expected contain noise. This means that any interpretations of
these particular spectra are likely to be erroneous.
In the case of the spectra obtained on some of the aluminium surfaces, it is not possible to use
Tafel interpolation to determine the corrosion current or potential as a clear shift between
anodic and cathodic behaviour is not present within the spectra. It is possible that this is due
to the corrosion potential of aluminium being outside the scan range of the experiment[9].
Whilst it would be possible to change the parameters of the experiment to extend the
potential range, this would affect the results obtained on the zinc surface due to polarising the
sample cathodic to the potential of zinc oxide, as the reduction potential of zinc oxide
(approximately -1.2V) is close to that of the general corrosion potential of zinc (-0.78V)[9].
However, the most likely explanation is that the behaviour exhibited is consistent with pitting
of the aluminium surface, which is expected at around -730 mV in this environment.
The applicability of the potentiodynamic polarisations is difficult to determine, whilst the Tafel
interpolation of these curves may output some interesting information, ultimately the

253
corrosion potentials and currents of the individual parts of the system are not directly related
to the coupled behaviour, as the corrosion potential is far from the individual open circuit
potentials. Despite this, there are some interesting observations that are worth analysing.
Strontium chromate exhibits a significant reduction in the corrosion current for the zinc
electrode, but unusually the highest corrosion current for the steel surface. As a well-known
and highly effective corrosion inhibitor, this analysis can be considered incorrect. Indeed, no
Tafel behaviour would be expected due to passive behaviour being exhibited. Despite this,
Tafel analysis of the full system potentiodynamic polarisation plot shows one of the lowest
corrosion currents and significant anodic inhibition compared to the uninhibited corrosion
potential.
Indeed, throughout these tests, the steel inhibition across the board can considered to be
fairly poor, with overall corrosion currents not varying much from that which was observed for
the uninhibited system, yet some sizable shifts in corrosion potential. This would suggest that,
in these cases, the inhibition of the anodic reactions is paired with a concurrent facilitation of
the cathodic reaction (or vice versa).
In the case of magnesium aluminium polyphosphate, the corrosion current for the aluminium
surface is seen to be low. Indeed, all polyphosphates (and strontium chromate) show corrosion
currents an order of magnitude lower than that of the calcium exchanged silica/zinc
molyphosphate mixture. This low corrosion current could be seen to be contradictory to the
corrosion acceleration behaviour observed within the electrochemical impedance results.
However, these polarisation results are taken after a greater period of time in which the
corrosion acceleration effect could potentially have ended.
Additionally, it can be seen that MAPP has the most negative potential observed for the
aluminium surface, suggesting inhibition of the cathodic reaction. This leads to the corrosion

254
potential of the system sitting anodic to the open circuit potential of the aluminium, which
could explain the initial impedance behaviour. However, this is also the case for strontium
chromate which does not exhibit this behaviour. Calcium aluminium polyphosphate shows the
greatest positive shift in potentials for the aluminium surface, suggesting inhibition of anodic
reactions on the surface.
Overall, the separated potentiodynamic polarisations can give some information in how the
individual environments differ from the uninhibited systems. However, there are certainly
some limitations.
Electrochemical Impedance
Justification of Equivalent Circuits
As was the case in the previous sections, the equation relating charge transfer resistance and
inhibitor efficiency was used, following the calculation of the charge transfer resistance from
equivalent circuit analysis of the obtained electrochemical impedance spectra. For the
impedance spectra gained for the steel and zinc constituents of the multi-metal cell, the
analysis was as described in the previous chapters, utilising the same equivalent circuits with
the same justifications. In this set of experiments, the mixed corrosion potential of the systems
was not significantly altered compared to that of the steel-zinc couple (i.e. the presence of
aluminium did not cause large shifts in the potential of the system) and thus significant
changes to the behaviour of these two components of the cell are not expected.
For impedance spectra obtained for the aluminium surface, the equivalent circuits shown in
Figure 5.4.1 are representative of those that were used.

255
Figure 5.4.1 - Representative equivalent circuit used for the analysis of most electrochemical impedances obtained on the surface of aluminium.
For most aluminium samples, the presence of three time constants was detected, which
utilised the equivalent circuit shown. The first is the parallel combination of the charge transfer
resistance and double layer capacitance (a constant phase element has been used to take into
account the imperfection in the capacitive behaviour). As is the case for the other samples, the
charge transfer resistance of the corrosion process is what will be used to determine the
overall inhibitor efficiency.
The second time constant that is present is attributed to the aluminium oxide layer at the
surface. When using pure aluminium, like has been done in this section, the formation of
aluminium oxide from contact with the air is almost unavoidable. Aluminium oxide at the
surface is known to provide effective protection of the bulk sample, and it was seen in many of
the observed samples that the calculated resistance was high[3]. Indeed, for some of the
samples, the resistance was calculated to be beyond the limits of the programme. In these
cases, the absence of the resistor from the equivalent circuit make little difference to the
overall fitting, but are included for complete justification of the system.
The development of a third time constant in the lower frequency range is evident in many of
samples. The stability of this third time constant can be considered to improve when looking at
the samples with longer exposure times. It is suspected that this third time constant is either
due to damage within the oxide layer[4] or the deposition of a secondary protective layer due
to the presence of corrosion inhibitor within the solution[5].

256
Interpretation of Equivalent Circuit Analysis
To understand the behaviour better, the inhibitor efficiencies of the polyphosphate inhibitors,
and strontium chromate, were calculated using the equation given in Chapter 2.1. Table 5.4-2
shows the calculated inhibitor efficiencies for each of the inhibitor species.
Inhibitor Efficiency / %
Metal Exposure Time SrCrO4 SAPP CAPP MAPP
Steel
2h 69 65 44 36
12h 63 78 44 58
24h 97 81 43 66
Zinc
2h 78 56 34 -60
12h 85 46 40 -46
24h 86 31 50 -41
Aluminium
2h 63 14 -159 -288
12h 86 66 3 -116
24h 85 66 31 -30
Table 5.4-2 - Calculated inhibitor efficiencies for strontium chromate and the observed polyphosphate inhibitors for the three electrode segmented electrochemical impedance experiments
These calculated inhibitor efficiencies give more detail of the overall picture, and can put some
of the previous observations into context. Firstly, the inhibition observed for strontium
chromate is seen to be effective across all three metallic surfaces, and over the observation
period, in most cases, it can be seen to be the inhibitor with the highest efficiency. This
observation highlights the flexibility and effectiveness that has led to the wide use of
hexavalent chromium compounds, and the subsequent struggle to replace them.
Secondly, the suggested reduction in charge transfer resistance for the MAPP samples
manifests itself as negative efficiencies in the calculation table. The physical meaning behind
negative inhibitor efficiencies is suggested to be corrosion acceleration. This is seen on the
aluminium surface, and to a lesser extent the zinc surface, for the MAPP inhibited samples.
The benefits to corrosion acceleration from a corrosion prevention standpoint can be
considered to be non-obvious. However, in this case, initiating the corrosion of aluminium
257
could potentially be mechanistically important for the effective inhibition of the overall
system.
As the three electrode set-up is designed to be a model of the galvanising alloy Galvalume, the
behaviour of this alloy must be taken into consideration. One of the major advantages of using
Galvalume as a metallic coating has been reported as improvements in results from salt spray
tests[6]. It is suspected that this is due self-passivation that is a direct result of the high
aluminium content present at the material surface[7]. This can be considered to be a useful
outcome in the case of small coating defects in which only the alloy coating is exposed.
However, this behaviour can be potentially problematic in scenarios where the underlying
steel is exposed to the environment, such as at the cut edge. In this scenario, sufficient self-
passivation of the galvanic layer would lead to the steel becoming vulnerable to corrosive
attack. In the case of a Galvalume system inhibited by MAPP, the corrosion acceleration effect
could, in theory, allow the metallic coating to act as a sacrificial anode and thus protect the
underlying steel substrate.
Within the polyphosphate inhibitors, strontium aluminium polyphosphate is shown to be the
most consistent, with the best inhibition across all metallic surfaces. However, SAPP appears to
get less efficient over the observation period on the zinc surface.
Applicability of Technique
This set of experiments attempted to expand the applicability of the electrochemical
impedance experiments utilising two distinct electrodes in an attempt to study more complex
systems.
As discussed in Chapter 2, there are some limitations to the information that can be obtained
from the electrochemical impedance plots that are obtained from segmented electrode
experiments. In moving from measuring at the open circuit potential of a particular metal to

258
the mixed corrosion potential of the overall system, it was determined that the obtained
results were generally dominated by a single time constant, which is suspected to refer
specifically to either the anodic or cathodic reaction. This means that the extent of inhibition
for the individual reactions is what can be ascertained from the results, whereas most
mechanistic information will be difficult to establish from the impedance results alone.
In applying this technique to a three electrode system, more points can be raised. The addition
of further electrodes that have distinct electrochemical behaviours, in addition to the two
electrodes utilised in the original experimental setup, may produce a non-binary distinction
between anode and cathode. Whilst this does not appear to have created many issues with
the results presented in this work, the application of this methodology to other systems may
result in some data that is difficult to interpret.
Additionally, in using a pure aluminium electrode, problems can arise from the strongly
passivating properties of naturally occurring aluminium oxide. This results in the measurement
of strongly capacitive behaviour with large charge transfer resistances that can only be
calculated through extrapolation and are therefore likely to have a large degree of inaccuracy.
However, it appears that the overall behaviour of the plot can be interpreted through simple
comparisons with relative confidence.
Overall Picture
A greater understanding of the inhibitor pigments, and the effects that they have on the three
electrode system, can be obtained through combining the results of the potentiodynamic
polarisation with the electrochemical impedance plots.
Strontium chromate exhibits the same flexibility and effectiveness that has resulted in wide
use and ultimately the issues in replacing it. Consistently high calculated inhibitor efficiencies
within the impedance results are also corroborated with significant inhibition that is noted in
the potentiodynamic polarisation results.

259
With regards to the polyphosphate inhibitor pigments, anecdotal evidence from natural
testing and in-service behaviour as suggested by the industrial sponsors indicates that the
magnesium aluminium polyphosphate inhibitor pigment is the most effective for reducing
corrosion behaviour when used in paints applied to a Galvalume coated steel substrate. It is
also suggested in the literature, as previously stated, that the use of Galvalume for various
applications is a result of improved corrosion testing results when compared to zinc coated
steel, such as in salt spray.
One suggestion for this behaviour is that the high aluminium content of the alloy results in self
passivation through the formation of an adherent aluminium oxide layer at the surface. This
would be effective at lowering corrosion rates in standard testing but would also result in poor
performance in situations where the steel is exposed, such as in scribes, or at the cut edge in
real world scenarios, due to not providing sufficient sacrificial protection to the underlying
steel substrate.
In the case of magnesium aluminium polyphosphate, it has been shown in previous chapters of
this work that it is a reasonably effective inhibitor with a quick onset of action for the simple
case of two electrode system utilising steel and zinc electrodes. In the case of Galvalume, it is
suggested that it also provides an additional effect in the ability to disrupt the aluminium oxide
layer and thus accelerate aluminium corrosion. In doing so, this allows the galvalume to act as
a sacrificial anode in such scenarios where it is necessary to do so. In this way, the corrosion of
the steel substrate is reduced sufficiently to allow the inhibitor to work.

260
Conclusions 5.5In this chapter, the segmented electrode electrochemical methodology was expanded to
employ further electrodes by introducing aluminium to the original zinc and steel electrode
set-up. Following the analysis of the results obtained from these experiments, the following
conclusions can be drawn:
The application of the segmented electrode technique to three electrodes appears to
be successful, with analysable data obtained across all three electrodes.
In the case of aluminium, the presence of the naturally occurring passive oxide layer
on the surface results in large charge transfer resistances in a non-inhibited medium.
Strontium chromate is seen to be an effective inhibitor, with inhibitor efficiencies
greater than 80% across all three surfaces compared to the polyphosphate inhibitors,
which are often seen with inhibitor efficiencies lower than 60%.
Magnesium aluminium polyphosphate shows unusual corrosion acceleration
behaviour (negative inhibitor efficiencies) on the aluminium surface
o This may be indicative of a mechanism which would allow cut edge protection,
suggesting an interruption of aluminium oxide production allowing the
aluminium parts of the microstructure to provide sacrificial protection
o Magnesium aluminium polyphosphate is the only inhibitor where the
aluminium corrosion potential/passivation potential is situated at a more
negative potential than that of the system mixed potential, and this means
that the aluminium component can therefore provide sacrificial protection to
the steel
Aluminium surface is generally seen to be cathodic, with the oxygen reduction reaction
taking place at a rate generally between one and three orders of magnitude lower
than that of the steel surface
Most system potentials are situated within 100 mV of the corrosion potential of zinc.

261
The addition of a potentiodynamic polarisation step following the completion of the
final electrochemical impedance adds an extra dimension to the analysis that can be
done of the overall system.
o However, traditional Tafel interpolation may be insufficient or inappropriate
for the analysis of the multiple metal set-up, as the corrosion potential of the
system may be several hundred millivolts away from the Tafel region observed
on the individual metal.
The range selection for potentiodynamic polarisation may be incompatible for systems
containing both zinc and aluminium. In some of the systems presented, it is possible
that the aluminium Tafel region may be present at a more negative potential than the
-1200 mV limit which was selected.
o However, selecting a limit more negative than this is likely to shift the Tafel
behaviour on the zinc sample from zinc to zinc oxide.

262
Chapter References 5.6[1] Selverian JH, Marder AR, Notis MR. J Electron Microsc Tech 1987;226:223.
[2] Bush GW, Jones DA, Nair NR, Biber HE, Townsend HE, Borzillo AR, Friet JJ, Graedel TE,
Allegra L, Dutton RJ, Kriner SA, Berke NS, Meyer L, Selige A, Midorikawa H, Minato A,
Kubo M, Katayama K, Sato K, Yasunaga H, Yoshihara T, Fujita Y, Kyono K, Patent US,
Higuchi S, Tano K, Kamada M, Okamoto S, Zoccola JC, Meitzner CF, Horton JB, Pelerin J,
Bramaud B, Nouville JF, Coutsouradis D, Herrshaft DC, Serais JP, Radtke SF, Lee HH,
Gomersall DW, Leckie HP, Sievet WC, Legault RA, Ichiyama K, Kobayashi J, Sugimoto S,
Lynch RF, Lin KL, Ho JK, Kubaschewski O. Corrosion 1991;47:17.
[3] Juttner K, Lorenz W. Corros Sci 1989;29:279.
[4] Oh HJ, Jang KW, Chi CS. Bull Korean Chem Soc 1999;20:1340.
[5] Pan J, Thierry D, Leygraf C. Electrochim Acta 1996;41:1143.
[6] Edavan RP, Kopinski R. Corros Sci 2009;51:2429.
[7] Zhang X, Vu T-N, Volovitch P, Leygraf C, Ogle K, Wallinder IO. Appl Surf Sci
2012;258:4351.
[8] Burleigh TD, Rennick RC, Bovard FS. Corrosion 1993;49:683.
[9] Aylward G, Findlay T. SI Chemical Data, 6th editio. Milton, Queensland: Wiley; 2008.

263
6 Conclusions The issue of replacing the carcinogenic hexavalent chromium compounds from being used in
corrosion inhibition applications is one that is both difficult and real. Particularly in the coil
coating industry, where the inherent defect of an exposed cut edge means that efficient and
effective corrosion inhibition is required for almost all applications, it is a problem which
requires a solution. These works have looked at a potential alternative, or addition, to long and
costly real world exposure tests. Alongside this, they have also attempted to gain some
understanding into how, or why, some of the proposed alternatives work in certain conditions.
The conclusions that have been made from the contained works are:
A methodology was developed for looking at the behaviour of corrosion inhibitors on
multi-metal systems. This was tested on a simplified zinc and steel system using
pigments in which the corrosion behaviour is relatively well known. Analysis of the
obtained results showed good matching between the expected behaviour and that
which was shown by the electrochemical impedance, suggesting that the methodology
is valid.
The methodology was applied to lesser understood and industrially relevant modified
aluminium polyphosphate inhibitor pigments on the simple zinc and steel substrate
configuration. Distinct behaviours were shown for each of the aluminium
polyphosphates, particularly strontium aluminium polyphosphate which exhibited
time-dependant behaviour, suggesting differing mechanisms of action.
The zinc and steel configuration was modified to look at local effects after seeing time
dependent behaviour in samples exposed with the strontium aluminium
polyphosphate inhibitor. Following the change in the sample configuration, the time
dependent behaviour was absent. This indicated that some mechanistic information
could be predicted by manipulating the substrates and using the simultaneous
electrochemical impedance methodology.

264
Optical microscopy, scanning electron microscopy and energy-dispersive X-ray
spectroscopy were used on steel samples exposed to polyphosphate inhibitors with
and without the presence zinc chloride. The structure, adhesion and elemental
composition of the corrosion products and surface deposits was seen to change when
zinc chloride was added to the solution.
X-ray photoelectron spectroscopy showed several composition changes with the
presence of zinc chloride in solution. In particular, the presence of zinc chloride in
solution was shown to result in greater concentrations of phosphorus on the surface
for strontium aluminium polyphosphate at all measured exposure times, and to
accelerate the deposit of phosphorus on the surface with calcium aluminium
polyphosphate. It is therefore considered that the presence of zinc has an effect on the
mechanism of deposition/inhibition for these polyphosphates. The effect of zinc on
magnesium aluminium polyphosphate was shown to be minimal.
The minimum concentration level of added zinc chloride to the solution for effective
changes to the rate of phosphate deposition was determined to be between the
approximate concentrations 1 and 2 mM within the bulk solution. At 1 mM and below,
it was seen that the effect on phosphorus was inconsistent. An increased
concentration of zinc chloride, 4 mM, was seen to improve the phosphorus deposition
levels beyond that of 2 mM. A maximum level of effectiveness was not determined
within the scope of this thesis.
Limited initial results showed the potential for improving the efficacy of modified
aluminium polyphosphate corrosion inhibition through the addition of alternative
cationic sources. The addition of calcium in particular showed positive effects of
phosphate levels similar to that of zinc in the other studies.
The expanded simultaneous electrochemical impedance methodology was shown to
be useful for a three working electrode set-up. Interesting mechanistic information

265
regarding the magnesium aluminium polyphosphate inhibitor was suggested through
apparent corrosion acceleration behaviour. However, the highly resistive nature of
naturally occurring aluminium oxide does mean that it can be somewhat difficult to
gain accurate equivalent circuit analysis from the aluminium surface in the particular
metallic configuration used within these tests.
Simultaneous potentiodynamic polarisations were attempted with the three electrode
cell set-ups. Whilst some potentially useful analysis could be made, the overall
applicability of traditional Tafel interpolation is perhaps tenuous at best. However,
graphical overlays do appear to give some comparative idea of how each individual
part of the cell is interacting with the corrosion inhibitors.

266
7 Suggestions for Future Work
Whilst the work carried out and discussed within this report can be considered complete and
has resulted in the conclusions presented, there are definite logical extensions to the work
that can be suggested for future study. This section will provide some potential avenues for
the continuation of the work shown in this thesis.
Whilst the simultaneous electrochemical impedance methodology has been verified
and can simply be compared with traditional electrochemical impedance
spectroscopy, it has not been thoroughly compared with other advanced techniques. It
is suggested that results obtained from the developed methodology are compared to
what can be obtained from localised techniques, such as scanning vibrating electrode
technique, localised electrochemical impedance spectroscopy and scanning kelvin
probe.
Some experimentation went into the expansion of the developed methodology into
more complex metallic systems with three working electrodes. The addition of
aluminium proved to be somewhat problematic. Therefore, it is suggested that further
verification work is required on the systems with greater numbers of working
electrodes. For example, adding more benign metals into the system such as copper or
tin and observing how the system changes.
In addition to the previous point, zinc magnesium aluminium ternary alloys are of
interest due to becoming more commonly used within the coil coating industry.
Therefore, testing additional analogue models for some of the more complex alloy
coatings. This could also include introducing some non-pure metallic elements (alloys)
into the models.
Some mechanistic information was predicted through the change of experimental
parameters (distance between electrodes) within this work. This means there is the

267
potential for more information to be gathered through similar parameter changes.
One potential parameter to observe is to perform the impedance measurements at
potentials offset from the measured mixed potential to understand how that might
affect the inhibitor effects.
In the work as presented, the x-ray photoelectron spectra are relatively crudely
analysed with respect to the overall thickness/deposition. One proposal for the
extension of this work is to introduce angle-resolved XPS measurements, as well as
sputtering experiments, could be methods applied to gain a fuller understanding of
both the overall thickness of the deposited material, as well as any through-thickness
changes. XPS mapping could also be used to determine overall quality of coverage.
All surface characterisation presented in these works concentrated on the steel
surface which, whilst important, does not present a full view of the inhibitor action
over the cut edge. A series of experiments analysing the surface of zinc would be
important for the simple galvanised steel case.
Further surface characterisation techniques could be utilised to gain a fuller
understanding of the surface deposition by the inhibitor molecules. Atomic force
microscopy could be used to determine the structure of the deposits, and comparing
this with the structure produced in the presence of additional cationic species may
give a better idea of why greater phosphorus deposition was seen for strontium
aluminium polyphosphate when zinc is present.
Further to the previous point, it would be of interest to see whether any structural
changes occur on surface or in solution. In an attempt to determine this, a series of
experiments involving recrystallization of inhibitor species from solutions containing
cationic species could be done. Following this, various characterisation methods, such
as differential scanning calorimetry, infrared spectroscopy or powder x-ray diffraction,
could be used to determine whether any in-solution changes occur.

268
There is the potential for more work to be done on the competing cationic species
series of experiments. Firstly, further characterisation of the systems already studied
could be useful. Specifically, observing the electrochemistry of systems containing
additional cations and comparing the results with the XPS results.
Introduction of cationic species experiments have thus far only used simple chloride
additions to the bulk solution. Whilst this is useful for the experimental side, this will
not have much use in real systems. Therefore, it is also proposed that pigment systems
that can potentially provide the synergistic effects that the cationic species provide are
looked at.