organic farming statistics united kingdom 2020
TRANSCRIPT
1
24 June 2021
Organic farming statistics United Kingdom 2020
This release presents final estimates for 2020 of the land area farmed organically,
crop areas, livestock numbers and numbers of organic producers and processors in
the United Kingdom. These estimates replace those published on 27 May 2021 and
include new livestock data not available at the time of the first publication.
The results are produced from data compiled by approved organic certification
bodies. The total organic area referred to is made up of fully organic land and
organic land in-conversion.
Key findings • Organic land area – 489 thousand hectares is farmed organically in the UK.
• Organic land use – 62% of UK organic land is accounted for by permanent
grassland.
• Regional organic land use – 62% of the total UK organic area is in England.
• Organic crops – 9% of the total UK organic area is used to grow cereals.
• Organic livestock – 3.2% of the total UK cattle population is reared
organically.
• Organic operators – there are 5.8 thousand organic operators in the UK.
2
Contents
What you need to know about this release ................................................................. 3
Contact details ........................................................................................................ 3
National Statistics Status ........................................................................................ 3
Section 1 – Detailed Results ...................................................................................... 4
1.1 Land area farmed organically ............................................................................ 4
1.2 Land in conversion ............................................................................................ 5
1.3 Organic land use ............................................................................................... 5
1.4 Organic crops .................................................................................................... 6
1.5 Organic Livestock ............................................................................................. 6
1.6 Number of organic producers and processors in the United Kingdom .............. 7
Section 2 - Organic statistics methodology, data notes and feedback ..................... 18

3
What you need to know about this release
Contact details
Responsible statistician: Sarah Thompson
Team: Farming Statistics - Department for Environment, Food and Rural Affairs Foss House, Kings Pool, 1-2 Peasholme Green, York, YO1 7PX.
Email: [email protected]
Telephone: 0300 060 0170
National Statistics Status
National Statistics status means that our statistics meet the highest standards of trustworthiness, quality and public value, and it is our responsibility to maintain compliance with these standards. The continued designation of these statistics as National Statistics was confirmed in 2014 following a full assessment by the UK Statistics Authority against the Code of Practice for Statistics. Since the last review of these statistics in 2014, we have continued to comply with the Code of Practice for Statistics, and have made improvements including:
• Providing a detailed breakdown of livestock categories following user feedback.
• Improved the data quality by updating guidance for data providers and carrying out enhanced validation checks on data received.
For general enquiries about National Statistics, contact the National Statistics Public
Enquiry Service:
Tel: 0845 601 3034
Email: [email protected].
You can find National Statistics on the internet on the Gov.uk website.
4
Section 1 – Detailed Results
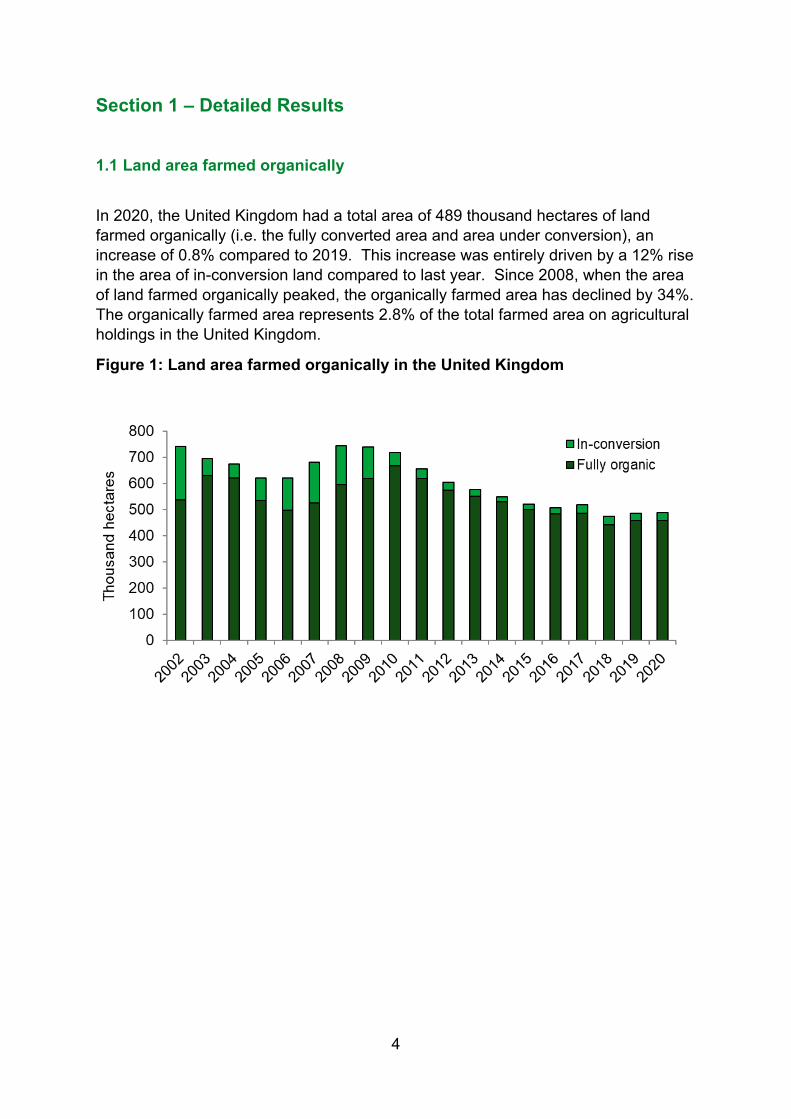
1.1 Land area farmed organically
In 2020, the United Kingdom had a total area of 489 thousand hectares of land
farmed organically (i.e. the fully converted area and area under conversion), an
increase of 0.8% compared to 2019. This increase was entirely driven by a 12% rise
in the area of in-conversion land compared to last year. Since 2008, when the area
of land farmed organically peaked, the organically farmed area has declined by 34%.
The organically farmed area represents 2.8% of the total farmed area on agricultural
holdings in the United Kingdom.
Figure 1: Land area farmed organically in the United Kingdom
5
1.2 Land in conversion
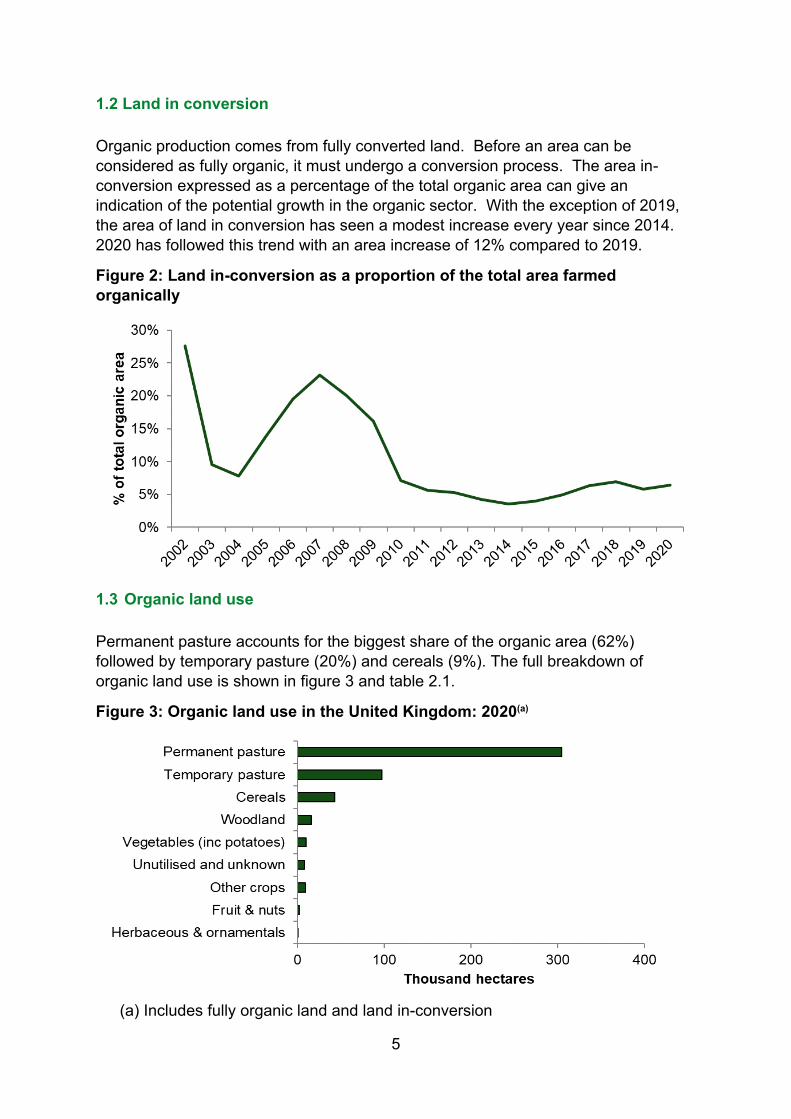
Organic production comes from fully converted land. Before an area can be
considered as fully organic, it must undergo a conversion process. The area in-
conversion expressed as a percentage of the total organic area can give an
indication of the potential growth in the organic sector. With the exception of 2019,
the area of land in conversion has seen a modest increase every year since 2014.
2020 has followed this trend with an area increase of 12% compared to 2019.
Figure 2: Land in-conversion as a proportion of the total area farmed
organically
1.3 Organic land use
Permanent pasture accounts for the biggest share of the organic area (62%)
followed by temporary pasture (20%) and cereals (9%). The full breakdown of
organic land use is shown in figure 3 and table 2.1.
Figure 3: Organic land use in the United Kingdom: 2020(a)
(a) Includes fully organic land and land in-conversion
6
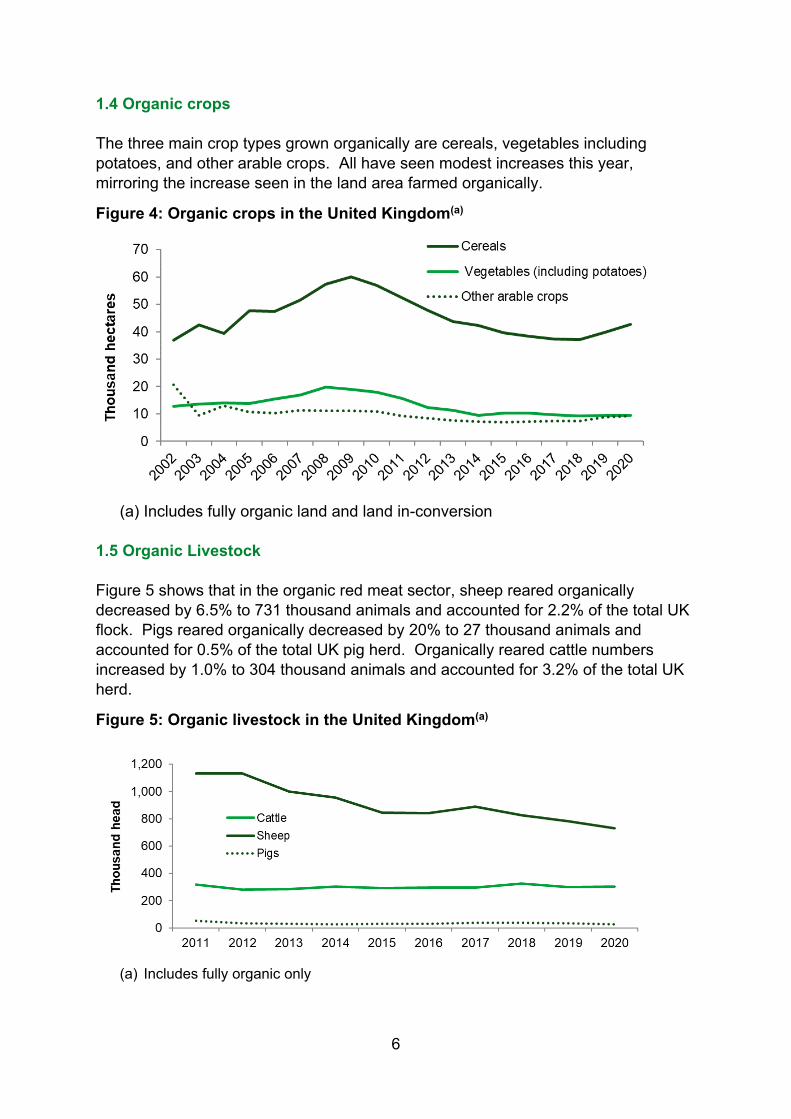
1.4 Organic crops
The three main crop types grown organically are cereals, vegetables including
potatoes, and other arable crops. All have seen modest increases this year,
mirroring the increase seen in the land area farmed organically.
Figure 4: Organic crops in the United Kingdom(a)
(a) Includes fully organic land and land in-conversion
1.5 Organic Livestock
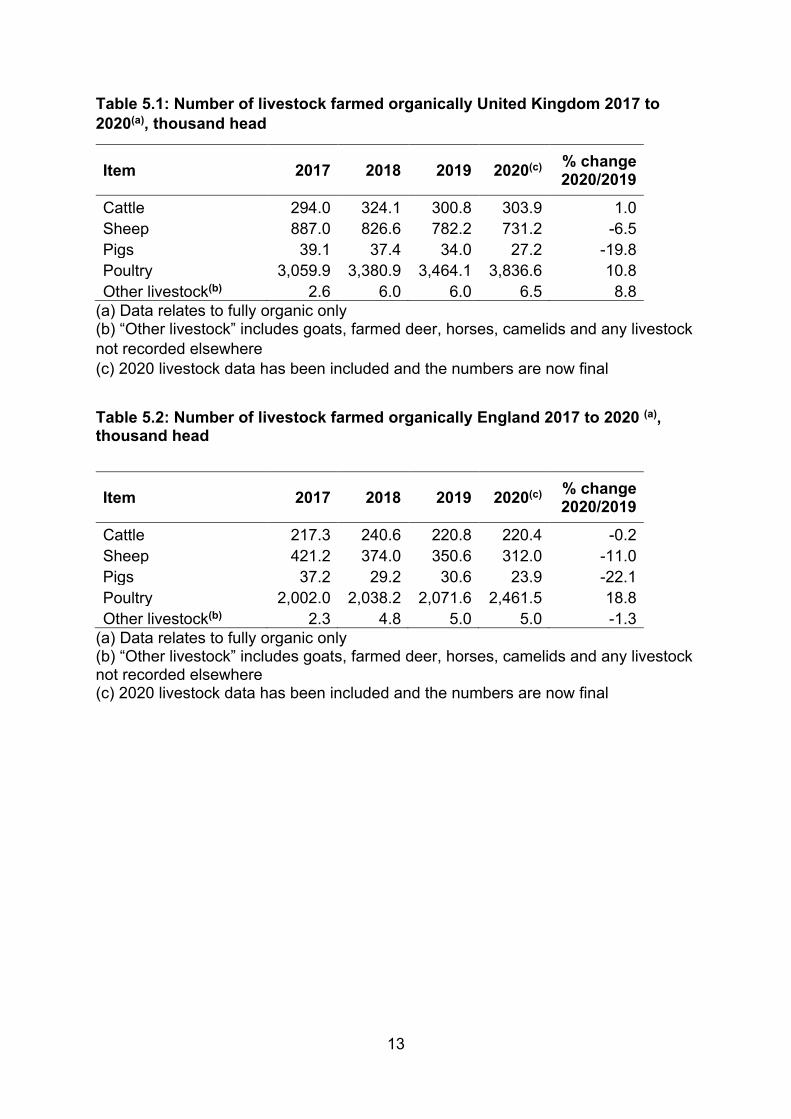
Figure 5 shows that in the organic red meat sector, sheep reared organically
decreased by 6.5% to 731 thousand animals and accounted for 2.2% of the total UK
flock. Pigs reared organically decreased by 20% to 27 thousand animals and
accounted for 0.5% of the total UK pig herd. Organically reared cattle numbers
increased by 1.0% to 304 thousand animals and accounted for 3.2% of the total UK
herd.
Figure 5: Organic livestock in the United Kingdom(a)
(a) Includes fully organic only
7
The number of total poultry farmed organically in the United Kingdom increased by
11% between 2019 and 2020, rising to just over 3.8 million birds. This equates to
2.1% of the total UK poultry population.
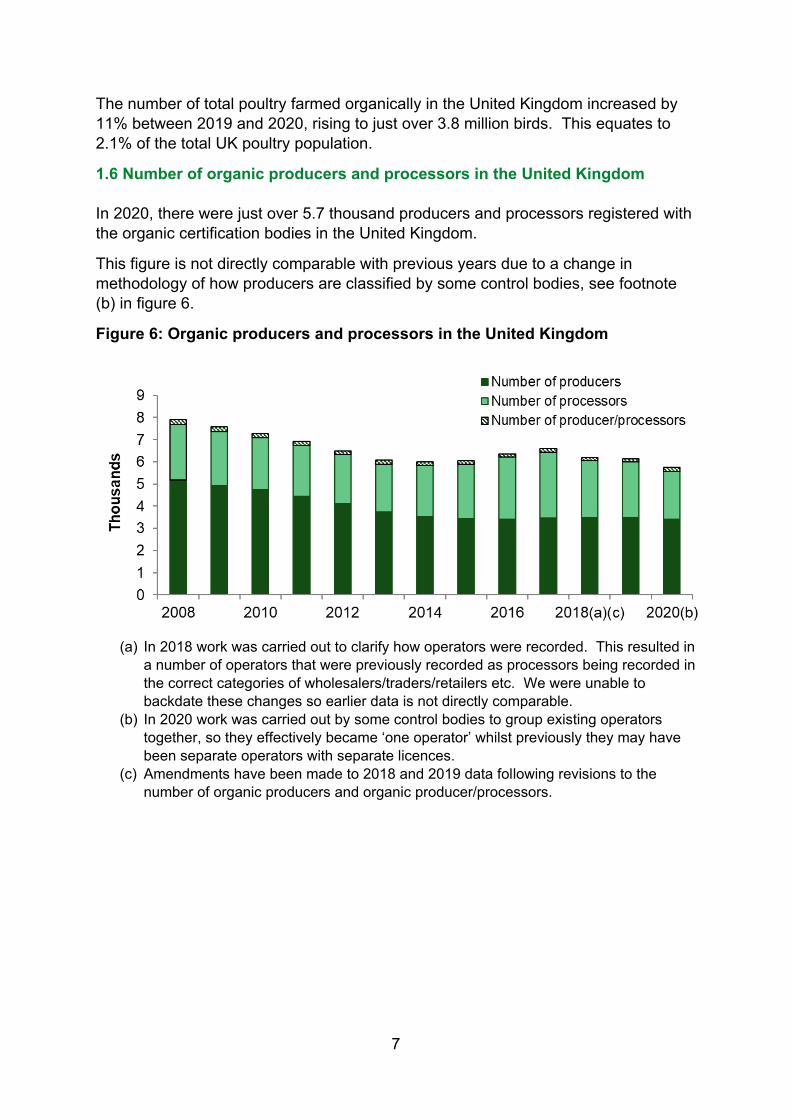
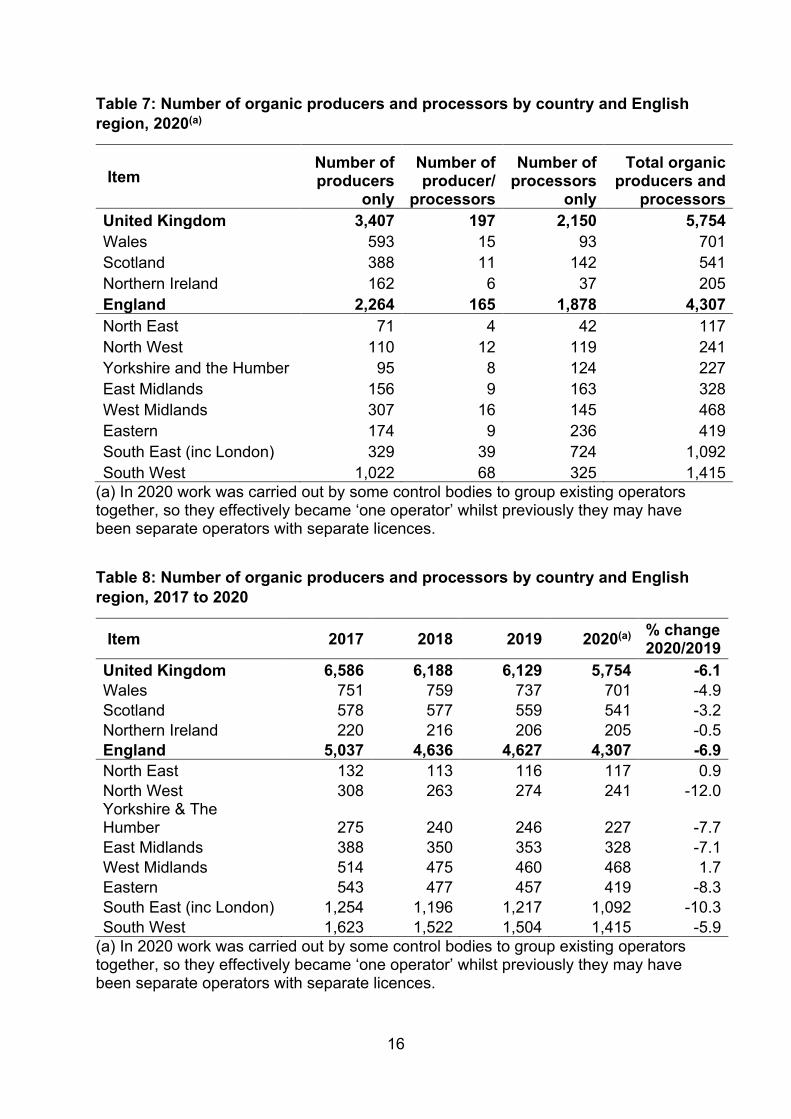
1.6 Number of organic producers and processors in the United Kingdom
In 2020, there were just over 5.7 thousand producers and processors registered with
the organic certification bodies in the United Kingdom.
This figure is not directly comparable with previous years due to a change in
methodology of how producers are classified by some control bodies, see footnote
(b) in figure 6.
Figure 6: Organic producers and processors in the United Kingdom
(a) In 2018 work was carried out to clarify how operators were recorded. This resulted in
a number of operators that were previously recorded as processors being recorded in
the correct categories of wholesalers/traders/retailers etc. We were unable to
backdate these changes so earlier data is not directly comparable.
(b) In 2020 work was carried out by some control bodies to group existing operators
together, so they effectively became ‘one operator’ whilst previously they may have
been separate operators with separate licences.
(c) Amendments have been made to 2018 and 2019 data following revisions to the
number of organic producers and organic producer/processors.

8
Table 1.1: Land area farmed organically United Kingdom 2017 to 2020,
thousand hectares
Item 2017 2018 2019 2020 % change 2020/2019
In conversion 32.6 32.9 28.1 31.3 11.6
Fully organic 484.8 441.1 457.1 457.6 0.1
Total organic area 517.4 474.0 485.2 489.0 0.8
Table 1.2: Land area farmed organically England 2017 to 2020, thousand
hectares
Item 2017 2018 2019 2020 % change
2020/2019
In conversion 19.8 20.3 19.0 20.4 7.5
Fully organic 280.5 269.0 281.6 281.3 -0.1
Total organic area 300.3 289.3 300.6 301.8 0.4
Table 2.1: Fully organic and in conversion land use United Kingdom(a)
2017 to 2020, thousand hectares
Item 2017(c) 2018(c) 2019 2020 % change 2020/2019
Cereals 37.4 37.1 39.7 42.7 7.5
Other crops 7.4 7.4 8.9 9.2 3.2
Fruit & nuts 1.8 1.7 2.0 2.0 2.0
Vegetables (inc potatoes) 9.6 9.3 9.4 9.5 1.2
Herbaceous & ornamentals 5.9 6.7 0.4 0.4 -6.9
Temporary pasture 92.3 61.8 95.1 97.1 2.0 Permanent pasture (inc rough grazing) 333.3 330.1 305.4 304.5 -0.3
Woodland 9.0 7.6 15.2 16.0 5.0
Unutilised land 5.5 4.0 4.5 2.8 -38.7
Unknown(b) 15.2 8.4 4.5 4.9 8.8
Total 517.4 474.0 485.2 489.0 0.8
(a) Includes fully organic and in-conversion areas. (b) Some land areas are provided without a crop category or land use description therefore these are classified as unknown. (c) In 2019 data issues were identified with the detailed split of crops provided for 2017 and 2018. The overall totals for 2017 and 2018 remain unaffected but the breakdowns are subject to a degree of error and therefore should be treated with caution.
9
Table 2.2: Fully organic and in conversion land use England(a) 2017 to 2020, thousand hectares
Item 2017(c) 2018(c) 2019 2020 % change 2020/2019
Cereals 31.3 31.4 33.8 36.4 7.6
Other crops 5.4 5.5 7.0 7.3 5.1
Fruit & nuts 1.6 1.6 1.9 1.9 2.6
Vegetables (inc potatoes) 8.0 7.7 7.8 7.7 -1.1
Herbaceous & ornamentals 5.2 5.8 0.3 0.3 -13.2
Temporary pasture 75.5 51.9 76.8 77.6 1.1
Permanent pasture (inc rough grazing) 153.9 172.2 154.9 153.3 -1.0
Woodland 5.3 4.7 11.2 11.4 2.3
Unutilised land 4.0 2.7 2.9 1.4 -51.0
Unknown(b) 10.1 5.6 4.1 4.4 7.0
Total 300.3 289.3 300.6 301.8 0.4
(a) Includes fully organic and in-conversion areas. (b) Some land areas are provided without a crop category or land use description, therefore these are classified as unknown. (c) In 2019 data issues were identified with the detailed split of crops provided for
2017 and 2018. The overall totals for 2017 and 2018 remain unaffected but the
breakdowns are subject to a degree of error and therefore should be treated with
caution

10
Table 3.1: Detailed fully organic and in conversion land use United Kingdom 2020, thousand hectares
Item Area in-
conversion
Fully organic
area
Total organic
area
Total areas at
June 2020(a)
Total organic
area as % of June
area
Cereals 3.7 39.0 42.7 3,038 1.4
Wheat 0.7 9.3 10.1 1,387 0.7
Barley 1.7 10.4 12.1 1,388 0.9
Oats 0.6 15.0 15.6 210 7.4
Other cereals 0.6 4.3 5.0 53 9.3
Other arable crops 1.5 7.7 9.2 1,134 0.8
Sugar beet 0.3 0.0 0.3 111 0.2
Fodder, forage and silage 0.9 7.1 8.0 112 7.2
Maize, oilseeds & protein crops 0.3 0.6 0.9 911 0.1
Vegetables 0.7 7.4 8.1 118 6.9
Potatoes 0.1 1.3 1.4 142 1.0
Fruit & nuts 0.1 1.9 2.0 34 5.9
Herbaceous & ornamentals 0.1 0.3 0.4 11 3.2
Temporary pasture 6.5 90.5 97.1 1,181 8.2
Permanent pasture (excl rough grazing) 14.0 243.4 257.4 10,042 2.6
Rough grazing 3.4 43.7 47.1 3,924 1.2
Woodland 0.9 15.1 16.0 1,065 1.5
Unutilised land 0.2 2.6 2.8 na na
Unknown(b) 0.2 4.7 4.9 na na
Total 31.3 457.6 489.0 na na
(a) Source: June Survey of Agriculture as at 1 June 2020. Excludes common land.
(b) Some land areas are provided without a crop category or land use description,
therefore these are classified as unknown.
na - no comparable June survey data is available
11
Table 3.2: Detailed fully organic and in conversion land use England 2020, thousand
hectares
Item Area in-
conversion
Fully organic
area
Total organic
area
Total areas at
June 2020(a)
Total organic area as
% of June area
Cereals 3.0 33.4 36.4 2,526 1.4
Wheat 0.7 8.8 9.5 1,265 0.8
Barley 1.2 8.0 9.2 1,045 0.9
Oats 0.5 12.5 13.0 169 7.7
Other cereals 0.6 4.1 4.7 46 10.1
Other arable crops 1.3 6.0 7.3 1,057 0.7
Sugar beet 0.3 0.0 0.3 111 0.2
Fodder, forage and silage 0.8 5.5 6.3 92 6.8
Maize, oilseeds & protein crops 0.3 0.5 0.7 854 0.1
Fruit & nuts 0.1 1.8 1.9 31 6.2
Vegetables 0.6 6.1 6.6 96 6.9
Potatoes 0.0 1.0 1.0 108 1.0
Herbaceous & ornamentals 0.1 0.2 0.3 10 3.1
Temporary pasture 5.8 71.8 77.6 710 10.9
Permanent pasture (excl rough grazing) 7.9 140.5 148.5 3,679 4.0
Rough grazing 0.7 4.2 4.8 437 1.1
Woodland 0.6 10.8 11.4 385 3.0
Unutilised land 0.1 1.3 1.4 na na
Unknown(b) 0.2 4.2 4.4 na na
Total 20.4 281.3 301.8 na na
(a) Source: June Survey of Agriculture as at 1 June 2020. Excludes common land. (b) Some land areas are provided without a crop category or land use description, therefore these are classified as unknown. na - no comparable June survey data is available.
12
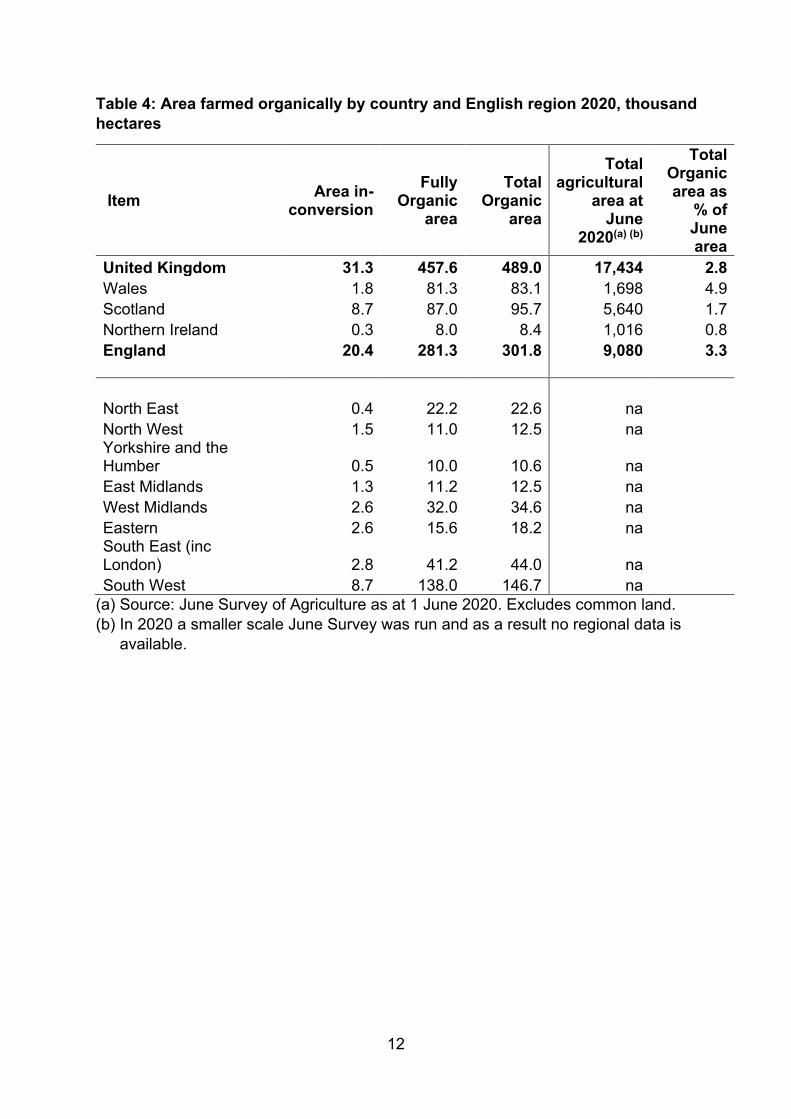
Table 4: Area farmed organically by country and English region 2020, thousand
hectares
Item Area in-
conversion
Fully Organic
area
Total Organic
area
Total agricultural
area at June
2020(a) (b)
Total Organic area as
% of June area
United Kingdom 31.3 457.6 489.0 17,434 2.8
Wales 1.8 81.3 83.1 1,698 4.9
Scotland 8.7 87.0 95.7 5,640 1.7
Northern Ireland 0.3 8.0 8.4 1,016 0.8
England 20.4 281.3 301.8 9,080 3.3
North East 0.4 22.2 22.6 na
North West 1.5 11.0 12.5 na Yorkshire and the Humber 0.5 10.0 10.6 na
East Midlands 1.3 11.2 12.5 na
West Midlands 2.6 32.0 34.6 na
Eastern 2.6 15.6 18.2 na South East (inc London) 2.8 41.2 44.0 na
South West 8.7 138.0 146.7 na
(a) Source: June Survey of Agriculture as at 1 June 2020. Excludes common land.
(b) In 2020 a smaller scale June Survey was run and as a result no regional data is
available.
13
Table 5.1: Number of livestock farmed organically United Kingdom 2017 to
2020(a), thousand head
Item 2017 2018 2019 2020(c) % change 2020/2019
Cattle 294.0 324.1 300.8 303.9 1.0
Sheep 887.0 826.6 782.2 731.2 -6.5
Pigs 39.1 37.4 34.0 27.2 -19.8
Poultry 3,059.9 3,380.9 3,464.1 3,836.6 10.8
Other livestock(b) 2.6 6.0 6.0 6.5 8.8
(a) Data relates to fully organic only (b) “Other livestock” includes goats, farmed deer, horses, camelids and any livestock
not recorded elsewhere
(c) 2020 livestock data has been included and the numbers are now final
Table 5.2: Number of livestock farmed organically England 2017 to 2020 (a), thousand head
Item 2017 2018 2019 2020(c) % change 2020/2019
Cattle 217.3 240.6 220.8 220.4 -0.2
Sheep 421.2 374.0 350.6 312.0 -11.0
Pigs 37.2 29.2 30.6 23.9 -22.1
Poultry 2,002.0 2,038.2 2,071.6 2,461.5 18.8
Other livestock(b) 2.3 4.8 5.0 5.0 -1.3
(a) Data relates to fully organic only (b) “Other livestock” includes goats, farmed deer, horses, camelids and any livestock not recorded elsewhere (c) 2020 livestock data has been included and the numbers are now final
14
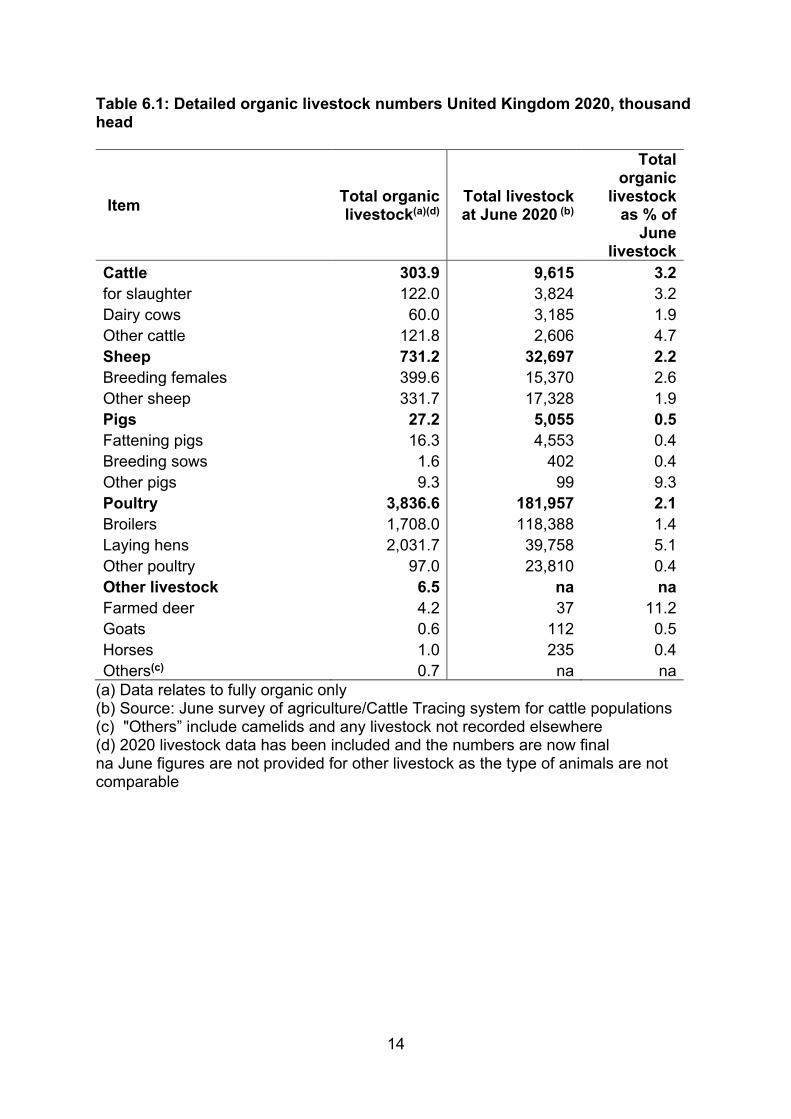
Table 6.1: Detailed organic livestock numbers United Kingdom 2020, thousand head
Item Total organic livestock(a)(d)
Total livestock at June 2020 (b)
Total organic
livestock as % of
June livestock
Cattle 303.9 9,615 3.2
for slaughter 122.0 3,824 3.2
Dairy cows 60.0 3,185 1.9
Other cattle 121.8 2,606 4.7
Sheep 731.2 32,697 2.2
Breeding females 399.6 15,370 2.6
Other sheep 331.7 17,328 1.9
Pigs 27.2 5,055 0.5
Fattening pigs 16.3 4,553 0.4
Breeding sows 1.6 402 0.4
Other pigs 9.3 99 9.3
Poultry 3,836.6 181,957 2.1
Broilers 1,708.0 118,388 1.4
Laying hens 2,031.7 39,758 5.1
Other poultry 97.0 23,810 0.4
Other livestock 6.5 na na
Farmed deer 4.2 37 11.2
Goats 0.6 112 0.5
Horses 1.0 235 0.4
Others(c) 0.7 na na
(a) Data relates to fully organic only (b) Source: June survey of agriculture/Cattle Tracing system for cattle populations (c) "Others” include camelids and any livestock not recorded elsewhere (d) 2020 livestock data has been included and the numbers are now final na June figures are not provided for other livestock as the type of animals are not comparable
15
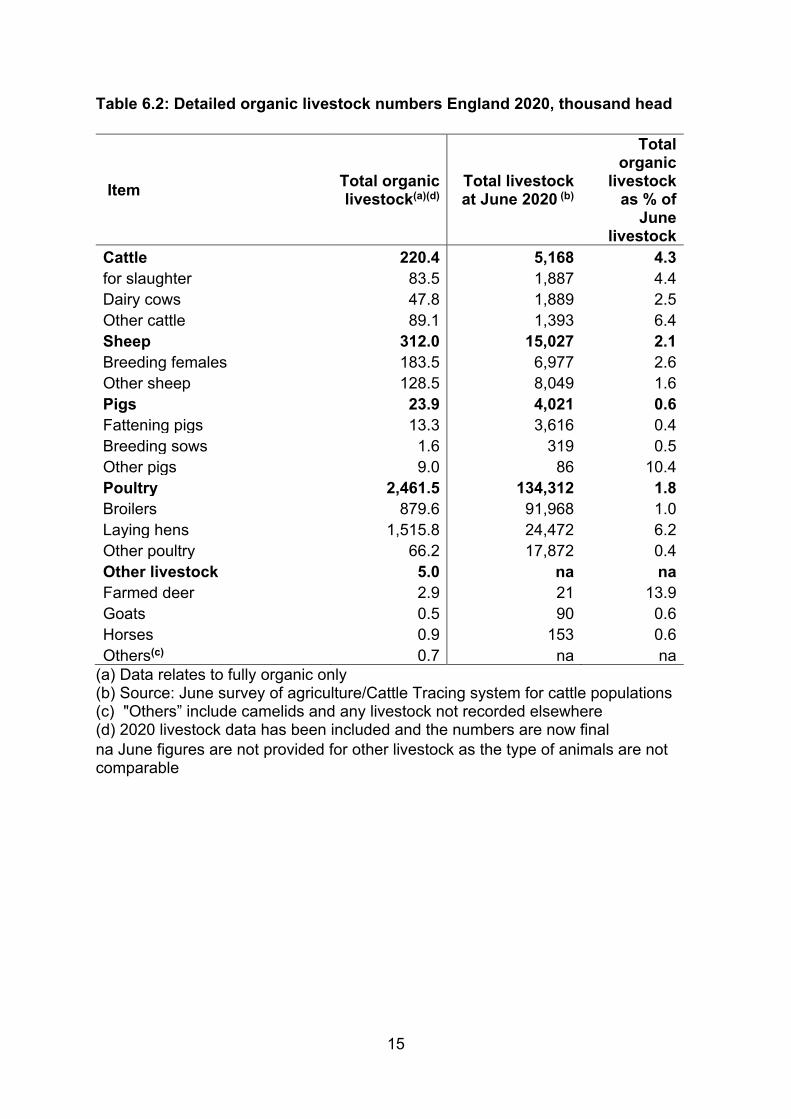
Table 6.2: Detailed organic livestock numbers England 2020, thousand head
Item Total organic livestock(a)(d)
Total livestock at June 2020 (b)
Total organic
livestock as % of
June livestock
Cattle 220.4 5,168 4.3
for slaughter 83.5 1,887 4.4
Dairy cows 47.8 1,889 2.5
Other cattle 89.1 1,393 6.4
Sheep 312.0 15,027 2.1
Breeding females 183.5 6,977 2.6
Other sheep 128.5 8,049 1.6
Pigs 23.9 4,021 0.6
Fattening pigs 13.3 3,616 0.4
Breeding sows 1.6 319 0.5
Other pigs 9.0 86 10.4
Poultry 2,461.5 134,312 1.8
Broilers 879.6 91,968 1.0
Laying hens 1,515.8 24,472 6.2
Other poultry 66.2 17,872 0.4
Other livestock 5.0 na na
Farmed deer 2.9 21 13.9
Goats 0.5 90 0.6
Horses 0.9 153 0.6
Others(c) 0.7 na na
(a) Data relates to fully organic only (b) Source: June survey of agriculture/Cattle Tracing system for cattle populations (c) "Others” include camelids and any livestock not recorded elsewhere (d) 2020 livestock data has been included and the numbers are now final
na June figures are not provided for other livestock as the type of animals are not comparable
16
Table 7: Number of organic producers and processors by country and English
region, 2020(a)
Item Number of producers
only
Number of producer/
processors
Number of processors
only
Total organic producers and
processors
United Kingdom 3,407 197 2,150 5,754
Wales 593 15 93 701
Scotland 388 11 142 541
Northern Ireland 162 6 37 205
England 2,264 165 1,878 4,307
North East 71 4 42 117
North West 110 12 119 241
Yorkshire and the Humber 95 8 124 227
East Midlands 156 9 163 328
West Midlands 307 16 145 468
Eastern 174 9 236 419
South East (inc London) 329 39 724 1,092
South West 1,022 68 325 1,415
(a) In 2020 work was carried out by some control bodies to group existing operators together, so they effectively became ‘one operator’ whilst previously they may have been separate operators with separate licences.
Table 8: Number of organic producers and processors by country and English
region, 2017 to 2020
Item 2017 2018 2019 2020(a) % change 2020/2019
United Kingdom 6,586 6,188 6,129 5,754 -6.1
Wales 751 759 737 701 -4.9
Scotland 578 577 559 541 -3.2
Northern Ireland 220 216 206 205 -0.5
England 5,037 4,636 4,627 4,307 -6.9
North East 132 113 116 117 0.9
North West 308 263 274 241 -12.0 Yorkshire & The Humber 275 240 246 227 -7.7
East Midlands 388 350 353 328 -7.1
West Midlands 514 475 460 468 1.7
Eastern 543 477 457 419 -8.3
South East (inc London) 1,254 1,196 1,217 1,092 -10.3
South West 1,623 1,522 1,504 1,415 -5.9
(a) In 2020 work was carried out by some control bodies to group existing operators together, so they effectively became ‘one operator’ whilst previously they may have been separate operators with separate licences.
17
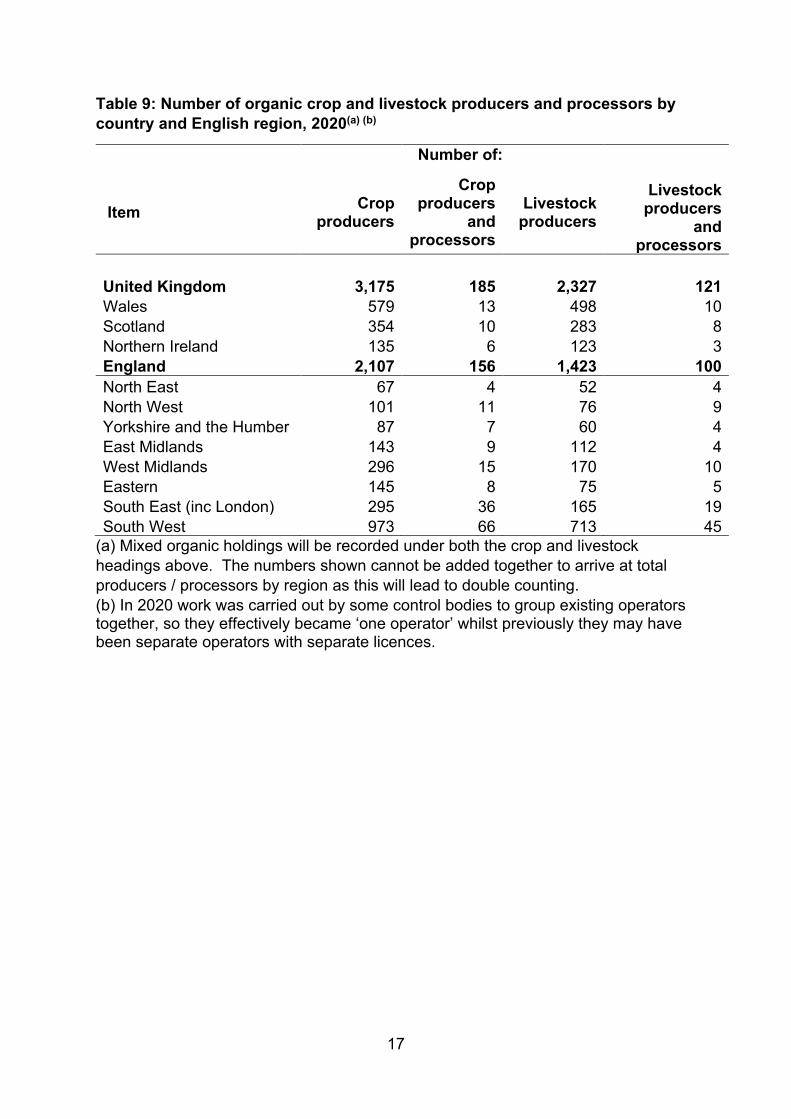
Table 9: Number of organic crop and livestock producers and processors by
country and English region, 2020(a) (b)
Number of:
Item Crop
producers
Crop producers
and processors
Livestock producers
Livestock producers
and processors
United Kingdom 3,175 185 2,327 121
Wales 579 13 498 10
Scotland 354 10 283 8
Northern Ireland 135 6 123 3
England 2,107 156 1,423 100
North East 67 4 52 4
North West 101 11 76 9
Yorkshire and the Humber 87 7 60 4
East Midlands 143 9 112 4
West Midlands 296 15 170 10
Eastern 145 8 75 5
South East (inc London) 295 36 165 19
South West 973 66 713 45
(a) Mixed organic holdings will be recorded under both the crop and livestock
headings above. The numbers shown cannot be added together to arrive at total
producers / processors by region as this will lead to double counting.
(b) In 2020 work was carried out by some control bodies to group existing operators together, so they effectively became ‘one operator’ whilst previously they may have been separate operators with separate licences.

18
Section 2 - Organic statistics methodology, data notes and
feedback
Organic statistics methodology
This statistical release contains summary results of data compiled by the UK Organic Certification Bodies. Each year, certifier bodies visit their registered farms to carry out annual inspections. During these inspections, certifiers record the crop areas and numbers of livestock present on the organic holding on that day. The data collected during these inspections are sent to Defra each January. The information collated by Defra is checked thoroughly before the figures are presented in this statistical release. Data are checked against historical data for comparability and any unusual values are queried with the relevant certification bodies. Due to the nature of the inspections, the data are collected at varying times through the year. Therefore, the data presented here do not give an exact snapshot of organic farming at any specific time of year, so they should be treated with a degree of caution. Defra is very grateful to the inspectors and members in the UK’s Organic Certification Bodies for the information collected in the annual returns each year.
Note
In this statistical release, unless specified otherwise, all figures include both in conversion and fully organic holdings. Also, totals in this release are based on unrounded figures so may not agree with the sum of their components in the tables.
Organics overview
Only food that has been produced in accordance with organic standards by farmers/producers registered with an approved UK organic control body may be legally sold as ‘organic’ within the UK. The inputs and practices used in organic farming are strictly regulated in accordance with UK Regulations.
Key elements of organic farming systems
The main components of an organic farming system are the avoidance of artificial fertilisers and pesticides, and the use of crop rotations and other forms of husbandry to maintain soil fertility and control weeds, pests and diseases. Livestock also form an integral part of the majority of organic farms, although there are some successful stockless systems. Organic standards do not allow intensively housed stock or systems where a large amount of total feed has to be bought in. Pigs and poultry must be managed with extensive outdoor access under an organic system.

19
Conversion
In most cases, land must be managed organically for a minimum of two years (three years for top fruit orchards) before it is granted approved 'organic' status and is eligible for organic certification. Producers can then sell their produce as 'organic' and organic livestock breeding can commence.
Other relevant data sources
Data on agricultural crop areas and livestock numbers are collected through the annual June Survey of Agriculture. Results from this survey can be accessed at: structure of the agricultural industry.
Users and uses of these statistics
The information is heavily used by a broad range of people and organisations within the UK and also international organisations. The data is important to the government and the organic certification bodies in the UK, who provide the information used to compile the statistics, to formulate policies and provide support to organic farming. Other users include farming organisations, research bodies, and there is interest also from the general public.
Feedback
We welcome feedback and any thoughts to improve the publication further. Please send any feedback to: [email protected] Suggested questions to help you structure your feedback are below, but all feedback is welcome:
• How relevant is the current content of the publication to your needs as a user?
• What purpose do you require the data for?
• Which data do you find most useful?
• Is there any content that you did not find useful?
• Do you have any suggestions for further development of this release, including additional content, presentation, and any other thoughts?