organic farming in the european union - facts and figures farming in the eu.pdf · eu european...
TRANSCRIPT
Commission européenne, B-1049 Bruxelles - Belgique. Téléphone: (32-2) 299 11 11.
COMMISSION EUROPÉENNE DIRECTION GÉNÉRALE DE L'AGRICULTURE ET DU DÉVELOPPEMENT RURAL Direction G. Analyses économiques et évaluation G.2. Analyses quantitatives, prévisions, statistiques
Bruxelles, 3 Novembre 2005 G2 EW - JK D(2005)
REPORT
ORGANIC FARMING IN THE EUROPEAN UNION
FACTS AND FIGURES
2
TABLE OF CONTENTS
1. INTRODUCTION....................................................................................................... 8
2. STATISTICAL SOURCES......................................................................................... 8
3. AREAS, CROPS AND LIVESTOCK ........................................................................ 9
3.1. Organic areas ..................................................................................................... 9
3.2. Organic holdings ............................................................................................. 11
3.3. Breakdown of area by crop type...................................................................... 13
3.4. Organic livestock............................................................................................. 15
4. MARKETING OF ORGANIC PRODUCTS............................................................ 19
4.1. Processors of organic products........................................................................ 19
4.2. Retail sales of organic products....................................................................... 20
4.3. Prices ........................................................................................................... 23
5. AGRI-ENVIRONMENT AND RURAL DEVELOPMENT.................................... 28
3
LIST OF FIGURES
Figure 1 World organic area, 2003 (%) .......................................................................... 9
Figure 2 Share of organic area in UAA in EU-15, 1993-2003 (%) .............................. 10
Figure 3 Share of organic area in UAA in EU-25, 2003 (%) ....................................... 11
Figure 4 Share of organic area in UAA in EU-15 at regional level, 2000 (%)............. 11
Figure 5 UAA per holding in EU-25, 2003 (ha)........................................................... 12
Figure 6 Share of organic holdings in EU-25, 2003 (%) .............................................. 13
Figure 7 Employment of labour per area in EU-25, 2003 (AWU/100ha) .................... 13
Figure 8 Breakdown of organic area by crop type in EU-15, 2003 (%)....................... 14
Figure 9 Organic and in-conversion arable land in EU-15, 2003 (000 ha) .................. 14
Figure 10 Organic and in-conversion grassland & fodder area in EU-15, 2003 (000 ha) 15
Figure 11 Organic and in-conversion fruit, berries, citrus, olives and vineyards area in EU-15, 2003 (000 ha) ......................................................................... 15
Figure 12 Certified livestock units (LU) in EU-25, 2003 (000) ..................................... 16
Figure 13 Number of certified dairy cows in EU-17, 2003 (000) .................................. 16
Figure 14 Number of certified non-dairy cattle in EU-17, 2003 (000)........................... 17
Figure 15 Number of certified pigs in EU-17, 2003 (000) ............................................. 17
Figure 16 Number of certified broilers and hens in EU-15, 2003 (mio) ........................ 18
Figure 17 Number of certified sheep & goats in EU-15, 2003 (000) ............................. 19
Figure 18 Number of organic producers and processors in EU-17, 2003 (000)............. 20
Figure 19 Organic retail sales in EU-15, 2003 (bio €).................................................... 21
Figure 20 Share of organic products in total food products turnover in EU-17 2001 (%) ......................................................................................................... 22
Figure 21 Share of organic sales through retail shops in EU-17, 2001 (%) ................... 23
Figure 22 Farm-gate and consumer prices for wheat flour in EU-15 (€/kg) .................. 24
4
Figure 23 Farm-gate and consumer prices for apples in EU-15 (€/kg) .......................... 24
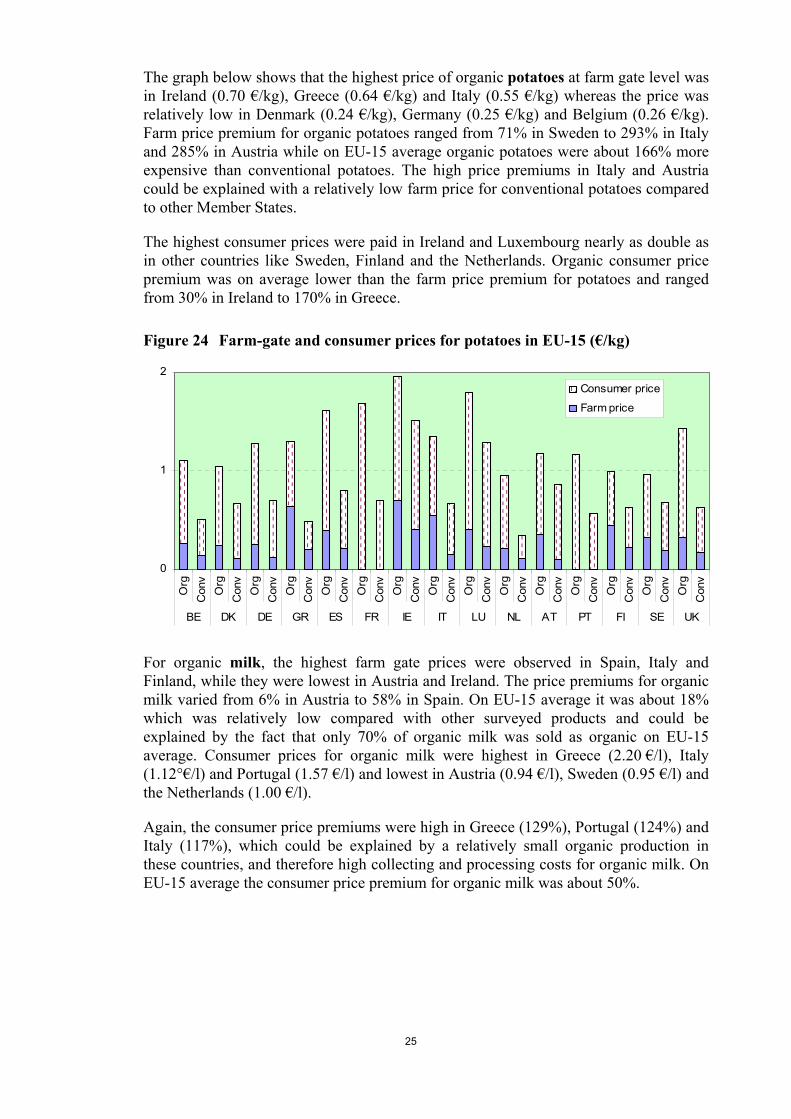
Figure 24 Farm-gate and consumer prices for potatoes in EU-15 (€/kg) ....................... 25
Figure 25 Farm-gate and consumer prices for milk in EU-15 (€/l) ................................ 26
Figure 26 Farm-gate and consumer prices for eggs in EU-15 (€/each).......................... 26
Figure 27 Farm-gate and consumer prices for pork cutlet in EU-15 (€/kg) ................... 27
Figure 28 Farm-gate and consumer prices for minced beef in EU-15 (€/kg)................. 28
Figure 29 Organic land supported by agri-environmental programmes, as % of total supported land in EU-15, 2003 (%) ....................................................... 29
LIST OF TABLES
Table 1 Minimum and maximum farm-gate and consumer price premiums .............. 28
5
LIST OF ACRONYMS AND ABBREVIATIONS
AWU Annual work unit
bio Billion
DG AGRI European Commission, Directorate General for Agriculture and Rural Development
EU European Union
EU-N10 New Member States from 1st May 2004
Eurostat European Commission, Statistical Office of the European Communities
FSS Farm Structure Survey
ha Hectare
kg Kilogram
mio Million
l Litre
LU Livestock Unit
UAA Utilised Agricultural Area
6
EXECUTIVE SUMMARY
At EU-25 level, the certified organic and in-conversion area covered 5.7 mio ha and represented 3.6 % of the Utilised Agricultural Area in 2003. Italy had the most important organic area with more than 1.0 mio ha (about a fifth of EU-25), followed by Germany, Spain and United Kingdom and France.
At EU-25 level, 149 000 holdings are certified organic and in-conversion holdings which represent 1.4% of total agricultural holdings. In EU-15, certified organic and in-conversion holdings increased from 29 000 in 1993 to more than 140 000 in 2003 and account for about 2% of all holdings. For EU-N10, organic holdings represent a share of 0.25% in total holdings. Italy had the largest number of organic holdings (31% of EU-25 total), followed by Austria, Spain and Germany. Five Member States had a share of organic holdings in total holdings above 3%. In the EU-25, the average organically cultivated area per holding at 40 ha was significantly larger than the average area of conventional holdings at 15 ha of UAA.
In 2003, certified organic and in-conversion area accounted for 5.1 mio ha in EU-15 Member States, with around 3.1 mio ha of grassland & fodder crops, 1.3 mio ha of arable crops, 0.4 mio ha under horticulture and 0.3 mio ha occupied for other uses. Production of grass and fodder was the most important use of organic land (61%) in EU-15 and even more significant in Ireland, the United Kingdom, Austria, Belgium, France and Greece. Cereals appeared the most important organic crop and represented about 70% of organic arable area. The share of organic and in-conversion cereals in total cereal area was highest in Portugal (6.6%), Italy (5.0%) and Austria (4.9%). Of the 0.35 mio ha of organic fruit, berries, citrus olives and vineyards in EU-15 half is located in Italy and one third in Spain.
In 2003, EU-25 certified total livestock amounted to about 3 mio LU or 2.3% of the total EU-25 livestock. Italy, Sweden and Germany held the largest certified herd with more than 0.40 mio LU each. In EU-15 certified dairy cows amounted to 483 000 heads or 2.5 % of the total dairy herd. The United Kingdom and Germany represented about 40 % of EU-15 certified dairy herd. EU-15 certified other cattle amounted to about 1 mio heads or 1.7% of total cattle (non-dairy) herd. Austria held 25% of the EU-15 certified non-dairy herd.
The number of certified pigs is still quite low with 450 000 heads or 0.4 % of the total pig herd in the EU-15. EU-15 certified broiler and laying hens number amounted to more than 9 and 6 mio respectively. France represented about half of broilers. The United Kingdom and France held the largest number of laying hens.
7
EU-15 certified sheep & goats amounted to 2.4 mio heads or 2.4% of total sheep & goats herd. Significant share of EU-15 certified sheep are located in the United Kingdom and Italy. Half of the certified goats are located in Greece.
In 2004, the EU-25 market for organic food products was estimated to represent about 11 bio €. Germany was the largest national market with a share of about 30% of the total EU market volume; other large national markets of organic products are the United Kingdom, Italy and France.
The share of organic products in total turnover of food products was about 1% on EU-15 average in 2001. The highest shares of organic food in total food products turnover were observed in Denmark (5%), Sweden (3%) and Germany (2.6%). However, the share of organic food in total food turnover varied significantly by individual product groups. On EU-15 average this share was 1.8% for cereals, 1.6% for beef, 1.3% for vegetables and fruit, 1.3% for eggs and 1.2% for milk and milk products in 2001. There has been considerable growth in the market of organic products in Europe in recent years. Experts estimate that in the established organic markets like Austria, Denmark, Germany, the United Kingdom and France average growth rates will not reach more than 10 percent per year over the period 2002-2007.
The importance of individual marketing channels differs among the Member States. On one side, in Belgium, Germany, Greece, France Luxembourg, Ireland, Italy, Netherlands and Spain, direct marketing and marketing via specialised shops dominate the organic sector. However, compared to 1998, the share of retail sales increased significantly in these countries. On the other side, in Denmark, Finland, Sweden, the United Kingdom, Ireland, Hungary and the Czech Republic, most of the sales are concentrated in supermarkets (>60%) and in non-specialised shops. Some specialists are convinced that where organic products are mainly sold through supermarkets, growth and market shares are (and will remain) higher than in other Member States.
As a general rule, organic products receive a higher price than conventional products, but prices diverge depending on the country and on the product. Survey results show that in some cases price premiums for organic products, i.e. the relative price difference between organic and conventional products, are lower for consumer prices than for farmer prices (milk, eggs, potatoes), but the opposite is true for other products (wheat, apples, pork, beef). Price premiums for organic products are in general higher in South European countries, where the organic market is relatively small.
For EU-15, agri-environment programmes covered about 36 mio ha in 2003. The share of organic or in-conversion land area increased from 0.5% in 1993 to 7% in 2003 of the total supported land area. However, for some Member States, this share was significantly higher. In 2003, agri-environment programmes supported nearly half of all organic land area and about 64% of total organic holdings in EU-15.
8
1. INTRODUCTION
This report aims at updating the previous note on organic farming written in June 2003 and at providing an overview of the development in the organic farming sector over the last years. Based on Eurostat statistical information and other sources, it analyses certified organic and in-conversion area, number of certified organic and in-conversion holdings, breakdown of crop area, livestock, marketing channels and retail sales of organic products, farm-gate and consumer prices for organic and comparable conventional products and, finally, agri-environmental programmes, which support organic farming.
2. STATISTICAL SOURCES
The analyses in this fact sheet are mainly based on EUROSTAT data, as different EUROSTAT databases now contain much more organic farming figures as compared to the previous years. Nevertheless, the data is not complete for EU-15 Member States and does include only few data for EU-N10 Member States. For this reason EUROSTAT data was completed with other sources to have at least a more complete picture of organic farming in EU-15 Member States. The data for EU-N10 included where possible. On request of DG AGRI some organic farming data was collected by EUROSTAT in the context of the Farm Structural Survey (FSS) for EU-25 in 2003 although the representativity of the intermediate surveys is not completely assured.
Other sources used in this report are:
− Statistical information available based on information submitted by Member States to the Commission as requested in Council Regulation (CEE) no°2092/91.
− “Organic Agriculture Worldwide 2005: Statistics and Future Prospects” by Helga Willer and Minou Yussefi, SÖL (Foundation Ecology and Agriculture), 2005.
− Organic Farming in Europe – Country Reports, http://www.organic-europe.net/country_reports/default.asp.
− “The European Marked for Organic Food: Revised and Updated Analysis”, Organic Marketing Initiatives and Rural Development, vol. 5, U. Hamm, F. Gronefeld, 2004.
− “Marketing organic products via European retail chains”, T. Richter, Forschungsinstitut fuer biologischen Landbau (FiBL), 2004, unpublished.
− “ÖKOMARKT Jahrbuch 2005” (Band 55), Zentrale Markt- und Preisberichtstelle für Erzeugnisse der Land-, Forst- und Ernährungswirtschaft GmbH (ZMP), Bonn.
− “Anuario de Estadistica Agroalimentaria 2004“, Ministry for Agriculture, Fisheries and Food, Spain, December 2004, unpublished.
− “Organic Livestock Production in Portugal“, Ministry for Agriculture, Rural Development and Fisheries, Portugal, unpublished.
9
It is also worth to mention that FAO has started to collect data on organic agriculture and to develop an information system on organic farming world-wide (Organic-AIMS) which is in progress1.
The EU-founded EISFOM project to be concluded at the beginning 2006 will provide an inventory of sources for organic farming data2.
3. AREAS, CROPS AND LIVESTOCK
3.1. Organic areas
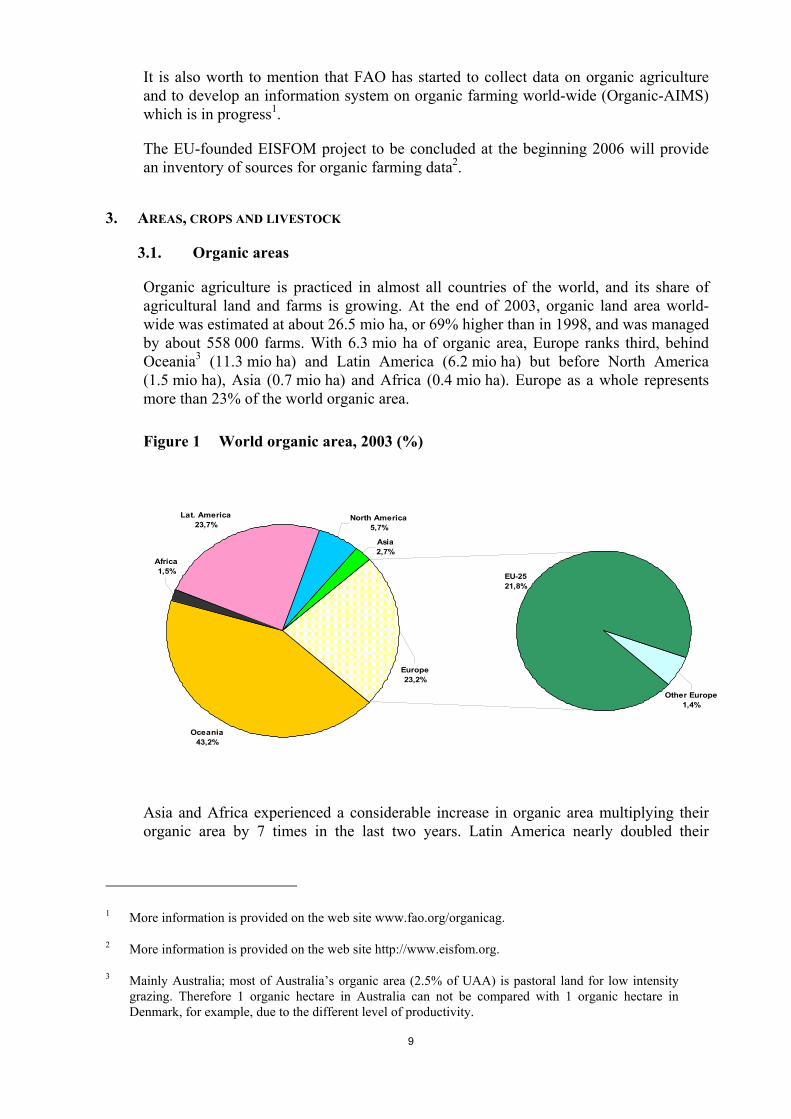
Organic agriculture is practiced in almost all countries of the world, and its share of agricultural land and farms is growing. At the end of 2003, organic land area world-wide was estimated at about 26.5 mio ha, or 69% higher than in 1998, and was managed by about 558 000 farms. With 6.3 mio ha of organic area, Europe ranks third, behind Oceania3 (11.3 mio ha) and Latin America (6.2 mio ha) but before North America (1.5 mio ha), Asia (0.7 mio ha) and Africa (0.4 mio ha). Europe as a whole represents more than 23% of the world organic area.
Figure 1 World organic area, 2003 (%)
EU-2521,8%
Oceania43,2%
Asia2,7%
North America5,7%
Lat. America23,7%
Africa1,5%
Europe23,2%
Other Europe1,4%
Asia and Africa experienced a considerable increase in organic area multiplying their organic area by 7 times in the last two years. Latin America nearly doubled their
1 More information is provided on the web site www.fao.org/organicag.
2 More information is provided on the web site http://www.eisfom.org.
3 Mainly Australia; most of Australia’s organic area (2.5% of UAA) is pastoral land for low intensity grazing. Therefore 1 organic hectare in Australia can not be compared with 1 organic hectare in Denmark, for example, due to the different level of productivity.
10
organic area compared to 1999, whereas organic area in Oceania, North America and the EU-25 increased by more than one third.
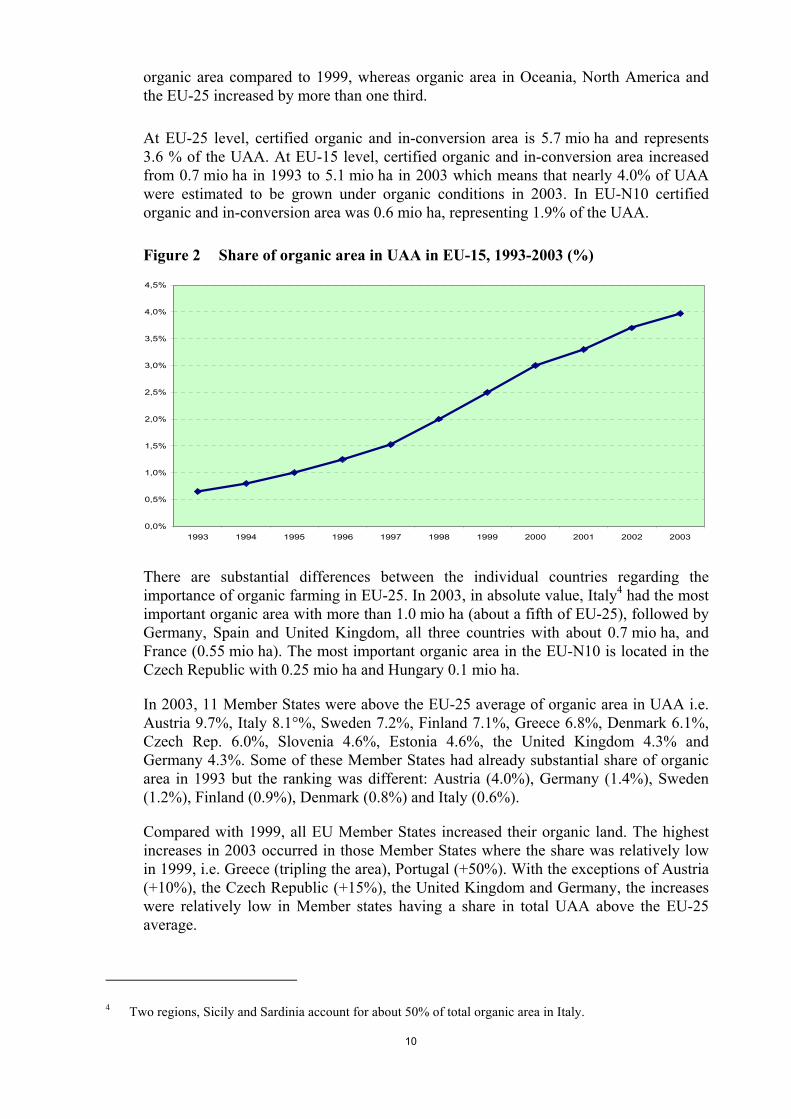
At EU-25 level, certified organic and in-conversion area is 5.7 mio ha and represents 3.6 % of the UAA. At EU-15 level, certified organic and in-conversion area increased from 0.7 mio ha in 1993 to 5.1 mio ha in 2003 which means that nearly 4.0% of UAA were estimated to be grown under organic conditions in 2003. In EU-N10 certified organic and in-conversion area was 0.6 mio ha, representing 1.9% of the UAA.
Figure 2 Share of organic area in UAA in EU-15, 1993-2003 (%)
0,0%
0,5%
1,0%
1,5%
2,0%
2,5%
3,0%
3,5%
4,0%
4,5%
1993 1994 1995 1996 1997 1998 1999 2000 2001 2002 2003
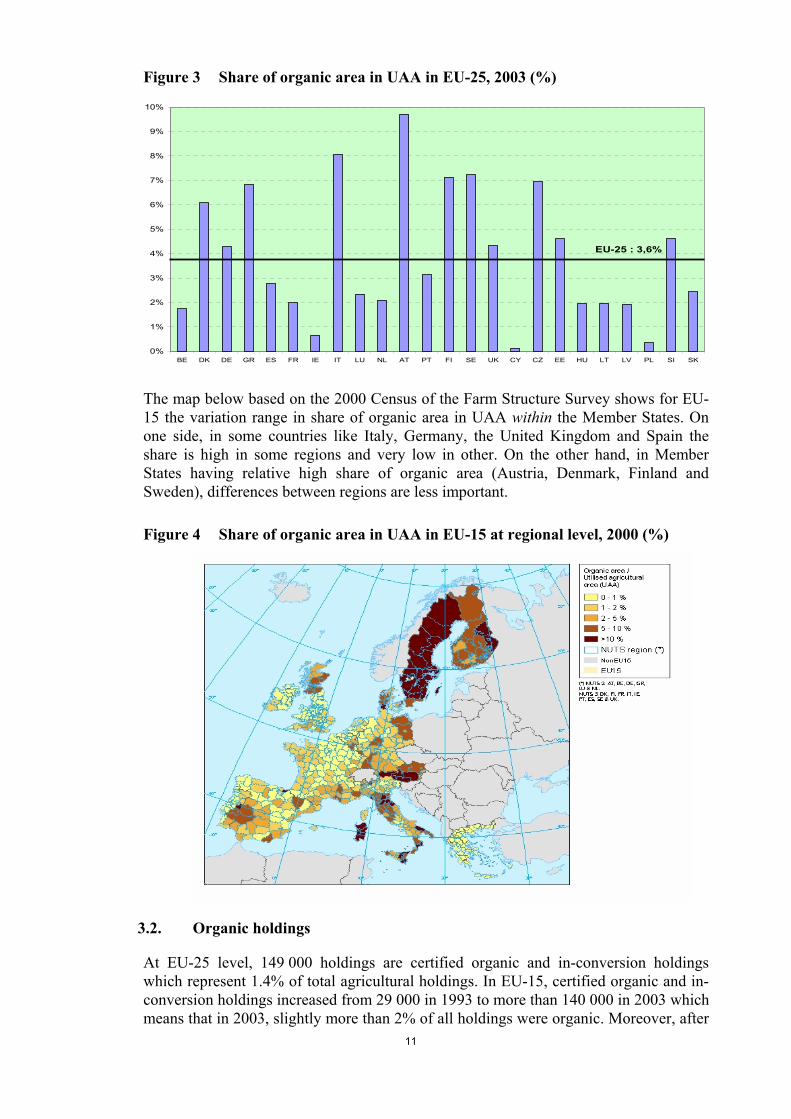
There are substantial differences between the individual countries regarding the importance of organic farming in EU-25. In 2003, in absolute value, Italy4 had the most important organic area with more than 1.0 mio ha (about a fifth of EU-25), followed by Germany, Spain and United Kingdom, all three countries with about 0.7 mio ha, and France (0.55 mio ha). The most important organic area in the EU-N10 is located in the Czech Republic with 0.25 mio ha and Hungary 0.1 mio ha.
In 2003, 11 Member States were above the EU-25 average of organic area in UAA i.e. Austria 9.7%, Italy 8.1°%, Sweden 7.2%, Finland 7.1%, Greece 6.8%, Denmark 6.1%, Czech Rep. 6.0%, Slovenia 4.6%, Estonia 4.6%, the United Kingdom 4.3% and Germany 4.3%. Some of these Member States had already substantial share of organic area in 1993 but the ranking was different: Austria (4.0%), Germany (1.4%), Sweden (1.2%), Finland (0.9%), Denmark (0.8%) and Italy (0.6%).
Compared with 1999, all EU Member States increased their organic land. The highest increases in 2003 occurred in those Member States where the share was relatively low in 1999, i.e. Greece (tripling the area), Portugal (+50%). With the exceptions of Austria (+10%), the Czech Republic (+15%), the United Kingdom and Germany, the increases were relatively low in Member states having a share in total UAA above the EU-25 average.
4 Two regions, Sicily and Sardinia account for about 50% of total organic area in Italy.
11
Figure 3 Share of organic area in UAA in EU-25, 2003 (%)
0%
1%
2%
3%
4%
5%
6%
7%
8%
9%
10%
BE DK DE GR ES FR IE IT LU NL AT PT FI SE UK CY CZ EE HU LT LV PL SI SK
EU-25 : 3,6%
The map below based on the 2000 Census of the Farm Structure Survey shows for EU-15 the variation range in share of organic area in UAA within the Member States. On one side, in some countries like Italy, Germany, the United Kingdom and Spain the share is high in some regions and very low in other. On the other hand, in Member States having relative high share of organic area (Austria, Denmark, Finland and Sweden), differences between regions are less important.
Figure 4 Share of organic area in UAA in EU-15 at regional level, 2000 (%)
3.2. Organic holdings
At EU-25 level, 149 000 holdings are certified organic and in-conversion holdings which represent 1.4% of total agricultural holdings. In EU-15, certified organic and in-conversion holdings increased from 29 000 in 1993 to more than 140 000 in 2003 which means that in 2003, slightly more than 2% of all holdings were organic. Moreover, after
12
reaching its highest in 2001 at 143 000, this number was slightly decreasing over the following years. For EU-N10, organic holdings represent a share of 0.25% in total holdings.
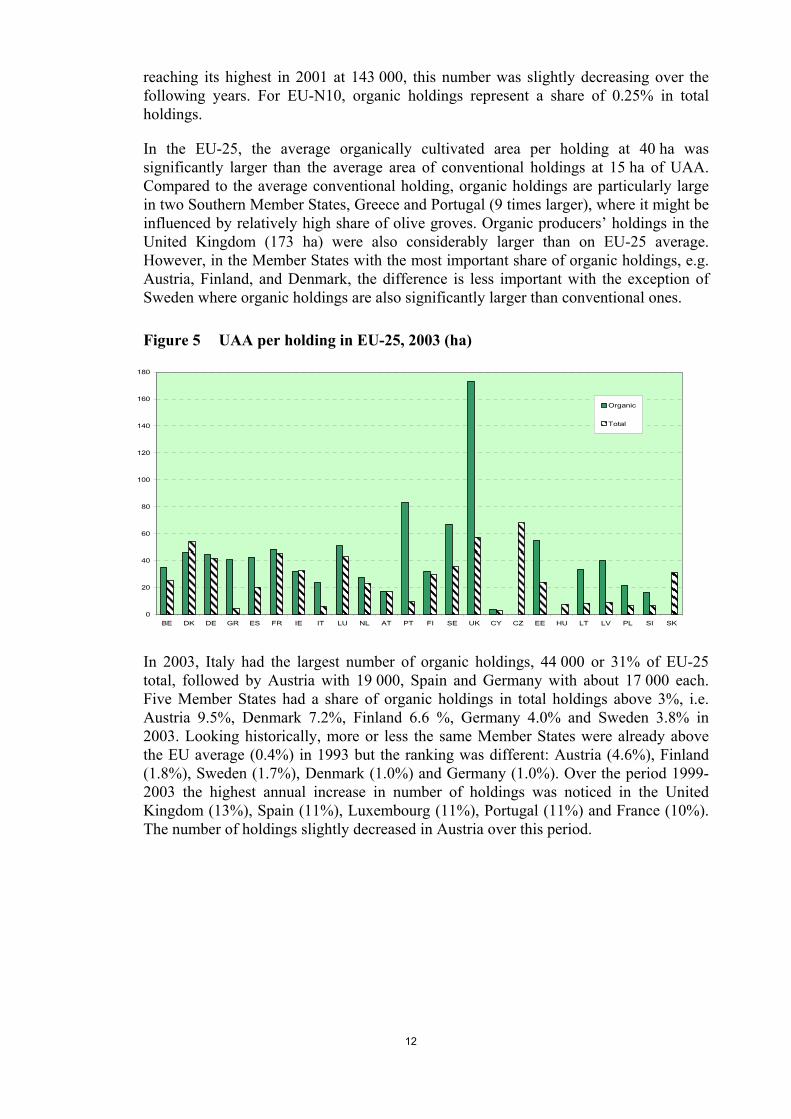
In the EU-25, the average organically cultivated area per holding at 40 ha was significantly larger than the average area of conventional holdings at 15 ha of UAA. Compared to the average conventional holding, organic holdings are particularly large in two Southern Member States, Greece and Portugal (9 times larger), where it might be influenced by relatively high share of olive groves. Organic producers’ holdings in the United Kingdom (173 ha) were also considerably larger than on EU-25 average. However, in the Member States with the most important share of organic holdings, e.g. Austria, Finland, and Denmark, the difference is less important with the exception of Sweden where organic holdings are also significantly larger than conventional ones.
Figure 5 UAA per holding in EU-25, 2003 (ha)
0
20
40
60
80
100
120
140
160
180
BE DK DE GR ES FR IE IT LU NL AT PT FI SE UK CY CZ EE HU LT LV PL SI SK
Organic
Total
In 2003, Italy had the largest number of organic holdings, 44 000 or 31% of EU-25 total, followed by Austria with 19 000, Spain and Germany with about 17 000 each. Five Member States had a share of organic holdings in total holdings above 3%, i.e. Austria 9.5%, Denmark 7.2%, Finland 6.6 %, Germany 4.0% and Sweden 3.8% in 2003. Looking historically, more or less the same Member States were already above the EU average (0.4%) in 1993 but the ranking was different: Austria (4.6%), Finland (1.8%), Sweden (1.7%), Denmark (1.0%) and Germany (1.0%). Over the period 1999-2003 the highest annual increase in number of holdings was noticed in the United Kingdom (13%), Spain (11%), Luxembourg (11%), Portugal (11%) and France (10%). The number of holdings slightly decreased in Austria over this period.
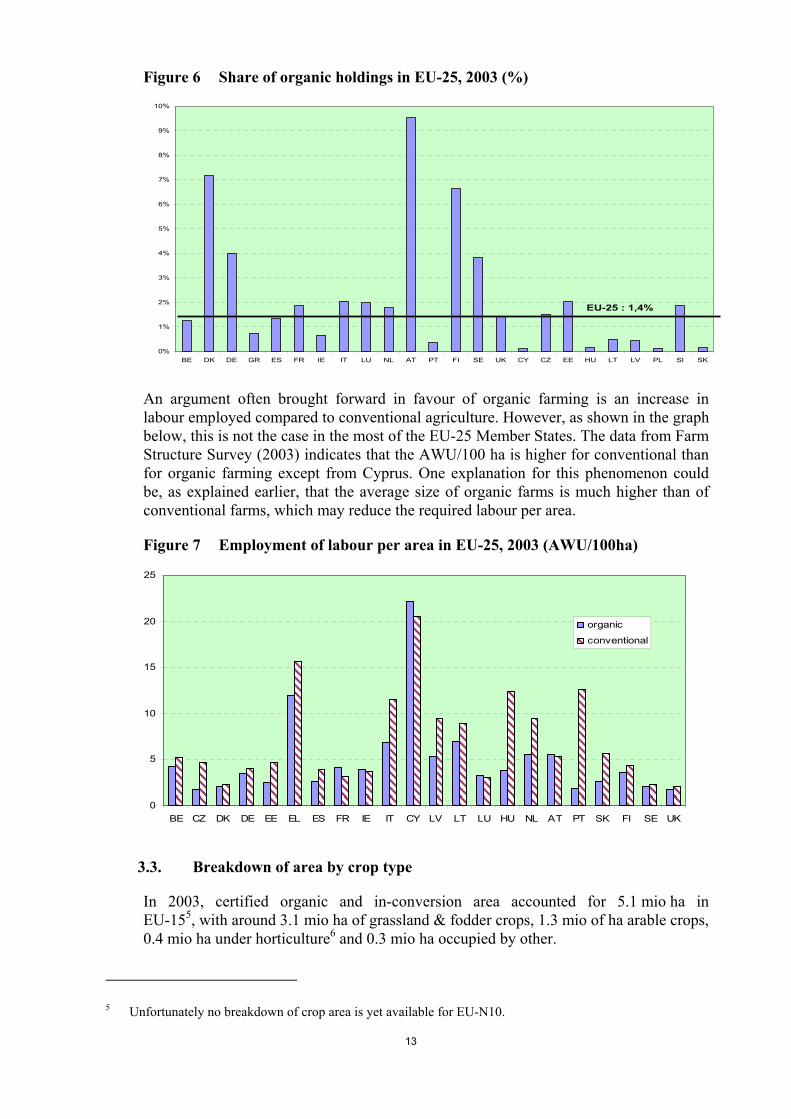
13
Figure 6 Share of organic holdings in EU-25, 2003 (%)
0%
1%
2%
3%
4%
5%
6%
7%
8%
9%
10%
BE DK DE GR ES FR IE IT LU NL AT PT FI SE UK CY CZ EE HU LT LV PL SI SK
EU-25 : 1,4%
An argument often brought forward in favour of organic farming is an increase in labour employed compared to conventional agriculture. However, as shown in the graph below, this is not the case in the most of the EU-25 Member States. The data from Farm Structure Survey (2003) indicates that the AWU/100 ha is higher for conventional than for organic farming except from Cyprus. One explanation for this phenomenon could be, as explained earlier, that the average size of organic farms is much higher than of conventional farms, which may reduce the required labour per area.
Figure 7 Employment of labour per area in EU-25, 2003 (AWU/100ha)
0
5
10
15
20
25
BE CZ DK DE EE EL ES FR IE IT CY LV LT LU HU NL AT PT SK FI SE UK
organic
conventional
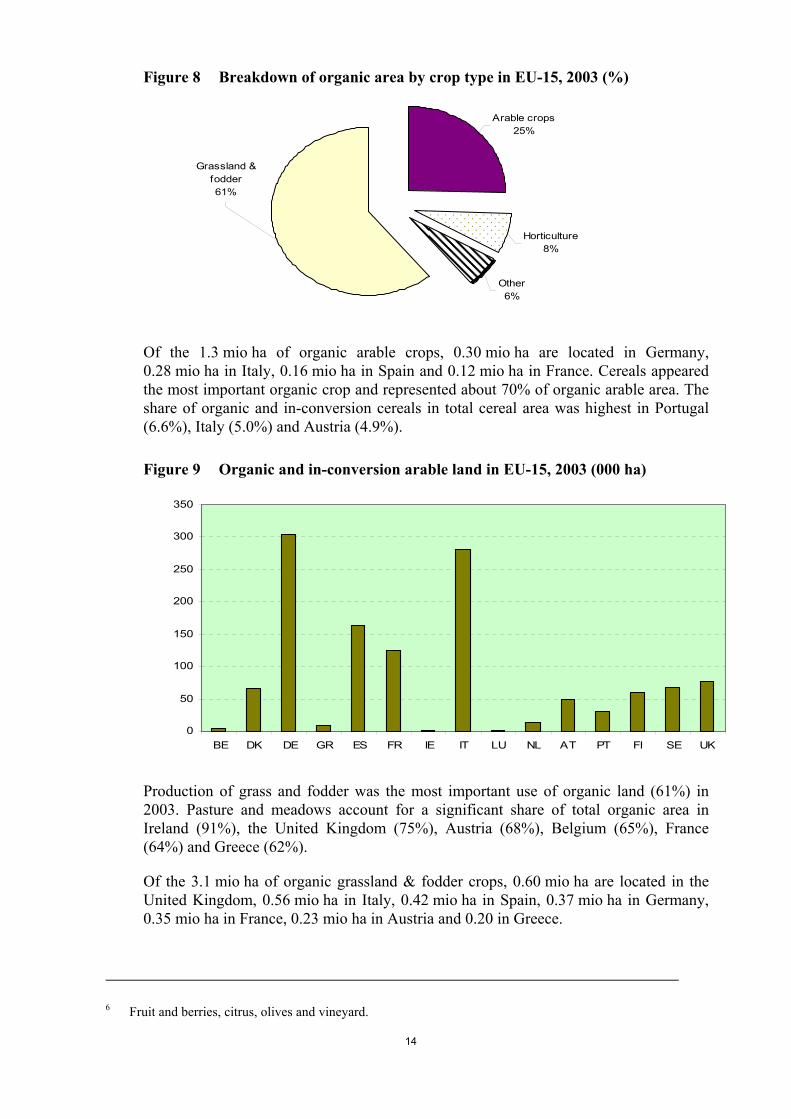
3.3. Breakdown of area by crop type
In 2003, certified organic and in-conversion area accounted for 5.1 mio ha in EU-155, with around 3.1 mio ha of grassland & fodder crops, 1.3 mio of ha arable crops, 0.4 mio ha under horticulture6 and 0.3 mio ha occupied by other.
5 Unfortunately no breakdown of crop area is yet available for EU-N10.
14
Figure 8 Breakdown of organic area by crop type in EU-15, 2003 (%)
Grassland & fodder61%
Other6%
Horticulture8%
Arable crops25%
Of the 1.3 mio ha of organic arable crops, 0.30 mio ha are located in Germany, 0.28 mio ha in Italy, 0.16 mio ha in Spain and 0.12 mio ha in France. Cereals appeared the most important organic crop and represented about 70% of organic arable area. The share of organic and in-conversion cereals in total cereal area was highest in Portugal (6.6%), Italy (5.0%) and Austria (4.9%).
Figure 9 Organic and in-conversion arable land in EU-15, 2003 (000 ha)
0
50
100
150
200
250
300
350
BE DK DE GR ES FR IE IT LU NL AT PT FI SE UK
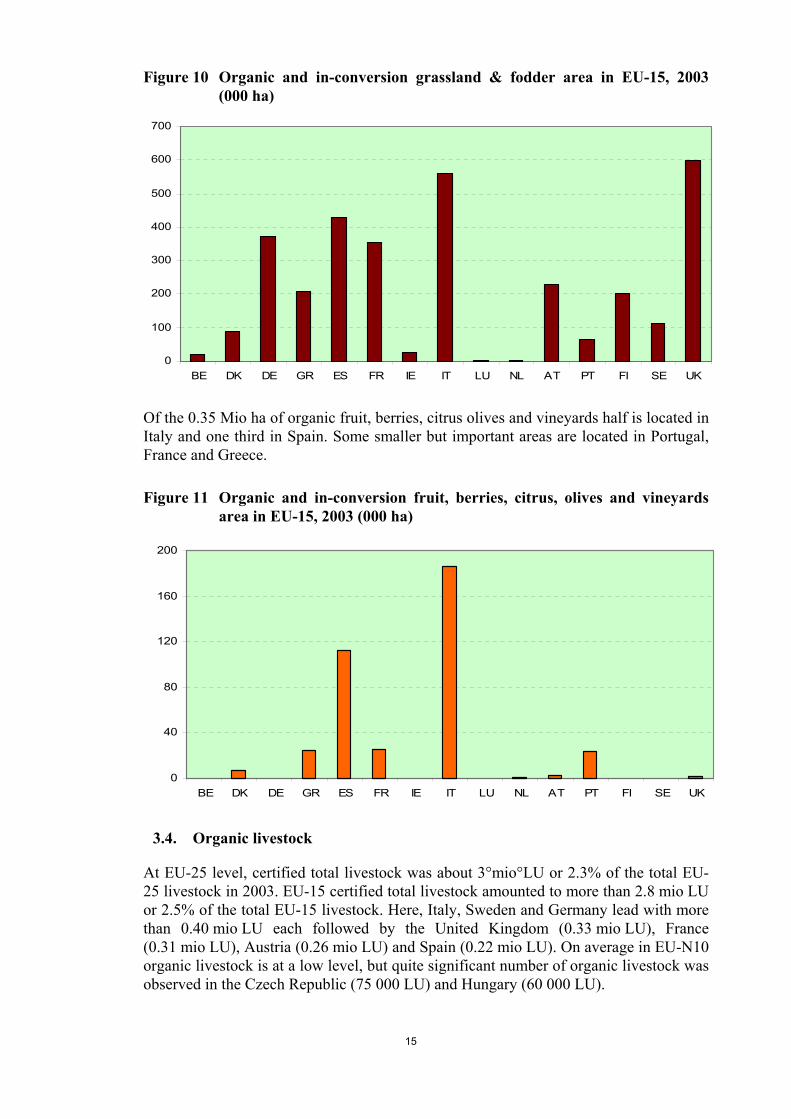
Production of grass and fodder was the most important use of organic land (61%) in 2003. Pasture and meadows account for a significant share of total organic area in Ireland (91%), the United Kingdom (75%), Austria (68%), Belgium (65%), France (64%) and Greece (62%).
Of the 3.1 mio ha of organic grassland & fodder crops, 0.60 mio ha are located in the United Kingdom, 0.56 mio ha in Italy, 0.42 mio ha in Spain, 0.37 mio ha in Germany, 0.35 mio ha in France, 0.23 mio ha in Austria and 0.20 in Greece.
6 Fruit and berries, citrus, olives and vineyard.
15
Figure 10 Organic and in-conversion grassland & fodder area in EU-15, 2003 (000 ha)
0
100
200
300
400
500
600
700
BE DK DE GR ES FR IE IT LU NL AT PT FI SE UK
Of the 0.35 Mio ha of organic fruit, berries, citrus olives and vineyards half is located in Italy and one third in Spain. Some smaller but important areas are located in Portugal, France and Greece.
Figure 11 Organic and in-conversion fruit, berries, citrus, olives and vineyards area in EU-15, 2003 (000 ha)
0
40
80
120
160
200
BE DK DE GR ES FR IE IT LU NL AT PT FI SE UK
3.4. Organic livestock
At EU-25 level, certified total livestock was about 3°mio°LU or 2.3% of the total EU-25 livestock in 2003. EU-15 certified total livestock amounted to more than 2.8 mio LU or 2.5% of the total EU-15 livestock. Here, Italy, Sweden and Germany lead with more than 0.40 mio LU each followed by the United Kingdom (0.33 mio LU), France (0.31 mio LU), Austria (0.26 mio LU) and Spain (0.22 mio LU). On average in EU-N10 organic livestock is at a low level, but quite significant number of organic livestock was observed in the Czech Republic (75 000 LU) and Hungary (60 000 LU).
16
Figure 12 Certified livestock units (LU) in EU-25, 2003 (000)
0
50
100
150
200
250
300
350
400
450
BE CZ DK DE EE EL ES FR IE IT CY LV LT LU HU NL AT PT SK FI SE UK
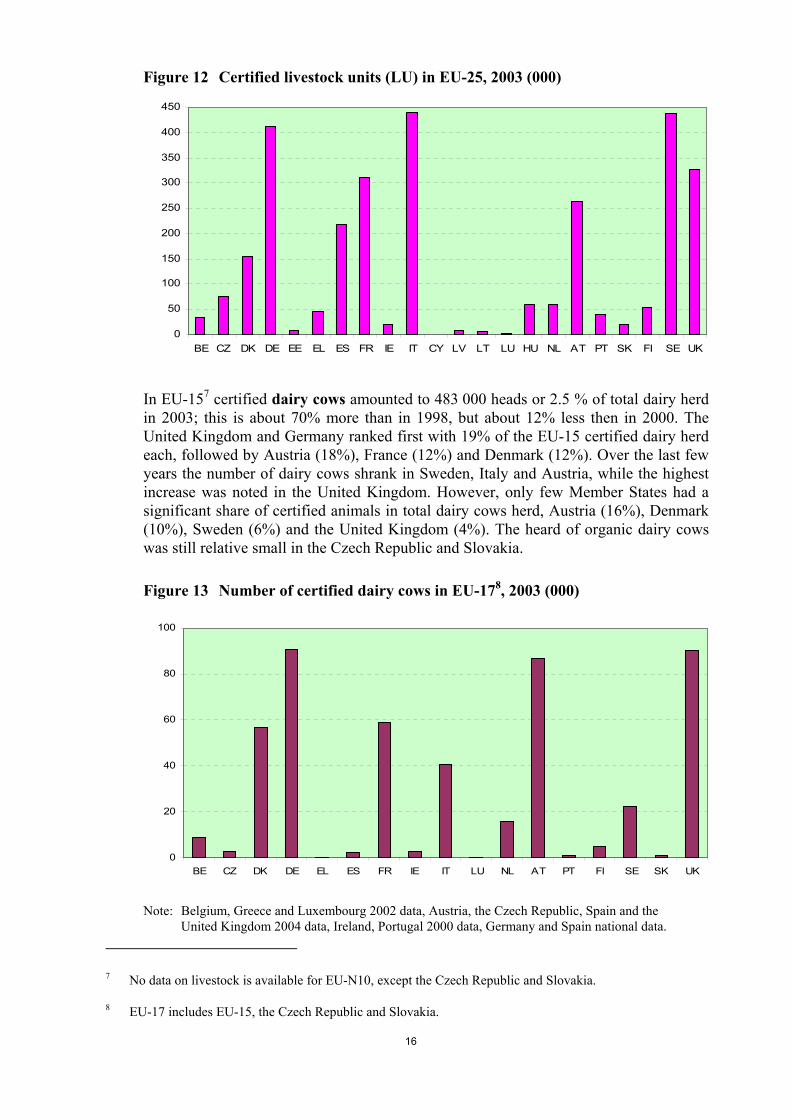
In EU-157 certified dairy cows amounted to 483 000 heads or 2.5 % of total dairy herd in 2003; this is about 70% more than in 1998, but about 12% less then in 2000. The United Kingdom and Germany ranked first with 19% of the EU-15 certified dairy herd each, followed by Austria (18%), France (12%) and Denmark (12%). Over the last few years the number of dairy cows shrank in Sweden, Italy and Austria, while the highest increase was noted in the United Kingdom. However, only few Member States had a significant share of certified animals in total dairy cows herd, Austria (16%), Denmark (10%), Sweden (6%) and the United Kingdom (4%). The heard of organic dairy cows was still relative small in the Czech Republic and Slovakia.
Figure 13 Number of certified dairy cows in EU-178, 2003 (000)
0
20
40
60
80
100
BE CZ DK DE EL ES FR IE IT LU NL AT PT FI SE SK UK
Note: Belgium, Greece and Luxembourg 2002 data, Austria, the Czech Republic, Spain and the United Kingdom 2004 data, Ireland, Portugal 2000 data, Germany and Spain national data.
7 No data on livestock is available for EU-N10, except the Czech Republic and Slovakia.
8 EU-17 includes EU-15, the Czech Republic and Slovakia.
17
In 2003, EU-15 certified other cattle (mainly suckler cows) amounted to about 1 mio heads or 1.7% of total cattle (non-dairy) herd. Austria ranks first with 25% of EU-15 certified non-dairy herd, followed by Italy with 15%, the United Kingdom with 13%, Germany with 12% each. Some Member States had a significant share of certified organic animals in total Austria with 16%, Denmark with 7% and Sweden with 6%, Italy and Greece with 3% each. The number of certified non-dairy cattle is relative high in the Czech Republic.
Figure 14 Number of certified non-dairy cattle in EU-17, 2003 (000)
0
50
100
150
200
250
BE CZ DK DE EL ES FR IE IT LU NL AT PT FI SE SK UK
Note: The Czech Republic and Spain 2004, Ireland 2000 data, France, Germany and Spain national data.
In 2003, EU-15 certified pigs amounted to 450 000 head or about 0.4% of total pig herd. Only a few Member States had a significant share of certified animals, Germany with 8% and France with 4%. The number of certified pigs is still relative low. The relative slow development may be linked with higher production costs in organic pig meat production, which few consumers are willing to pay.
Figure 15 Number of certified pigs in EU-17, 2003 (000)
0
10
20
30
40
50
60
70
80
90
BE CZ DK DE EL ES FR IE IT LU NL AT PT FI SE UK
Note: Luxembourg 2002 data, Austria, the Czech Republic and Spain 2004 data, France and Ireland 2000 data, no data available for Slovakia, Germany and Spain national data.
18
In 2003, EU-15 certified broiler and laying hens number amounted to more than 9 and 6 mio respectively, France ranked first with 5.1 mio for broilers and the United Kingdom (1.4 mio) and France (1.3 mio) for laying hens. Looking at the share of certified laying hens in the total number of hens, on EU-15 average is was about 1.7%, whereas Denmark had much more significant share of certified hens (22%), followed by Sweden (7%), Austria (6%) and Luxembourg (4%).
Figure 16 Number of certified broilers and hens in EU-15, 2003 (mio)
0
1
2
3
4
5
6
BE DK DE EL ES FR IE IT LU NL AT PT FI SE UK
Broilers
Hens
Note: Luxembourg, the Netherlands and Finland 2002 data, Austria and Ireland 2000 data, France 2004
data, Germany and Portugal national data.
In 2003, EU-15 certified sheep & goats amounted to 2.4 Mio heads or 2.4% of total sheep & goats herd. Of the about 2 Mio certified sheep, 35% are located in the United Kingdom, 21% in Italy and 11% in Germany. Of the 380 000 certified goats, 49% are located in Greece and 26% in Italy. Three Member States had a share of certified sheep & goats above 10%: Denmark (14%), Germany (11%) and Sweden (10%). Finland (6%), Italy (6%) and Belgium (5%) also had quite significant share of certified sheep & goat in total.
19
Figure 17 Number of certified sheep & goats in EU-15, 2003 (000)
0
100
200
300
400
500
600
700
800
BE DK DE EL ES FR IE IT LU NL AT PT FI SE UK
Note: Luxembourg and Austria 2002 data, Spain 2004 data, Ireland 2000 data, Germany, France and
Spain national data.
4. MARKETING OF ORGANIC PRODUCTS
4.1. Processors of organic products
In 2003, the total number of registered operators (producers, processors and importers) in EU-159 was about 157 000 which represent an increase of one third compared to 1998.
The number of registered organic producers increased from 100 000 in 1998 to 135 000 in 2003, and represents since 2000 about 2% of all agricultural producers. Austria registers the largest share of organic producers (10%), followed by Denmark and Finland (each 7%) and Sweden (5%). Looking at the share of each country in the EU-15 organic producers number, Italy accounted for the largest share (33%), followed by Austria (14%), Spain (13%), Germany (12%) and France (9%).
The number of organic processors reached about 25 000 in EU-15 in 2003. Particularly dynamic increases have been observed in Greece, Ireland, Portugal, Belgium, Italy and Spain even if starting from a very low level. Italy (25%), Germany (22%) and France (19%) had the largest absolute number of organic processors in EU-15. The range of processors is wide, from small family-run bakeries to large companies which also ensure that organic production in non-EU countries comply with EU norms.
9 Some of the data are preliminary. No data is available for EU-N10, except the Czech Republic and
Slovakia.
20
Figure 18 Number of organic producers and processors in EU-17, 2003 (000)
0
5
10
15
20
25
30
35
40
45
BE CZ DK DE GR ES FR IE IT LU NL AT PT FI SE SK UK
Producers
Processors
In 2003, there were about 1400 registered importers of organic products in EU-15, an increase of 160% compared to 1998. Germany ranked first with about 35% of the total importers of organic products, followed by Sweden (18%) and Italy (13%).
4.2. Retail sales of organic products
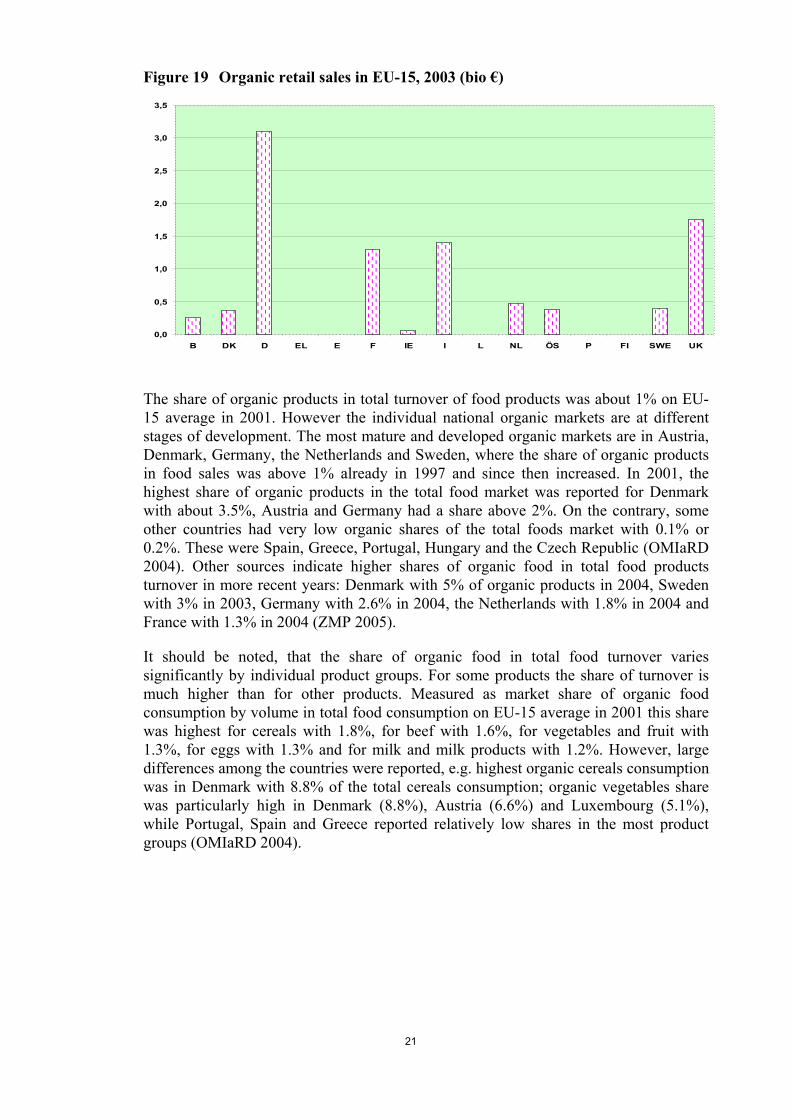
In 2004, the EU market for organic products is estimated to represent about 11 bio €, for comparison the EU-15 final agricultural production was 225 bio € in 2004. Germany was the largest national market in Europe with a share of about 30% of the total EU market volume (3.5 bio €), national markets with organic products sales of more than one billion Euro are in the United Kingdom (1.6 bio €), Italy (1.4 bio €) and France (1.2 bio €).
Denmark ranks first with an average consumer spending per capita of more than 60 €, followed by Sweden (45 €), Austria (41 €) and Germany (about 40 €). In many other EU countries average consumer spending for organic products was over 20 €: Belgium (29 €), the Netherlands (26 €), France (25 €), the United Kingdom (24 €) and Italy (24 €) (FiBL 2004).
21
Figure 19 Organic retail sales in EU-15, 2003 (bio €)
0,0
0,5
1,0
1,5
2,0
2,5
3,0
3,5
B DK D EL E F IE I L NL ÖS P FI SWE UK
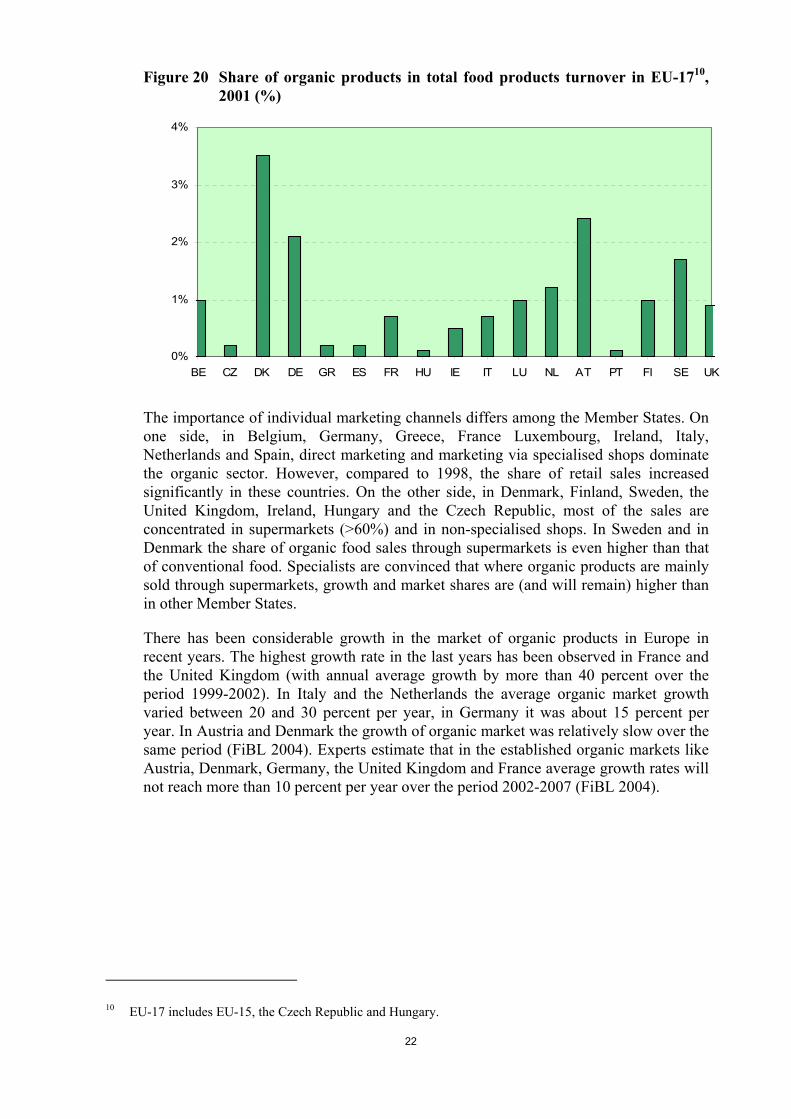
The share of organic products in total turnover of food products was about 1% on EU-15 average in 2001. However the individual national organic markets are at different stages of development. The most mature and developed organic markets are in Austria, Denmark, Germany, the Netherlands and Sweden, where the share of organic products in food sales was above 1% already in 1997 and since then increased. In 2001, the highest share of organic products in the total food market was reported for Denmark with about 3.5%, Austria and Germany had a share above 2%. On the contrary, some other countries had very low organic shares of the total foods market with 0.1% or 0.2%. These were Spain, Greece, Portugal, Hungary and the Czech Republic (OMIaRD 2004). Other sources indicate higher shares of organic food in total food products turnover in more recent years: Denmark with 5% of organic products in 2004, Sweden with 3% in 2003, Germany with 2.6% in 2004, the Netherlands with 1.8% in 2004 and France with 1.3% in 2004 (ZMP 2005).
It should be noted, that the share of organic food in total food turnover varies significantly by individual product groups. For some products the share of turnover is much higher than for other products. Measured as market share of organic food consumption by volume in total food consumption on EU-15 average in 2001 this share was highest for cereals with 1.8%, for beef with 1.6%, for vegetables and fruit with 1.3%, for eggs with 1.3% and for milk and milk products with 1.2%. However, large differences among the countries were reported, e.g. highest organic cereals consumption was in Denmark with 8.8% of the total cereals consumption; organic vegetables share was particularly high in Denmark (8.8%), Austria (6.6%) and Luxembourg (5.1%), while Portugal, Spain and Greece reported relatively low shares in the most product groups (OMIaRD 2004).
22
Figure 20 Share of organic products in total food products turnover in EU-1710, 2001 (%)
0%
1%
2%
3%
4%
BE CZ DK DE GR ES FR HU IE IT LU NL AT PT FI SE UK
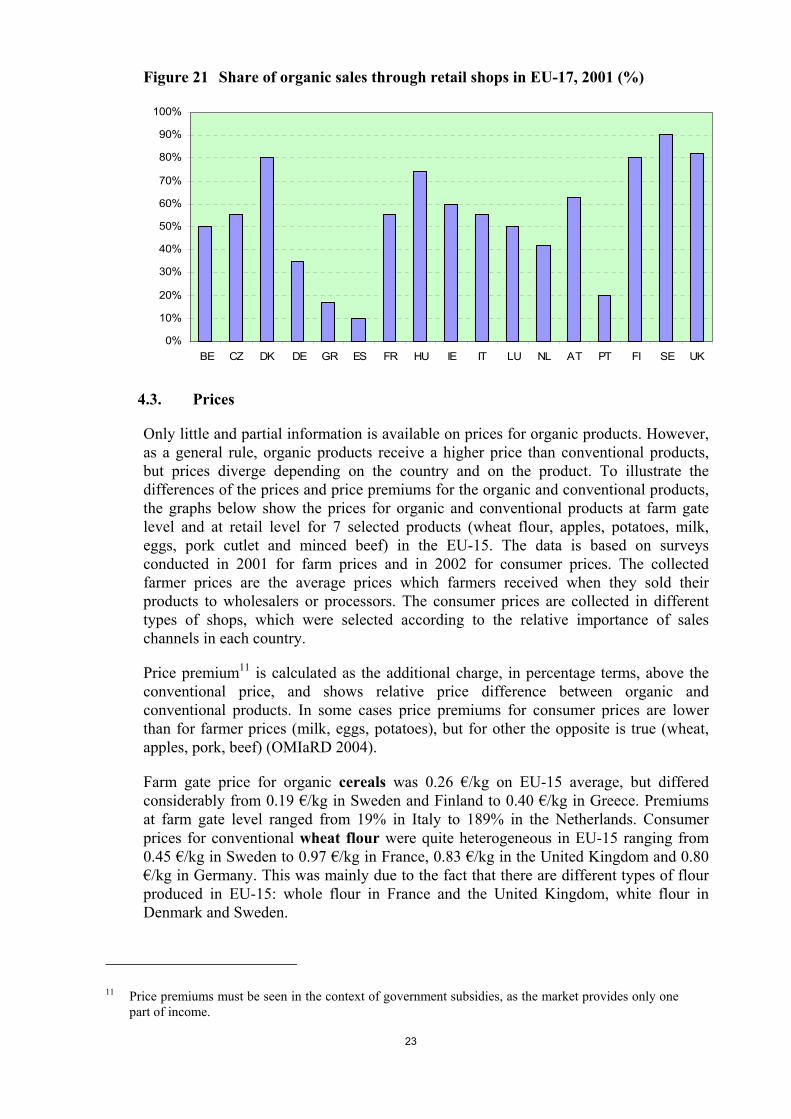
The importance of individual marketing channels differs among the Member States. On one side, in Belgium, Germany, Greece, France Luxembourg, Ireland, Italy, Netherlands and Spain, direct marketing and marketing via specialised shops dominate the organic sector. However, compared to 1998, the share of retail sales increased significantly in these countries. On the other side, in Denmark, Finland, Sweden, the United Kingdom, Ireland, Hungary and the Czech Republic, most of the sales are concentrated in supermarkets (>60%) and in non-specialised shops. In Sweden and in Denmark the share of organic food sales through supermarkets is even higher than that of conventional food. Specialists are convinced that where organic products are mainly sold through supermarkets, growth and market shares are (and will remain) higher than in other Member States.
There has been considerable growth in the market of organic products in Europe in recent years. The highest growth rate in the last years has been observed in France and the United Kingdom (with annual average growth by more than 40 percent over the period 1999-2002). In Italy and the Netherlands the average organic market growth varied between 20 and 30 percent per year, in Germany it was about 15 percent per year. In Austria and Denmark the growth of organic market was relatively slow over the same period (FiBL 2004). Experts estimate that in the established organic markets like Austria, Denmark, Germany, the United Kingdom and France average growth rates will not reach more than 10 percent per year over the period 2002-2007 (FiBL 2004).
10 EU-17 includes EU-15, the Czech Republic and Hungary.
23
Figure 21 Share of organic sales through retail shops in EU-17, 2001 (%)
0%
10%
20%
30%
40%
50%
60%
70%
80%
90%
100%
BE CZ DK DE GR ES FR HU IE IT LU NL AT PT FI SE UK
4.3. Prices
Only little and partial information is available on prices for organic products. However, as a general rule, organic products receive a higher price than conventional products, but prices diverge depending on the country and on the product. To illustrate the differences of the prices and price premiums for the organic and conventional products, the graphs below show the prices for organic and conventional products at farm gate level and at retail level for 7 selected products (wheat flour, apples, potatoes, milk, eggs, pork cutlet and minced beef) in the EU-15. The data is based on surveys conducted in 2001 for farm prices and in 2002 for consumer prices. The collected farmer prices are the average prices which farmers received when they sold their products to wholesalers or processors. The consumer prices are collected in different types of shops, which were selected according to the relative importance of sales channels in each country.
Price premium11 is calculated as the additional charge, in percentage terms, above the conventional price, and shows relative price difference between organic and conventional products. In some cases price premiums for consumer prices are lower than for farmer prices (milk, eggs, potatoes), but for other the opposite is true (wheat, apples, pork, beef) (OMIaRD 2004).
Farm gate price for organic cereals was 0.26 €/kg on EU-15 average, but differed considerably from 0.19 €/kg in Sweden and Finland to 0.40 €/kg in Greece. Premiums at farm gate level ranged from 19% in Italy to 189% in the Netherlands. Consumer prices for conventional wheat flour were quite heterogeneous in EU-15 ranging from 0.45 €/kg in Sweden to 0.97 €/kg in France, 0.83 €/kg in the United Kingdom and 0.80 €/kg in Germany. This was mainly due to the fact that there are different types of flour produced in EU-15: whole flour in France and the United Kingdom, white flour in Denmark and Sweden.
11 Price premiums must be seen in the context of government subsidies, as the market provides only one
part of income.
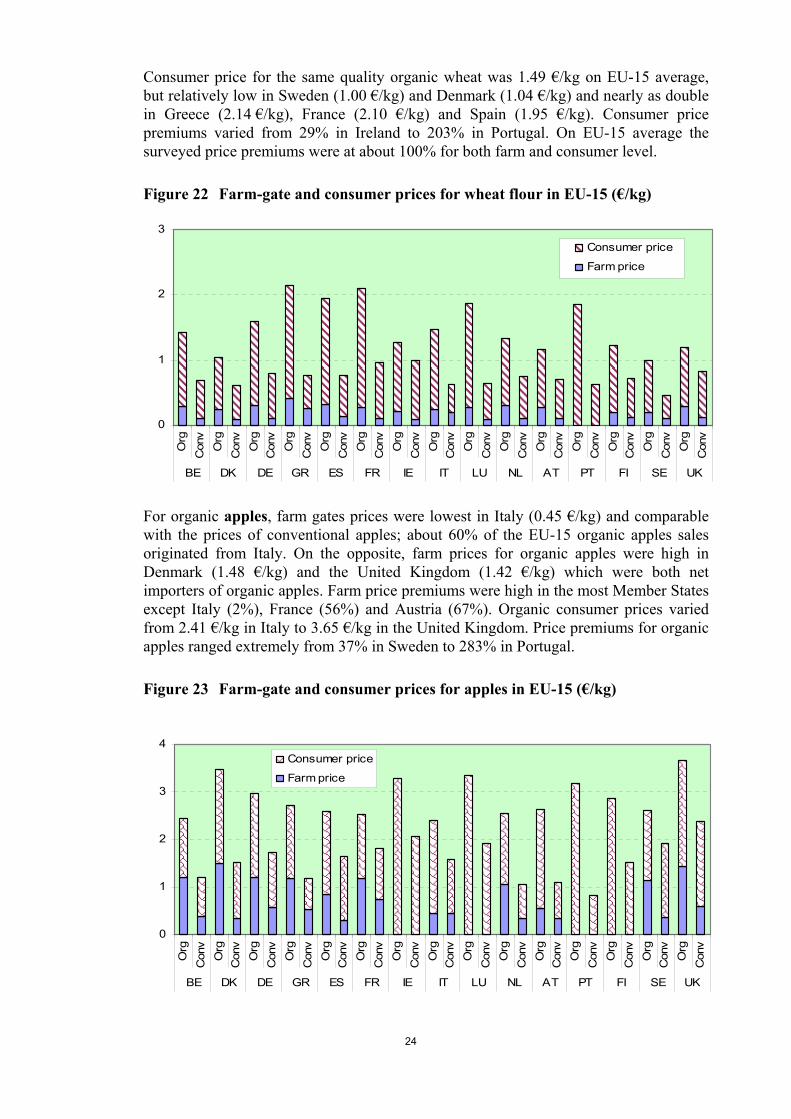
24
Consumer price for the same quality organic wheat was 1.49 €/kg on EU-15 average, but relatively low in Sweden (1.00 €/kg) and Denmark (1.04 €/kg) and nearly as double in Greece (2.14 €/kg), France (2.10 €/kg) and Spain (1.95 €/kg). Consumer price premiums varied from 29% in Ireland to 203% in Portugal. On EU-15 average the surveyed price premiums were at about 100% for both farm and consumer level.
Figure 22 Farm-gate and consumer prices for wheat flour in EU-15 (€/kg)
0
1
2
3
Org
Con
vO
rgC
onv
Org
Con
vO
rgC
onv
Org
Con
vO
rgC
onv
Org
Con
vO
rgC
onv
Org
Con
vO
rgC
onv
Org
Con
vO
rgC
onv
Org
Con
vO
rgC
onv
Org
Con
v
BE DK DE GR ES FR IE IT LU NL AT PT FI SE UK
Consumer price
Farm price
For organic apples, farm gates prices were lowest in Italy (0.45 €/kg) and comparable with the prices of conventional apples; about 60% of the EU-15 organic apples sales originated from Italy. On the opposite, farm prices for organic apples were high in Denmark (1.48 €/kg) and the United Kingdom (1.42 €/kg) which were both net importers of organic apples. Farm price premiums were high in the most Member States except Italy (2%), France (56%) and Austria (67%). Organic consumer prices varied from 2.41 €/kg in Italy to 3.65 €/kg in the United Kingdom. Price premiums for organic apples ranged extremely from 37% in Sweden to 283% in Portugal.
Figure 23 Farm-gate and consumer prices for apples in EU-15 (€/kg)
0
1
2
3
4
Org
Con
vO
rgC
onv
Org
Con
vO
rgC
onv
Org
Con
vO
rgC
onv
Org
Con
vO
rgC
onv
Org
Con
vO
rgC
onv
Org
Con
vO
rgC
onv
Org
Con
vO
rgC
onv
Org
Con
v
BE DK DE GR ES FR IE IT LU NL AT PT FI SE UK
Consumer price
Farm price
25
The graph below shows that the highest price of organic potatoes at farm gate level was in Ireland (0.70 €/kg), Greece (0.64 €/kg) and Italy (0.55 €/kg) whereas the price was relatively low in Denmark (0.24 €/kg), Germany (0.25 €/kg) and Belgium (0.26 €/kg). Farm price premium for organic potatoes ranged from 71% in Sweden to 293% in Italy and 285% in Austria while on EU-15 average organic potatoes were about 166% more expensive than conventional potatoes. The high price premiums in Italy and Austria could be explained with a relatively low farm price for conventional potatoes compared to other Member States.
The highest consumer prices were paid in Ireland and Luxembourg nearly as double as in other countries like Sweden, Finland and the Netherlands. Organic consumer price premium was on average lower than the farm price premium for potatoes and ranged from 30% in Ireland to 170% in Greece.
Figure 24 Farm-gate and consumer prices for potatoes in EU-15 (€/kg)
0
1
2
Org
Con
vO
rgC
onv
Org
Con
vO
rgC
onv
Org
Con
vO
rgC
onv
Org
Con
vO
rgC
onv
Org
Con
vO
rgC
onv
Org
Con
vO
rgC
onv
Org
Con
vO
rgC
onv
Org
Con
v
BE DK DE GR ES FR IE IT LU NL AT PT FI SE UK
Consumer price
Farm price
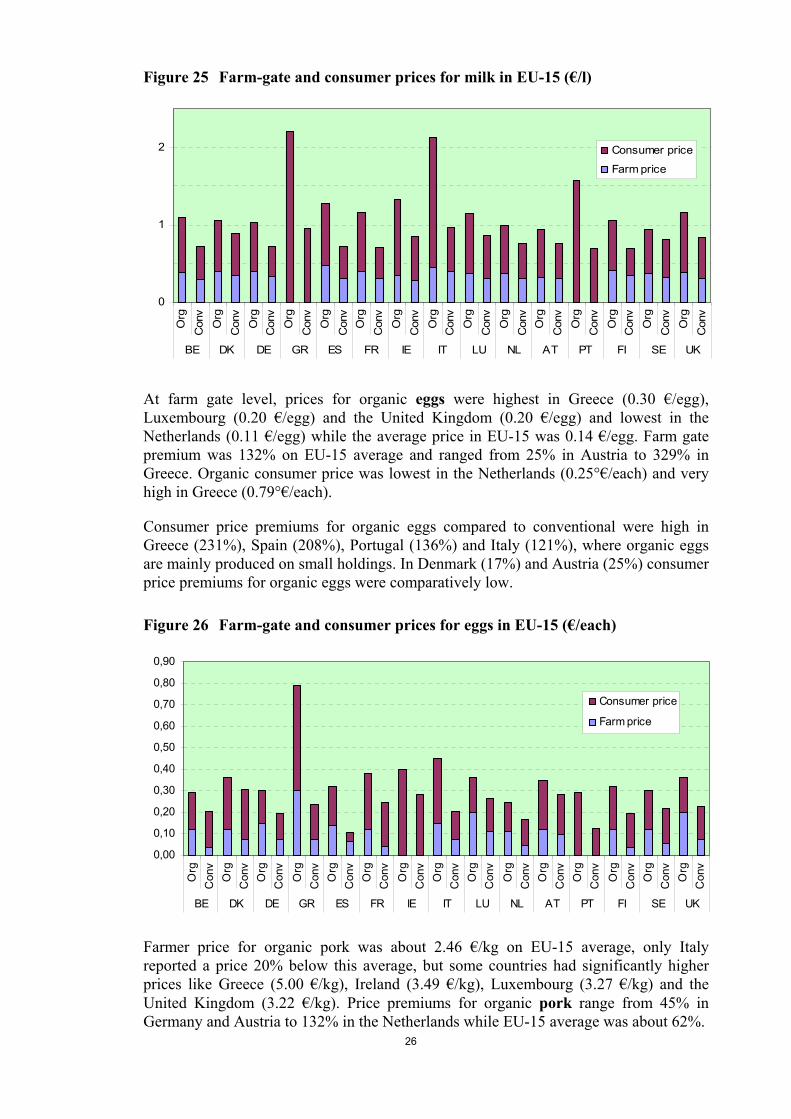
For organic milk, the highest farm gate prices were observed in Spain, Italy and Finland, while they were lowest in Austria and Ireland. The price premiums for organic milk varied from 6% in Austria to 58% in Spain. On EU-15 average it was about 18% which was relatively low compared with other surveyed products and could be explained by the fact that only 70% of organic milk was sold as organic on EU-15 average. Consumer prices for organic milk were highest in Greece (2.20 €/l), Italy (1.12°€/l) and Portugal (1.57 €/l) and lowest in Austria (0.94 €/l), Sweden (0.95 €/l) and the Netherlands (1.00 €/l).
Again, the consumer price premiums were high in Greece (129%), Portugal (124%) and Italy (117%), which could be explained by a relatively small organic production in these countries, and therefore high collecting and processing costs for organic milk. On EU-15 average the consumer price premium for organic milk was about 50%.
26
Figure 25 Farm-gate and consumer prices for milk in EU-15 (€/l)
0
1
2
Org
Con
vO
rgC
onv
Org
Con
vO
rgC
onv
Org
Con
vO
rgC
onv
Org
Con
vO
rgC
onv
Org
Con
vO
rgC
onv
Org
Con
vO
rgC
onv
Org
Con
vO
rgC
onv
Org
Con
v
BE DK DE GR ES FR IE IT LU NL AT PT FI SE UK
Consumer price
Farm price
At farm gate level, prices for organic eggs were highest in Greece (0.30 €/egg), Luxembourg (0.20 €/egg) and the United Kingdom (0.20 €/egg) and lowest in the Netherlands (0.11 €/egg) while the average price in EU-15 was 0.14 €/egg. Farm gate premium was 132% on EU-15 average and ranged from 25% in Austria to 329% in Greece. Organic consumer price was lowest in the Netherlands (0.25°€/each) and very high in Greece (0.79°€/each).
Consumer price premiums for organic eggs compared to conventional were high in Greece (231%), Spain (208%), Portugal (136%) and Italy (121%), where organic eggs are mainly produced on small holdings. In Denmark (17%) and Austria (25%) consumer price premiums for organic eggs were comparatively low.
Figure 26 Farm-gate and consumer prices for eggs in EU-15 (€/each)
0,00
0,10
0,20
0,30
0,40
0,50
0,60
0,70
0,80
0,90
Org
Con
vO
rgC
onv
Org
Con
vO
rgC
onv
Org
Con
vO
rgC
onv
Org
Con
vO
rgC
onv
Org
Con
vO
rgC
onv
Org
Con
vO
rgC
onv
Org
Con
vO
rgC
onv
Org
Con
v
BE DK DE GR ES FR IE IT LU NL AT PT FI SE UK
Consumer price
Farm price
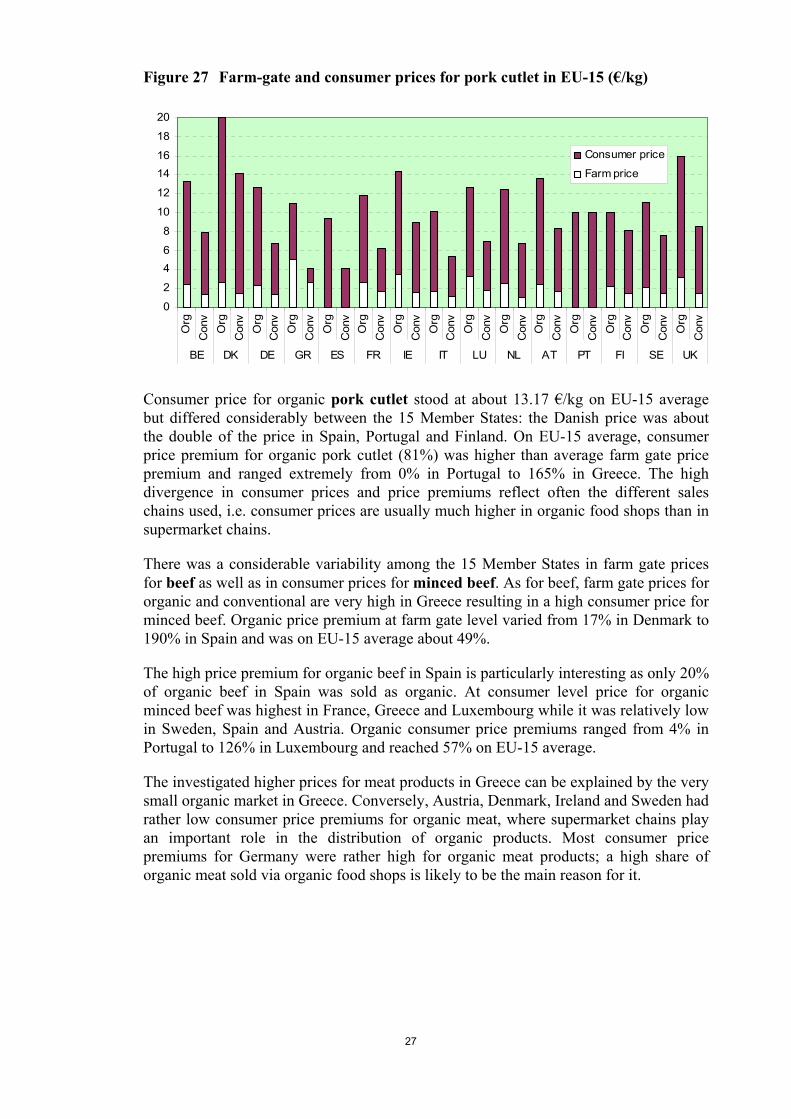
Farmer price for organic pork was about 2.46 €/kg on EU-15 average, only Italy reported a price 20% below this average, but some countries had significantly higher prices like Greece (5.00 €/kg), Ireland (3.49 €/kg), Luxembourg (3.27 €/kg) and the United Kingdom (3.22 €/kg). Price premiums for organic pork range from 45% in Germany and Austria to 132% in the Netherlands while EU-15 average was about 62%.
27
Figure 27 Farm-gate and consumer prices for pork cutlet in EU-15 (€/kg)
0
2
46
8
10
12
1416
18
20
Org
Con
vO
rgC
onv
Org
Con
vO
rgC
onv
Org
Con
vO
rgC
onv
Org
Con
vO
rgC
onv
Org
Con
vO
rgC
onv
Org
Con
vO
rgC
onv
Org
Con
vO
rgC
onv
Org
Con
v
BE DK DE GR ES FR IE IT LU NL AT PT FI SE UK
Consumer price
Farm price
Consumer price for organic pork cutlet stood at about 13.17 €/kg on EU-15 average but differed considerably between the 15 Member States: the Danish price was about the double of the price in Spain, Portugal and Finland. On EU-15 average, consumer price premium for organic pork cutlet (81%) was higher than average farm gate price premium and ranged extremely from 0% in Portugal to 165% in Greece. The high divergence in consumer prices and price premiums reflect often the different sales chains used, i.e. consumer prices are usually much higher in organic food shops than in supermarket chains.
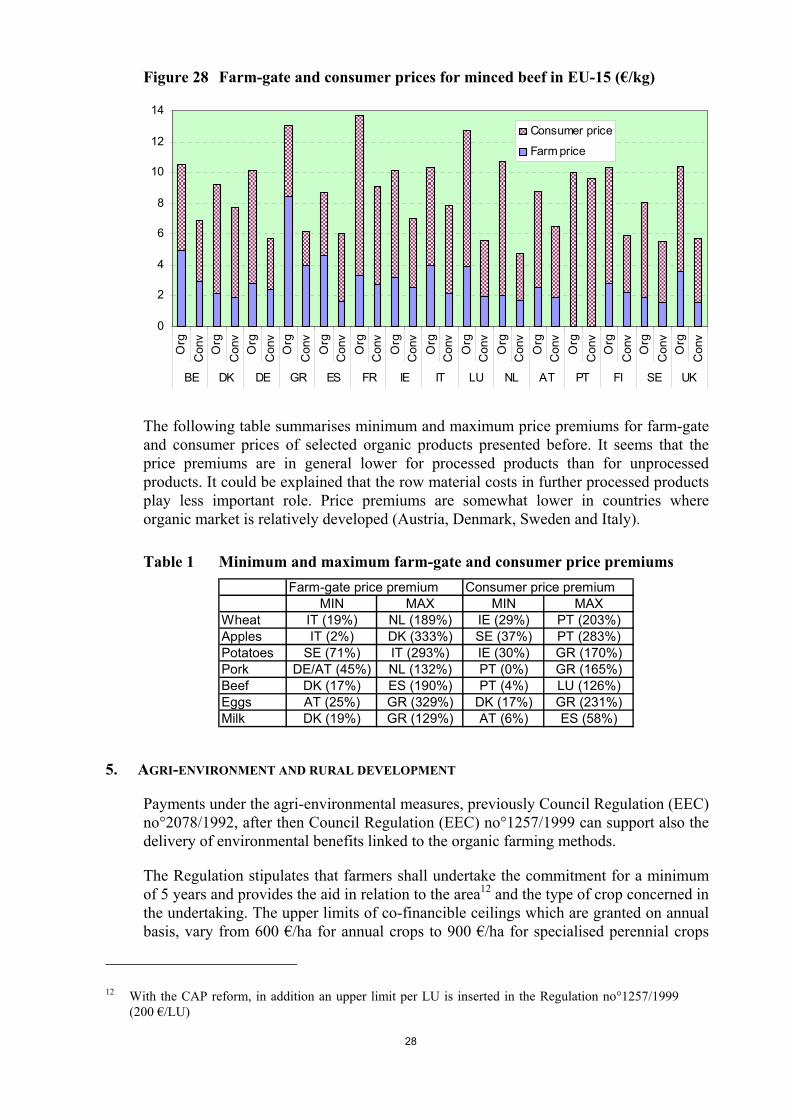
There was a considerable variability among the 15 Member States in farm gate prices for beef as well as in consumer prices for minced beef. As for beef, farm gate prices for organic and conventional are very high in Greece resulting in a high consumer price for minced beef. Organic price premium at farm gate level varied from 17% in Denmark to 190% in Spain and was on EU-15 average about 49%.
The high price premium for organic beef in Spain is particularly interesting as only 20% of organic beef in Spain was sold as organic. At consumer level price for organic minced beef was highest in France, Greece and Luxembourg while it was relatively low in Sweden, Spain and Austria. Organic consumer price premiums ranged from 4% in Portugal to 126% in Luxembourg and reached 57% on EU-15 average.
The investigated higher prices for meat products in Greece can be explained by the very small organic market in Greece. Conversely, Austria, Denmark, Ireland and Sweden had rather low consumer price premiums for organic meat, where supermarket chains play an important role in the distribution of organic products. Most consumer price premiums for Germany were rather high for organic meat products; a high share of organic meat sold via organic food shops is likely to be the main reason for it.
28
Figure 28 Farm-gate and consumer prices for minced beef in EU-15 (€/kg)
0
2
4
6
8
10
12
14
Org
Con
vO
rgC
onv
Org
Con
vO
rgC
onv
Org
Con
vO
rgC
onv
Org
Con
vO
rgC
onv
Org
Con
vO
rgC
onv
Org
Con
vO
rgC
onv
Org
Con
vO
rgC
onv
Org
Con
v
BE DK DE GR ES FR IE IT LU NL AT PT FI SE UK
Consumer price
Farm price
The following table summarises minimum and maximum price premiums for farm-gate and consumer prices of selected organic products presented before. It seems that the price premiums are in general lower for processed products than for unprocessed products. It could be explained that the row material costs in further processed products play less important role. Price premiums are somewhat lower in countries where organic market is relatively developed (Austria, Denmark, Sweden and Italy).
Table 1 Minimum and maximum farm-gate and consumer price premiums Farm-gate price premium Consumer price premium
MIN MAX MIN MAXWheat IT (19%) NL (189%) IE (29%) PT (203%)Apples IT (2%) DK (333%) SE (37%) PT (283%)Potatoes SE (71%) IT (293%) IE (30%) GR (170%)Pork DE/AT (45%) NL (132%) PT (0%) GR (165%)Beef DK (17%) ES (190%) PT (4%) LU (126%)Eggs AT (25%) GR (329%) DK (17%) GR (231%)Milk DK (19%) GR (129%) AT (6%) ES (58%)
5. AGRI-ENVIRONMENT AND RURAL DEVELOPMENT
Payments under the agri-environmental measures, previously Council Regulation (EEC) no°2078/1992, after then Council Regulation (EEC) no°1257/1999 can support also the delivery of environmental benefits linked to the organic farming methods.
The Regulation stipulates that farmers shall undertake the commitment for a minimum of 5 years and provides the aid in relation to the area12 and the type of crop concerned in the undertaking. The upper limits of co-financible ceilings which are granted on annual basis, vary from 600 €/ha for annual crops to 900 €/ha for specialised perennial crops
12 With the CAP reform, in addition an upper limit per LU is inserted in the Regulation no°1257/1999
(200 €/LU)
29
and to 450 €/ha for other land uses under Regulation no°1257/1999 and are significantly higher than under Regulation no°2078/199213. Member States are allowed to exceed these ceilings if they declare this amount as state aid. Any payment shall be justified in terms of income forgone, the additional costs resulting from the undertaking, and the need to provide an incentive.
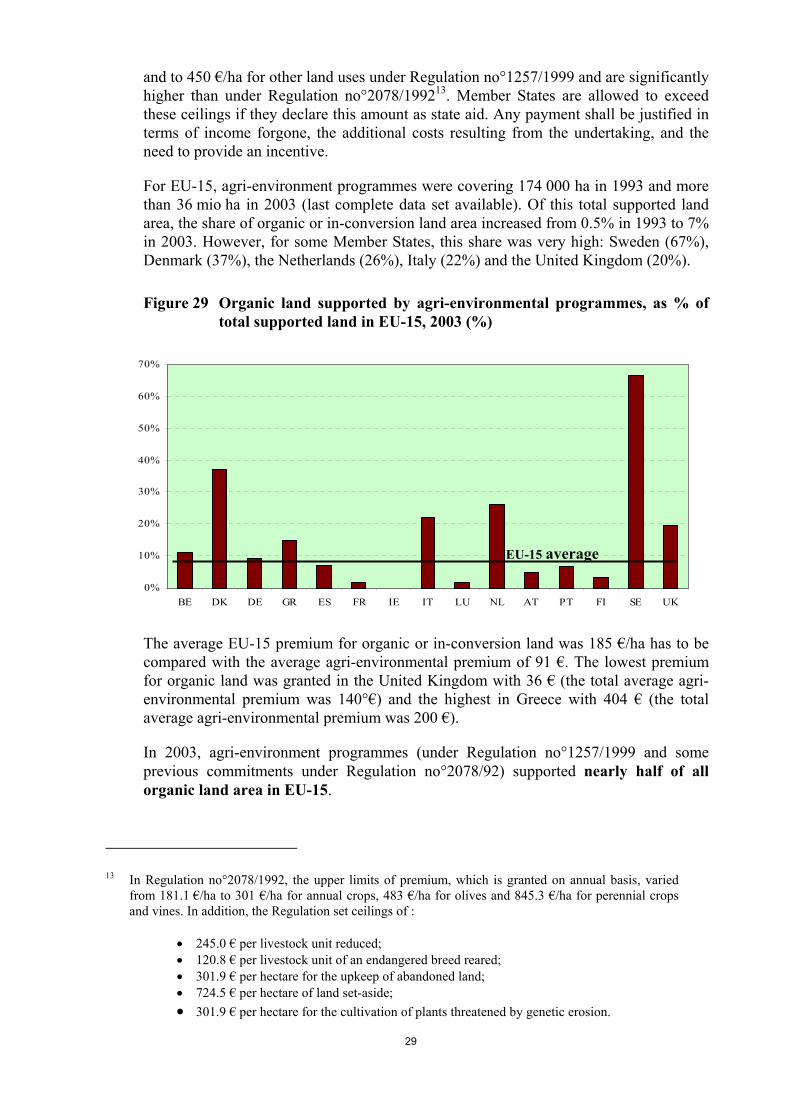
For EU-15, agri-environment programmes were covering 174 000 ha in 1993 and more than 36 mio ha in 2003 (last complete data set available). Of this total supported land area, the share of organic or in-conversion land area increased from 0.5% in 1993 to 7% in 2003. However, for some Member States, this share was very high: Sweden (67%), Denmark (37%), the Netherlands (26%), Italy (22%) and the United Kingdom (20%).
Figure 29 Organic land supported by agri-environmental programmes, as % of total supported land in EU-15, 2003 (%)
0%
10%
20%
30%
40%
50%
60%
70%
BE DK DE GR ES FR IE IT LU NL AT PT FI SE UK
The average EU-15 premium for organic or in-conversion land was 185 €/ha has to be compared with the average agri-environmental premium of 91 €. The lowest premium for organic land was granted in the United Kingdom with 36 € (the total average agri-environmental premium was 140°€) and the highest in Greece with 404 € (the total average agri-environmental premium was 200 €).
In 2003, agri-environment programmes (under Regulation no°1257/1999 and some previous commitments under Regulation no°2078/92) supported nearly half of all organic land area in EU-15.
13 In Regulation no°2078/1992, the upper limits of premium, which is granted on annual basis, varied
from 181.1 €/ha to 301 €/ha for annual crops, 483 €/ha for olives and 845.3 €/ha for perennial crops and vines. In addition, the Regulation set ceilings of :
• 245.0 € per livestock unit reduced; • 120.8 € per livestock unit of an endangered breed reared; • 301.9 € per hectare for the upkeep of abandoned land; • 724.5 € per hectare of land set-aside; • 301.9 € per hectare for the cultivation of plants threatened by genetic erosion.
EU-15 average
30
The number of organic and in-conversion holdings supported by agri-environment programmes increased from 82 000 in 1993 to about 86 000 in 2003 and represented about 64% of total organic holdings.