organic chemistry reactions
DESCRIPTION
Assignment for finding an unknown organic compound using experimental techniquesTRANSCRIPT

Abid Khan 2897438 | WEEK 3 & 5 FRIDAY 8AM
Determining the Identity of an Organic Compound through Functional Group Testing and
Spectral Analysis

Abid Khan 1
Abstract
The aim of this investigation was to determine the structure of a given unknown organic compound by
conducting functional group tests and deducing its identity through IR and NMR spectroscopy.
Functional group tests were conducted to identify a preliminary understanding of the functional groups
present. Infrared and Nuclear Magnetic Resonance Spectroscopy were used to further identify the
functional groups present and the compound’s carbon-hydrogen framework. Three potential
compounds, namely 2-pentanone, 3-pentanone and 1-pentanal, were listed as the possible unknown
compound. After observing the qualitative observations during the functional group tests and spectral
analysis, it was determined that the unknown compound was 2-pentanone.
Introduction/Aim
The study of organic-containing compounds and their properties is called organic chemistry. Organic
chemistry plays a vital role for understanding living systems. The synthetic fibres, plastics, artificial
sweeteners, and drugs that are an accepted part of modern life are products of organic chemistry
(Zumdahl, 2005). An important part of organic compounds are functional groups. A functional group
is a specific group of atoms within a molecules that is responsible for the characteristic chemical
reactions of that molecule (Marie, 2014). They are attached to the carbon backbone of organic molecules
and are far less stable than the carbon backbone so they are likely to participate in chemical reactions
(Fromm, 1997). Functional groups are important as a specific set of functional groups in any given
organic compound specifies its role and chemical behaviour (Dallas Learning Solutions, 2014).
Determining the structure of atoms and molecules of organic compounds can come from studying their
interaction with light (Michigan State University, 2000). Different regions of the electromagnetic
spectrum provide different kind of information as a result of such interactions. The three types of
spectroscopy that will be utilised in this investigation are infrared spectroscopy (IR), nuclear magnetic
resonance spectroscopy (NMR) and mass spectroscopy. The infrared region of the electromagnetic
spectrum covers the range from just above the visible range (7.8 × 10⁻⁷m) to 10-4m (McMurry, 2011).
Absorption of this lower energy radiation causes vibrational and rotational excitation of groups of atoms
within the molecule (Michigan State University, 2000). Since different functional groups have different
characteristic absorptions, identification of functional groups through IR spectroscopy is easily
accomplished (Michigan State University, 2000). NMR spectroscopy is the most valuable spectroscopic
technique available for laboratory organic chemists for structure determination (McMurry, 2011).
Absorption in the low energy radio frequency part of the electromagnetic spectrum causes excitation of
nuclear spin states and are tuned to certain nuclei (1H, 13C, 19F and 31P) (Michigan State University,
2000). For a given type of nucleus, NMR spectroscopy distinguishes and counts atoms in different
locations in the molecule (Michigan State University, 2000).

Abid Khan 2
The aim of this investigation is to determine the structure of a given unknown organic compound by
conducting functional group tests and deducing its identity through IR and NMR spectroscopy.
Methods
For the methods of this investigation, please refer to pages 10-23 of the 2014MSC Organic Chemistry
Laboratory Manual 2014 edition.
Results
The results section contains tables and descriptions presenting the recorded qualitative observations for
the functional groups and elements testing and physical constants (boiling point and refractive index),
solubility and oxygen flask test results for the unknown compound. These data can be analysed to form
a preliminary understanding of the identity and structure of the unknown compound. A brief description
of each of the functional group tests along with its chemical equation or reaction mechanism are
illustrated. The findings from the IR, NMR and mass spectroscopy for the unknown compound are
presented to assist in deducing the identity of the organic compound. The IR, NMR and mass
spectroscopy spectra can be found in the Appendix. Three potential compounds are then listed with
their physical constants along with their respective chemical structures.
Qualitative Observations
Table 1.1, presented on page 3, presents the qualitative observations that were observed while
conducting the standard functional group and element tests that were conducted by oxygen flask
method. The colour and opacity of the resulting solution, along with whether a precipitate (ppt) was
present, were noted for each of the tests.
Table 1.2, presented on page 4, presents the qualitative observations for the unknown organic
compound. The results detail the observations and whether the unknown compounds are positive or
negative to the standard functional group tests which can then be used to identify the functional groups
present.

Abid Khan 3
Table 1.1 – Qualitative observations from the Standard Functional Group/Element Tests
Table 1.1 - Qualitative Observations from Standard Functional Group/Element Testing
Station Number/Reaction Name
Reactant being
changed
Functional
Group/Element Test Observation
1.a - Reaction with bromine
Cyclohexane
Carbon-carbon
double bond
Red colour change, no ppt
Cyclohexene
Red colour decolourised,
transparent
1.b Reaction with permanganate
Cyclohexane
Strong violet colour, no
ppt
Cyclohexene dark red, no ppt
2.a - Solubility of alcohol and
phenol in base
Benzyl Alcohol
Hydroxyl group
Clear, transparent
Phenol
slightly yellow colour
change, not dissolved
100%
2.b - Reaction of phenol with ferric
chloride Phenol clear
2.c - Reaction with phenol and
aqueous bromine Phenol
White cloudy colour
change, ppt formed
2.d - Luca's Test for tertiary
aliphatic alcohol
Tert-butyl
alcohol
2 phases, cloudy in the
bottom, clear on top
3.a - Reaction of carboxylic acid
with sodium bicarbonate Benzoic acid Carboxylic acid group
Not soluble, crystal ppt
formed
3.b (i) - D.N.P Test Acetophenone Ketone group
Opaque orange-red colour,
ppt formed
3.b (ii) - Iodoform Test Acetophenone Methyl ketone
Milky colour change, ppt
formed
3.c (i) - Tollen's test Benzaldehyde
Aldehyde group
Silver mirror, dark green,
ppt formed
3.c (ii) - Reduction of Fehling's
solution Glucose
Dark red, opaque, ppt
formed
3.c (iii) - Reaction of aldehyde with
permanganate Benzaldehyde Opaque, dark violet, no ppt
3.c (iv) - D.N.P Test Benzaldehyde Opaque orange ppt
3.d - Hydroxamic Test Methyl Benzoate Ester group Opaque purple/black color
4.a - Solubility of amines in
aqueous acid
Aniline
Amino Group
Slightly yellow, soluble
Acetanilide White ppt, not soluble
4.b - Test for primary aromatic
amine Aniline
Dark red, ppt formed,
silver top
4.c - Reaction of aromatic amines
and aqueous bromine Aniline
Cream-coloured ppt, not
soluble
5. - Test for nitro compounds m-dinitrobenzene Nitro group
Yellow ppt, cloudy,
cream-coloured liquid
6.a - Distinguishing between ethers
and hydrocarbons Diethyl ether Ether group Brown colour change
6.b (i) - Testing for sulphur ions - Sulphur ion White ppt
6.b (ii) - Testing for organic halide
ions -
Chlorine, bromine,
iodine ion White ppt
6.b (iii) - Testing for nitrogen ion - Nitrogen ion Green colour change
7. - Smokey flame test for
Aromatics Ethyl acetate Aromatic group Melted, smokey flame
8. - Molisch's Test for sugars Glucose Carbohydrate Dark purple colour

Abid Khan 4
Table 1.2 – Qualitative Observations from the Functional Group/Element Testing for the
Unknown Organic Compound
Table 1.2 - Qualitative Observations from Functional Group/ Element Testing For Unknown Compound
Station Number/Reaction Name
Functional
Group/Element Test Observation
Positive/Negative with
Standard Functional Group
test
1.a - Reaction with bromine
Carbon-carbon
double bond
Red colour, no ppt,
soluble
positive with cyclohexane
standard
1.b Reaction with permanganate
Strong violet
colour, no ppt
positive with cyclohexane
standard
2.a - Solubility of alcohol and
phenol in base
Hydroxyl group
Clear
positive with benzyl alcohol
standard
2.b - Reaction of phenol with ferric
chloride
Slightly yellow
colour change negative
2.c - Reaction with phenol and
aqueous bromine Red colour change negative
2.d - Luca's Test for tertiary
aliphatic alcohol Clear, transparent negative
3.a - Reaction of carboxylic acid
with sodium bicarbonate
Carboxylic Acid
group
Soluble, no sound
heard negative
3.b(i) - D.N.P Test Ketone group
Orange colour, ppt
formed positive
3.b(ii) - Iodoform Test Methyl Ketone
Opaque, cloudy, no
ppt negative
3.c (i) - Tollen's test
Aldehyde group
Clear, transparent,
no ppt negative
3.c (ii) - Reduction of Fehling's
solution
N.R, no colour
change from blue negative
3.c (iii) - Reaction of aldehyde with
permanganate
Opaque, dark
violet positive
3.c (iv) - D.N.P Test Opaque orange ppt positive
3.d - Hydroxamic Test Ester group
Clear on top, ppt
present positive
4.a - Solubility of amines in aqueous
acid
Amino group
Clear transparent,
no ppt negative
4.b - Test for primary aromatic
amine
Light brown, white
top, not clear negative
4.c - Reaction of aromatic amines
and aqueous bromine
Dark yellow colour
change negative
5. - Test for nitro Compounds Nitro group Purple, no ppt negative
6.a - Distinguishing between ethers
and hydrocarbons Ether group
Brown colour
change positive
6.b (i) - Testing for sulphur ion Sulphur ion Clear, NR negative
6.b (ii) - Testing for organic halide
ion
Chlorine, bromine,
iodine ions Clear, no ppt negative
6.b (iii) - Testing for nitrogen ion Nitrogen ion
Clear, no colour
change negative
7. - Smokey flame test for aromatics Aromatic group No smokey flame negative
8. - Molisch's Test for sugars Carbohydrate Dark red, no ppt negative

Abid Khan 5
Description and Illustration of the Standard Functional Group Tests
1.a – Reaction of Cyclohexane and Cyclohexene with bromine
In this reaction, bromine acts as an electrophile and is very ‘polarisable’ by the approaching pi bond
from the alkene. One of the bromine atoms becomes attached to both carbon atoms, with a positive
charge being found on the bromine atom. The bromonium ion then gets attacked in the back by a
bromide ion. This allows the decolourisation of the bromine (red to transparent). This is an example of
electrophilic addition of alkenes (Clark, 2000). Alkanes do not have a pi bond and are sp3 hybridised
thus they cannot make an induced dipole on bromine.
1.b – Reaction of Cyclohexane and Cyclohexene with permanganate
When an organic compound reacts with dilute alkaline potassium manganate (VII) solution in the cold
to give a green solution followed by a dark brown precipitate, then the compound may contain a carbon-
carbon double bond. The chemical equations where the reactants are cyclohexane and cyclohexene are
illustrated below.
When cyclohexene reacts with the purple potassium manganate (VII), manganese dioxide is formed
and induces a brown colour change.

Abid Khan 6
The IR spectrum for cyclohexane
and cyclohexene are very similar
and differ only by the characteristic
absorption of a carbon double bond
C=C at 1640-1680 cm-1.
2.a – Distinguishing between alcohol and phenol by solubility in base and comparison of IR spectrum
between toluene and benzyl alcohol
Phenols are about a million times more acidic than alcohol and are therefore soluble in dilute sodium
hydroxide. Phenols are more acidic because the phenoxide ion is resonance-stabilised. Delocalisation
of the negative charge over the ortho and para positions of the aromatic ring results in increased stability
of the phenoxide anion relative to undissociated phenol (McMurry, 2011). Therefore this test can be
used to distinguish between alcohol and phenol.
Benzyl alcohol has a broad absorption at 3400 - 3650 cm-1 while toluene does not. Toluene can be
resonance stabilised. The resonance hybrid suggests all six C=C bonds of benzene are more than the
single bonds but not complete double bonds as they only have partial pi character.

Abid Khan 7
2.b – Reaction of phenols with ferric chloride in pyridine
Treatment of phenol with anhydrous ferric chloride and pyridine produces a blue, violet, purple, green
or red-brown solution.
2.c – Reaction with phenol and aqueous bromine
The –OH group attached to the benzene ring in phenol has the effect of increasing its reactivity (Clark,
2000). The net effect of this is that the –OH group has a 2,4 – directing effect meaning that the incoming
groups of bromide will tend to go into the 2-position or 4-position. This causes decolourisation of
bromine and a white precipitate is formed.

Abid Khan 8
2.d – Luca’s Test for tertiary aliphatic alcohols
The reaction mechanism for the Luca’s test is a substitution nucleophilic unimolecular reaction (SN1)
with a tertiary alcohol. This results in two distinct phases that should immediately separate.
3.a – Reaction of carboxylic acid with sodium bicarbonate and comparison of IR spectrum of benzoic
acid and toluene
Carboxylic acids are soluble in aqueous sodium bicarbonate. In this reaction, the crystal of benzoic acid
is dissolved and forms colourless sodium ethanoate.

Abid Khan 9
Benzoic acid has characteristic absorptions for carbonyl group 1670 – 1780 cm-1, hydroxyl group at
2500 - 3100 cm-1 and C-O bond at 1210 – 1320 cm-1 which toluene does not have. These characteristics
are the stretching frequencies for carboxylic acid.
3.b (i) – D.N.P Test with acetophenone
The D.N.P test with acetophenone is used to determine whether a ketone group is present. The following
reaction mechanism outlines this reaction

Abid Khan 10
3.b (ii) – Iodoform Test – test for methyl ketones and IR spectrum of acetophenone
The following reaction is used to determine whether a methyl ketone is present. Iodine is decolourised
indicating that one of the reactants were a methyl ketone.
Acetophenone has a carbonyl group that is part of the functional group. The stretching frequency of this
group is 1670 – 1780 cm-1.
3.c (i) – Tollen’s test for aldehyde
The Tollen’s test refers to the oxidation of aldehyde. In this reaction, a silver mirror is formed and a
silver colouration can be seen around the solution indicating that an aldehyde is present.
3.c (ii) – Reduction of Fehlings’ Solution
Fehlings’ solution contains copper (II) ions complexed
with tartrate ions in sodium hydroxide solution. In this
reaction an aldehyde/sugar is reduced to a reducing
sugar and forming a red precipitate of copper (I) oxide.

Abid Khan 11
3.c (iii) – Reaction with permanganate
Aldehydes can react with permanganate and induces the colour change from orange to green. The
resulting product is benzoic acid.
3.c (iv) – IR spectrum of benzaldehyde
Benzaldehyde has a characteristic C=O stretch of 1690 – 1720 cm-1 which toluene does not have.
3.e – Stretching frequencies of carbonyl and N-H group in amides
The N-H stretching frequency in aniline is 3300 – 3500 cm-1 while the carbonyl group in acetanilide has
a stretching frequency of 1690 – 1720 cm-1.
4.a – Solubility of amines in aqueous acid
Aniline is soluble in acid as it is a basic amine. There is a lone pair of electrons on the nitrogen and the
tendency of the nitrogen to share its lone pair of electrons with acids is responsible for the basic
character of amines. The positive charge can then be delocalised giving a resonance structure.
Acetanilide is an amide and due to its structure cannot delocalise and thus is not soluble in acid.
Amine Amide
Abid Khan 12
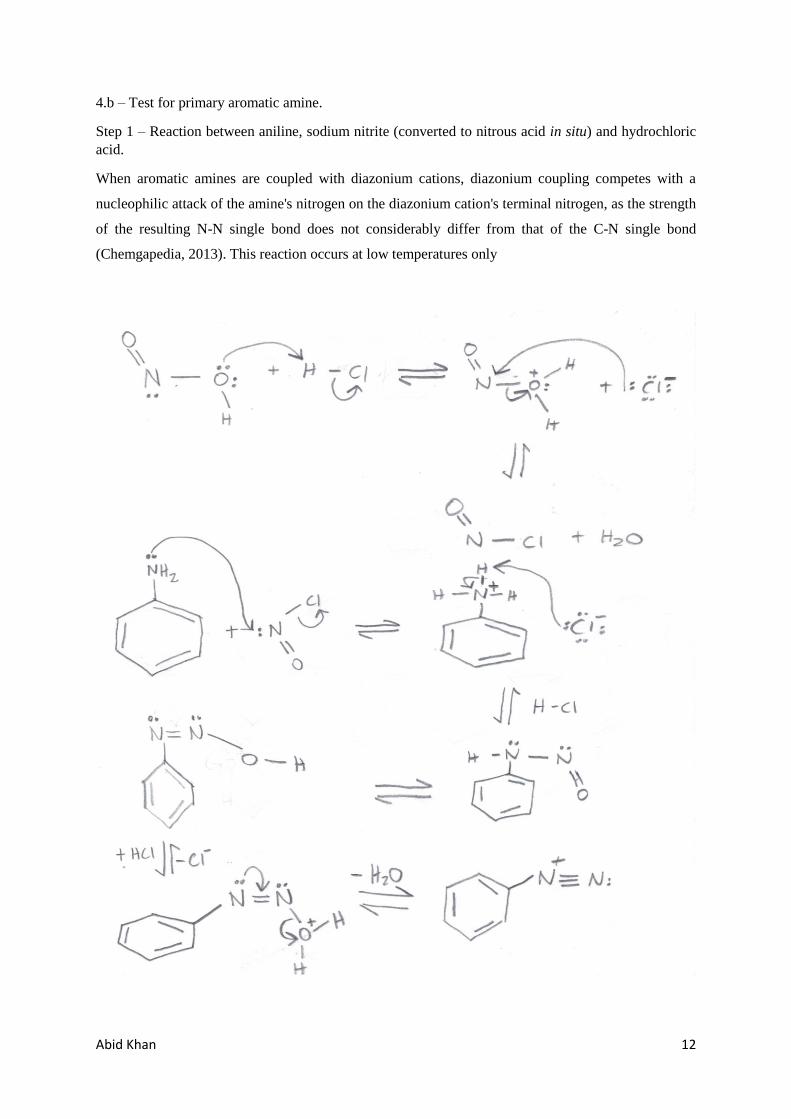
4.b – Test for primary aromatic amine.
Step 1 – Reaction between aniline, sodium nitrite (converted to nitrous acid in situ) and hydrochloric
acid.
When aromatic amines are coupled with diazonium cations, diazonium coupling competes with a
nucleophilic attack of the amine's nitrogen on the diazonium cation's terminal nitrogen, as the strength
of the resulting N-N single bond does not considerably differ from that of the C-N single bond
(Chemgapedia, 2013). This reaction occurs at low temperatures only

Abid Khan 13
Step 2 – β-napthol in sodium hydroxide mixed with diazonium cation
This reaction occurs in low temperatures only and an intense orange-red precipitate is formed.
Physical Properties of the Unknown Compound
The unknown compound is a clear, colourless and transparent liquid. The boiling point of the compound
is 102oC and has a refractive index of 1.3905.
Peaks in IR and NMR spectra of the Unknown Compound
After analysing the IR and NMR spectra of the unknown compound which can be found in the appendix,
the following peaks were found.
Table 1.3 - Observations after the analysis of IR spectra of the unknown compound
Table 1.3 - Observations after the analysis of IR spectra of the unknown compound
Ketone/Ester/Carboxylic Acid/Aldehyde group 1680 – 1780 cm-1 (sharp)
Alkyl group 2853 – 2962 cm-1 (medium/sharp)
Isopropyl group 1385 – 1395 cm-1 (medium)

Abid Khan 14
Table 1.4 - Observations after the analysis of 1H NMR spectra of the unknown compound
4 signals/peaks are observed in the 1H NMR spectra of the unknown compound.
Table 1.4 - Observations after the analysis of 1H NMR spectra of the unknown compound
Triplet @ 0.93 ppm 3 H
Sextet @ 1.60 ppm 2 H
Singlet @ 2.13 ppm 3 H
Triplet @ 2.40 ppm 2 H
Table 1.5 - Observations after the analysis of 13C NMR spectra of the unknown compound
Observations after the analysis of 13C NMR spectra of the unknown compound
Peak @ 13.7 ppm Primary Alkyl
Peak @ 17.41 ppm Primary Alkyl/Secondary Alkyl/Tertiary Alkyl
Peak @ 29.78 ppm Primary Alkyl/Secondary Alkyl/ Tertiary Alkyl
Peak @ 45.71 ppm Primary Alkyl/Secondary Alkyl/ Tertiary
Alkyl/Ether
Peak @ 208.93 Aldehyde/Ketone
Potential Compounds
After observing both the IR and NMR spectra, it can be deduced that the compound is either an
aldehyde or a ketone as both these functional groups are present in the IR and 13C NMR spectra.
Three possible compounds that are clear liquids and have a boiling point near 102oC are: 2-pentanone,
3-pentanone, 1-pentanal. These compounds were suggested by the convenor of 2014MSC Organic
Chemistry.
Name: 2-pentanone
B.P: 101oC - 102oC
Name: 3-pentanone
B.P: 100oC - 102oC
Name: 1-pentanal
B.P: 102oC - 103oC

Abid Khan 15
Discussion
The identity of the given unknown organic compound can be deduced by analysing: the qualitative
observations and whether the functional group tests were positive or negative, the NMR spectra to
determine the number of carbon atoms and different proton environments and the IR spectra to further
deduce what functional groups were present. The structures of 2-pentaanone, 3-pentanone and 1-
pentanal will be examined using the results that have been obtained.
In table 1.2 the unknown compound had positive reactions with following functional group tests:
carbon-carbon double bond group, hydroxyl group, ketone group, aldehyde group, ester group and ether
group. This finding indicates that the unknown compound could contain one or more of these functional
groups.
The IR spectra results can be used to further narrow down the actual composition of the functional
groups. As seen from the IR spectra located in the appendix and tabulated in table 1.3, there is a sharp
peak at the absorption frequency of 1680 – 1780 cm-1. This indicates that there functional group present
could be a ketone, ester, carboxylic acid or an aldehyde. Furthermore, there is a medium/sharp peak at
the absorption frequency of 2853 – 2962 cm-1 suggesting that there are alkyl groups in the unknown
compound. Lastly, there is medium peak at the absorption frequency of 1385 – 1395 cm-1 indicating
that there are isopropyl groups present in the compound. After analysing the IR spectra findings, the
following potential groups that were hypothesised from the findings in table 1.2 can be rejected:
hydroxyl group, ether group and carbon-carbon double bond group.
To determine the actual structure and carbon backbone of the unknown compound, the NMR spectra
results in table 1.4 and table 1.5 will be analysed. As shown in table 1.5 and the 13C NMR spectra in the
appendix, there are five peaks indicating that there are five different carbon environments in the
unknown compound. This seems to suggest that 3-pentanone is not the unknown compound as it does
not contain 5 different carbon environments. This is highlighted in figure 1.1. The different carbon
environments are shown by the coloured circles.
Figure 1.1 – Carbon environments in 3-pentanone
As it can be seen in figure 1.1, there are only 3 different
carbon atoms thus 3-pentanone cannot be the unknown
organic compound.

Abid Khan 16
1
2
3
4
5
To distinguish between 2-propanone and 1-pentanal, as both compounds have five different carbon
environments, the 1H NMR spectra results will be analysed to identify their different proton
environments. Both compounds have 4 different proton environments. In table 1.4 and from the 1H
NMR spectra in the appendix, it can be observed that there is singlet at 2.13ppm. This suggests that the
proton group at 2.13ppm has no neighbouring protons. This finding appears to eliminate 1-pentanal as
the unknown compound as each proton environment has at least one neighbouring proton. This is
illustrated in figure 1.2 by using the program Chemdraw.
Figure 1.2 – Neighbouring proton environments in 1-pentanal
Therefore it can be concluded that 2-pentaanone is the unknown organic compound tested in this
investigation. This can be further justified by labelling the 1H NMR spectra results with their respective
peaks.
Figure 1.3 – The splitting pattern of 2-pentanone
1. –CH3 group, singlet (3H)
2. –C=O group
3. –CH2 group, triplet (2H)
4. –CH2 group, sextet (2H)
5. –CH3 group, triplet (3H)
When observing the results from table 1.2, positive reactions were noted for the hydroxyl group, carbon-
carbon double bond and ether groups. These results may have arisen from experimental errors. It was
noted during the investigation that the amount of compound was depleted during these functional group
tests and thus the required amount of the compound were not inserted. This may have caused the
incorrect observations. For next time, more efficient use of the amount of the compound must be
conducted in order to insert the correct amount of the compound in each functional group test.

Abid Khan 17
Conclusion
The aim of this investigation was to determine the structure of a given unknown organic compound by
conducting functional group tests and deducing its identity through IR and NMR spectroscopy. After
observing the qualitative observations during the functional group tests and spectral analysis, it was
determined that the unknown compound was 2-pentanone.

Abid Khan 18
Appendix
IR Spectrum of Unknown Organic Compound
1H NMR spectra of unknown organic compound

Abid Khan 19
13C NMR spectra of unknown organic compound
Mass spectra of unknown organic compound

Abid Khan 20
References
Chemgapedia, 2013. Reactions of Aromatic Compounds. [Online]
Available at:
http://www.chemgapedia.de/vsengine/vlu/vsc/en/ch/12/oc/vlu_organik/aromaten/reaktionen/ar_s
e_beispiele.vlu/Page/vsc/en/ch/12/oc/aromaten/reaktionen/ar_se/azokupplung/azokupplung.vscm
l.html
[Accessed 1 May 2014].
Clark, J., 2000. Ring Reactions of Phenol. [Online]
Available at: http://www.chemguide.co.uk/organicprops/phenol/ring.html
[Accessed 1 May 2014].
Clark, J., 2000. The Reaction between Symmetrical Alkenes and Bromine. [Online]
Available at: http://www.chemguide.co.uk/mechanisms/eladd/symbr2.html
[Accessed 1 May 2014].
Dallas Learning Solutions, 2014. Biomolecules. [Online]
Available at: https://dls.dcccd.edu/biology1-3/functional-groups-and-biomolecules
[Accessed 29 April 2014].
Fromm, J. R., 1997. The Concept of Functional Groups. [Online]
Available at: http://www.3rd1000.com/chem301/chem301a.htm
[Accessed 21 April 2014].
Marie, A., 2014. Functional Groups Definition. [Online]
Available at: http://chemistry.about.com/od/chemistryglossary/a/fungroupsdef.htm
[Accessed 20 April 2014].
McMurry, J., 2011. Organic Chemistry with Biological Applications. 2nd ed. California: Cengage
Learning.
Michigan State University, 2000. Introduction to Spectroscopy. [Online]
Available at: http://www2.chemistry.msu.edu/faculty/reusch/virttxtjml/spectrpy/spectro.htm
[Accessed 29 April 2014].
Zumdahl, S. S., 2005. Chemical Principles. 5th ed. Boston: Houghton Mifflin Company.