organic and inorganic cultivation of sugarcane and … · 2018-12-15 · 5.3 cost and returns...
TRANSCRIPT

ORGANIC AND INORGANIC CULTIVATION OF SUGARCANE AND JAGGERY PREPARATION IN
BAGALKOT DISTRICT: AN ECONOMIC ANALYSIS
Thesis submitted to the University of Agricultural Sciences, Dharwad
in partial fulfillment of the requirements for the Degree of
MASTER OF SCIENCE (AGRICULTURE)
IN
AGRICULTURAL ECONOMICS
By MANJUNATH SHIVANAIKAR
DEPARTMENT OF AGRICULTURAL ECONOMICS COLLEGE OF AGRICULTURE, DHARWAD
UNIVERSITY OF AGRICULTURAL SCIENCES, DHARWAD – 580 005
JUNE, 2012

ADVISORY COMMITTEE
DHARWAD (S. S. GULEDGUDDA) JUNE, 2012 MAJOR ADVISOR
Approved by :
Chairman : ____________________________ (S. S. GULEDGUDDA)
Members : 1. __________________________ (H. BASAVARAJ)
2. __________________________ (S. M. MUNDINAMANI)
3. __________________________ (A. BHEEMAPPA)
4. __________________________ (Y. N. HAVALDAR)
5. __________________________ (S. DEVENDRAPPA)

CONTENTS
Sl. No.
Chapter Particulars
CERTIFICATE
ACKNOWLEDGEMENT
LIST OF TABLES
LIST OF FIGURES
1. INTRODUCTION
REVIEW OF LITERATURE
2.1 Cost and returns involved under organic and inorganic cultivation of crops
2.2 Investment pattern in agro-processing units
2.3 Cost and returns in processing of agricultural commodities
2.4 Shifting from inorganic to organic farming
2.
2.5 Problems of organic farmers
METHODOLOGY
3.1 Description of the study area
3.2 Sampling procedure
3.
3.3 Analytical techniques
3.4 Terms and concepts used in the study
RESULTS
4.1 General characteristics of the sugarcane sample farmers
4.2 Cropping pattern and major crops grown
4.3 Cost and returns involved in organic and inorganic sugarcane farms
4.4 Investment pattern in establishment of jaggery processing units (one tonne capacity per day)
4.5 Cost and returns involved in both organic and inorganic jaggery preparation per processing unit per annum.
4.6 Reasons for shifting from inorganic to organic sugarcane production
4.
4.7 Problems of organic sugarcane farmers
Contd…….
DISCUSSION
5.1 General characteristics of the sample farmers and jaggery processors
5.2 Cropping pattern and major crops grown
5.3 Cost and returns involved in both organic and inorganic sugarcane farms
5.4 Investment pattern in jaggery processing unit
5.5 Cost and returns involved in both organic and inorganic jaggery preparation
5.6 Reasons for shifting from inorganic to organic cultivation of sugarcane
5.
5.7 Problems of organic sugarcane farmers
6. SUMMARY AND POLICY IMPLICATIONS
REFERENCES
APPENDICES

LIST OF TABLES
Table No.
Title
3.1 District-wise area under sugarcane in Karnataka
3.2 Taluk-wise area under sugarcane cultivation in Bagalkot District
3.3 Land utilization pattern in Mudhol and Jamkhandi taluks of Bagalkot district during 2010-2011
3.4 Key indicators of Mudhol and Jamkhandi Taluks of Bagalkot district during 2010-2011
3.5 Source of Irrigation and area Irrigated in Mudhol and Jamkhandi taluks of Bagalkot district during 2010-2011
3.6 Sampled villages and farmers in Bagalkot district
3.7 Sampled villages and jaggery processors in Bagalkot district
4.1 General characteristics of sample sugarcane farmers
4.2 Cropping pattern of the sample sugarcane farmers
4.3 Labour use pattern in cultivation of organic and inorganic sugarcane
4.4 Cost and returns structure in cultivation of sugarcane on organic and inorganic farms
4.5 Investment pattern in establishment of jaggery processing unit (one tonne capacity per day)
4.6 Cost and returns in organic and inorganic jaggery preparation per processing unit per annum
4.7 Cost and returns in organic and inorganic jaggery production (Rs/t)
4.8 Break-even analyses in organic and inorganic jaggery preparation per processing unit
4.9 Financial feasibility of investment in organic and inorganic jaggery processing
4.10 Reasons for shifting from inorganic to organic sugarcane production
4.11 Problems of organic sugarcane farmers

LIST OF FIGURE
Figure No.
Title
1 Map showing a study area
2 Graphical representation of the farmers
3 Graphical representation of the sample jaggery processors
4 Labour use pattern in organic and inorganic cultivation of sugarcane
5 Per ton cost of organic and inorganic jaggery production

LIST OF APPENDICES
Appendix No.
Title
I State wise areas under sugarcane in India (2010-11)
II Projections of sweetener requirement vis-à-vis sugarcane production in India up to 2020 AD

1. INTRODUCTION
Sugarcane (Saccharam officinarum) is native to India and has been cultivated from the historic times over the years and also it is a major commercial crop next to cotton in India. Sugarcane is most important source of sugar. Indian agro-climatic conditions are favourable for the production of sugarcane. Sugarcane plays a pivotal role in the agro-industrial economy of India and in fact on real economy, performance of sugar industry is directly related to the sugarcane production in India.
The main sugarcane growing states in India are Uttar Pradesh, Maharashtra, Karnataka, Andhra Pradesh, Haryana, Bihar, Gujarat and Punjab. Sugarcane is grown extensively in India. During 2010-11,the crop occupied over 49.40 lakh hectares in the country with a production of 3391.68 lakh tonnes, of which 66 per cent is concentrated in the northern part of the country (Appendix-I). In Karnataka, sugarcane is being cultivated over an area of 4.21 lakh hectares with a production of 375.95 lakh tonnes (Appendix-I) of cane and stands third in India with respect to area coverage next only to Uttar Pradesh and Maharashtra. In the recent past, there has been an increasing trend in both area and production of sugarcane in the state. Some of the important sugarcane growing districts in Karnataka state are Bagalkot, Belguam, Mandya, Bidar, Bellary and Bijapur.
Organic production systems are based on specific standards precisely formulated for food production and aims at achieving agro-ecosystems, which are socially and ecologically sustainable. It is based on minimizing the use of external inputs through use of on-farm resources efficiently compared to agriculture based on the use of chemical fertilizers and pesticides. Thus, the use of synthetic fertilizers and pesticides is avoided.
Sugarcane in India is processed into sugar, gur and khandasari and undergoes considerable weight reduction during processing. The methods of converting sugarcane and manufacturing sugar, gur and khandasari are different but a great value is added in the manufacturing of these consumable final products. Further, it offers employment opportunity to millions of people. Gur is prepared in almost all parts of the country where sugarcane is grown extensively. Gul, Gud, Jaggery, Vellum and Bella are the different names known in different parts of the country.
Organic jaggery is a pure, wholesome, unrefined whole sugar which contains the natural goodness of minerals and vitamins. It comes from the sap of sugarcane and its flavour is described as an aromatic blend between brown sugar and molasses with sweet undertones. But organic jaggery is superior compared to conventional jaggery. Because, it is processed without the use of chemicals, organic jaggery retains many vital vitamins and minerals, such as calcium, phosphorus, magnesium and potassium. In fact, organic jaggery has a mineral content approximately 50 times greater than refined sugar and five times more than brown sugar.
Nutritional and medicinal value of jaggery
The acceptable taste and nutritive value of jaggery has attracted man since ancient times. Jaggery is also called “Non Centrifugal Sugar” or “Artison Sugar”. It forms an important item of Indian diet for its high nutritive value and as a sweetening agent. White sugar contains only sucrose (99.70%), whereas jaggery has sucrose (51 %), protein (0.25%), glucose (21.20%) and minerals (3.40%) in addition to traces of fats (0.02 to 0.03%), calcium (0.39%), vitamin A, vitamin B, Phosphate (0.025%) and provides 383 K cal/100g jaggery (Shrilakshmi, 2003).
Dietary sucrose (sugar) is mixed blessings which makes food more attractive and appetizing but excessive consumption often leads to various kinds of pathological conditions like, dental curies, coronary thrombosis, ischemic heart disease, diabetes, acidity, depression and obesity etc., Some studies have also shown that high sugar intake leads to higher cancer risk. Jaggery which is an alternate sweetener derived from sugarcane crop is health friendly. In Ayurveda, jaggery is considered to be the best of all the sugarcane preparations (Shrilakshmi, 2003).

“The wise live without injuring nature as the bee drinks honey without harming the flowers” (The Buddha). In the same way our agriculture manipulation should not disturb the natural ecosystem and resource base for the future generation.
India is the land of agriculture; it has a rich and vivid basic natural resources base in terms of land, water, climate, rainfall, flora and fauna. However, these natural resources are faced with a severe demographic pressure. India has about 16 per cent of the world’s human population and 15 per cent of the world’s livestock population. But to meet their requirement we have only 2 per cent of the world’s geographical area, one per cent of rain water, one per cent of forest and 0.5 per cent of meadow (pasture).
According to 2011 census, GOI, India’s population has reached 1.21 billion. India has been adding an incredible 1.5 crore to her population every year with the growth rate of two per cent per annum. With the current food grain production of 245 million tonnes, India is committed to add 102 million tonnes more by the year 2021 AD to feed the estimated population of 1324 millions. The per capta availability of land has decreased from 0.48 hectare in 1951 to 0.20 hectares in 1981 and further, it declined to 0.15 hectare in 2001. The demand for food grains has to be met by raising the productivity of the land and simultaneously the soil health should also be maintained (Hosmani et al., 2000).
From 1960 onwards the green revolution succeeded in increasing the farmer’s income and yield of major crops because of the introduction of high yielding varieties and wide use of synthetic fertilizers and pesticides. The major effect of green revolution is that our agriculture was chemicalised. As the availability of land is decreasing day by day, application of fertilizers and pesticides has become a must to meet the demand for food grain. The effect of prolonged and over usage of chemicals on soil results in human health hazards and pollution of the environment. Now, once again the agricultural production has become stagnant and is not able to keep pace with the rapid growing population. So these problems have made us now to think of some other alternative methods of increasing food production. It is in this context the organic farming has drawn the attention of agricultural scientists, farmers and policy makers. Organic farming is not a new concept; it has been a way of life and tradition with our farming community over centuries.
Thus, in developing countries the twin challenges are production of sufficient food for the rapid growing population from available land and prevention of environmental degradation. Meeting of one challenge, if we want to increase the food production to a level to feed the growing population, this certainly cannot be done without the use of chemical fertilizers and plant protection chemicals because high yielding varieties and hybrids are highly responsive to fertilizers and susceptible to pests and diseases. The use of chemical fertilizers and plant protection chemicals for increasing agricultural production will lead to environmental degradation. To avoid environmental degradation, chemical fertilizers and plant protection chemicals are not used in agricultural production, food production cannot be increased to a level to feed the growing population. Hence, to face these two challenges simultaneously we have to adopt a compromising practice that is “organic farming”
Need for organic farming:
Intensification of agricultural production by way of widespread use of concentrated fertilizer and pesticides has resulted manifold increase in the production and productivity of crops. However, the ill effects of these agrochemicals are clearly visible on soil health, soil microbes, quality of ground water, fodder and food material. Thus organic farming is certainly becoming necessary for the following reasons:
- It is a sustainable and eco-friendly technology. - It improves quality and nutritive value of the farm produce. - It encourages sustainable livelihood of the producer as well as safeguards the
consumer’s health.
- It improves the physical, chemical and biological health of the soil. - It promotes healthy use of natural resources and minimizes all forms of pollution. - Toxicity and residues are the main problems of the agro-chemicals in farm produce. - Finally continuous decrease in input use efficiency under conventional farming.

Definition and concept:
The aim of organic farming is to have an ecologically sustainable farm production, which includes conservation of the natural habitat and resources, minimum pollution to soil, air and water. The cultivation is done without the use of synthetic chemicals like fertilizers, pesticides, herbicides and growth regulators.
Organic agriculture is a production system that avoids or largely excludes the use of synthetic compounded inputs viz., fertilizers, pesticides, growth regulators and livestock feed additives. It follows natural way of farming based on ancient teachings. Organic farming systems relay on crop rotation, crop residues, animal manures and mechanical cultivation to maintain the soil productivity and tilth to supply plant nutrients and control weeds. It has considerable economic, environmental and sustainability implications. In India, it has been an age old practice but has undergone considerable metamorphosis during green revolution. To produce more food grains in India, conventional farming is needed but its increasing cost factor; adulteration and untimely availability discourage the farmers to go for their large scale application. Under such situation, organic farming seems to be only economical and viable option. It may be defined as “A kind of diversified agriculture, where in, crops and livestock are managed through the use of integrated technologies with preference to depend on locally available matter at the farm’’. It emphasizes more on optimization of the yield potential of crops and livestock under a given set of farming conditions rather than yield maximization.
Principles of organic farming
1. To produce food of high quality in sufficient quantity.
2. To encourage and enhance biological cycles within the farming system involving micro organisms, soil flora, plants and animals
3. To maintain and increase the long term fertility of soils.
4. To create a harmonious balance between crop production and animal husbandry.
5. To produce fully bio-degradable organic products.
6. To minimize all forms of pollution
7. To promote the healthy use proper care of water, water resources and all lives therein.
The United States and other developed countries have some farm policies to support organic farming. But for India and other third-world nations, the concept of organic farming is only at debating stage. In future, our approach for organic agriculture should be to secure the advantages and economics of working with nature by bringing in more and more crops under organic farming and to obtain greatest yield of most nutritious crops while maintaining fertility of the soil and it should reduce the cost of cultivation to the extent possible.
Keeping all these aspects in view the present study was undertaken in Bagalkot district of Karnataka state, to analyse the economics of organic and inorganic cultivation of sugarcane and jaggery preparation with the following objectives.
Specific objectives of the study are
1. To study the cost and returns involved under organic and inorganic sugarcane cultivation
2. To analyze the investment pattern in jaggery processing units 3. To study the cost and returns involved under organic and inorganic jaggery
preparation. 4. To ascertain the reasons for shifting from inorganic to organic cultivation of
sugarcane 5. To enumerate the problems of organic sugarcane farmers
Hypotheses
1. The cost involved under organic is less than inorganic sugarcane cultivation and returns from organic is more than inorganic sugarcane cultivation.

2. The cost involved under organic is less than inorganic jaggery preparation and returns from organic is more than inorganic jaggery preparation
Special features of the study
Today, there is an increasing awareness about alternative or natural or organic or sustainable farming in view of energy shortage, food safety and soil and environmental pollution arising out of chemical or inorganic farming. Thus, the organic farming will definitely help to create a healthy society and a country of prosperous agriculture and healthy environment of Northern Karnataka.
Organic farming is practiced in most of the crops in Bagalkot district. This study aims to analyse the various aspects of organic farming in comparison with inorganic farming practiced in sugarcane cultivation as well as jaggery preparation in the district.
Limitations of the study
Since data were collected by survey method, the inherent lacunae associated with this type of enquiry have crept into the study. Even though, the estimates were provided by the recall memory of the sample respondents because of the non-maintenance of records and accounts on the farm sincere efforts have been bestowed to elicite as accurate and reliable estimates as possible by cross questioning. However, the degree of discrepancy if any, would be negligible as the estimates presented are in averages.
Importantly the qualitative aspect of organic agriculture could not be captured in this study because soil fertility and productivity status could not be estimated. Further the produce could not be tested for the pesticide residue due to lack of appropriate facilities.
Presentation of the study
The entire study has been divided into six chapters. Chapter-I deals with the introduction to the topic, the specific objectives of the study and significance of the study. Chapter-II deals with the review of literature on earlier studies bearing on the objectives of present study. Chapter-III is devoted to the description of the study area, sampling frame, the nature and source of data, the tools and techniques of analysis adopted for evaluating the objectives and terms and concepts used in the study. Chapter-IV presents results under appropriate heads. Chapter-V discusses the results of the study. Finally, chapter-VI summerises the overall results, draws conclusions and outline the policy implications emerging from the study.

2. REVIEW OF LITERATURE
This chapter presents review of research work on organic and inorganic cultivation crops and agro processing. The reviews are presented under the following heads:
2.1 Cost and returns involved under organic and inorganic cultivation of crops
2.2 Investment pattern in agro-processing units
2.3 Cost and returns in processing of agricultural commodities
2.4 Shifting from inorganic to organic farming
2.5 Problems of organic farmers
2.1 Cost and returns involved under organic and inorganic cultivation of crops
Sujatha et al. (2006) studied the comparative analysis of efficiency of organic farming and inorganic farming in Karimnagar district of Andhra Pradesh. The study revealed that the cost on human labour has been found higher in organic cultivation of rice and cotton as organic farming is labour intensive, where as in inorganic farming, the cost of manures, fertilizers and pesticides are higher compared to organic cultivation of rice and cotton. The net returns have been found higher in organic farming in both the crops compared to inorganic farming though the total cost of cultivation has been more in inorganic farming compared to organic farming.
Sushil Kumar et al. (2006) studied the impact of drought on cost and returns from cereal crops under different organic and inorganic farming systems in Himachal Pradesh. The study has revealed the cost of cultivation right from cost C1 to cost C2 to be less in organic farming system than inorganic farming system farms. The cost of production per quintal of produce has also been lower on organic farming system than inorganic farming system.
Waykar et al. (2006) studied the economics of grape production under organic and inorganic farming in the Nasik district of Maharashtra. The study revealed that, per hectare total cost of cultivation has been found Rs. 14675 for organic grapes and Rs. 209035 for inorganic grapes.
Kshirsagar (2008) conducted the study on organic sugarcane (O S) farming for enhancing farmers’ income and reducing the degradation of land and water resources in Maharashtra. The study has revealed that the average cost of cultivation of OS crop was Rs.37017.38 per ha has against Rs.43163.81 per ha for inorganic crop, reflecting 14.24 per cent lower cost on OS farms, this is because of non-use of chemical fertilizers and less cost incurred on irrigation, seed and plant protection and the gross value of production (GVP) and profits were higher on OS farms than the inorganic sugarcane (IS) farms. The GVP from OS farms amounted to Rs. 116711.38 per ha as against Rs. 112087.84 per ha from OS crop thereby enhancing farmers income.
Sale and Yadav (2008) studied the sugarcane cultivation with an integrated approach in Kolhapur District of Maharashtra. This study was conducted to examine the per hectare resource use structure in organic and inorganic sugarcane farming, calculate the per hectare cost of cultivation in organic and inorganic sugarcane farming and compare the economics of the two farming systems. Results showed that the per hectare cost of suru sugarcane with inorganic and organic farming were Rs. 66,572.73 and Rs. 57,275.72, respectively and the per tonne cost of production of sugarcane were estimated as Rs. 660.83 and Rs.712.42 in inorganic and organic farming, respectively.
Bai et al. (2009) studied economics of organic farming vis-a-vis conventional production of robusta coffee in Chickmagalur region, India. In this study a self-help group consisting of fifteen growers practicing organic cultivation of coffee over a decade and fifteen conventional robusta small growers were surveyed in the Koppa zone for comparing the cost of production of coffee.

The results indicated that the total cost of cultivation of organic robusta coffee was comparatively high (Rs. 34,940/ha.) than the conventional cultivation (Rs 27,640/ha.), which translated into a cost of production of Rs. 32 per kg and Rs. 25 per kg, respectively. The cost of production was high in organic cultivation mainly due to high input costs. The growers' felt that the incidence of pests and diseases was low in organic system of farming compared to conventional system. However, the premium price for organic coffee were not commensurate with high cost of production, as there was surplus production of organic coffee world over.
Franz et al. (2009) studied the assessing the economic viability of organic cotton production in Uzbekistan: A First Look, Cotton in Uzbekistan is produced in rotation with winter wheat and rice according to national quotas. Production methods are unsustainable, economically and ecologically risky, contributing to soil degradation, water depletion and poor health. A comparative study on conventional production system with an integrated organic system in Western Uzbekistan revealed higher profits under an organic farming system. Combined with policies to improve the existing cotton value chain, organic cotton production could result in higher revenue while reducing pressure on the environment and improving livelihoods.
Dhandhalya et al. (2010) conducted a study on organic wheat farming for sustainable agriculture in Saurashtra region of Gujarat state. The study has revealed that the cost of cultivation and yield performance in organic and conventional farming has not changed significantly. In organic farming, yield reduction was observed in initial years of adoption but later on, it takes normal level.
Ganesh (2010) conducted a study on an economic analysis of organic farming in North Karnataka: A case study of organic villages. The results revealed that the FYM and vermicompost together accounted for 68 per cent of the total input cost in organic farms whereas cost of fertilizers and pesticides accounted a major share (67 %) in conventional farms. The annual input cost of organic farm was 15.39 per cent less as compared to conventional farm. Organic farm was less expensive to the extent of 13.69 per cent in field crops under rainfed and 12.10 per cent under irrigated situations and was yielding more net returns (16.49 %) in perennial crops. Cost of production in paddy, arecanut, jowar, soybean and chick pea was lower in organic farms. Cotton and onion were more profitable under conventional farming. The regression coefficients of fertilizer and pesticide were negative indicating over utilization of these inputs. Organic farming enhanced income of 70 per cent farmers and created employment for 81.67 per cent. In view of the above benefits revealed by the organic village farmers, organic village programme of the state government need to be further extended to Hobli-level. Most of the organic produces were sold in conventional markets due to non-availability of separate organic market in the locality. The study recommends creation of separate organic markets at taluk level for major commodities in the area. There is a need to provide premium price for organic produces.
Ramesh et al. (2010) studied status of organic farming in India. A survey was made on certified organic farms in the country to ascertain the real benefits and feasibility of organic farming in terms of the production potential, economics and soil health in comparison to the conventional farms. The study revealed that organic farming, in spite of the reduction in crop productivity by 9.2%, provided higher net profit to farmers by 22.0% compared to conventional farming. This was mainly due to the availability of premium price (20-40%) for the certified organic produce and reduction in the cost of cultivation by 11.7%. In cases, where such premium prices were not available and the cost of cultivation was higher primarily due to purchased off-farm inputs, organic farming was not found economically feasible. However, there was an overall improvement in soil quality in terms of various parameters, viz. physical, chemical, biological properties, availability of macro-and micronutrients, indicating an enhanced soil health and sustainability of crop production in organic farming system.
Tripathi et al. (2010) conducted study on comparative economics of organic and inorganic farming. The investigation was undertaken to estimate cost and returns in organic and inorganic farming considering cotton, pigeonpea, mung in Kharif season and wheat in Rabi season. For these, total 100 samples were studied out of which 50 were organic cultivators and 50 were inorganic cultivators. The gross income was observed higher in organic farming. Input-output ratios were higher in organic farming as compared to inorganic farming.

They were 1.49 against 1.27 for cotton, 1.64 against 1.53, for pigeonpea, 1.54 against 1.38 for mung and 1.49 against 1.28 for wheat at cost ‘C’.
Singh and Grover (2011) studied the economic viability of organic farming: An empirical experience of wheat cultivation in Punjab. The study revealed that the total variable cost on per acre bases for the cultivation of organic wheat has been found higher (Rs.20,185/acre) than inorganic (Rs.16,700/acre) wheat. The lower crop yield in organic wheat (6.79 qt/acre) less was well compensated by the higher market price.
Zhang et al. (2011) conducted the study on the benefit-cost analyses and development counter measures of organic rice production. The comparative analyses of the conditions and technical and economic indexes of producing organic rice and conventional rice were made by surveying the rice production in Chongming County. The results showed that the technical conditions of organic rice production was higher than that of conventional rice production; and at the current price level, organic rice production was more profitable than conventional rice production.
2.2 Investment pattern in agro-processing units
The investment in processing units needed for various kinds of machinery and building. These investments are made at particular point of time yielding returns continuously over a period of time. Hence, the studies which involved cash flow techniques and financial ratios were reviewed here.
Nagaraj (1987) employed discounted cash flow techniques to evaluate financial feasibility of investment in coconut gardens assuming a discount rate of 15 per cent. The results indicated that the NPW was Rs.19,112.18, Rs.20,663.73, Rs.30,021.64 and Rs.59,476.87, respectively for one hectare of marginal, small, rainfed large and irrigated large farms. The benefit cost ratio for the respective groups was 1.17, 1.15, 1.30 and 1.22 and IRR was 28.84, 24.02, 44.92 and 27.04 per cent, respectively for the above mentioned groups.
Hemanth (1991) studied appraisal of investments in bakery through discounted cash flow techniques and reported 55.50 per cent and 1.08 of IRR and BCR, respectively at 15 per cent discount factor indicating that investment on bakery processing unit was highly profitable.
Teggi (1995) in his study on production and marketing of jaggery in Ghataprabha command area of Karnataka, reported that the investment made in the establishment of jaggery processing unit was recovered within a short period of one years. The NPV of jaggery processing units at 15 per cent discount rate was estimated at Rs.9,07,324.50 over the average life span of jaggery processing unit (10 years). Positive and high net present values reiterated the profitability in jaggery production. The IRR in jaggery processing was more than 100 per cent. It is mainly due to generation of returns from the very beginning. This revealed that the jaggery processing units were economically feasible even at higher discount rates. The benefit-cost ratio was quite appealing (1.16). The encouraging project indicators revealed the economic feasibility of jaggery processing units.
Suresh (2001) in the study on performance of organic farming in Shimoga district of Karnataka reported that per acre net income obtained in organic farms (Rs.19367.96) was more than inorganic farms (Rs.13691.02). This was due to 18.10 per cent higher yields obtained on organic farms over the inorganic farms. And the B:C ratio in case of organic method of cultivation (2.04) was noticed to be higher than inorganic method of cultivation.
Nandimath (2008) in his study on economics of jaggery production in Karnataka reported that the investment made in the establishment of jaggery processing unit was recovered within a short period of 1.7 years. The NPV of jaggery processing units at 12 per cent discount rate was estimated at Rs.10, 30,268 over the average life span of jaggery processing unit (10 years). Positive and high net present values reiterated the profitability in jaggery production. The IRR in jaggery processing was more than 100 per cent. It is mainly due to generation of returns from the very beginning. This revealed that the jaggery processing units were economically feasible even at higher discount rates. The benefit-cost ratio was quite appealing. The encouraging project indicators revealed the economic feasibility of jaggery processing units.

Kumar and Chinnapa (2010) conducted the study on economic analysis of cashew processing in Karnataka.The study revealed that the processing aspects of cashew nut in Karnataka is based on primary data collected from 30 cashew processing units spread over Udupi and Dakshina Kannada Districts of Karnataka. The data were analysed using descriptive statistics, investment measures and break-even analysis. Investment feasibility of cashew processing units was done using discounted cash flow techniques such as Net Present Value, Benefit-Cost Ratio and Internal Rate of Return. The study indicated that variable cost of processing of cashew nut worked out to Rs. 48,844 per tonne of which the cost of raw materials constituted major item with 81.01 per cent. The marketing costs and fixed costs were in the order of Rs. 3862 per tonne and Rs. 2289 per tonne, respectively. The total cost of processing inclusive of variable cost, marketing cost and fixed cost came to Rs. 54,433 per tonne. Processing units realized net returns of Rs.3,880, Rs.3,537 and Rs.3,009 per tonne in large, medium and small size units, respectively. Business ratios indicated that the medium and large size units were more efficient compared to the small size units. Investment on cashew processing was economically viable as indicated by results of Net Present Value, Benefit Cost Ratio and Internal Rate of Returns. Further, scope for increasing the efficiency and reducing the cost of small processing units was observed.
Naveen et al. (2010) conducted a study on investment analysis in grapevine orchards. The study was conducted in Bijapur district of Karnataka state with overall objectives of studying the feasibility of investment in grapevine orchards. Data were collected from 60 grape wine growers spread over in the district. The per hectare establishment cost were Rs. 3, 94,377.44, The total maintenance cost during bearing period was Rs. 1, 86,043.25. The average yield of grapevine orchards was 14 tonnes per hectare per year and average returns were Rs. 5, 29,787. The study further revealed that NPV for grapevine orchards was Rs. 16, 26,956, the B-C ratio was 2.2, Pay Back period was 3.2 years and IRR was 42.33 per cent.
Ramrao (2011) conducted a study on an economic appraisal of manufacturing and marketing of jaggery in Andhra Pradesh state. He reported that the life span of the jaggery manufacturing units is considered as ten (10) years. The discount rate chosen was 15% which was also the interest rate charged by banks. Sensitivity analysis was carried out at 12 and 18% discount rates. BCR and NPW at 15% discount factor were 1.12 and Rs. 2,13,138.25, respectively. Sensitivity analysis showed that at 12% discount rate the BCR was 1.10 and NPW was Rs. 2,63,158.73. At 18% discount rate the BCR was 1.1 and NPW was Rs.1,70,123.23. The jaggery manufacturing units were found to be profitable at chosen discount factors as the BCR was greater than one (>1) and NPW was positive. The IRR was found to be high (>50). The establishment of jaggery manufacturing units involves considerable costs. From the table it is clear that the investment required for establishing jaggery manufacturing unit was Rs. 1,23,112. The value of the land (Rs.64,264.46) attributed to 52.2% of the total cost. The cost of cane crusher (Rs. 26,887.66) and electric motor (Rs.14,662.64) together contributed to 33.75% of the total cost.
2.3 Cost and returns in processing of agricultural commodities
Muralidharan (1981) investigated the cost of establishing gur units with different capacities and it ranged from Rs. 36,000 for 5 HP, Rs. 43, 920.80 for 7.5 HP, Rs.46, 678. for 10 HP and Rs.65, 185 for 15 HP units. On an average the unit processing cost of gur worked out to be Rs.43.05 per quintal. The input cost was the highest for single element which was Rs.9.77 per quintal (22. 69%) of the total cost. The element costing next highest was labour expense which was Rs.8.64 per quintal (20.02 %). The fixed cost amounted to be Rs. 7,878.56 and variable cost was Rs.18,361.69 with a total cost of Rs.26, 240.25.
Singh et al. (1981) reported that cost of processing of arhar included the cost of fixed resources (the processing plant) and the cost on working capital (the cost for operating the plant). The average investment on fixed and working capital based on five processing units worked out to Rs.13,50,000 and Rs.1,01,920, respectively. The gross income worked out to Rs.50, 24,250. The cost of arhar plus operating cost came to Rs.48, 40,420. Average cost of processing of arhar dal came to Rs. 5.50 per quintal.
Ananth Ram (1989) in his study on economics of processing and marketing of gur in Indore district of Madhya Pradesh revealed that a sum of Rs.6.80 per quintal of gur was the processing cost of sugarcane under power of kolha units.
He noticed that the processing cost differed from unit to unit. The level of capital investment, type of crusher used and the quantity of sugarcane crushed were the factors influencing the processing cost.
Raju and Ramesh (1989) worked out cost of production in jaggery on per hectare basis of sugarcane cultivated. The cost of production of jaggery worked out to be Rs.28,417 per hectare of sugarcane area. About 70 per cent of the total cost accounted for the production of sugarcane. The other major items of cost were wages paid to human labour, rent paid for the use of crushers and chemical ingredients. The jaggery production from one hectare of sugarcane worked out to be 93.28 quintals. The net returns of jaggery production per hectare from sugarcane were estimated to be Rs.5,127 with a total return of Rs. 33,724.
A study by Nagaraj et al. (1989) revealed that the overhead costs in fruit processing accounted for only 12.25 per cent of the total cost of the remaining expenses the cost of fresh fruit accounted for 48.5 per cent of the total cost followed by other material cost (12.50%), labour (7%), advertisement (6%) and taxes (5%).
In a study by Rohal et al. (1989) the average cost of processing of sugarcane into khandasari worked out to Rs.8.54 per Kg. The economic analysis of capital structure in khandasari unit showed a better capital turn over (Rs.1.83 per rupee investment) which indicated further scope of capital investment in the industry.
Raikar (1990) in his study on investment in processing of cashewnut in Karnataka observed that the utilization of installed capacity depended upon the volume of cashew nuts procured. The per quintal cost of processing worked out to Rs.553.54. Interest on capital was the major component (53.62%) in the total cost of processing of cashew nuts followed by wage for piece rate workers (20.36%) and the cost of tin (11.71%). It was found that raw material cost alone formed 72 per cent of the total cost.
Subramanyam and Sudha (1993) reported that the cost of processing one tonne of finished tomato products was around Rs.11, 185 with a total return of Rs.13, 603. The raw material and packing accounted for 71 per cent of the processing cost. The input-output ratio was 2.22. The sensitivity analysis revealed that the processing was highly profitable with a price of Rs.1300 to 1600 tonne for fresh fruits with a conversion ratio of 6 per cent and the price of finished product at Rs. 2500 per tonne. They further reported that each tonne of tomato processed would result in an additional return of Rs.2596 which was nearly three times more than the net returns realized from sale of fresh tomato.
Suryawanshi et al. (1994) reported that the cost of jaggery production was Rs.565 per quintal. They further noticed that 98 quintals of jaggery was prepared from the sugarcane grown on one hectare. They reported that the per hectare total cost of sugarcane cultivation was Rs. 41, 484 and the output per hectare was 89. 93 tonnes. The cost of production per tonne of jaggery was Rs.446.
Malik and Singh (1999) analyzed the cost and returns of sugarcane production in Hardwar district of western Uttar Pradesh. In case of reserve area (< 10 kms from sugar mills) cost A1, A2, B1, B2, C1, C2, gross income from main product and byproduct were Rs.21605, Rs.21605, Rs.24724, Rs.3390.8, Rs.28231, Rs.37415, Rs.45002 and Rs.4419 respectively. In far area (>10 kms from sugar mills ) the above costs in the same order were Rs. 21366, Rs.21366, Rs.24498, Rs.33293, Rs.28009, Rs.42758, and Rs.4416, respectively.
Lohar et al. (2000) estimated per tonne cost of production of sugarcane, per quintal production of jaggery, per quintal manufacturing of sugar and profitability of production of jaggery and sugar. The study was conducted with sample of 30 jaggery producers from six villages in Karveer, Tahsil, Kolhapur district, Maharashtra, India and it revealed that profitability is more in jaggery production.
Pawar and Dongare (2001) studied the jaggery processing in India revealed that, India produces 10.3 million tonnes of jaggery (gur) annually. Tremendous scope exists for improving the manufacturing process. This paper reports on data collected from 23 processing units in the Satara and Kolhapur districts of Maharashtra and makes recommendations for the production of quality jaggery.

Shivaramu et al. (2002) undertaken a detailed survey of jaggery-making units in Cauvery Command Area of Karnataka, India to evaluate the performance of a triple pan jaggery making furnace compared to local types. It was noted that the local types, i.e., single pan and double pan furnaces, took more time in boiling and also affected the quality of jaggery produced. Local furnaces also contained less safer inorganic clarificants and bleaching agents (sodium bicarbonate and sodium hydrosulfites) as compared to the triple pan jaggery, which contained bhendi mucilage. Because of the shorter boiling period, the daily production rate of jaggery in a triple pan furnace was 11.5 q, as compared to 7-8 q in local types. Using the triple pan furnace, the net returns were almost 2-2.5 times more (Rs.1,22,000/year) than with local types (Rs.51,000-65,000/year). In conclusion, the triple pan furnace is more efficient than the local types of furnaces.
Mungare et al. (2005) conducted an experiment at the Regional Sugarcane and Jaggery Research Station, Kolhapur, Maharashtra, India to investigate the clarification efficiency of some synthetic and herbal clarificants suitable for quality jaggery. Based on this it was concluded that application of synthetic clarificants viz., Bhendi Powder SN 22 mg/lit (2ppm) with Bhendi plant 2 kg/100 lit of sugarcane juice is recommended for maximum removal of scum, improving the colour and higher jaggery recovery.
Ramrao (2011) conducted a study on an economic appraisal of manufacturing and marketing of jaggery in Andhra Pradesh state, he reported that the present study sugarcane is accounting for 68.22% of the total cost of jaggery production, sugarcane is one of the key factors in deciding the price of jaggery. For preparing jaggery of one quintal the total cost incurred was Rs. 1,872, out of which 68.2, 10.1, 17.5 and 4.2% costs were incurred on sugarcane and additives, machines rent, labour charges and transport charges respectively. Further, BCR was arrived as 1.19. That is jaggery farmers are getting profits of 19 paisa for one rupee of investment. The time period (PBP) required for achieving the break even volume of output was 66 days, as the average production from the each manufacturing is on an average was 540 kg per day. On an average the jaggery units worked for 120–130 days in the region. From the above analysis, It can be inferred that jaggery production is profitable to the farmers.
From the foregoing reviews it was clear that the cost of processing farm products varied from commodity to commodity, over place and time as well. This was also true in the case of jaggery preparation. Some of the important factors which appeared to influence the processing cost in jaggery were quantity of cane crushed, crushing capacity, type of crusher used, type and quantities of chemical ingredients used and wages paid to the labour force. The length of crushing period also influenced to the processing cost in jaggery.
The review revealed that jaggery production was a major traditional enterprise in sugarcane producing areas. At times, jaggery making was profitable to cane producers than supply to sugar factory. The cost of sugarcane was the major cost item in jaggery production. The investment in jaggery processing units was found to be profitable.
2.4 Shifting from Inorganic to Organic farming
Anand Kumar (1998) found that increasing cost of chemical inputs (63 %), increase on the net return in organic farming (11 %), as the reasons behind shifting to organic farming.
Bruggen et al. (2003) studied the integrated approaches to root disease management in organic farming systems in Marijkeweg, Netherlands and they concluded that conventional agriculture has had major environmental impacts, in particular with respect to soil degradation. Soil structure, fertility, microbial and faunal biodiversity have declined and root diseases are common unless genetic resistance, soil fumigation and/or seed treatments are used. Primarily for environmental reasons and increasing demands for safe and healthy food from the public, farmers have switched over to organic production at an increasing rate.
Loganandan and Singh (2003) observed that more number of respondents (54 %) in Erode district of Tamil Nadu had the motive of environment safety to shift to organic farming followed by financial motives (40 %), soil health oriented motives (34 %), motivation by significant others viz., neighbouring organic farmers, environmental activists etc (30 %), quality of output related motives (24 %), motivation by media (24 %) and philosophical motives (18 %).
Anjugam et al. (2006) studied the economics of usage of bio-inputs in sugarcane to identify the determinants of adoption of bio-inputs and suggest alternate measures for their increased use in sugarcane cultivation in the western zone of Tamil Nadu. The results have revealed that access to bio-inputs, adequate information from the sugar mill; no health hazards have significant positive influence on profitability of adoption of bio-inputs usage in sugarcane.
Anita (2006) conducted a study of Agrocel Industries Ltd., in the Kutch district of Gujarat in reference with promotion of organic cotton cultivation. The study revealed that the farmers are enjoying a net gain of 14 to 20 per cent, resulting from higher revenues and lower costs. The motivation of the farmers to take up organic farming on contract is not based on returns alone; there are benefits like supply of seeds, bio-pesticides, bio-fertilizers, etc. on credit at their door step and that too at subsidized rates; hassle free marketing of output, regular visits of field staff for guidelines and timely payment by the company.
Jaswinder and Kalra (2006) conducted a case study on organic farming in Punjab (India) among 60 farmers. Majority of the respondent farmers were satisfied with contract organic farming. Technical guidance and inputs were provided by firms. Most of the farm operations were done by respondents manually. The total area under organic farming in selected districts was 14.98 per cent of the total operational land holding of the selected respondents and was likely to be increased marginally to 15.14 per cent in next year. The major reasons for opting organic farming reported by the respondents were: easy marketing, additional benefits (certification of farm and premium price), availability of inputs and technical guidance from firms.
Kalamkar (2006) studied the progress, possibilities and constraints of organic farming in India and he revealed that organic farming systems have attracted increasing attention world over due to wide adverse effects of conventional agricultural practices on human diet, environment and sustainability of agricultural production.
Murthy et al. (2008) studied the organic farming practitioners and their perception in Dakshin Kannada and Udupi districts of coastal Karnataka. The main reasons expressed by the organic farmers for adoption were increased pest and disease infestation through chemical fertilizers, loss of soil characters, less profit in chemical farming and health hazard.
Sengar et al. (2010) conducted study on organic agriculture: a prerequisite for sustainability. Organic farming is a production system that avoids or largely excludes the use of synthetically compounded fertilizers, pesticides, growth regulators and livestock feed additives. To the maximum extent organic farming systems rely on crop rotations, crop residues, animal manures, legumes, green manures, off-farm organic wastes, and aspects of biological pest control to maintain soil productivity and tilt, to support plant nutrients and to control insects, weeds and other pests. The main argument against the adoption of organic farming is its relative inefficiency in resulting into sustainable and adequate crop yields immediately, though organic farming is the only way to attain sustainability in agriculture in the long run. In this context, the rediscovered theme of organic farming can reach its expected goal over a long period of 8-10 years gradually replacing the chemical farming. In the transition period, simultaneous use of both the systems may have to be inevitably advocated. Organic farming alone has potential to achieve such sustainability as all the organic farming practices are in the tune with natural processes of an agro-eco-system.
Argiles and Duch (2010) conducted a study on a comparison of the economic and environmental performances of conventional and organic farming: evidence from financial statements. While conventional farming systems face serious problems of sustainability, organic agriculture is seen as a more environmentally friendly system since it favours renewable resources, recycles nutrients, uses the environment's own systems for controlling pests and diseases, sustains ecosystems, protects soils, and reduces pollution. At the same time organic farming promotes animal welfare, the use of natural foodstuffs, product diversity and the avoidance of waste, among other practices. However, the future of organic agriculture will depend on its economic viability and on the determination shown by governments to protect these practices. This paper performs panel regressions with a sample of Catalan farms (Spain) to test the influence of organic farming on farm output, costs and incomes. It analyses the cost structures of both types of farming and comments on their social and environmental performance.
Suresh Reddy (2010) studied the organic farming: status, issues and prospects –a review, it shown that opinion about organic farming are divergent, especially among the experts disagreements about the profitability and yield increase in organic farming are acute , but there is a strong consensus on its eco-friendly nature and inherent ability to protect human health. There are many people who are in favour of organic agriculture, advocate a careful conversion of farms into organic, so that yield loss is taken care to the extent possible.
2.5 Problems of organic farming
Restrepo and Rivera (1997) studied the contribution of the university to the development of organic farming in Latin America. The study revealed that though there was increasing interest in organic farming in Latin America, it has not yet reached the agenda at national policy-making level due to lack of knowledge or opposition. Some of the limitations affecting the widespread adoption of organic farming include lack of human resources, resistance to this method, commercial and economic pressure, land tenure problems, and lack of vision from the universities who could be training organic farming professionals
Ramaswamy et al. (1999) stated that jaggery making is a traditional enterprise in Tamil Nadu and is more profitable to cane producers than supply to the factory. The substantially higher price, immediate disbursements of sale proceeds for the sale of cane, missing registration in time with factory, delay in cutting and complex procedure of transactions with the factory make the cane growers favour cane supply to jaggery making. On the other hand absence of price risk, labour shortage in the case of own jaggery making, financial and technical assistance extended by the factory are the major factors attracting supply of cane to factory. The experience in jaggery making has negative influence on the cane supply to factory. Labour shortage had significant influence in encouraging farmers to supply the cane to the sugar mills. Distance of factory appears less significant in the decision process as the modern transport system viz., tractor had made transport of cane a non issue.
Chothe and Borkar (2000) observed that more number of respondents (61.33 %) in Nagpur district of Maharashtra had the problem of lack of knowledge about biofertilizers, followed by lack of knowledge about benefits of biofertilizers (56.66 %) and lack of knowledge about method of biofertilziers application (52 %), extension workers never show method and result demonstration (41.33 %), no evidence by agricultural department (25.32 %) and non-availability of agriculture guidance in village (20 %).
Saxena and Singh (2000) reported that, a high per cent of organic farmers in Malwa region of Madya Pradesh (70.90 %) had the problem of non-availability of biofertilizer culture of good quality followed by lack of knowledge and skill about improved methods of compost making (63.40 %). Similarly, lack of awareness about the time, concentration and method of biofertilizer application (59.10 %) and non-availability of vermicompost in adequate quantity (43.63 %) were the other problems noticed with organic growing farmers.
Thimmareddy (2001) reported that the majority of the farmers (70 %) of North Karnataka expressed the problem of no separate market for organically grown produce, followed by 40 per cent of the respondents expressed the problem of decline in returns in the initial period (3-4 years) of organic farming. Similarly, the labour problem was expressed by 30 per cent of the respondents whereas 20 per cent of the respondents expressed the problem of non-availability of organic pesticides and lack of published literature on organic farming and a less per cent (10%) of respondents expressed the problem of non-availability of good quality compost, no support and encouragement from sugarcane factory management to produce sugarcane by organic methods, no remunerative price for organic produce and discouragement by people in continued adoption of organic cultivation.
Nain et al. (2002) reported that the irregularity in the distribution of sugarcane purchase indent, delay in payment of sugar cane to the farmers, delay in unloading, lack of transportation facilities etc., were the major problems reported by the selected respondents in marketing of sugarcane to the sugar mills.
Usha et al. (2004) conducted a study to investigate the prevailing processing practices being followed by jaggery manufacturers in the Cauvery Command Area of Karnataka, and Study revealed high income manufacturers used a triple pan furnace while the majority used a double pan furnace due to lower investment and skill required.

It was found that sodium bicarbonate, sodium hydrosulfite and sodium formaldehyde sulfoxylate were the inorganic additives commonly used by all. Besides this, some used trisodium phosphate, while the majority used Magnafloc, of which the chemical composition was unknown. Some chemicals were found to be unlabelled and the safety limits not set by quality control institutions. Organic additives include bhendi mucilage and coconut or castor oil to get the light golden yellow colour and crystalline texture of jaggery. Pan cleaning with dilute HCl was regular and daily among triple pan furnace users, but a majority of double pan furnace users cleaned their pans once every 3 days. None of the manufacturers used disinfectants. A majority of manufacturers stored jaggery in jute bags or in open storage with an average storage time of less than one week. Forty of the manufacturers felt a need for an improvement in colour and hardness and were concerned with discolouration during storage. It is concluded that jaggery manufacturers are not satisfied with the jaggery they produce. This may prompt them to use chemicals indiscriminately to achieve good colour and texture. The manufacturing units are also unhygienic.
Venkatram and Mani (2006) studied the prospects and constraints in adoption of organic farming in Tamil Nadu. The study revealed that the major obstacles in practicing pure organic agriculture have been identified as limited technological options, large marginal costs and risk in shifting to a new system from the conventional farming, low awareness about the organic farming system, lack of marketing and technical infrastructure and added cost by way of inspection and certification.
Mallikarjun (2008) studied the production and marketing management behaviour of organic vegetable growers in Belgaum district, Karnataka. The study revealed that all the respondents expressed that problems of non-availability of labour and lack of research support for providing rationality of traditional organic practices, fluctuation in prices of the commodities, lack of minimum support price and inaccurate weighing instruments used by vegetable venders. While, majority of them expressed the need for fixing profitable minimum support price for organic produce (77.14 %) and establishing separate market for the sale of organic produce (72.14 %).
Dhandhalya et al. (2010) conducted a study on organic wheat farming for sustainable agriculture in Saurashtra region of Gujarat state. The study revealed that lack of marketing network was the main hurdle in disposal of organic wheat, nearly 97 per cent respondents strongly supported that organic farming is a sustainable in the long-run. Organic farming system will also help to promote livestock based integrated farming system and sustain rural livelihood with increased income and employment. The extent of adoption status among the sample farmers has been found fairly well. To encourage organic farming and to realize its full benefits, promotion of certification programme and assured market will go a long way to promote organic farming in Saurashtra region of Gujarat.
Tripathi et al. (2010) conducted study on comparative economics of organic and inorganic farming. The study revealed that the major constraints observed in organic farming were lack of awareness, high input cost, low yield, certification from government and poor market linkage.

3. METHODOLOGY This chapter deals with the description of the study area, selection of samples, the
sampling techniques adopted, the nature and source of data, various tools and techniques employed in analyzing the data. At the end of the chapter, some of the important concepts and terms used in the study are defined and explained to facilitate a clear understanding of the issues with which the current investigation is concerned. This chapter is organized under the following broad sections:
3.1 Selection and description of the study area
3.2 Data base and sampling procedure
3.3 Analytical tools used
3.4 Terms and concepts defined
3.1 Description of the study area
Bagalkot district is located in the Northern part of Karnataka which is the part of larger Deccan plateau. It lies between North latitude 16.12˚ and East longitude of 75.45˚. The district is bounded by Bijapur district towards North, Gadag district towards South, Raichur district towards East, Koppal district towards South-East and Belgaum district towards West.
Bagalkot is the second largest district in Belgaum division and occupies an area of 6,588 Sq.km. with a population of 18,90,826. The district comprises of 6 taluks and 627 villages. The rainfall across the district was 641.60 mm. Rivers like Malaprabha, Ghataprabha and Krishna flows in the district.
3.2 Sampling procedure
Multistage random sampling procedure was followed. In the first stage, in Karnataka Bagalkot district was selected based on number of jaggery units working in the district on one hand and on the other, district represents highest area under sugarcane (Table 3.1). However, Belgaum district was excluded because of inclusion of large number of taluks due to undivided district of North Karnataka. In the next stage, Jamkhandi and Mudhol taluks were selected based on maximum area under sugarcane (Table 3.2).
3.2.1 Selection of the study area
The total geographical area of Bagalkot district was 6,58,877 ha (Table 3.3) , of which net area sown was 4,72,386 ha (71.70 %) followed by area under forest 81055 ha(12.30%), land not available for cultivation 53713 ha (8.15%), fallow land 45985 ha (6.98 %), and other uncultivated land excluding fallow land was 5738 ha (0.87%).
The annual average rainfall of Bagalkot district was 641.6 mm (Table 3.4) and the total area under major crops in the district was 401894 ha, in which total pulses occupied maximum area 144216 ha (35.88 %), followed by sugarcane 104798 (26.08 %), maize 82119 (20.43 %), bajra 34045 (8.47%), wheat 20943 (5.21 %), sorghum 13407 (3.34 %) and cotton 2366 (0.59 %).
Ghataprabha (Mudhol, Jamakhandi and Bilgi taluks), Malaprabha (Badami taluk) and Krishna (Bagalkot and Hunagund taluk) rivers irrigates 3,04,569 ha, of area in Bagalkot district (Table 3.5). The major source of irrigation was from rivers, tanks and ponds (1,23,996 ha) followed by canals (54,825 ha), bore well (1,08,341 ha), wells (14,474 ha ) and lift irrigation (2,933 ha).
Sugarcane is one of the important cash crops grown in Karnataka, which plays a major role in the state’s economy. The crop is grown on an area of 4.21 lakh hectares with a production of 375.95 lakh tonne (Appendix-I). It is cultivated extensively in 16 districts of the state. The district-wise area under sugarcane in Karnataka is represented in Table 3.1. It is evident from the table that Belgaum district ranks first in cultivation of sugarcane with an area of 1,98,917 hectare (40.05 per cent) and production of about 149.73 lakh tonne (46.44 per cent) followed by Bagalkot and Mandya districts with an area of 88,497 and 47,944 hectares, respectively with production of about 64.49 and 26.82 lakh tonne, respectively.
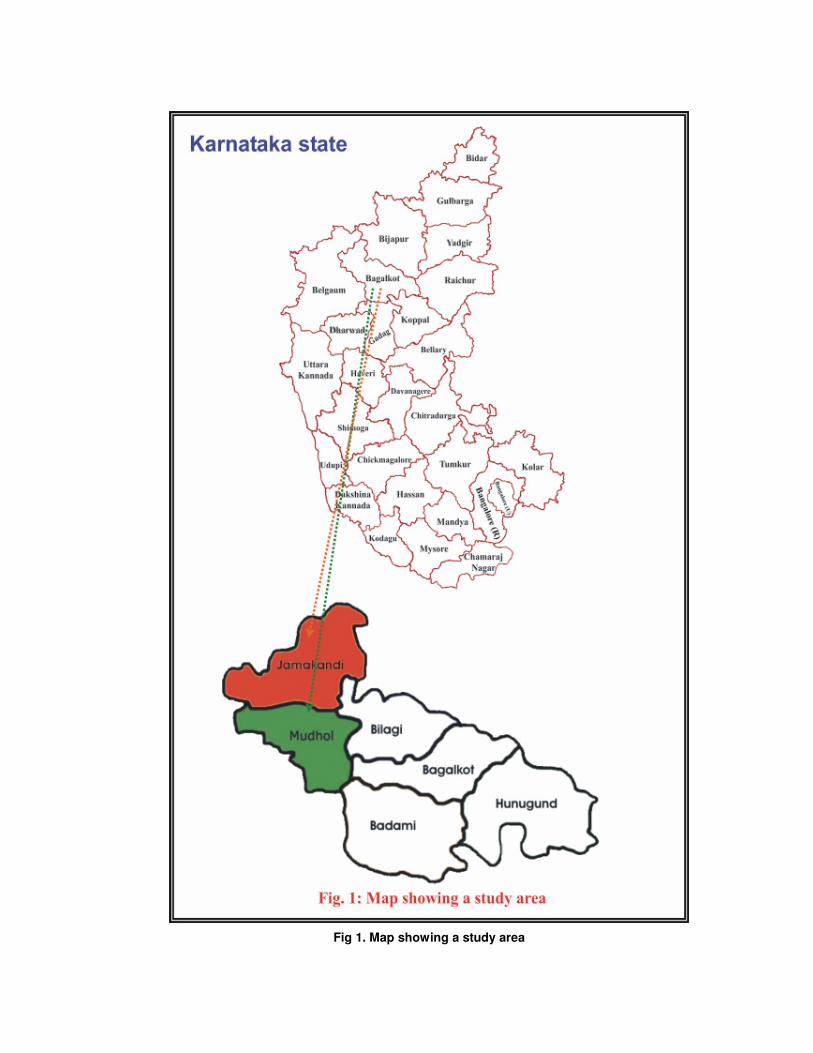
Fig 1. Map showing a study area

Table 3.1: District-wise area under sugarcane in Karnataka
Districts Area under
Sugarcane(ha)
Production
(lakh tonnes)
Productivity
(tonnes/ha)
Bagalkot 88497 (17.82) 65.49 (20.31) 108
Belguam 198917 (40.05) 149.73 (46.44) 107
Bellary 3923 (0.79) 2.39 (0.74) 102
Bidar 29026 (5.84) 18.06 (5.60) 74
Bijapur 44113 (8.88) 18.92 (5.87) 72
Chamrajnagar 11914 (2.40) 7.20 (2.23) 89
Chikkaballapur 41 (0.01) 0.04 (0.01) 101
Chikmagalur 1437 (0.29) 0.05 (0.02) 136
Dakshina Kannada 32 (0.01) 0.02 (0.01) 101
Davangere 8502 (1.71) 4.53 (1.41) 129
Dharwad 5405 (1.09) 0.61 (0.19) 74
Gagad 959 (0.19) 0.10 (0.03) 101
Gulbarga 18939 (3.81) 7.63 (2.37) 67
Hassan 6777 (1.36) 2.35 (0.73) 123
Haveri 2372 (0.48) 0.72 (0.22) 79
Kopal 943 (0.19) 0.32 (0.10) 101
Mandya 47944 (9.65) 26.82 (8.32) 116
Mysore 13393 (2.70) 8.97 (2.78) 112
Raichur 46 (0.01) 0.03 (0.01) 101
Ramnagar 1071 (0.22) 0.88 (0.27) 107
Shimoga 7811 (1.57) 4.55 (1.41) 128
Tumkur 2935 (0.59) 1.89 (0.59) 118
Udippi 118 (0.02) 0.05 (0.02) 101
Uttarakannada 1262 (0.25) 1.05 (0.33) 88
Others* 317 (0.06) 0.00 (0.00) 0
Karnataka 496694 (100) 322.41 (100) 101
* Others – Bangalore (Rural and urban), Chitradurga and Kolar Source: Directorate of Economic and Statistics 2010-2011, Govt. of Karnataka, Banglore. Note: Figures in the parentheses indicate percentage to the respective total

Bagalkot is the second largest sugarcane producing district in Northern Karnataka, the total area and production of sugarcane accounting for 17.82 per cent and 20.31 per cent of the state sugarcane area and production. Organic cultivation of sugarcane is practiced largely in the district. Hence, the Bagalkot district was purposively selected for the study. And also large number of farmers practice the organic as well as inorganic cultivation of sugarcane in the district.
3.2.2 Selection of the sample taluks
Taluk-wise area under sugarcane in Bagalkot district is presented in Table 3.2. Although the crop is cultivated in almost all the taluks, cultivation of the crop is heavily concentrated in Jamkhandi (42.53%) and Mudhol (35.71%) taluks. This is mainly because of the fact that these two taluks are served by assured canal irrigation. Keeping in view of the objectives of this study, these two taluks were considered for in-depth analysis based on maximum area under sugarcane cultivation in the district (Fig. 1). Further, of the 412 jaggery processing units located in the district as many as 180 units (43.69 %) are operating in these two taluks.
The total geographical area of Mudhol and Jamakhandi taluk was 95450 ha and 116853 ha, respectively (Table 3.3). In Mudhol taluk the net area sown was 79515 ha (83.31 %) followed by area under forest 5218 ha (5.47 %), land not available for cultivation 6539 ha (6.85 %), fallow land 3299 ha (3.46 %), and other uncultivated land excluding fallow land was 879 ha (0.92 %) and in case of Jamakhandi taluk the net area sown was 91045 ha (77.91 %) followed by area under forest 11410 ha (9.76 %), land not available for cultivation 7107 ha (6.08 %), fallow land 5459 ha (4.67 %), and other uncultivated land excluding fallow land was 1832 ha (1.57 %).
The soils of Mudhol and Jamkhandi taluks are derived from trap rocks, sand stones and lime stones. Both kharif and rabi crops are grown in medium black soils and only rabi crops are raised in deep black soils.
The total area under major crops in Mudhol taluk was 73286 ha (Table 3.4), in which sugarcane occupied maximum area 37419 ha (51.06 %), followed by maize 18033 ha (24.61), total pulses 7608 ha (10.38 %), wheat 6099 ha (8.32 %), sorghum 2895 ha (3.95 %), bajra 1000 ha (1.32 %), and cotton 232 ha (0.32 %).
Ghataprabha left bank canal irrigates 76376 ha in Mudhol and 91596 ha in Jamakhandi taluk of Bagalkot district (Table 3.5). The major sources of irrigation in Mudhol taluk was from other sources like rivers, tanks and ponds (28249 ha) followed by canals (22990 ha), bore well (19847 ha) and wells (5290 ha) and in case of Jamakhandi taluk major sources of irrigation were from other sources like rivers, tanks and ponds (57093 ha) followed by canals (12931 ha), bore well (12720 ha), wells (6510 ha) and lift irrigation (2342 ha).
3.2.2 Description of the selected sample villages and sugarcane farmers
The list of villages growing sugarcane and jaggery preparation was obtained from the office of the Assistant Director of Agriculture at Mudhol and Jamkhandi taluks. From this list, a total of three villages were selected randomly from each taluk. In each sampled village, the primary data was collected from the sample farmers of both 30 organic and 30 inorganic sugarcane cultivating farmers and 9 organic and 9 inorganic jaggery processing units were selected randomly from each selected taluks, with a total sample size of 120 sugarcane cultivating (Table 3.6) and 36 farmers having jaggery units (Table 3.7). All organic farmers which were selected all members of Ranna Savayava Krishi Sanste, Bagalkot, which is provide certification to all members.
3.2.3 Nature and sources of data
For evaluating the objectives, both primary and secondary data were used in the study. Pre-tested and well-structured schedules were used for eliciting the required information from the sample respondents. The data pertaining to area under sugarcane, inputs used and output realized in organic and inorganic sugarcane cultivation along with their market values, investment requirement for establishing jaggery processing units in physical and monetary values, cost incurred in jaggery processing and quantities of both organic and inorganic jaggery produced were collected through personal interview method.

Table 3.2: Taluk-wise area under sugarcane cultivation in Bagalkot District
SN Taluk Area (ha) Per cent to total cultivated area
1 Badami 5122 4.89
2 Bagalkot 5455 5.21
3 Bilgi 11115 10.61
4 Hungund 1118 1.07
5 Jamkhandi 44569 42.51
6 Mudhol 37419 35.71
Total 104798 100.00
Source: District Statistical Office, Bagalkot (2010-2011).
Information on place and time of sale, price received, cost incurred in marketing were also collected from the sample respondents. The data for the present study were collected for the crop year 2011-12.
The information on area under sugarcane, number of jaggery processing units operating in the study area during 2010-11 was obtained through various statistical reports published by the Office of the District Statistical Officer, Bagalkot.
3.3 Analytical techniques
To fulfill the specific objectives of the study, based on the nature and extent of data, the following analytical tools and techniques were employed.
1. Tabular method
2. Budgeting technique
3. Financial analysis
4. Break-even analysis
3.3.1 Tabular presentation
The tabular presentation method was followed to study the general characteristics of sample of both organic and inorganic sugarcane farmers, the average cost and returns involved in organic and inorganic sugarcane cultivation, reasons for shifting over to organic farming and problems faced by the organic farmers.
3.3.2 Budgeting Technique
The budgeting technique method was followed to compute the average cost and returns involved in organic and inorganic jaggery processing unit, averages and percentages were worked out for the purpose of comparison. The major cost items involved in jaggery processing units have been detailed as follows
a. Raw material cost
Sugarcane is the one of major raw material used in jaggery processing. All the jaggery processors processed the sugarcane grown on their own lands and /or the sugarcane purchased from neighbouring farmers. Hence, the sugarcane cost was computed taking sugar factory price wherever owned sugarcane was used. Actual price paid including the transport charges was considered wherever it was purchased.

Table 3.3: Land utilization pattern in Mudhol and Jamkhandi taluks of Bagalkot district during 2010-2011
Mudhol taluk Jamkhandi taluk Bagalkot district
SN Particulars
Area (ha)
Per cent to
total
geographical
area
Area (ha)
Per cent to
total
geographical
area
Area (ha)
Per cent to
total
geographical
area
1 Area under forest 5218 5.47 11410 9.76 81055 12.30
2 Land not available for cultivation 6539 6.85 7107 6.08 53713 8.15
3 Other uncultivated land excluding
fallow land 879 0.92 1832 1.57 5738 0.87
4 Fallow land 3299 3.46 5459 4.67 45985 6.98
5
Net area sown 79515 83.30 91045 77.92 472386 71.70
6 Total geographical area 95450 100.00 116853 100.00 658877 100.00
Source: District Statistical Office, Bagalkot (2010-2011).

Table 3.4: Key indicators of Mudhol and Jamkhandi Taluks of Bagalkot district during
2010-2011
Taluks SN Particulars
Mudhol Jamkhandi
Bagalkot
District
1 Geographical area(ha) 95450 116853 658877
2 Population (No) 275174 408441 1651892
3 Normal rainfall (mm) 683.5 672.0 641.6
4 Forest area (ha) 5218 11410 81055
5 Total cultivated area (ha) 96484 106002 608723
6 Irrigated area (ha) 76376 91596 304569
7 Area under major crops (ha)
a) Maize 18033(24.61) 24124(28.78) 82119(20.43)
b) Sorghum 2895(3.95) 3238(3.86) 13407(3.34)
c) Wheat 6099(8.32) 4987(5.95) 20943(5.21)
d) Sugarcane 37419(51.06) 44569(53.16) 104798(26.08)
e) Bajra 1000(1.32) 988(1.18) 34045(8.47)
f) Cotton 232(0.32) 134(0.16) 2366(0.59)
g) Total pulses 7608(10.38) 5795(6.91) 144216(35.88)
Total 73286(100.00) 83835(100.00) 401894(100.00)
8 Jaggery processing units (No) 84 96 412
Source: District Statistical Office, Bagalkot (2010-2011).

Table 3.5: Source of Irrigation and area Irrigated in Mudhol and Jamkhandi taluks of Bagalkot district during 2010-2011
Mudhol taluk Jamkhandi taluk Bagalkot district
SN Source of irrigation Gross irrigated
area (ha) Per cent
Gross irrigated
area (ha) Per cent
Gross irrigated
area (ha) Per cent
1 Canals 22990 30.10 12931 14.12 54825 18.00
2 Wells 5290 6.93 6510 7.11 14474 4.75
3 Borewells 19847 26.00 12720 13.89 108341 35.57
4 Lift irrigation - - 2342 2.56 2933 0.96
5 *Other sources 28249 37.00 57093 62.32 123996 40.72
Total 76376 100.00 91596 100.00 304569 100.00
* Other sources: Rivers, tanks, and ponds
Source: District Statistical Office, Bagalkot (2010-2011)

Table 3.6: Sampled villages and farmers in Bagalkot district
Sugarcane sample farmers
Taluks Villages
Organic Inorganic
Grand total
(n=120)
Mudhol taluk a. Kulali
b. Mudhol
c. Shirol
10
10
10
10
10
10
20
20
20
Subtotal 3 30 30 60
Jamkhandi taluk a. Teradal
b. Hipparagi
c. Jamakhandi
10
10
10
10
10
10
20
20
20
Subtotal 3 30 30 60
Grand total 6 60 60 120
Table 3.7: Sampled villages and jaggery processors in Bagalkot district
Jaggery processors
Taluks Villages
Organic Inorganic
Grand total
(n=36)
Mudhol taluk a. Kulali
b. Mudhol
c. Shirol
3
3
3
3
3
3
6
6
6
Subtotal 3 9 9 18
Jamkhandi taluk a. Teradal
b. Hipparagi
c. Jamakhandi
3
3
3
3
3
3
6
6
6
Subtotal 3 9 9 18
Grand total 6 18 18 36
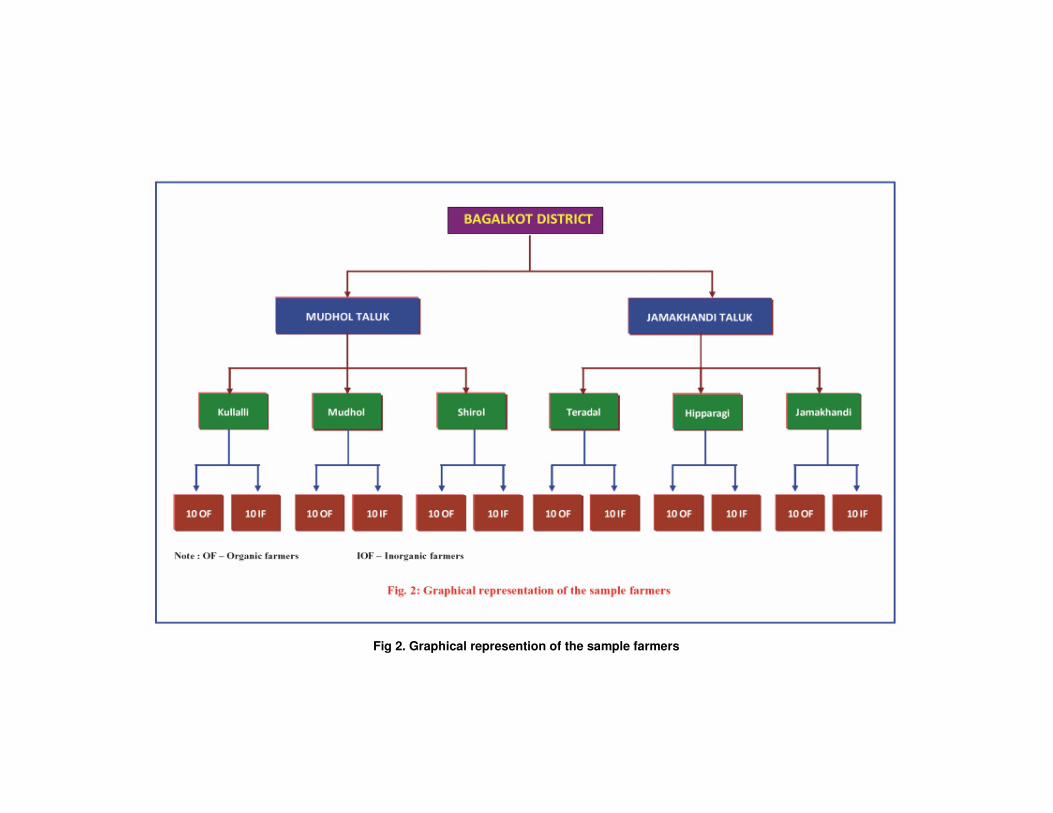
Fig 2. Graphical represention of the sample farmers
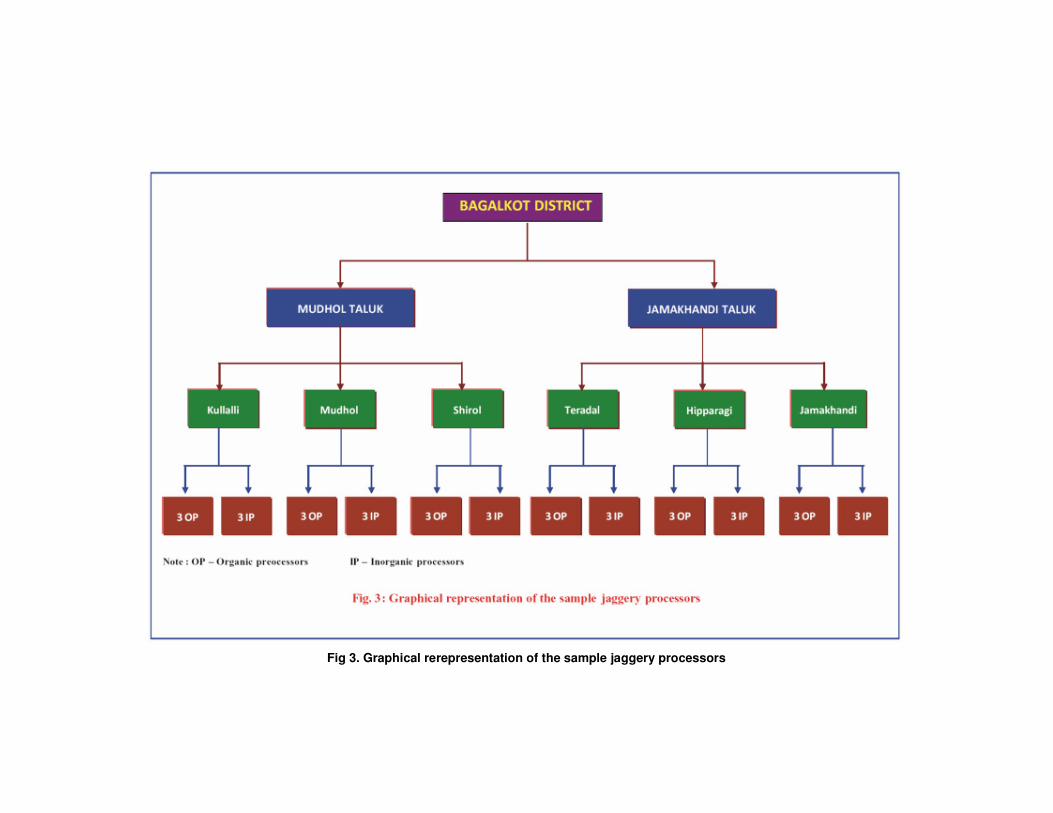
Fig 3. Graphical rerepresentation of the sample jaggery processors

b. Processing cost
Different chemicals/materials are used in jaggery processing; the costs of chemicals/materials used in jaggery processing were calculated at the actual price paid by the processor including transportation charges. The other costs included in processing were, wages paid to labour, fuel charges, interest on investment and depreciation. Depreciation was computed by using straight line method. The interest on investment was calculated at a rate of 12 per cent per annum on the book value. The actual wages paid to the labor were considered as labour charges. Baggase was the by-product of the jaggery processing units. Baggase was the major source of fuel for the jaggery processing units. However, the baggase produced from each unit was not sufficient to meet the entire fuel requirement of the respective processing units. A part of the fuel requirement was therefore, met by purchasing from other processors. The actual price paid for purchasing the fuel including the transportation cost was considered.
c. Cost of establishing jaggery processing unit
The jaggery processing units considered for the study were established in different years. Therefore, the written down values of all the machineries/equipments were considered and compounded to the reference year (2011-12) for the purpose of computing cost of establishing jaggery processing unit. Cost of each machinery/equipment including the shed requirement for establishing jaggery processing unit was considered.
3.3.3 Financial analysis
The financial feasibility of investment in jaggery processing unit is mainly based on the incremental cost and returns accruing from processing units over it life span. The Pay-Back Period (PBP), Net Present Worth (NPW), Benefit-Cost Ratio (BCR) and Internal Rate of Returns (IRR) were used as appraisal criteria for evaluating financial viability of jaggery processing units.
Pay-Back Period (PBP): Pay-back period refers to the length of time period required for an investment to generate the net cash income to be equal to the original investment. This time period is expressed in years.
I PBP =
Y
Where,
I = Initial investment
Y= Net cash flow
Net Present Worth (NPW): The net present worth represents the discounted value of the net cash inflow to the project .The N.P.V has been defined as fallows.
NPW
=
n
Σ Yn r =1
(1 + r)-n
] – C
Where
Yn= Series of net cash inflows
r = Discount Rate
C = Initial cost of investment
n = Time period

Benefit-Cost Ratio (BCR): It is the ratio of discounted project benefits to project cost. It has been defined as fallows.
Yi
BCR =
n
Σ
i=l (1+i)
n
÷ C
Where,
Yi, r, n and C are as defined in NPV
Internal Rate of Returns (IRR): It is the discount rate at which the net present value of the project is zero.
IRR
Many workers have argued that the opportunity cost of capital, cost of borrowing and social rate of time preference should be the criteria in selecting appropriate discount rate in the financial analysis. Hence, the cost of borrowing (12%) was considered as discount rate in the present investigation. A ten year time horizon was considered for the present investigation. An attempt was made to test the sensitivity of the benefits of processing units to changing prices of inputs and output.
3.3.4 Break even analysis: The break-even analysis was also attempted to estimate the level of jaggery production at which the returns are just sufficient to recover the initial investment in processing units. The break-even volume of output was determined with help of the following formula.
Break-even output = Fixed cost
unit variable cost - unit output price
An attempt was also made to estimate full capacity utilization of jaggery processing units under considerations. Based on this, the present installed capacity utilization was worked out. Accordingly, the number of days a processing unit required to operate for reaching break even output was worked out.
Assumptions made while calculating the NPW, BCR and IRR
1. The economic life of jaggery processing unit was considered as 10 years.
2. The apportioned cost of establishment and other fixed costs, expenditure on fuel, labour and all operating expenses in processing of jaggery formed the total cost and hence the cash out flow.
3. The return or income obtained by the sale of jaggery constituted the cash inflows of the project.
4. The cost and return were assumed to be constant throughout its project life period.
Present worth of the cash flow at the lower discount
rate
Absolute difference between present worth of cash flow at two discount
rates
+
Difference
between two
discount rates
Lower
discount
rate =

3.4 Terms and concepts used in the study
1. Organic farms: The farms which cultivate crops by using only organic sources of inputs without the use of any synthetic chemicals in the production process.
2. Inorganic farms: The farms which cultivate crops by using both organic and conventional sources of nutrients which include synthetic fertilizers, pesticides and growth regulators
3. FYM: Farm yard manure was charged as per the prevailing market rates during the period of study in the study area.
4. Fertilizers: The fertilizer cost was calculated at the actual price paid by the farmer.
5. Organic manures: Compost, sheep and poultry manures, green manures and oil cakes were considered under broad category of organic manures and valued at market rates.
6. Bio-fertilizers: The carrier based micro-organisms which are used for either setts (seed material) or seedling treatments or mixing with vermicompost in order to enrich soil microbial population. It includes Rhizobium, Azatobactor, Azospirullum, Phosphate Solubilising Bacteria and Cellulose degraders. The purchase prices of these inputs were taken as their cost.
7. Green manure: The cost of green manure was estimated in terms of bundles and the market price was considered for accounting
8. Vermicompost: The compost which is prepared by using agricultural waste materials and earth worms feeding on it to produce excreta which is rich source of N, P, K and other micro nutrients. The quantity of vermicompost used is measured in quintal and the cost was evaluated at market price.
9. Variable costs: The variable costs include cost of seed, organic manure, fertilizers, wages of human, bullock and machine labours, plant protection components and interest on operational capital at the rate of 7 per cent per annum.
10. Interest on working capital: This was calculated on the entire working capital of the enterprise at the prevailing rate of interest of 7 per cent per annum on short-term loans for the duration of the crop by financial institutions.
11. Fixed costs: These include depreciation on farm implements and machinery, land revenue, rental value of land and interest on fixed capital.
12. Depreciation charges: Depreciation on each capital equipment and machinery owned by the farmers and used for cultivation of land was calculated for individual farmer based on the purchase value using the straight line method.
Annual depreciation = Purchase value – Junk value
Economic life span of the asset
13. Land revenue: Actual land revenue paid by the farmers was considered.
14. Land rent: The prevailing land rent for agricultural enterprises were imputed for the sample farmers, since all land holdings were observed to be owner operated.
15. Interest on fixed capital: Interest on fixed capital was calculated at 12 per cent per annum, which is the prevailing rate of investment credit. The items considered under fixed capital are implements and machinery.
16. Apportionment of cost : Investment made in both organic and inorganic jaggery processing units is remains same, the total establishment cost during the first year was apportioned over the economic life span of the jaggery processing unit, which was fixed at 10 years after enquiry with the sample jaggery processors.
17. Cost of cultivation: It is the sum of variable costs and fixed costs expressed on rupees per acre basis.

18. Gross returns: It is obtained by multiplying the total product with its sale price per quintal.
19. Net returns: It is obtained by deducting the total costs incurred from the gross returns.
20. Shed: It is made up of wood or straw, mainly used for providing shade while preparation of jaggery. It is also used for storing jaggery.
21. Furnace: It is used for boiling the cane juice. It is built with bricks and cement.
22. Pan: It is a flat open vessel made up of iron. The general dominations are 2 ½ feet height and 3 ½ feet radius. It is mainly used for boiling the cane juice upto 85-90
0C.
23. Cane crusher: It is a machine made up of iron, used to crush the cane and to extract juice from the sugarcane.
24. Electrical motor: It is electrical machines, used for crushing cane and to lift the sugarcane juice from bani and transfers it to boiling pans.
25. Filter plate: It is made up of iron used for filtering sugarcane juice.
26. Bani: An underground construction made up of cement and bricks used for collecting juice.
27. Gori: It is made up of iron, mainly used to remove waste materials and scum from juice during boiling.
28. Hutta / Agarwali: Made up of iron which is small in size, mainly used to transfer hot juice to moulds/buckets to provide uniform shape and size to jaggery.
29. Magi /Katti: It is constructed on the ground surface, with four walls which are made up of wooden plates to help in cooling the hot juice before it is transferred to iron moulds.
30. Ash-spade: Made up of iron, thin and long in shape used for removing the ash from the furnace.
31. Moulds: Moulds are made up of crude iron having a shape of bucket with a capacity to accommodate 20 to 22 kg of jaggery.
32. Processor: He is a person, who undertakes the processing of sugarcane into jaggery on his own processing unit.

4. RESULTS In consonance with the object of the study, the data collected from primary sources
were analyzed and interpreted. The results of the study are presented in this chapter under the following heads.
4.1 General characteristics of the sample farms
4.2 Cropping pattern on the sample farms
4.3 Cost and returns involved in both organic and inorganic farms
4.4 Investment pattern in jaggery processing units
4.5 Cost and returns involved in both organic and inorganic jaggery preparation
4.6 Reasons for shifting from inorganic to organic cultivation of Sugarcane
4.7 Problems of organic sugarcane farmers
4.1 General characteristics of the sugarcane sample farmers
The general characteristics of the sample farmers are presented in Table 4.1. The study covered 60 farmers each for organic and inorganic farmings spread over three villages each in Mudhol and Jamakhandi taluks of Bagalkot district.
The average age of the organic sugarcane farmers was 44.82 years whereas that of inorganic sugarcane farmers was 42.69 years. It could be further observed that majority of the sample farmers both organic (71.66 %) and inorganic farmers (63.34 %) were literate having their education ranging from primary to college level, and in both the cases the main occupation of them was agriculture, that is about 85 per cent in case of organic sugarcane farmers and 93 per cent in case of inorganic sugarcane farmers.
From the table it could also be seen that the average size of the family of both organic and inorganic sugarcane farmers was about seven and six members, respectively and average size of land holding was 8.49 acres, of which 6.91 acres of area was irrigated and remaining 1.58 acres of area was dry land in case of organic sugarcane farmers whereas in case of inorganic sugarcane farmers the average size of land holding was 7.25 acres, of which 6.22 acres of area was irrigated and remaining 1.03 acres of area was under dry land. And average area under organic and inorganic sugarcane was 3.71 acres and 3.02 acres, respectively. The sugarcane varieties grown by the organic farmers in the study area were Co-92005, Co-671 and Co-86032, out of these three varieties Co-86032 and Co-671 (Gangavati) are being cultivated widely under the organic, whereas the varieties grown by the inorganic farmers were Co-8014, Co-7219, and Co-86032.
The average livestock possession of organic farmers was 7.61 in number of which buffaloes were more (32.46 %) followed by cows (21.68 %), sheep (18.66 %), young stocks (15.90 %) and bullocks (11.30 %). Whereas in case of inorganic farmers average livestock possession was 4.43 in number of which sheep were more (27.77 %) followed by buffaloes (25.73 %), cows (19.64 %), bullocks (17.83 %) and young stocks (9.03 %).
4.2 Cropping pattern and major crops grown
Cropping pattern on the sample farms is presented in Table 4.2.
It is evident from the table that all categories of farmers are growing a number of crops on their farm. Sugarcane, maize, turmeric, bajra and groundnut were the major crops grown whereas soybean, sorghum, wheat, chickpea and cotton were the other crops grown by the sample farmers.
The major crops grown during kharif season by the organic sugarcane sample farmers were sugarcane, maize, turmeric, groundnut, soybean, bajra, and cotton. Among these crops the area under sugarcane was found to be highest (3.71 acres), followed by maize (1.53 acres), groundnut (0.82 acres), turmeric (0.67 acres), bajra (0.51 acres) and soybean (0.35 acres) and cotton (0.03 acres).

Table 4.1: General characteristics of sample sugarcane farmers
Sugarcane growers(n=120) SN Particulars
Organic(60) Inorganic(60)
1 Age (years) 44.82 42.69
2 Education(No.)
Illiterate 17 (28.33) 22 (36.66)
Primary 11 (18.33) 07 (11.67)
High school 20 (33.34) 19 (31.67)
College 12 (20.00) 12 (20.00)
Total 60 (100.00) 60 (100.00)
3 Occupation (No.)
Agriculture as main occupation 51 (85) 56 (93.33)
Other subsidiary occupations 09 (15) 04 (6.67)
Total 60 (100) 60 (100)
4 Family size 6.70 5.80
5 Land holdings(Acres)
Irrigated 6.91 (81.39) 6.22 (85.79)
Dry land/ Rainfed 1.58 (18.61) 1.03 (14.21)
Total 8.49 (100.00) 7.25 (100.00)
6 Average area under sugarcane(Acres) 3.71 3.02
7 Varieties / HYV used Co-92005,
Co-671, Co-86032
C0-8014, Co-7219, Co-86032
Livestock(No.)
a. Cows
b. Buffaloes
c. Young stocks
d. Bullocks(pairs)
e. Sheep
1.65 (21.68)
2.47 (32.46)
1.21 (15.90)
0.86 (11.30)
1.42 (18.66)
0.87 (19.64)
1.14 (25.73)
0.40 (9.03)
0.79 (17.83)
1.23 (27.77)
8
Total 7.61 (100.00) 4.43 (100.00)
Note: Figures in the parentheses indicate percentage to the respective total

Table 4.2: Cropping pattern of the sample sugarcane farmers (Area in Acres)
Sugarcane growers(120) SN Crops / season
Organic (n=60) Inorganic (n=60)
I Kharif Area % Area %
1 Sugarcane 3.71 22.11 3.02 22.16
2 Maize 1.53 9.12 1.32 9.68
3 Turmeric 0.67 3.99 0.56 4.11
4 Bajra 0.51 3.04 0.42 3.08
5 Soybean 0.35 2.09 0.19 1.39
6 Ground nut 0.82 4.89 0.76 5.58
7 Cotton 0.03 0.18 0.05 0.37
Sub-Total 7.62 45.41 6.32 46.37
II Rabi
1 Sugarcane 3.71 22.11 3.02 22.16
2 Wheat 0.43 2.56 0.34 2.49
3 Sorghum 0.52 3.10 0.12 0.88
4 Cotton 0.03 0.18 0.05 0.37
5 Chickpea 0.64 3.81 0.76 5.58
Sub-Total 5.33 31.76 4.29 31.47
III Summer
1 Sugarcane 3.71 22.11 3.02 22.16
2 Maize 0.12 0.72 0 0.00
Sub-Total 3.83 22.82 3.02 22.16
Gross cropped area 16.78 100.00 13.63 100.00
Net cropped area
Cropping intensity (%)
8.49
197.64
-
-
7.25
188.00
-
-

During rabi season sugarcane, chickpea, sorghum, wheat and cotton, the average area under sugarcane crop was found to be highest (3.71 acres) followed by chickpea (0.64 acres), sorghum (0.52 acres), wheat (0.43 acres) and cotton (0.03 acres), respectively. During summer, irrigation facility was made available for sugarcane to complete its duration and in this season maize has 0.12 acre.
In case of inorganic sugarcane farmers the major crops grown during Kharif by the sample farmers were sugarcane (3.02 acres), maize (0.32 acre), groundnut (0.76 acres), turmeric (0.56 acres), bajra (0.42 acres), and soybean (0.19 acre). During rabi season, sugarcane (3.02 acres), chickpea (0.76 acres), wheat (0.34 acres), sorghum (0.12 acres) and cotton (0.05 acres) were grown. During summer season irrigation was made available for sugarcane to complete its duration.
It was noticed that the gross cropped area of organic farms was 16.78 acres, whereas it was 13.63 acres in case of inorganic farms. In both the categories of farms, sugarcane occupied a major portion of area under cultivation. The cropping intensity was high in case of organic sugarcane farms (197.64 %) than inorganic sugarcane farms (188 %).
4.2.1 Labour use pattern in cultivation of organic and inorganic sugarcane
The per acre quantity of labour used, costs involved in the different operations of organic and inorganic sugarcane farms are presented in Table 4.3.
In case of per acre organic sugarcane production, about 3 and 2 machine hours were used for ploughing and transportation of FYM, respectively. Among pair days of bullock labour used, a highest bullock labour was found to be used in intercultivation operation (3 pair days) followed by sett bed preparation (2.50 pair days) and harrowing (1.50 pair days). The highest human labour was used in case of irrigation (23.26 man days) followed by hand weeding (18.64 man days), harvesting (17.73 man days), planting (4.6 man days), spreading of FYM ( 3.20 man days), application of organic manure (2.61 man days ) and application of biopesticides (1.45 man days).
The maximum cost involved (Rs.3,302.92) was in case of irrigation followed by hand weeding (Rs. 2,646.88), harvesting (Rs.2,897.25), harvesting (Rs.2,517.66), ploughing (Rs.1,350), intercultivation (Rs.1,200), sett bed preparation (Rs.1,000 transportation of FYM (Rs. 900), planting (Rs.653.20), harrowing (Rs. 600), spreading of FYM (Rs.454.40), organic manures (Rs.370.62) and biofertilizers / biopesticide application (Rs. 205.90).
In case of per acre inorganic sugarcane production, about 3 and 1.80 machine hours were used for ploughing and transportation of FYM, respectively. Among pair days of bullock labour used, a highest bullock labour was found to be used in intercultivation operation (3 pair days) followed by sett bed preparation (2.40 pair days) and harrowing (2 pair days). The highest human labour was used in case of irrigation (24.26 man days) followed by hand weeding (22.16 man days), harvesting (18.73 man days), planting (4.80 man days), application of chemical fertilisers (3.81 man days) and spreading of FYM ( 3.10 man days).
The maximum cost involved (Rs. 3,444.92) was in case of irrigation followed by hand weeding (Rs.3146.72), harvesting (Rs. 2659.66), ploughing (Rs.1350.00) intercultivation (Rs. 1,200), sett bed preparation (Rs. 960.00), transportation of FYM (Rs. 810), harrowing (Rs. 800), planting (Rs.681.60), fertilisers (Rs.541.02) and spreading of FYM (Rs. 440.20).
Among the different types of labour used, utilization of human labour was found to be highest in case of inorganic (76.86 man days) compared to organic (71.49 man days) sugarcane cultivation.
4.3 Cost and returns involved in organic and inorganic sugarcane farms
Per acre cost of sugarcane cultivation on organic and inorganic farms is presented in Table 4.4.
Perusal of the table indicated that the per acre total cost of sugarcane cultivation on organic farm was found less than that of inorganic farm. The average cost of sugarcane cultivation on organic farm was Rs. 45,974.50 per acre as against Rs. 54,331.82 per acre on inorganic farm.
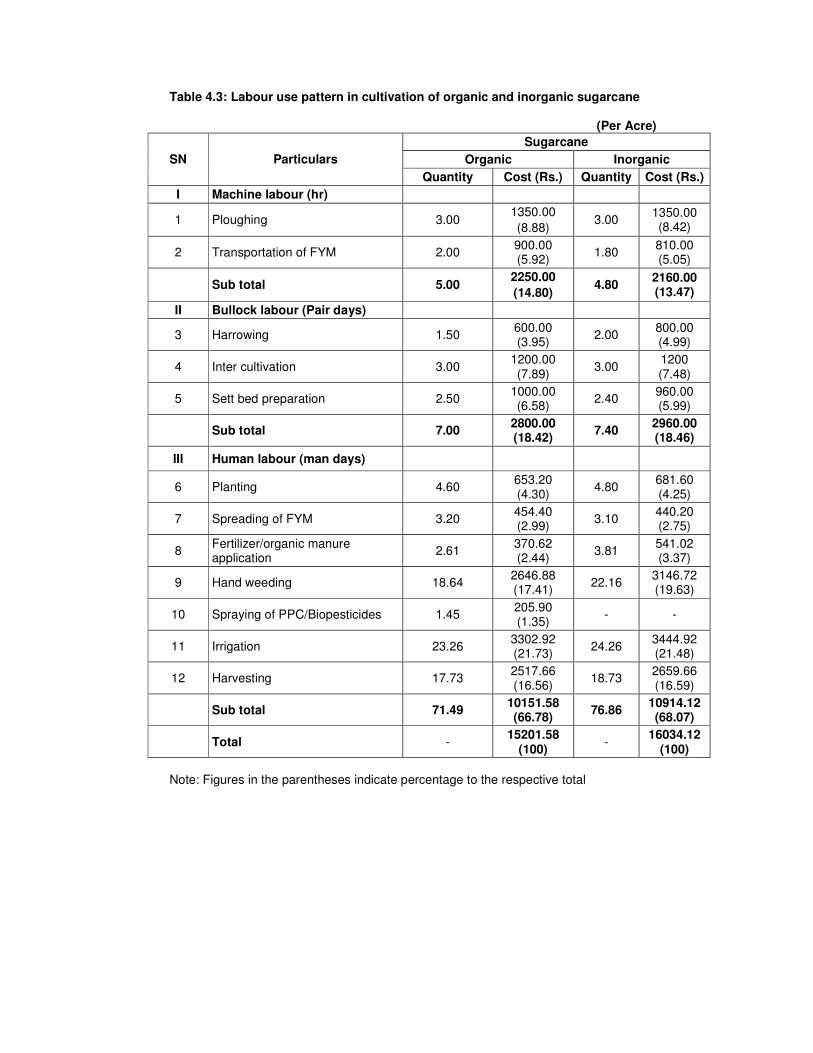
Table 4.3: Labour use pattern in cultivation of organic and inorganic sugarcane (Per Acre)
Sugarcane
Organic Inorganic SN Particulars
Quantity Cost (Rs.) Quantity Cost (Rs.)
I Machine labour (hr)
1 Ploughing 3.00 1350.00
(8.88) 3.00
1350.00 (8.42)
2 Transportation of FYM 2.00 900.00 (5.92)
1.80 810.00 (5.05)
Sub total 5.00 2250.00
(14.80) 4.80
2160.00 (13.47)
II Bullock labour (Pair days)
3 Harrowing 1.50 600.00 (3.95)
2.00 800.00 (4.99)
4 Inter cultivation 3.00 1200.00 (7.89)
3.00 1200 (7.48)
5 Sett bed preparation 2.50 1000.00 (6.58)
2.40 960.00 (5.99)
Sub total 7.00 2800.00 (18.42)
7.40 2960.00 (18.46)
III Human labour (man days)
6 Planting 4.60 653.20 (4.30)
4.80 681.60 (4.25)
7 Spreading of FYM 3.20 454.40 (2.99)
3.10 440.20 (2.75)
8 Fertilizer/organic manure application
2.61 370.62 (2.44)
3.81 541.02 (3.37)
9 Hand weeding 18.64 2646.88 (17.41)
22.16 3146.72 (19.63)
10 Spraying of PPC/Biopesticides 1.45 205.90 (1.35)
- -
11 Irrigation 23.26 3302.92 (21.73)
24.26 3444.92 (21.48)
12 Harvesting 17.73 2517.66 (16.56)
18.73 2659.66 (16.59)
Sub total 71.49 10151.58 (66.78)
76.86 10914.12 (68.07)
Total - 15201.58
(100) -
16034.12 (100)
Note: Figures in the parentheses indicate percentage to the respective total

0
500
1000
1500
2000
2500
3000
3500
Co
st
(Rs
/acre
)
Ploughing
Transp. o
f FYM
Harrowing
Inter cultiv
ation
Sett bed pre
paratio
n
Planting
Spreading of F
YM
Fert./o m
anure
Hand weeding
Bio pesticid
es
Irrigatio
n
Harvesting
Particulars
Organic Inorganic
Fig. 4: Labour use pattern in organic and inorganic cultivation of sugarcane
Human labour (m.d)Bullock labour (p.d.)Machine labour (hr)
Fig. 4: Labour use pattern in organic and inorganic cultivation of sugarcane

The cost of chemical fertilizers on inorganic farms was the differing factor in the cost. In the total cost, variable costs accounted for a major share. The proportion of variable cost was Rs. 35,710.82 and Rs. 44,294.38 accounting for 77.68 per cent and 81.53 per cent of the total cost of sugarcane cultivation on organic and inorganic farms, respectively.
In the case of organic farms, the variable costs mainly comprised of cost of human labour, cost of organic manures (FYM, green manuring, vermicompost, biofertilizers and biopesticides), cost of setts and cost of bullock labour which were, Rs. 10151.58, Rs. 9,613.02, Rs. 8,320 and Rs. 2,800 accounting for 22.08 per cent, 20.90 per cent, 18.10 per cent and 6.09 per cent of the total cost of cultivation, respectively. The expenditure on organic manure found to be an important cost item in total cost of cultivation on organic farms. The other variable cost items such as interest on working capital and cost of machine labour accounted for 5.08 per cent (Rs. 2,336.22) and 4.89 per cent (Rs. 2,250) of the total cost of sugarcane cultivation on organic farms, respectively.
In the cost of sugarcane cultivation on inorganic farms, the variable cost mainly comprised of cost of human labour, cost of setts, cost of FYM and cost of chemical fertilisers which were Rs. 10914.12, Rs. 9,900, Rs. 5,624 and Rs. 5,090 accounting for 20.09 per cent, 18.22 per cent, 10.35 per cent and 9.37 per cent of the total cost of cultivation, respectively. The other variable cost items such as cost of bullock labour and interest on working capital accounted for 5.45 per cent (Rs. 2960) and 4.76 per cent (Rs. 2587.80) of the total cost of sugarcane cultivation on inorganic farms, respectively. The expenditure on chemical fertilizers found to be an important cost item in the total cost of sugarcane cultivation on inorganic farms.
The percentage share of fixed cost in the total cost of sugarcane cultivation on organic and inorganic farms was 22.32 per cent (Rs 10,263.68) and 18.47 per cent (Rs. 10,037.44), respectively. Among the items of fixed cost, the rental value of the land had a maximum share in the total cost of sugarcane cultivation on both organic and inorganic farms.
On an average the yield of organic sugarcane farm was 43.56 tonnes per acre whereas it was 45.20 tonnes in case of inorganic farms.
The total returns in case of organic farm was Rs.82,328 per acre whereas it was Rs.81,360 per acre in inorganic farm. The net returns realized from organic sugarcane farm was Rs. 36,353.90 and Rs.27,028.18 from inorganic farm. In sugarcane cultivation, the return per rupee of cost of cultivation was more (1.79) in case of organic farm as compared to inorganic farm (1.50).
The per cent change in the value of organic and inorganic sugarcane farms is represented in last column of the table where 33.33 percentage decrease in the value of organic sugarcane farms particularly in miscellaneous followed by subtotal of variable cost (24.04 %), setts (18.99 %), total cost of cultivation (18.18%), FYM (14.12 %), interest on working capital (10.77 %), human labour (7.51 %), depreciation (5.92 %) and bullock labour (5.71 %) when compared to inorganic sugarcane farm. Similarly 25.65 per cent increase in the value of organic sugarcane farms particularly in net returns followed by returns per rupee of expenditure (16.20 %), machine labour (4 %), rental value of land (4 %), interest on fixed capital (2.20 %), subtotal of fixed capital (2.20 %) and yield (1.18 %) when compared to inorganic sugarcane farm.
4.4 Investment pattern in establishment of jaggery processing units (one tonne capacity per day)
The details of investment required for establishment of jaggery processing units is given in Table 4.5. Total investment of Rs. 4,38,875 was required to set up a jaggery processing unit with an installed capacity of one tonne per day. Among the various investment items, the investment on land had a maximum share (44.98 %) accounting for Rs.1,97,426. This was followed by investment on processing shed which stood at Rs.98,539 (22.45 %), cane crusher at Rs. 65,163 (14.85 %), electrical motor Rs.26,500 (6.04 %), a single pan at Rs.23,570 (5.37 %), furnace at Rs.18,473 (4.21%), and other minor items at Rs.9,204 (2.09 %).
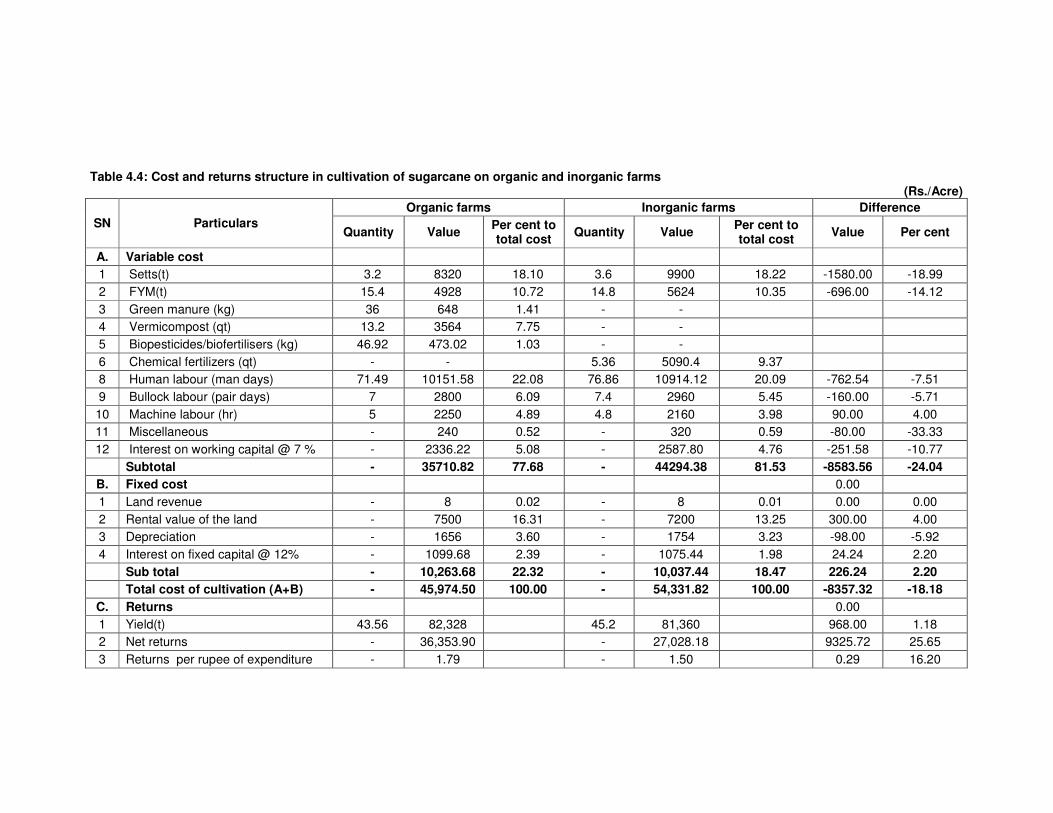
Table 4.4: Cost and returns structure in cultivation of sugarcane on organic and inorganic farms (Rs./Acre)
Organic farms Inorganic farms Difference
SN Particulars Quantity Value
Per cent to total cost
Quantity Value Per cent to total cost
Value Per cent
A. Variable cost
1 Setts(t) 3.2 8320 18.10 3.6 9900 18.22 -1580.00 -18.99
2 FYM(t) 15.4 4928 10.72 14.8 5624 10.35 -696.00 -14.12
3 Green manure (kg) 36 648 1.41 - -
4 Vermicompost (qt) 13.2 3564 7.75 - -
5 Biopesticides/biofertilisers (kg) 46.92 473.02 1.03 - -
6 Chemical fertilizers (qt) - - 5.36 5090.4 9.37
8 Human labour (man days) 71.49 10151.58 22.08 76.86 10914.12 20.09 -762.54 -7.51
9 Bullock labour (pair days) 7 2800 6.09 7.4 2960 5.45 -160.00 -5.71
10 Machine labour (hr) 5 2250 4.89 4.8 2160 3.98 90.00 4.00
11 Miscellaneous - 240 0.52 - 320 0.59 -80.00 -33.33
12 Interest on working capital @ 7 % - 2336.22 5.08 - 2587.80 4.76 -251.58 -10.77
Subtotal - 35710.82 77.68 - 44294.38 81.53 -8583.56 -24.04
B. Fixed cost 0.00
1 Land revenue - 8 0.02 - 8 0.01 0.00 0.00
2 Rental value of the land - 7500 16.31 - 7200 13.25 300.00 4.00
3 Depreciation - 1656 3.60 - 1754 3.23 -98.00 -5.92
4 Interest on fixed capital @ 12% - 1099.68 2.39 - 1075.44 1.98 24.24 2.20
Sub total - 10,263.68 22.32 - 10,037.44 18.47 226.24 2.20
Total cost of cultivation (A+B) - 45,974.50 100.00 - 54,331.82 100.00 -8357.32 -18.18
C. Returns 0.00
1 Yield(t) 43.56 82,328 45.2 81,360 968.00 1.18
2 Net returns - 36,353.90 - 27,028.18 9325.72 25.65
3 Returns per rupee of expenditure - 1.79 - 1.50 0.29 16.20

4.5 Cost and returns involved in both organic and inorganic jaggery preparation per processing unit per annum
The cost and returns in organic jaggery preparation per unit per annum is presented in Table 4.6. The total variable cost worked out to Rs.23,86,541.85 in which the cost of raw material (sugarcane) was the prime cost sharing 80.54 per cent of the total variable cost and 78.92 per cent of the total cost. Labour charges, interest on working capital, bendi extract, fuel charges and diesel were the other important items of cost accounting for Rs.1,96,959, Rs. 1,56,128.90, Rs.43,647.64, Rs.29,062.76 and Rs.22,723.82, respectively and forming 8.09 per cent, 6.41 per cent, 1.79 per cent, 1.19 per cent and 0.93 per cent of the total cost, respectively. Total fixed cost per processing unit was relatively less (Rs. 49,154) in comparison with the variable cost. The percentage share of fixed cost to the total cost was only 2.02 per cent. The major item in the fixed cost was amortized cost (Rs.43,887.7) accounted for 89.29 per cent and interest on fixed capital which had small share (Rs.5266.50) accounting for 10.71 per cent to the total fixed cost. The cost of sunflower oil, soda powder, polythene bag and miscellaneous cost appeared to be negligible.
The returns from organic jaggery processing per unit worked out to Rs. 30,69,232.53 with a net returns of Rs. 6,33,536.67. The benefit-cost ratio was estimated at 1.26.
The cost and returns in inorganic jaggery preparation per unit per annum is revealed from the Table 4.6 that the total variable cost worked out to Rs.26,47,515.33 in which the cost of raw material (sugarcane) was accounted a lion’s share in the total variable cost (79.46 %) and the total cost (78.01 %). Labour charges, interest on working capital, cost on chemicals, diesel and fuel charges were the other important items of cost accounting for Rs.2,05,443.80, Rs. 1,73,201.93, Rs. 69,036.45, Rs.38,597 and Rs.36,797, respectively forming 7.62 per cent, 6.42 per cent, 2.56 per cent, 1.43 per cent and 1.36 per cent of the total cost, respectively. Total fixed cost per processing unit was relatively less (Rs.49,154) in comparison with the variable cost. The percentage share of fixed cost to the total cost was only 1.82 per cent. The major cost items in the fixed cost was apportioned cost (Rs. 43,887.5) accounting for 89.29 per cent of the total fixed cost and interest on fixed capital which had small share (Rs.5266.50) accounting for 10.71 per cent to the total fixed cost. The cost of sunflower oil, soda powder, polythene bag and miscellaneous cost appeared to be negligible.
The returns from inorganic jaggery processing per unit worked out to Rs. 32,84,661.71 with a net returns of Rs. 5,87,992.37 per unit. The benefit-cost ratio was estimated at 1.22.
The per cent change in the cost of organic and inorganic jaggery preparation is represented in last column of the table where 77.89 per cent increase in the cost of organic jaggery preparation particularly in bhendi extract followed by sunflower oil (35.11%), soda powder (16.42%), net returns (7.19%), miscellaneous (5.26%), B:C ratio (2.17%) when compared to inorganic jaggery preparation. Similarly 69.85 per cent decrease in the cost of organic jaggery preparation particularly in diesel followed polythene bag (33.33%), fuel (26.61%), interest on working capital (10.94%), sub total of variable cost (10.49%), total cost (10.71%), sugarcane (9.45%), returns from jaggery (7.02%) and labour charges (4.31%) when compared to inorganic jaggery preparation.
4.5.1 Cost of organic and inorganic jaggery production
The per tonne cost of organic jaggery production was found to be Rs. 21,760.89 (Table 4.7). Among the various cost items, cost of sugarcane was the maximum share (Rs.17,172.61/tonne) which formed about 78.92 per cent of the total cost. Labour (Rs.1,759.66/tonne), interest on working capital (Rs.1394.22/tonne), clarificants and additives (Rs. 558.41/tonne), fixed cost (Rs. 410.81), fuel (Rs.259.65/tonne) and diesel (Rs.203.02/tonne) formed the next important cost items in the production of jaggery. The processor on an average return realized Rs.27,421 per tonne of jaggery leaving a gross margin of Rs.5660.11 per tonne. On an average 9.09 tonnes of sugarcane was used to produce one tonne of organic jaggery. Thus, the conversion ratio of sugarcane to jaggery was estimated at 11 per cent.

Table 4.5: Investment pattern in establishment of jaggery processing unit (one tonne capacity per day)
SN Items No. Value (Rs.) Per cent to total
1 Land (Acre) 0.52 197426 44.98
2 Shed 1 98539 22.45
3 Furnace 1 18473 4.21
4 Pan (single) 1 23570 5.37
5 Cane crusher 1 65163 14.85
6 Electric motor 1 26500 6.04
7 Filter plate 2 480 0.11
8 Bani 2 1250 0.28
9 Gori 1 362 0.08
10 Hutta 2 847 0.19
11 Mali 2 569 0.13
12 Ash Spade 2 386 0.09
13 Madi –Katti 1 1340 0.31
14 Buckets /Moulds 15 2590 0.59
15 Plastic pipes(ft) 24 400 0.09
16 Drum/ Barrels 1 980 0.22
Total - 4,38,875 100.00
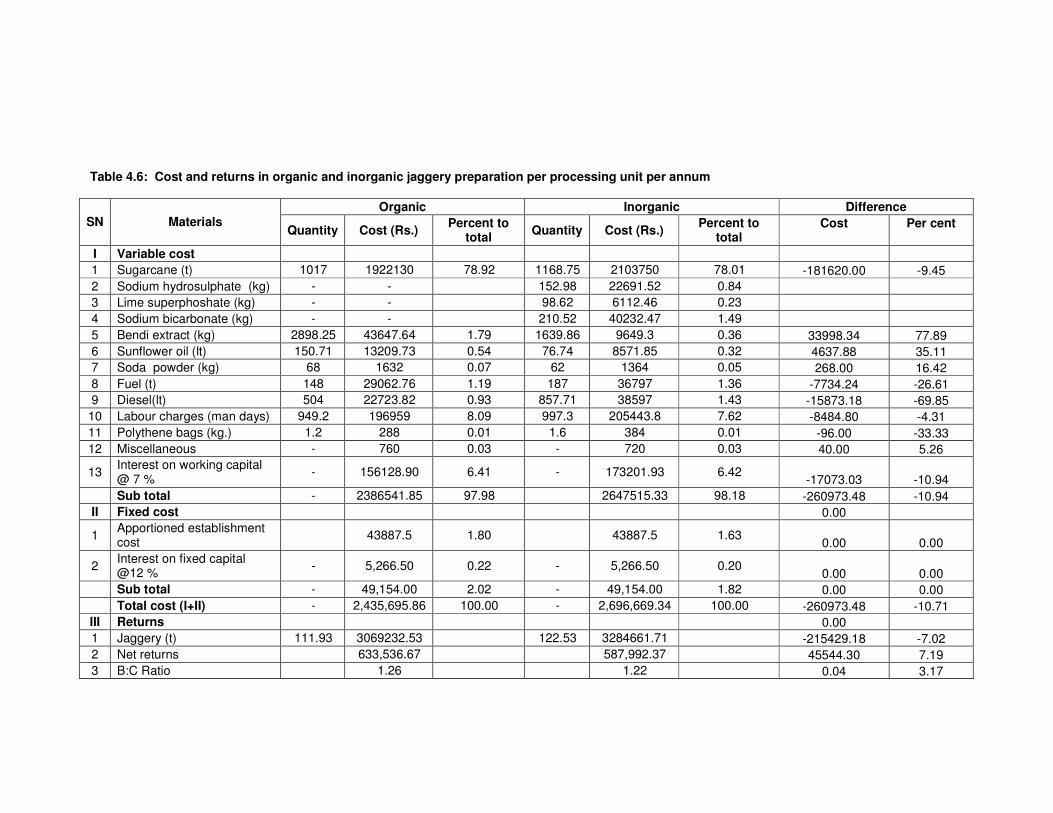
Table 4.6: Cost and returns in organic and inorganic jaggery preparation per processing unit per annum
Organic Inorganic Difference
SN Materials Quantity Cost (Rs.)
Percent to total
Quantity Cost (Rs.) Percent to
total Cost Per cent
I Variable cost
1 Sugarcane (t) 1017 1922130 78.92 1168.75 2103750 78.01 -181620.00 -9.45
2 Sodium hydrosulphate (kg) - - 152.98 22691.52 0.84
3 Lime superphoshate (kg) - - 98.62 6112.46 0.23
4 Sodium bicarbonate (kg) - - 210.52 40232.47 1.49
5 Bendi extract (kg) 2898.25 43647.64 1.79 1639.86 9649.3 0.36 33998.34 77.89
6 Sunflower oil (lt) 150.71 13209.73 0.54 76.74 8571.85 0.32 4637.88 35.11
7 Soda powder (kg) 68 1632 0.07 62 1364 0.05 268.00 16.42
8 Fuel (t) 148 29062.76 1.19 187 36797 1.36 -7734.24 -26.61
9 Diesel(lt) 504 22723.82 0.93 857.71 38597 1.43 -15873.18 -69.85
10 Labour charges (man days) 949.2 196959 8.09 997.3 205443.8 7.62 -8484.80 -4.31
11 Polythene bags (kg.) 1.2 288 0.01 1.6 384 0.01 -96.00 -33.33
12 Miscellaneous - 760 0.03 - 720 0.03 40.00 5.26
13 Interest on working capital @ 7 %
- 156128.90 6.41 - 173201.93 6.42 -17073.03 -10.94
Sub total - 2386541.85 97.98 2647515.33 98.18 -260973.48 -10.94
II Fixed cost 0.00
1 Apportioned establishment cost
43887.5 1.80 43887.5 1.63 0.00 0.00
2 Interest on fixed capital @12 %
- 5,266.50 0.22 - 5,266.50 0.20 0.00 0.00
Sub total - 49,154.00 2.02 - 49,154.00 1.82 0.00 0.00
Total cost (I+II) - 2,435,695.86 100.00 - 2,696,669.34 100.00 -260973.48 -10.71
III Returns 0.00
1 Jaggery (t) 111.93 3069232.53 122.53 3284661.71 -215429.18 -7.02
2 Net returns 633,536.67 587,992.37 45544.30 7.19
3 B:C Ratio 1.26 1.22 0.04 3.17

The per tonne cost of inorganic jaggery production was found to be Rs. 22008.24 (Table 4.8). Among the various cost items, cost of sugarcane was the maximum share (Rs.17,169.26/tonne) which formed about 78.01 per cent of the total cost. Labour (Rs.1,676.68/tonne), interest on working capital (Rs.1412.91/tonne), chemical (Rs.563.42), fixed cost (Rs. 410.81), diesel (Rs.315/tonne), fuel (Rs.300.31/tonne) and clarificants and additives (Rs. 159.84) formed the next important cost items in the production of jaggery. The processor on an average return realized Rs.26,807 per tonne of jaggery leaving a gross margin of Rs.4798.76 per tonne. On an average 9.54 tonnes of sugarcane was used to produce one tonne of inorganic jaggery. Thus, the conversion ratio of sugarcane to jaggery was estimated at 10.48 per cent.
4.5.2 Break-even analysis in jaggery processing units
The result of break-even analysis in organic and inorganic jaggery production is presented in Table 4.8. The investment needed for establishment of per jaggery processing unit was Rs.4,38,875. The cost incurred per tonne of jaggery production between organic and inorganic, the cost was found to be lowest in organic preparation (Rs. 21,760.89) when compared to that of inorganic jaggery (Rs.22,008.24). The average price realized were about Rs.27,421 and Rs. 26,807 per tonne of organic and inorganic jaggery production, respectively.
The break-even level of output per processing unit in organic and inorganic jaggery was estimated to be 77.54 tonnes/year and 91.46 tonnes/year, respectively. The number of days required for achieving the break-even level of output was slightly shorter for the processing units in organic (96.92 days) when compared with inorganic jaggery (114.32 days), at the existing level of capacity utilization of processing units.
4.5.3 Financial feasibility of investment in organic and inorganic jaggery processing units
The financial feasibility of investment in organic processing units was assessed and the results are presented in Table 4.9. The jaggery processing unit required 0.69 years to repay the initial investment made in establishing the units. The net present value at 12 per cent discount rate worked out to be Rs.28,04,239.72. The benefit-cost ratio for the jaggery processing unit was found to be at 1.22. The internal rate of return in jaggery processing unit was found to be 144 per cent. The sensitivity of benefits of processing units was tested against 10 per cent change in the prices of organic sugarcane and jaggery.
A 10 per cent rise in the price of organic sugarcane was found to depress NPW by about 63 per cent. Similarly, a 10 per cent fall in the price of jaggery was found to reduce the NPW by 44.78 per cent. A considerable reduction was also seen in the BCR values for changed prices of organic sugarcane and jaggery.
The financial feasibility of investment in inorganic processing units was assessed and the results are presented in Table 4.9. The jaggery processing unit required 0.75 years to repay the initial investment made in establishing the units. The net present value at 12 per cent discount rate worked out to be Rs. 25,74,475.92. The benefit-cost ratio for the jaggery processing unit was found to be at 1.18. The internal rate of return in jaggery processing unit was found to be 134 per cent. The sensitivity of benefits of processing units was tested against 10 per cent change in the prices of inorganic sugarcane and jaggery.
A 10 per cent rise in the price of inorganic sugarcane was found to depress NPW by about 55.89 per cent. Similarly a 10 per cent fall in the price of jaggery was found to reduce the NPW by 35.63 per cent. A considerable reduction was also seen in the BCR values for changed prices of inorganic sugarcane and jaggery.
4.6 Reasons for shifting from inorganic to organic sugarcane production
The reasons for shifting from inorganic cultivation of sugarcane to organic cultivation of sugarcane were obtained from the sample farmers by conducting opinion survey and the results are presented in Table 4.10.

Table 4.7: Cost and returns in organic and inorganic jaggery production (Rs/t)
Organic jaggery Inorganic jaggery SN Particulars
Quantity Value (Rs.) Percentage to total Quantity Value (Rs.) Percentage to total
1 Sugarcane(t) 9.09 17172.61 78.92 9.54 17169.26 78.01
2 Chemicals(kg) - - 3.77 563.42 2.56
3 Clarificants and additives(kg)
27.84 558.41 2.57 14.52 159.84 0.73
4 Fuel(t) 1.32 259.65 1.19 1.53 300.31 1.36
5 Diesel(lt) 4.5 203.02 0.93 7 315 1.43
6 Labour(man days) 8.48 1759.66 8.09 8.14 1676.68 7.62
7 Interest on working capital@ 7%
1396.73 6.42 1412.92 6.42
8 Fixed cost 410.81 1.89 410.81 1.87
Total cost 21760.89 100.00 22008.24 100.00
Returns - 27421 - 26807 -
Gross margin - 5660.11 - - 4798.76 -

0
2000
4000
6000
8000
10000
12000
14000
16000
18000
Cost
(000, R
s/t)
Cane Chemicals Clarificants
and additives
Fuel Diesel Labour Interest on
WC
Fixed cost
Particulars
Organic Inorganic
Fig. 5: Per ton cost of organic and inorganic jaggery production
Fig. 5: Per ton cost of organic and inorganic jaggery production
Table 4.8: Break-even analyses in organic and inorganic jaggery preparation per
processing unit
Jaggery preparation
SN Items
Organic Inorganic
1 Establishment cost (Rs.) 438875 438875
2 Variable cost/tonne (Rs.) 21760.89 22008.24
3 Price of output/tonne (Rs.) 27421 26807
4 Break even output(tonnes) 77.54 91.46
5 Time period for break even output (days at
present level of capacity utilization ) 96.92 114.32

Table 4.9: Financial feasibility of investment in organic and inorganic jaggery processing
SN Project indicators Organic Inorganic
1 Pay back period (yrs) 0.69 0.75
2 NPW (Rs./unit) 2804239.72 2574475.92
3 BCR 1.22 1.18
4 IRR (%) 144 134
Sensitivity
10% rise in sugarcane price
NPW (Rs./unit) 1766679.98 1438875.68
BCR 1.13 1.10
10% fall in jaggery price
NPW (Rs./unit) 1255860.37 917415.94
BCR 1.10 1.07
Note: Discount rate @ 12%

It was observed that as high as 71.67 per cent of the sample farmers expressed the reason of increasing return from organic sugarcane followed by reason of increasing cost of chemicals/fertilizers (65 %), soil health oriented motives (61.67 %), quality of organic sugarcane and jaggery (53.33 per cent ), human health oriented motives (51.67 %), motivation by organic growers association/institutions (48.33 %), motivation by neighbouring organic farmers (46.67 %), environmental concern (43.33 %), demand for organic jaggery (n=18) (38.88 %), motivation by media (31.67 per cent ) and supportive subsidies by the government (30 per cent ) as the reasons for shifting over to organic cultivation of sugarcane from inorganic cultivation.
4.7 Problems of organic sugarcane farmers
An informal discussion with the organic farmers revealed that organic production of sugarcane has a lot of problems. Opinion survey was conducted to know the problems faced by the farmers in organic sugarcane production and marketing and results of opinion survey are presented in Table 4.11.
4.7.1 Production related problems
It was observed that majority of the sample farmers (76.67 %) expressed the problem of non-availability of labour, followed by problem of non-availability of information on organic farming (58.33 %), non-availability of biopesticides (50 %), limited and irregular power supply (48.33 %), non-availability of organic manures (23.33 %) and incidence of pest and diseases (11.67 %), as the major problems in production of sugarcane organically.
4.7.2 Marketing problems
It was observed that majority of the sample farmers (73.33 %) opined the problem of non-availability of exclusive market for organic produce followed by non-availability of market related information (71.67 %), lack of premium price in the local market (56.67 %) and poor transport facilities (53.33 %) as the major problems in marketing of organically produced sugarcane. Table 4.10: Reasons for shifting from inorganic to organic sugarcane production
(n=60)
SN Reasons No. of
respondents Per cent to total
1 Increasing cost of inorganic chemicals/fertilisers 39 65.00
2 More returns from organic sugarcane cultivation 43 71.67
3 Demand for organic jaggery (n=18) 07 38.88
4 Quality of organic sugarcane and jaggery 32 53.33
5 Soil health oriented motives 37 61.67
6 Environmental concern 26 43.33
7 Human health oriented motives 31 51.67
8 Motivation by neighboring organic farmers 28 46.67
9 Motivation by media 19 31.67
10 Motivation by organic growers association/institutions 29 48.33
11 Supportive subsidies by the government 18 30.00

Table 4.11: Problems of organic sugarcane farmers
(n=60)
SN Problems No. of
respondents Per cent to
total
A Production related problems
1 Non- availability of organic manures 14 23.33
2 Non-availability of biopesticide 30 50.00
3 Incidence of pests and diseases 07 11.67
4 Limited and irregular power supply 29 48.33
5 Non- availability of labour 46 76.67
6 Non- availability of information on organic
farming 35 58.33
B Marketing problems
1 Poor transport facilities 32 53.33
2 Non- availability of market related information 43 71.67
3 High commission charges 13 21.67
4 Non- availability of exclusive market for
organic produce 44 73.33
5 Lack of premium price in the local market 34 56.67

5. DISCUSSION
The results of the study presented in the previous chapter are discussed in this chapter under the following heads.
5.1 General characteristics of the sample sugarcane farmers and jaggery processors
5.2 Cropping pattern on the sample farms
5.3 Cost and returns involved in both organic and inorganic sugarcane farms
5.4 Investment pattern in jaggery processing units
5.5 Cost and returns involved in both organic and inorganic jaggery preparation
5.6 Reasons for shifting from inorganic to organic cultivation of sugarcane
5.7 Problems of organic sugarcane farmers
5.1 General characteristics of the sample farmers and jaggery processors
5.1.1 General characteristics of the sample sugarcane farmers
The general characters of the respondents are presented in Table 4.1. In case of organic sugarcane cultivation, the organic sugarcane farmers were older compared to inorganic sugarcane farmers and in both the cases the main occupation of them was agriculture. It could be further observed that organic sugarcane farmers had more number of years of schooling than inorganic sugarcane farmers. The average size of the family was about seven and six in organic and inorganic farmers, respectively and the average size of land holding organic sugarcane farmers was 8.49 acres and it was 7.25 acres in the case of inorganic sugarcane farmers. The average size of irrigated farm was highest in both organic and inorganic farms compared to an average size of dry land area. This was due to the fact that in the study area, water for irrigation was sufficiently available from Ghataprabha reservoir. It is evident from the results that as the size of irrigated farm increased, the area under sugarcane cultivation also increased. The sugarcane varieties grown by the organic and inorganic farmers in the study area were Co-92005, Co-671, Co-86032 and Co-8014, Co-7219, Co-86032, respectively. Organic sugarcane farmers had more number of livestocks as compared to inorganic farmers.
5.2 Cropping pattern and major crops grown
The absolute area devoted to different crops by the organic and inorganic farmers was ascertained for the agriculture year 2011-12.
The major crops grown during kharif season by the organic sugarcane sample farmers were sugarcane, maize, groundnut, turmeric, bajra, soybean and cotton (Table 4.2). Among these crops the area under sugarcane was found to be highest (3.71 acres), followed by maize (1.53 acres), groundnut (0.82 acres), turmeric (0.67 acres), bajra (0.51 acres), soybean (0.35 acres) and cotton (0.03 acres).
During rabi season sugarcane, chickpea, sorghum, sorghum, wheat and cotton were the major crops grown. The average area under these crops were 3.71 acres, 0.64 acre, 0.52 acres, 0.43 acres and 0.03 acres, respectively. During summer season irrigation facility was available for sugarcane to complete its duration.
In case of inorganic farms the major crops grown during Kharif by the sample farmers were sugarcane (3.02 acres) which dominated the cropping pattern followed by maize (1.32 acres), groundnut (0.76 acres), turmeric (0.56 acres), bajra (0.42 acres), , and soybean (0.19 acres). During rabi season other than sugarcane (3.02 acres), chickpea (0.76 acres), wheat (0.34 acres), sorghum (0.12 acres), and cotton (0.05 acres) were the major crops grown. During summer season, irrigation facility was made available for sugarcane to complete its duration.

In all the three seasons sugarcane occupied the more area compared to any other crops mainly because of prevalence of jaggery production units, sugar factories and farmers in the study area got good returns from cultivation of both organic and inorganic sugarcane.
5.2.1 Labour use pattern in both organic and inorganic sugarcane farms
The per acre quantity of labour used, costs involved in the different operations of organic and inorganic cultivation of sugarcane are presented in Table 4.3.
It can be revealed from the table that the organic farmers use less quantity of human labour, bullock labour and slightly more machine labour used than that of inorganic farmers in various operations. In case of organic sugarcane production, about 3 and 2 machine hours were used for ploughing and transportation of FYM, respectively. Among pair days of bullock labour used, a highest bullock labour was found to be used in intercultivation operation (3 pair days) followed by sett bed preparation (2.50 pair days) and harrowing (1.50 pair days). The highest human labour was used in case of irrigation (23.26 man days), followed by hand weeding (18.64 man days), harvesting (17.73 man days), planting (4.6 man days), spreading of FYM ( 3.20 man days), application of organic manure (2.61 man days ) and application of biopesticides (1.45 man days).
In case of inorganic sugarcane production, about 3 and 1.80 machine hours were used for ploughing and transportation of FYM, respectively. Among pair days of bullock labour used, a highest bullock labour was found to be used in intercultivation (3 pair days) followed by sett bed preparation (2.40 pair days) and harrowing operation (2 pair days). The highest human labour was used in case of irrigation (24.26 man days) followed by hand weeding (22.16 man days), harvesting (18.73 man days), planting (4.80 man days), application of chemical fertilisers (3.81 man days) and spreading of FYM ( 3.10 man days).
More number of labours used except machine labour in case of inorganic sugarcane cultivation than that of organic sugarcane cultivation. This difference was mainly because of the inorganic cultivation of sugarcane involves more number of times of fertilizer application, irrigation and hand weeding than organic farms as organic farmers practices mulching it avoids the frequent irrigation and also weed growth in the field. And organic farmers devoid of chemical fertilizer use it was also saves labour usage, hence, the cost involved in the usage of human labour on organic farms was found less than that of inorganic farms. On the other hand organic cultivation of sugarcane involves slightly more amount of machine labour used for transportation of FYM because organic farmers apply more of FYM than inorganic farmers. Thus, human labour use was more in inorganic cultivation of sugarcane. But in contrast to the present findings, Sujatha et al. (2006) reported that organic cultivation of rice and cotton was labour intensive than inorganic cultivation.
5.3 Cost and returns involved in both organic and inorganic sugarcane farms
It is evident from the results presented in Table 4.4 that, the per acre cost of sugarcane cultivation on organic farms (Rs. 45,974.50) was less when compared to that on inorganic farms (Rs.54,331.82). This marginal difference was due to the higher cost incurred on chemical fertilizers, cost on more quantity of setts used as less spacing and more human labour used by inorganic sugarcane farmers.
The per acre variable cost in cultivation of sugarcane on organic farms (Rs.35,710.82) was lower as compared to that on inorganic farms (Rs.44,294.38). The cost incurred on organic compounds was lowest in organic farms as compared to cost incurred on chemical fertilizers in inorganic farms because most of the organic compounds were available at cheaper rate at village as compared to chemical fertilizers.
The cost on total human labour was lower on organic farms compared to inorganic farms. This was mainly due to the more number of times of chemical fertilizer application, hand weeding and irrigation in inorganic sugarcane cultivation.
There were more setts cost involved in inorganic farms than organic farms; this was mainly due to the reason that majority of the organic farmers’ follow wider spacing so fewer setts required in the cultivation of organic sugarcane whereas in case of inorganic sugarcane cultivation the farmers follow narrow spacing so they need slightly more quantity of setts.

The cost incurred on biopesticides was relatively low in organic farms because the organic farmers used biopesticides, most of which were home made and some purchased microbial extracts and there was no such practices followed in inorganic sugarcane farms.
The cost incurred on land revenue was same in both organic and inorganic farms and land rent was slightly higher in organic farms. The depreciation charge was relatively high on inorganic farms and low on organic farms because inorganic farmer’s asset position was high. Similar results were observed by Jitendra Singh et al. (2006), Sujatha et al. (2006) and Waykar et al. (2006).
The per acre average yield of sugarcane was low on organic farms (43.56 tonnes) as compared to inorganic farms (45.2 tonnes). This was mainly due the fact that organic farmers practiced the organic farming from last three to four years only, since to build up soil fertility it needs more than five years and hence initial three to four years there is yield loss in the organic farms compared to inorganic farms.
The return structure in sugarcane clearly revealed that the per acre gross returns was higher (Rs. 82,328) on organic farms compared to that of inorganic farms (Rs. 81,360) with a positive net return on both the categories of the farms. The net return on organic farm was Rs. 36,353.90 and was Rs. 27,028.18 on inorganic farms. The yield levels on organic farms were lower compared to inorganic farms, but the net returns were higher because of the organic sugarcane fetches more price and lower cost of cultivation. The B:C ratio was also higher on organic farms (1.79) compared to inorganic farms (1.50).
5.4 Investment pattern in jaggery processing unit
The average investment required for establishing jaggery processing unit with a capacity of one tonne per day was Rs. 4, 38,875 (Table 4.6). The percentage share of land in the total investment was maximum (44.98%) followed by investment on processing shed (22.45%) and cane crusher (14.85%). Investment pattern was remains same in both organic and inorganic jaggery processing units because of there was no separate organic and inorganic jaggery processing units in the study area. In most of the processing units, brick shed with cement plastering and with iron shed roofing was noticed. Size of shed depended on number of furnaces. It was noticed that all these processing units used one furnace and most of the units here are electrically operated and some are operated by diesel engine. The findings of the present study are in line with that of findings of Teggi (1995) and Nandimath (2008).
5.5 Cost and returns involved in both organic and inorganic jaggery preparation
The cost of raw material(sugarcane) was the prime variable cost accounting 78.92 per cent and 78.01 per cent of the total cost in organic and inorganic jaggery processing, respectively (Table 4.6). Labour charges accounted for about 8.09 per cent in organic jaggery preparation and 7.62 per cent in case of inorganic jaggery preparation. Similar results were obtained by Raikar (1990) and Murlidharan (1981) in their study on economics of processing of cashew and jaggery processing, respectively. While, the cost of chemicals accounted about 2.56 per cent in inorganic jaggery preparation, whereas there was no chemical cost in organic jaggery preparation. It was noticed that the processors used the more than the required quantities of chemicals. This called for standardizing the methods of inorganic jaggery preparation. The share of fixed cost in the total cost was about 2.02 per cent in organic jaggery preparation and it was 1.82 in case of inorganic jaggery preparation. From the findings it could be said that, the cost of sugarcane played a major role in determining cost and returns structure in jaggery processing units. Though as many as eight different chemicals/materials were used in jaggery processing and the expenditure on these chemicals/materials was negligible. The results further revealed that on an average 111.93 tonnes of organic jaggery and 122.53 tonnes of inorganic jaggery was produced annually. The net returns realized in organic jaggery preparation was higher (Rs.6,33,536.67) than that of inorganic jaggery preparation (Rs.5,87,992.37). This was mainly due to the less cost of processing and higher premium price of organic jaggery.
A rupee expenditure in organic jaggery processing resulted in a slightly higher returns (Rs.1.26) when compared to inorganic jaggery processing (Rs. 1.22). Similar results were obtained by Ramrao (2011) in his study on jaggery production.
On an average 9.09 tonnes of sugarcane was used to produce one tonne of organic jaggery and 9.54 tonnes of sugarcane was used to produce one tonne of inorganic jaggery (Table 4.7). Thus, the recovery for organic jaggery preparation units was estimated at 11 per cent and inorganic jaggery preparation unit was 10.48. Similar findings were reported by Raju and Ramesh (1989) in their study on jaggery processing.
The decision of whether to supp1y sugarcane to the sugar factories or to process it into jaggery depended on many things, mainly on the site price of sugarcane, cost of processing of sugarcane into jaggery and the price of organic and inorganic jaggery. The total cost of processing including the cost of raw material in the present study worked out to Rs. 21,760.89 and Rs.22,008.24 per tonne of organic and inorganic jaggery produced, respectively. The processors on an average returns realized Rs. 27,421 and Rs. 26,807 per tonne of organic and inorganic jaggery leaving a gross margin of Rs. 5,660.11 and Rs. 4,798.76 per tonne of organic and inorganic jaggery, respectively. Therefore, for the processors it was certainly profitable to process the sugarcane into organic as well as inorganic jaggery.
5.5.1 Break-even analysis in organic and inorganic jaggery processing units
The data presented in Table 4.8 revealed that the organic jaggery processing units were required to produce 77.54 tonnes of organic jaggery every year to reach the break-even level. It was interesting to note that on an average jaggery processing units were producing around 111.93 tonnes of organic jaggery annually (Table 4.6). The time period required for achieving break-even volume of output in organic jaggery processing units with the present level of capacity uti1ization was on1y 96.92 days. However, on an average, the processing units in the study area were found to crush sugarcane into jaggery for a period of 139.91 days in a year. This result showed that organic jaggery processing in the study area is profitable.
In case of inorganic jaggery processing units on an average the inorganic jaggery processing units were required to produce only 91.46 tonnes of inorganic jaggery every year to reach the break-even level of output (Table 4.8). It was interesting to note that on an average inorganic jaggery processing units were producing around 122.53 tonnes of inorganic jaggery annually (Table 4.6). The time period required for achieving break-even volume of output in inorganic jaggery processing units with the present level of capacity uti1ization was on1y 114.32 days. However, on an average, the processing units in the study area were found to crush for a period of 153.16 days in a year. This result showed that inorganic jaggery processing in the study area is also profitable.
5.5.2 Financial feasibility of investment in organic and inorganic jaggery processing units
The investment made in the establishment of jaggery processing unit was repaid within a short period of one year (Table 4.9). The net present value of organic jaggery processing units at 12 per cent discount rate was estimated at Rs.28,04,206.77 over the average life span of jaggery processing unit (10 years). A positive and high net present values reiterated the profitability in organic jaggery production. The internal rate of return in organic jaggery processing was more than 100 per cent. This revealed that the processing units produced organic jaggery were economically feasible even at a higher discount rates. The benefit-cost ratio was also quite appealing. The encouraging project indicators revealed the investment in jaggery processing units was found to be financially feasible and economically sound.
In case of inorganic jaggery processing the net present value of inorganic jaggery processing units at 12 per cent discount rate was estimated at Rs.25,74,598.46 over the average life span of jaggery processing unit (10 years). Positive and high net present values reiterated the profitability in inorganic jaggery production. The internal rate of return in inorganic jaggery processing was more than 100 per cent. It is mainly because in case of both organic and inorganic jaggery processing units, the returns start from beginning of the first year itself which leads to higher IRR.

This revealed that the inorganic jaggery processing units were economically feasible even at higher discount rates. The benefit-cost ratio was quite appealing. The encouraging project indicators revealed the economic feasibility of jaggery processing units. Similar results were obtained by Teggi (1995) in Ghataprabha command area, Lohar et al. (2000) in Maharashtra and Nandimath (2008) in Belguam district, in their study on jaggery processing.
An attempt was also made to test the sensitivity of the benefits from the jaggery processing to changing prices of inputs and output. The switching values were low only to the prices of sugarcane and the prices of jaggery. Hence, the sensitivity of benefits of processing units was tested against 10 per cent changes in prices of these two. A 10 per cent rise in price of sugarcane was found to depress NPV by about 62.99 per cent and 55.89 per cent in organic and inorganic jaggery preparation, respectively. Similarly, a 10 per cent fall in the price of jaggery was found to reduce the net present value by 44.78 per cent and 35.63 per cent in organic and inorganic jaggery preparation, respectively.
A considerable reduction was also seen in the BCR values for changed prices of sugarcane and jaggery. These results indicated that the benefits from jaggery processing were highly sensitive to changes in the prices of sugarcane and jaggery. A marginal change in the prices of these two had a pronounced impact on the profitability of jaggery processing units. It could recalled here that the cost of sugarcane, a prime raw material, shared about 78.92 per cent and 78.01 per cent of the total cost in organic and inorganic jaggery preparation, respectively. Hence, a small increase in sugarcane price was bound to reduce the profitability in jaggery processing.
Perhaps, this was the reason with majority of the processors preferred to meet a part of the cane requirement by growing sugarcane on their own fields. Further, it was worth noting that the opportunity cost of sugarcane, that is, site price of cane was considered as profitability for its analysis in jaggery processing. The gross margins in processing would have been still higher had the real cost of cane production was considered.
5.6 Reasons for shifting from inorganic to organic cultivation of sugarcane
The reasons for shifting from inorganic cultivation of sugarcane to organic cultivation of sugarcane were obtained from the sample farmers by conducting opinion survey and the results are presented in Table 4.10.
It was observed that majority of the sample farmers expressed the reason of increasing return from organic sugarcane (71.67 per cent), followed by reason of increasing cost of inorganic chemical fertilizers (65 per cent), soil health oriented motives (61.67 per cent), quality of organic sugarcane and jaggery (53.33 per cent), human health oriented motives (51.67 per cent), motivation by organic growers association/institutions (48.33 per cent), motivation by neighbouring organic farmers (46.67 per cent), environmental concern (43.33 per cent), demand for organic jaggery (38.88 per cent), motivation by media (31.67 per cent) and supportive subsidies by the government (30 per cent) are the reasons for shifting over to organic cultivation of sugarcane from inorganic cultivation.
Anand Kumar (1998) found that increasing cost of chemical inputs (63%), increase on the net return in organic farming (11%), as the reasons behind shifting to organic farming.
Loganandan and Singh (2003) observed that more number of respondents (54%) had the motive of environment safety to shift to organic farming followed by financial motives(40%), soil health oriented motives (34%), motivation by significant others viz., neighbouring organic farmers, environmental activists etc (30%), quality of output related motives(24%), motivation by media(24%) and philosophical motives (18%).
5.7 Problems of organic sugarcane farmers
An informal discussion with the organic farmers revealed that organic production of sugarcane has a lot of problems. Opinion survey was conducted to know the problems faced by the farmers in organic sugarcane farming and its marketing and results of opinion survey are presented in Table 4.11.

5.7.1 Production related problems
Majority of the sample farmers (76.67 per cent) expressed the problem of non-availability of labour, followed by problem of non-availability of information on organic farming (58.33 per cent), non-availability of biopesticides (50 per cent), limited and irregular power supply (48.33 per cent), non-availability of organic manures (23.33 per cent) and incidence of pest and diseases (11.67 per cent) as the major problems in production of sugarcane organically. This might be due to non-availability of recommended package of practice and laborious process involved in application of organic practices, coupled with major portion of land holdings brought under irrigation, and migration of agricultural labour.
5.7.2 Marketing problems
Majority of the sample farmers (73.33 per cent) opined the problem of non-availability of exclusive market for organic produce followed by non-availability of market related information (71.67 per cent), lack of premium price in the local market (56.67 per cent), poor transport facilities (53.33 per cent) and high commission charges (21.67 per cent) as the major problems in marketing of organically produced sugarcane. The uncontrolled market situation among the respondents while marketing, for compelling the farmers to sale the organic produce in local market might have resulted for the incidence of these problems. Similar results were reported by Thimmareddy (2001) and Mallikarjun (2008) in their studies.

6. SUMMARY AND POLICY IMPLICATIONS
Sugarcane is one of the important commercial crops used for the manufacture of sugar, jaggery and other products. Jaggery provides an alternative market to sugarcane growers. About 26% of the sugarcane produced is diverted for jaggery production. The quality of the jaggery is dependent on the cane juice which in turn is determined by the variety and the environment in which the cane is grown. The adverse conditions viz., salinity, drought etc., affect cane yield and quality.
The process of jaggery preparation is also witnessed considerable changes as a result of which jaggery industry is offering stiff competition to sugar industry. The fact that as much as 45-50 per cent of the sugarcane produced in the country is being utilized annually for jaggery preparation speaks about the importance of jaggery industry. Further, it is estimated that two thirds of sweetening requirement in rural areas is met by jaggery. The jaggery industry in the country has thus, been continued to be an industry of great importance and significance.
In recent years, farmers facing problems of non-remunerative price for sugarcane produce in the event of surplus production and non-availability of adequate number of labours at the time of harvesting and also the Indian sugar industry has found itself in problems of high stocks, low prices, poor profitability and high raw-material cost. As a result sugarcane prices have gone up and down and sugar prices do not cover the raw-material and cost of production of sugar. This has resulted in delayed and low payments to the farmers for their sugarcane produce. In such situation, diversion of sugarcane towards jaggery processing may give more benefits to the sugarcane farmers and processors. Keeping all these aspects in view the present study was undertaken in Bagalkot district of Karnataka state, to examine the economics of organic and inorganic cultivation of sugarcane and jaggery preparation with the following specific objectives.
Specific objectives of the study are
1. To study the cost and returns involved under organic and inorganic sugarcane cultivation
2. To analyze the investment pattern in jaggery processing units 3. To study the cost and returns involved under organic and inorganic jaggery
preparation. 4. To ascertain the reasons for shifting from inorganic to organic cultivation of
sugarcane 5. To enumerate the problems of organic sugarcane growers
Study area and sampling design
Sugarcane is one of the important cash crops grown in Karnataka, which plays a major role in the state’s economy. The crop is grown on an area of 4.21 lakh hectare with a production of 375.95 lakh tonne (Appendix-I). It is cultivated extensively in 16 districts of the state. Bagalkot district ranks second in the cultivation of this crop with an area of 88.49 thousand hectars, organic farming is emerging trend and practiced throughout the district in cultivation of sugarcane and quite a large number of jaggery processing units (412 units) are located in the district are involved in preparation of both organic and inorganic jaggery. Hence, Bagalkot district of Karnataka state was considered for detailed investigation on organic and inorganic sugarcane cultivation and jaggery preparation. Although the crop is grown in almost all the taluks of Bagalkot district, its cultivation is concentrated in Mudhol and Jamkhandi taluks. Further 43.69 per cent of the jaggery processing units are located in these two taluks. Hence, these two taluks were considered for further investigation.
A multistage random sampling design was adopted for the purpose of collection of primary data with respect to the selection of district, taluks, villages and sample farmers of both organic and inorganic sugarcane cultivation and jaggery processors. In all, six villages spread over the two selected taluks were considered for the present study. From each sampled villages, ten organic and ten inorganic sugarcane growers and three organic and three inorganic jaggery processors were also randomly selected.

Thus, in all a sample size of 120 sugarcane farmers and 36 jaggery processors from 6 villages, were interviewed for eliciting the required information on sugarcane cultivation and jaggery preparation and required secondary data were also collected from the concerned offices of the district for the crop year 2011-12.
Analytical techniques
The tabular presentation and budgeting technique methods were followed to study the general characteristics of sample farmers, reasons for shifting over to organic farming, costs and returns involved in organic and inorganic sugarcane cultivation and jaggery preparation and problems faced by the organic farmers. The averages and percentages were worked out. The financial analysis of jaggery processing unit is mainly based on the incremental cost and returns accruing from processing units. The Pay-Back Period (PBP), Net Present worth (NPW), Benefit-Cost Ratio (BCR) and Internal Rate of Returns (IRR) were used as appraisal criteria for evaluating financial feasibility of investment in organic and inorganic jaggery processing units.
Findings of the study
Labour use pattern in both organic and inorganic sugarcane farms
1. The maximum cost involved (Rs.3,302.92) was in case of irrigation followed by hand weeding (Rs. 2,646.88), harvesting (Rs.2,897.25), harvesting (Rs.2,517.66), ploughing (Rs.1,350), intercultivation (Rs.1,200), sett bed preparation (Rs.1,000 transportation of FYM (Rs. 900), planting (Rs.653.20), harrowing (Rs. 600), spreading of FYM (Rs.454.40), organic manures (Rs.370.62) and biofertilizers / biopesticide application (Rs. 205.90).
2. Whereas in case of inorganic sugarcane production, the maximum cost involved (Rs. 3,444.92) was in case of irrigation followed by hand weeding (Rs.3146.72), harvesting (Rs. 2659.66), ploughing (Rs.1350.00) intercultivation (Rs. 1,200), sett bed preparation (Rs. 960.00), transportation of FYM (Rs. 810), harrowing (Rs. 800), planting (Rs.681.60), fertilisers (Rs.541.02) and spreading of FYM (Rs. 440.20).
Among the different types of labour used, utilization of human labour was found to be highest in case of inorganic (76.86 man days) compared to organic (71.49 man days) sugarcane cultivation. But in case of inorganic sugarcane cultivation, use of human labour was comparatively more than that of organic sugarcane farms.
Cost and returns structure in both organic and inorganic sugarcane farms
1. The average cost of sugarcane cultivation on organic farm was Rs. 45,974.50 per acre as against Rs. 54,331.82 per acre on inorganic farm. The cost of chemical fertilizers on inorganic farms was the differing factor in the cost. In the total cost, variable costs accounted for a major share. The proportion of variable cost was Rs. 35,710.82 and Rs. 44,294.38 accounting for 77.68 per cent and 81.53 per cent of the total cost of sugarcane cultivation on organic and inorganic farms, respectively.
2. In the case of organic farms, the variable costs mainly comprised of cost of human labour, cost of organic manure (FYM, green manuring, vermicompost, biofertilizers and biopesticides), cost of setts and cost of bullock labour which were, Rs. 10151.58, Rs. 9,613.02, Rs. 8,320 and Rs. 2,800 accounting for 22.08 per cent, 20.90 per cent, 18.10 per cent and 6.09 per cent of the total cost of cultivation, respectively.
3. The expenditure on organic manure found to be an important item in total cost of cultivation on organic farms. The other variable cost items such as interest on working capital 5.08 per cent (Rs. 2,336.22) and cost of machine labour accounted for 4.89 per cent (Rs. 2,250) of the total cost of sugarcane cultivation on organic farms, respectively.
4. In the cost of sugarcane cultivation on inorganic farms, the variable cost mainly comprised of cost of human labour, cost of setts, cost of FYM and cost of chemical fertilisers which were Rs. 10914.12, Rs. 9,900, Rs. 5,624 and Rs. 5,090 accounting for 20.09 per cent, 18.22 per cent, 10.35 per cent and 9.37 per cent of the total cost of cultivation, respectively.

5. The expenditure on chemical fertilizers found to be an important item in the total cost of cultivation on inorganic farms. The other variable cost items such as cost of bullock labour and interest on working capital accounted for 5.45 per cent (Rs. 2960) and 4.76 per cent (Rs. 2587.80) of the total cost of sugarcane cultivation on inorganic farms, respectively.
6. The total returns in case of organic farm was Rs.82,328 per acre whereas it was Rs.81,360 per acre in inorganic farm. The net returns realized from organic sugarcane farm was Rs. 36,353.90 and Rs.27,028.18 from inorganic farm. In sugarcane cultivation, the return per rupee of cost of cultivation was 1.79 in case of organic farm and it was 1.50 in case of inorganic farm.
Investment pattern, cost and returns structure in jaggery processing units
1. The study revealed that the cost of establishing a jaggery processing unit with a capacity of one tonne per day was around Rs. 4,38,875. The investment on land, shed and cane crusher shared as much as about 82 per cent of the total investment.
2. In jaggery processing, the share of raw material cost (sugarcane) in total cost was estimated to be 78.92 per cent and 78.01 per cent in organic and inorganic jaggery preparation, respectively. While the percentages share of fixed cost in the total cost was only 2.02 and 1.82 per cent in organic and inorganic jaggery preparation, respectively.
3. The return realized from per jaggery processing unit was Rs. 30,69,232.53 and Rs.32,84,661.71 with a net margin of Rs. 6,33,536.67 and Rs. 5,87,992.37 in organic and inorganic jaggery preparation, respectively.
4. The cost of producing one tonne of organic and inorganic jaggery worked out to be Rs. 21,760.89 and Rs. 22,008.24, respectively.
5. About 77.54 and 91.46 tonnes of organic and inorganic jaggery were required to be produced by processing units to reach break-even level of output. Hence, a processing unit should crush sugarcane for a minimum of 96.92 and 91.46 days in organic and inorganic jaggery preparation, respectively to reach the point of no profit or no loss.
Financial feasibility of investment in jaggery processing units
1. The pay-back period in processing units was found to be 0.69 and 0.75 years, with a benefit-cost ratio of 1.22 and 1.18, IRR with more than 100 per cent and a positive net present values observed in organic and inorganic jaggery processing units, respectively. It indicates the economic viability of jaggery processing unit in the study area.
2. The net benefits of jaggery processing units were highly sensitive to either a marginal fall in price of organic and inorganic jaggery or a marginal rise in price of organic and inorganic sugarcane.
3. A large number of processing units were found to crush sugarcane for a period of 4-5 months. The average crushing period was 140 and 153 days in organic and inorganic jaggery preparation, respectively.
Reasons for shifting from inorganic to organic cultivation of sugarcane
1. It was observed that majority of the sample farmers expressed the reason of increasing return from organic sugarcane (71.67 %), followed by reason of increasing cost of inorganic chemical fertilizers (65 %), soil health oriented motives (61.67 %), quality of organic sugarcane and jaggery (53.33 %), human health oriented motives (51.67 %), motivation by organic growers association/institutions (48.33 %), motivation by neighboring organic farmers (46.67 %), environmental concern (43.33 %), demand for organic jaggery (38.88 %), motivation by media (31.67 %) and supportive subsidies by the government (30 %) are the reasons for shifting over to organic cultivation of sugarcane from inorganic cultivation.

Problems of organic sugarcane farmers
1. It was observed that majority of the sample farmers (76.67 %) expressed the problem of non-availability of labour, followed by problem of non-availability of information on organic farming (58.33 %), non-availability of biopesticides (50 %), limited and irregular power supply (48.33 %), non-availability of organic manures (23.33 %) and incidence of pest and diseases (11.67 %), as the major problems in production of sugarcane organically. This might be due to non-availability of recommended package of practice and laborious process involved in application of organic practices, coupled with big land holdings and migration of agricultural labour.
2. In case of marketing related problems, majority of the sample farmers (73.33 %) expressed the problem of non-availability of exclusive market for organic produce followed by non-availability of market related information (71.67 %), lack of premium price in the local market (56.67 %) and poor transport facilities (53.33 %) as the major problems in marketing of organically produced sugarcane. The uncontrolled market situation among the respondents while marketing, for compelling the farmers to sale the organic produce in local market might have resulted for the incidence of these problems.
Policy implications
Based on the findings of the study following policy implications are drawn,
1. The results of the study revealed that the net returns on organic farms (Rs. 36354) was found to be higher than inorganic farms (Rs. 27028). Hence, it is advisable for the sugarcane farmers to switch over to organic farming which minimizes the environmental degradation.
2. Jaggery production units are found to be economically viable (Rs. 1.26 per rupee of investment) and encouraging more and more jaggery units in sugarcane cultivating districts would reduce the pressure on sugar factories.
3. Investment in jaggery processing unit is found to be financially feasible and economically viable (NPV +ve, BCR >1 and IRR >100 %). Hence, there is a scope for investing on jaggery production unit and encouraging more and more jaggery units in sugarcane cultivating districts would reduce the pressure on sugar factories.
4. The benefits from jaggery processing were found to be highly sensitive to the increased price of sugarcane and decreased price of jaggery. Hence, there is need to evolve ways and means to stabilize the price of jaggery.
5. Majority of the farmers opined the problem of non-availability of labour (76.67 %) during peak period like harvesting. Hence, concerned state department of agriculture authorities in the sugarcane areas may provide adequate number of harvesting machines on custom hiring basis to the farmers at reasonable rates.
6. Organic sugarcane farmers are not finding market for their produce locally (73.33 %), hence there is immediate need for government intervention in establishing exclusive organic markets and there is need to create awareness among the consumers about the quality of organically produced products from view point of health so that organic producers will get good returns
REFERENCES
Anand Kumar, S., 1998, Motivating farmers to convert to organic farming and strategies for organic extension, IFOAM-Ecology and farming. May-Aug, pp. 18-21.
Anant Ram, V., 1989, Economics of processing and marketing of gur in Indore district (M.P). Indian J. Agril. Econ., 44 (3):337 -319.
Anita Arya., 2006, Organic farming in cotton-A case study of Agrocel industries,. Agric. Econ. Res. Rev., 19(2) : 235.
Anjugam, M., Jaganmohan, K. R., Padmarani, S. and Sundaresan, R., 2006, A study on organic farming of sugarcane in Western Zone of Tamil Nadu. Agric. Econ. Res. Rev., 19(2) : 233.
Anonymous, 1998, Evolution in jaggery manufacture. Indian-Sugar, 39(8): 611-614.
Argiles,J.M. and Duch.N.,2010, A comparison of the economic and environmental performances of conventional and organic farming: evidence from financial statements. Agril. Econ. Rev., 11(1):69-86.
Bai, S. K. Hariyappa, N., Reddy, D. R. B. Muralidhara, H. R. Raghuramulu, Y. and Jayarama., 2009, Economics of organic farming vis-a-vis conventional production of robusta coffee in India. J. Coffee-Res., 37(1/2): 16-25
Bruggen, A. H., Van, C. and Termorshuizen, A. J., 2003, Integrated approaches to root disease management in organic farming systems. Australasian Pl. Pathol., 32(2) : 141-156.
Chothe, G. D. and Borkar, M. M., 2000, Constraints faced by farmers in adoption of biofertilizers. Maharashtra J. Extn. Edu., 19: 298-299.
Dhandhalya, M. G. Shiyani, R. L. and Visawadia, H. R., 2010, Organic wheat farming for sustainable agriculture in saurashtra region of Gujarat state. Indian J. Agril. Mktg., 24(1):133-140
Franz, J. Bobojonov, I. and Egamberdiev, O., 2009, Assessing the economic viability of organic cotton production in Uzbekistan: A First Look, J. Sistain. Agri., 34(1):99-119
Ganesh, 2010, An economic analysis of organic farming in North Karnataka: A case study of organic villages. M. Sc. (Agri.) Thesis, Univ. Agric. Sci., Dharwad.
Hemanth Kumar, N. G., 1991, An analysis of investment and resource use efficiency in the processing of bakery products – a study in Bangalore city. M. Sc. (Agri.) Thesis, Univ. Agril. Sci., Bangalore.
Hosamani, M. M., Chitapur, B. M. and Bablad, H. B., 2000, Farm productivity-New century, new challenges. M. Sc. (Agri.) Thesis, Univ. Agril. Sci
Jaswinder Kaur and Kalra, R. K., 2006, Organic farming in Punjab-a case study. J. Interacademicia. 10(3) : 411-419.
Kalamkar, S.S., 2006, Organic farming in India : Progress, Possibilities and Constraints. Agric. Econ. Res. Rev., 19(2) : 230.
Kshirsagar, K. G., 2008, Organic sugarcane farming for enhancing farmers income and reducing the degradation of land and water resources in Maharashtra. Indian J. Agri. Econ., 63(3):396-405
Kumar, K. H and Chinnapa, B., 2010, Economic analysis of cashew processing in Karnataka. J. Plantation Crops, 38(1):66-71
Loganandan, N. and Premalata Singh., 2003, Adoption of organic farming : Profile and motives of farmer. Indian J. Ext. Edu., 39(1) : 35-40
Lohar, N. S., Babar, V.S., Killedar, N. S. and Toradmal, V. M., 2000, Relative economics of jaggery and sugar production in Kolhapur district of Western Maharashtra. Indian Sugar., 50(6): 361-366.

Malik, S. K. and Singh, R. P., 1999, Break-up of costs and returns of sugarcane production in reserve and free areas of sugar mills. Agricultural situation in India., 55(12):749-751.
Mallikarjun Patil., 2008, A study on production and marketing management behaviour of organic vegetable growers in Belgaum district, M. Sc. (Agri.) Thesis, Univ. Agric. Sci., Dharwad
Mungare, T. S., Jadhav, H. D., Shinde, U. S., Jadhav, B. S. and Singh, J., 2005, Clarification technique in quality jaggery making - a review. Cooperative Sugar., 32(12): 1013-1017.
Muralidharan, C. R., 1981, Comparative study of sugar into gur and khandasari-A case study in Mandya taluk, Mandya district. M. Sc. Thesis (Unpublished), Univ. Agril. Sci., Bangalore.
Murthy, M. K. K., Dhananjaya, B. and Naik, C. M., 2008, Organic farming practitioners and their perception. Environment and Ecol.. 26(1) : 136-141.
Nagaraj, N., Lalith and Venkatram, J. V., 1989, Economic analysis of fruit processing and its impact on employment generation, A case of Karnataka Agro-fruit Ltd., Indian J. Agril. Econ., 44(3):327-328.
Nagaraj, R., 1987, An evaluation of investments in coconut gardens in Tiptur taluk of Tumkur district. Karnataka M.Sc. (Agri) Thesis, Univ. Agric. Sci., Bangalore.
Nain, N., Khatkar, R. K. and Singh, V. K., 2002, Role of sugarcane processing industry and efficiency of processing in Haryana. Indian J. Agril. Mktg., 16(3): 97 -103.
Nandimath, T. Sachin, 2008, Economics of jaggery production in Karnataka. M. Sc. (Agri.) Thesis, Unvi. Agril. Sci., Bangalore.
Naveen, B. S. Kunnal, L. B. and Dodamani, M. T., 2010, Investment analysis in grapevine orchards. Agriculture-Update, 5 (1/2):86-91
Pawar, S. T. and Dongare, M. B., 2001, Scientific studies on jaggery manufacturing process. Cooperative Sugar., 32 (5): 369-374.
Raikar, N. A., 1990, Investment in production and marketing of cashew in Karnataka. M.Sc (Agri) Thesis, Univ. Agril. Sci., Dharwad.
Raju, V. T. and Ramesh, M. V., 1989, Economics of agro-processing-A case study of jaggery production and marketing in East Godavari district of Andhra Pradesh. Indian J. Agril. Econ., 44(3): 317.
Ramarao, I. V. Y., 2011, An Economic Appraisal of Manufacturing and Marketing of Jaggery in Andhra Pradesh .Sugar Tech ., 13(3):236-244
Ramaswamy, C., Uma, K. and Manimegalai, 1999, An analysis of supply: price relationship in sugarcane production in Tamilnadu. Indian J. Agril. Mktg., 13(1):15-24.
Ramesh, P., Panwar, N. R., Singh, A. B. and Yadav, S. K., 2010, Status of organic farming in India. Current Sci., 98(9):1190-1194
Restrepo and Rivera, J., 1997, Can the university contribute to the development of organic farming in Latin America?. Hoja. a. Hoja. del. Maela., 7(11) : 32-36
Rohal, B. S., Singh, K. V., Subhash, C. and Rajveer, S., 1989, "Economic analysis of agro-processing khandasari manufacturing industry. A case study in the district Muzffar nagar, Indian J. Agril. Econ., 44 (3): 340
Sale, Y. C. and Yadav, D. B., 2008, Sugarcane cultivation with an integrated approach in Kolhapur District of Maharashtra. Cooperative Sugar, 39 (8) : 29-32.
Saxena, K .K. and Singh, R.L., 2000, Adoption of organic farming practices by farmers of Malwa region. Maharashtra J. Extn. Educ., 19 : 53-58.

Sengar, R. S. Sharma, A. K. Singh, O. P. Kalpana, S. Shalini, G. and Madhu, G., 2010, Organic agriculture: a prerequisite for sustainability. Stable food production and sustainable agriculture:a challenge ahead in 21
st Century, pp. 152-185
Shivaramu, H. S., Shankaraiah, C. and Ankegowda, 2002, Comparative efficacy of triple pan jaggery making furnace over local types in cauvery command area of Karnataka. Cooperative Sugar., 34(3): 201-205.
Shrilakshmi . B., 2003, Food science. New age publishers., New Delhi, P.212-213.
Singh, G. N., Anantram, V. and Singh, S. D., 1981, Economics of marketing processing of arhar in Unnao district (U.P). Agril. Mktg., 26: 8-12.
Singh, I. P. and Grover, D. K., 2011, Economic viability of organic farming: An empirical experience of wheat cultivation in Punjab. Agric. Econ. Rev., 24(2):275-281
Subramanyam, K. V. and Sudha. M. 1993, Economics of linking tomato processing with production and marketing. Indian Food Packer., pp. 29-33
Sujatha, R. V., Eswara Prasad, Y. and Suhasini, K., 2006, Comparative analysis of efficiency of organic farming vs inorganic farming- A case study in Karimnagar district of Andhra Pradesh. Agric. Econ. Res. Rev., 19(2) : 232.
Suresh Reddy, B., 2010, organic farming: status, issues and prospects–A review Agic. Econ. Res. Rev., 23(2):343-358
Suresh, H., 2001, Performance of organic farming in Shimoga district of Karnataka – An economic analysis, M. Sc. (Agri.) Thesis, Univ. Agric. Sci., Dharwad, Karnataka (India).
Suryawanshi, S. D., Lohar, N. S. and Gores, K., 1994, Economics of marketing and export potential of jaggery in western Maharashtra. Indian J. Agril. Econ., 49 (3).62.
Sushil Kumar, Thakur, D. S., Chauhan, S. K. and Sharma, K. D., 2006, Impact of drought on cost and returns from cereal crops under different organic and inorganic farming systems in Himachal Pradesh. Agric. Econ. Res. Rev., 19(2) : 227.
Teggi, M. Y., 1995, Production and marketing of jaggery in Ghataprabha command area: An economic analysis M. Sc. (Agri.) Thesis, Univ. Agric. Sci., Dharwad.
Timmareddy, K. S., 2001, Case studies on organic farming. M. Sc. (Agri.) Thesis, Univ. Agric. Sci., Dharwad, Karnataka (India).
Tripathi, A. O., Shingane, U. S and Thakare, L. S., 2010, Comparative economics of organic and inorganic farming. Agril. Update, 5(3):397-399
Usha, R., Neena, J., Shivaramu, H. S., Sheela, K. and Sunanda, S., 2004, Processing practices of jaggery manufacturers in Cauvery command area of Karnataka, Cooperative Sugar, 35(11): 853-856.
Venkatram, R. and Mani, K., 2006, Prospects and constraints in adoption of organic farming- A micro-level study in Tamil Nadu. Agric. Econ. Res. Rev., 19 (2) : 228.
Waykar, K. R., Yadav, D. B., Shendage, P. N. and Sale, Y. C., 2006, Economics of grape production under organic and inorganic farming in the Nasik district of Maharashtra state. Agric. Econ. Res. Rev., 19(2) : 240
Zhang, L. and Wang, W., 2011, The benefit cost analyses and development countermeasures of organic rice production. Acta Agriculturae Shanghai., 27(1): 94-97

Appendix I: State wise areas under sugarcane in India (2010-11)
States Area (lakh hectare) Production
(lakh tonnes)
Andhra Pradesh 1.92 147.84
Assam 0.28 10.97
Bihar 3.00 150.00
Gujarat 1.88 142.40
Haryana 0.85 59.87
Karnataka 4.21 375.95
Madhya Pradesh 0.65 26.67
Maharashtra 9.64 788.38
Orissa 0.13 9.03
Punjab 0.70 41.70
Tamil Nadu 3.36 342.92
Uttar Pradesh 21.25 1205.55
Uttarakhand 1.01 65.16
West Bengal 0.15 11.00
Others 0.28 9.53
India 49.40 3391.68
Source: Indiastat .com

Appendix II: Projections of sweetener requirement vis-à-vis sugarcane production in India up to 2020 AD
Sweetener requirement
(MT) Year
Sugar Jaggery Total
Sugarcane
requirement
(MT)
Sugar
Production (MT)
1990-91 12.40 9.00 21.40 241.00 12.05
2000 18.00 13.70 31.70 300.00 18.90
2010 22.17 16.81 38.98 348.50 22.48
2020 27.29 20.69 47.98 415.00 27.39
Source: National Commission of Agriculture (1976)

INTERVIEW SCHEDULE
I. GENERAL INFORMATION:
1. Name of the respondent: Age:
Village: Taluk:
Education: Illiterate / Primary / High school / College
Income and source: i. Main occupation: Rs.
ii. Subsidiary: Rs.
2. Household composition
Whether engaged in
farming SN
Name of the family member
Sex Age Education
Yes No
Occupation
1. 2. 3. 4. 5. 6.
3. Inventory
(a) Land Holding (Acre)
Land holding Soil type Dry Irrigated Total Source of Irrigation
Owned
Leased-in
Leased-out
Total
b. Live stock position Item Number Year of
purchase(Rs.) Purchase value(Rs.)
Present value(Rs.)
1. Bullock pairs 2. Cows 3. Buffaloes 4. Young stock 5. Sheep 6. Goat 7. Poultry birds 8. Others(specify)

c. Machinery & equipments
Types of assetts
Nos. Year of
purchase/ Construction
purchase Value(Rs)
Junk value(Rs)
Present value (Rs)
Expected life
span(Year)
Building
Bullock cart
Sprayer
Tractor
Plough: i. wooden
ii. Iron
Implements:
1. Pumpset
2. Irrigation equipments
3. Others if any
(i).
(ii).
(iii).
4. Cropping Pattern
Total area(acres) Season Crop Variety
Rainfed Area(acres)
Irrigation(acres) Organic Inorganic
1.
2.
3.
4.
5.
Kharif
6.
1.
2.
3.
4.
Rabi
5.
1.
2.
3.
Summer
4.
Total

6. PERTICULARS OF FARM INPUT USED/TYPE OF FARMING PRACTICED
Organic Inorganic
Name of inputs
Time of application
Method of application
Qty/ acre
Price/ unit
Name of inputs
Time of application
Method of application
Qty/acre Price/unit
FYM Fertilizer
Green manuring
1. N
Poultry manure
2. P
Compost 3. K
Vermicompost
Beejambrutha
Panchagavya
Complex
Seed cake
/ press mud
Pesticides
Bio-fertilizers 1.
Biopesticides 2.
Crop residues 3
Mulching
Trap cropping
Others
I. A} COST OF CULTIVATION SHEET
Area (acres): Variety:
Type: Organic / Inorganic Season: Adsali / Eksali / pre-
season.

a) Labour use pattern
Family labour Hired labour Total Particulars
No. of times
M W BP ML M W BP ML M W BP ML
Ploughing
FYM:
i. Transportation
ii. Application
Harrowing
Sowing
Organic manure or
Fertilizer application
i. Basel
ii. Top dressing
a.
b.
Set bed preparation
Setts preparation
Planting
Hand weeding
Inter cultivation
Spraying PPC/Biopesticides
Irrigation
Harvesting
Transportation
Others(if any specify)
1)
2)
Note: M=Men, W=Women, BP= Bullock pairs, ML=Machine labour (in hour)
{Wage rate--- Men:Rs.: _____ /day, Women: Rs.______/day, Bullock pair: Rs._____/ day)&
Machine labour:Rs.________/hour
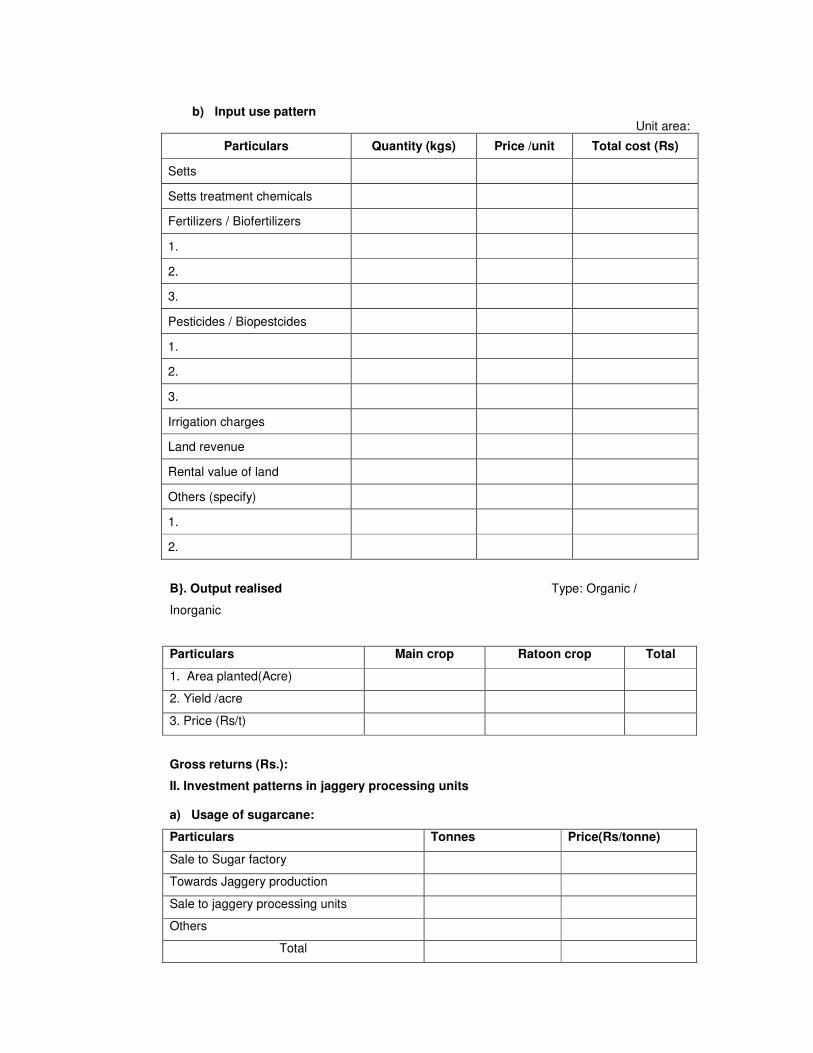
b) Input use pattern
Unit area:
Particulars Quantity (kgs) Price /unit Total cost (Rs)
Setts
Setts treatment chemicals
Fertilizers / Biofertilizers
1.
2.
3.
Pesticides / Biopestcides
1.
2.
3.
Irrigation charges
Land revenue
Rental value of land
Others (specify)
1.
2.
B}. Output realised Type: Organic /
Inorganic
Particulars Main crop Ratoon crop Total
1. Area planted(Acre)
2. Yield /acre
3. Price (Rs/t)
Gross returns (Rs.):
II. Investment patterns in jaggery processing units a) Usage of sugarcane:
Particulars Tonnes Price(Rs/tonne)
Sale to Sugar factory
Towards Jaggery production
Sale to jaggery processing units
Others
Total
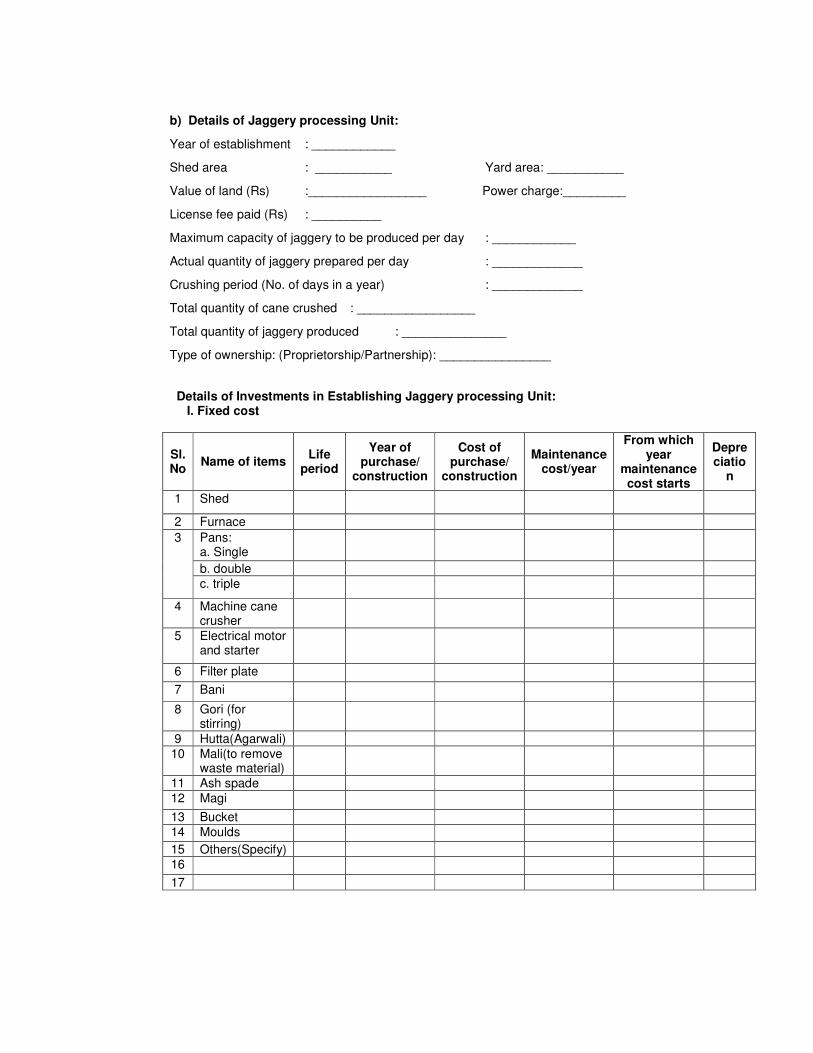
b) Details of Jaggery processing Unit:
Year of establishment : ____________
Shed area : ___________ Yard area: ___________
Value of land (Rs) :_________________ Power charge:_________
License fee paid (Rs) : __________
Maximum capacity of jaggery to be produced per day : ____________
Actual quantity of jaggery prepared per day : _____________
Crushing period (No. of days in a year) : _____________
Total quantity of cane crushed : _________________
Total quantity of jaggery produced : _______________
Type of ownership: (Proprietorship/Partnership): ________________
Details of Investments in Establishing Jaggery processing Unit: I. Fixed cost
Sl. No
Name of items Life
period
Year of purchase/
construction
Cost of purchase/
construction
Maintenance cost/year
From which year
maintenance cost starts
Depreciatio
n
1 Shed
2 Furnace
Pans: a. Single
b. double
3
c. triple
4 Machine cane crusher
5 Electrical motor and starter
6 Filter plate
7 Bani
8 Gori (for stirring)
9 Hutta(Agarwali)
10 Mali(to remove waste material)
11 Ash spade
12 Magi
13 Bucket
14 Moulds
15 Others(Specify)
16
17

II. Variable cost
I. Materials/Chemicals Used In Jaggery Preparation: Sl.No Materials Quantity Rate/Quantity Amount 1 Sugarcane
1)Owned
2)Purchased
2 Sodium Hydrosulphite
3 Lime Super phosphate
4 Bhendi extract
5 Sodium bicarbonate
6 Super Phosphate
7 Soda powder
8 Safflower oil
9 Fuel: Wood Stubbles
10 Tar (as a lubricant for machines)
11 Khadi cloth
2 Polythene sheet
13 Gunny bag
14 Plastic pipes
15 Drum/Barrel
16 Electricity /diesel
17 Others(specify)
18 II. Transportation Cost: ___________
III. Storage cost: _____________
IV. Labour Required For Preparation of Jaggery
Labour required
Men Women Sl. No
Name of the operation
Family Hired Family Hired
1 Feeding the cane to the crusher
2 Collecting of juice and stirring, putting in boiling pan
3 Constant stirring of juice
4 Feeding the fuel to the furnace
5 Removing the buggase
6 Transferring the juice to the mould
7 Arrangement of moulds
8 Separation of jaggery from moulds after cooling
9 On farm sale of jiggery
Transportation
Loading and unloading
10 Transportation of the jaggery from farm to nearby market or storage in godowns
a) Loading and unloading
b) Transportation

Wage rate: Men__________Rs/day Women _________Rs/day
C) Returns from jaggery preparation:
Quantity of Jaggery prepared:
Value of jaggery (Rs/Qtls):
Waste material produced:
Value of waste material:
To whom sold:
Amount charged for jaggery preparation/Qtls:
IV. REASONS FOR SHIFTING TO ORGANIC CULTIVATION
Reasons Remarks
1. Increasing cost of inorganic chemicals Yes/No
2. More return from organic sugarcane cultivation Yes/No
3. Demand for organic jaggery Yes/No
4. Quality of organic sugarcane and jaggery Yes/No
5. Soil health oriented motives Yes/No
6. Environmental concern Yes/No
7. Human health oriented motives Yes/No
8. Motivation by neighboring organic farmers Yes/No
9. Motivation by media Yes/No
10. Motivation by organic growers association/institutions Yes/No
11. supportive subsidies by the government Yes/No V. Problems faced by organic sugarcane growers
Sl no
Problems Yes No Remarks
A Production related problems
1 Non-availability of organic manures
2 Non-availability of biopesticide
3 Incidence of pest and diseases
4 Limited and irregular power supply
5 Non-availability of labour
6 Non-availability of information on organic farming
B Marketing problems
1 Poor transport facilities
2 Non-availability of market related information
3 High commission charges
4 Faulty weighment
5 In accurate weighing instruments
6 Non-availability of exclusive market placer exclusively for organic produce
7 Absence of premium price in the local market
8 Others (If any)
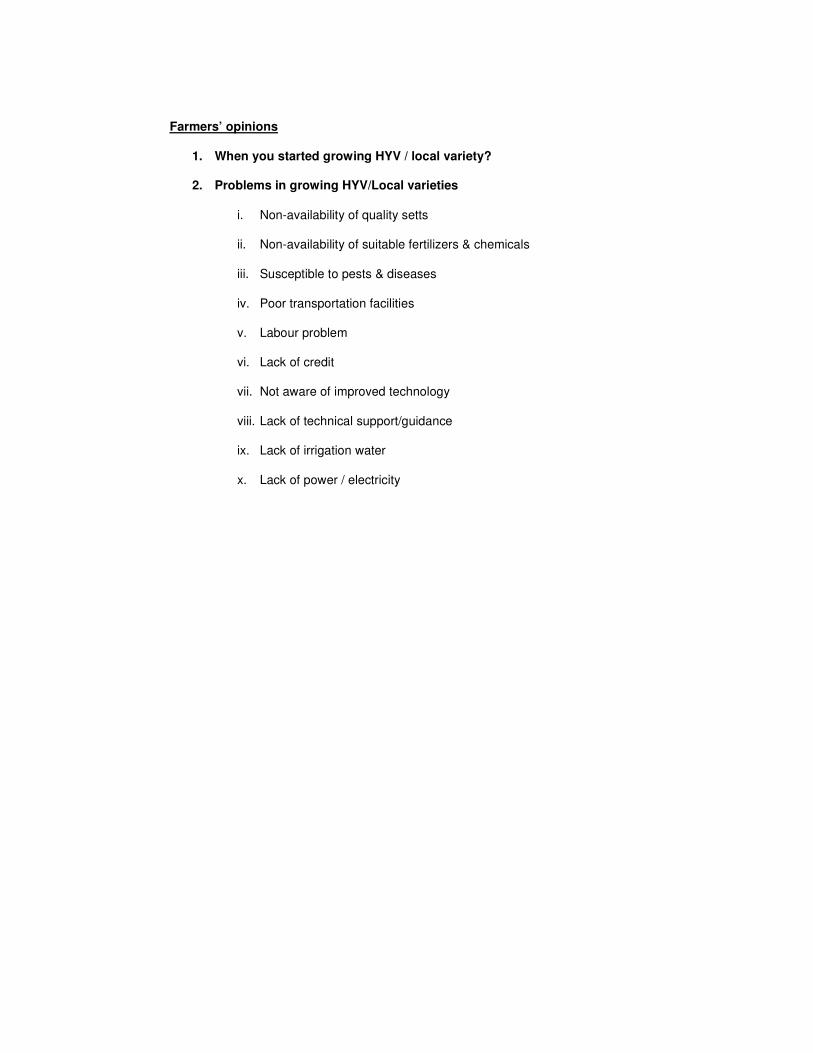
Farmers’ opinions
1. When you started growing HYV / local variety?
2. Problems in growing HYV/Local varieties
i. Non-availability of quality setts
ii. Non-availability of suitable fertilizers & chemicals
iii. Susceptible to pests & diseases
iv. Poor transportation facilities
v. Labour problem
vi. Lack of credit
vii. Not aware of improved technology
viii. Lack of technical support/guidance
ix. Lack of irrigation water
x. Lack of power / electricity
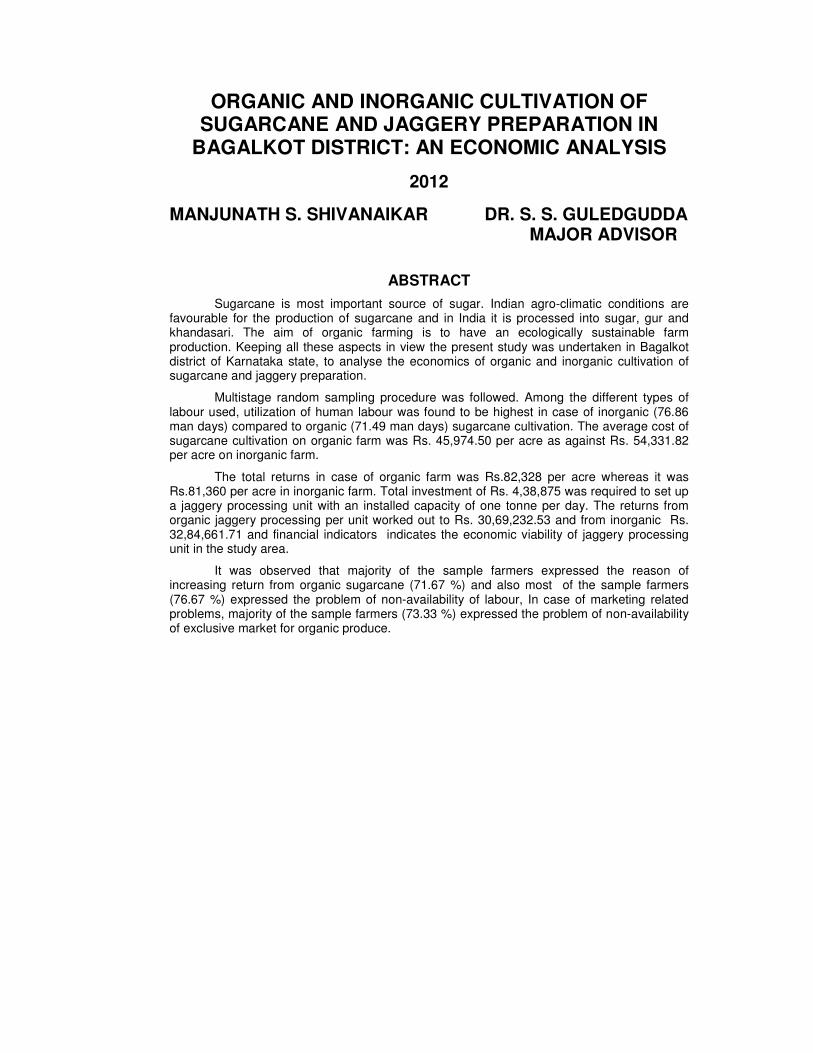
ORGANIC AND INORGANIC CULTIVATION OF
SUGARCANE AND JAGGERY PREPARATION IN
BAGALKOT DISTRICT: AN ECONOMIC ANALYSIS
2012
MANJUNATH S. SHIVANAIKAR DR. S. S. GULEDGUDDA
MAJOR ADVISOR
ABSTRACT
Sugarcane is most important source of sugar. Indian agro-climatic conditions are favourable for the production of sugarcane and in India it is processed into sugar, gur and khandasari. The aim of organic farming is to have an ecologically sustainable farm production. Keeping all these aspects in view the present study was undertaken in Bagalkot district of Karnataka state, to analyse the economics of organic and inorganic cultivation of sugarcane and jaggery preparation.
Multistage random sampling procedure was followed. Among the different types of labour used, utilization of human labour was found to be highest in case of inorganic (76.86 man days) compared to organic (71.49 man days) sugarcane cultivation. The average cost of sugarcane cultivation on organic farm was Rs. 45,974.50 per acre as against Rs. 54,331.82 per acre on inorganic farm.
The total returns in case of organic farm was Rs.82,328 per acre whereas it was Rs.81,360 per acre in inorganic farm. Total investment of Rs. 4,38,875 was required to set up a jaggery processing unit with an installed capacity of one tonne per day. The returns from organic jaggery processing per unit worked out to Rs. 30,69,232.53 and from inorganic Rs. 32,84,661.71 and financial indicators indicates the economic viability of jaggery processing unit in the study area.
It was observed that majority of the sample farmers expressed the reason of increasing return from organic sugarcane (71.67 %) and also most of the sample farmers (76.67 %) expressed the problem of non-availability of labour, In case of marketing related problems, majority of the sample farmers (73.33 %) expressed the problem of non-availability of exclusive market for organic produce.