organic agriculture worldwide 2016: current...
TRANSCRIPT

Research Institute of Organic AgricultureForschungsinstitut für biologischen Landbau
Organic Agriculture Worldwide 2016: Current StatisticsHelga Willer and Julia Lernoud, Research Institute of Organic Agriculture (FiBL), Frick, Switzerland
BIOFACH 2016, 10.2.2016

www.fibl.org
The World of Organic Agriculture 2016www.organic-world.net
› The 17th edition of ‚The World of Organic Agriculture‘, was published by FiBL and IFOAM – Organics International in February 2016.*
› Data tables› Country and continent reports› Markets, standards, policy
support› New sections: Commodity
case studies and Better data› Get your copy at the FiBL
Stand in Hall 1/549 or the stand of IFOAM - Organics International (1/447)
› www.organic-world.net

www.fibl.org
Acknowledgements› The Swiss State Secretariat of
Economic Affairs SECO, Berne
› International Trade Centre ITC
› Nürnberg Messe, the organizers of the BioFach World Organic Trade Fair
› 200 experts from all parts of the world contributed to the FiBL-IFOAM survey 2014.

www.fibl.org
Key data/indicators related to area and producers 2014
› 172 countries have data on organic agriculture. › 43.7 million hectares of agricultural land are organic
(including conversion areas).› 0.5 million hectares more than in 2013› Almost 1 percent of the agricultural land is organic› 11 countries have more than 10 percent organic
agricultural land.› 2.3 million producers were reported, more than three
quarters are in developing countries.

www.fibl.org
Development of the number of countries with data on organic agriculture
7786
97
100
110121
122135
140155
161
161
162
164
170 172
020406080
100120140160180200
1999 2000 2001 2002 2003 2004 2005 2006 2007 2008 2009 2010 2011 2012 2013 2014
Coun
tries
Development of the number of countries with data on organic agricultureSource: FiBL‐IFOAM‐SOEL‐Surveys 1999‐2016

www.fibl.org
Organic agricultural land and other areas 2014
Source: FiBL Survey 2016, based on data from governments, the private sector and certifiers.

www.fibl.org
Distribution of organic farmland
Oceania40%
Europe27%
Latin America15%
Asia8%
North America7%
Africa3%
Distribution of organic agricultural land by region 2014Source: FiBL Survey 2016

www.fibl.org
The ten countries with the most organic agricultural land 2014
0.91.01.11.31.41.71.92.2
3.117.2
0 5 10 15 20
CanadaGermanyFrance
UruguayItalySpainChina
US (2011)Argentina
Australia (2013)
Million hectares
The ten countries with the largest areas of organic agricultural land 2014Source: FiBL survey 2016

www.fibl.org
The countries with the highest shares of organic agricultural land 2013
10.8%11.1%11.2%12.0%12.7%14.3%
16.2%16.4%
19.4%30.9%
36.3%
0% 5% 10% 15% 20% 25% 30% 35% 40%
ItalyCzech Republic
LatviaSao Tome and Principe
SwitzerlandSamoaEstoniaSwedenAustria
LiechtensteinFalkland Islands (Malvinas)
Share of total agricultural land
Countries with more than 10 percent of organic agricultural land 2014Source: FiBL survey 2016

www.fibl.org
Growth of the organic agricultural land 1999-2013
11.014.9
17.319.8
25.7
29.9 29.2 30.1 31.534.4
36.3 35.737.5 37.6
43.2 43.7
0
5
10
15
20
25
30
35
40
45
50
1999200020012002200320042005200620072008200920102011201220132014
Million he
ctares
Growth of the organic agricultural land 1999‐2014Source: FiBL‐IFOAM‐SOEL‐Surveys 1999‐2016

www.fibl.org
Development of organic agricultural land in the regions 1999-2013
1.3
3.63.7
11.6
1.2
6.8
0.73.1
5.3
17.3
0
2
4
6
8
10
12
14
16
18
20
1999200020012002200320042005200620072008200920102011201220132014
Million he
ctares
Growth of the organic agricultural land by continent 1999‐2014Source: FiBL‐IFOAM‐SOEL‐Surveys 1999‐2016
Africa Asia Europe Latin America North America Oceania

www.fibl.org
Growth of the organic agricultural land by continent 2005‐2013
0.68
3.00
7.27
4.95
1.79
12.43
0.89
3.36
8.27
7.24
2.58
12.11
1.08 2.
46
10.01
7.54
2.47
12.15
1.15
3.22
11.14
6.95
3.01
12.16
1.26
3.57
11.63
6.79
3.08
17.34
0.0
2.0
4.0
6.0
8.0
10.0
12.0
14.0
16.0
18.0
20.0
Africa Asia Europe LatinAmerica
NorthAmerica
Oceania
Million he
ctares
Growth of the organic agricultural land by continent 2006‐2014Source: FiBL‐IFOAM survey 2008‐2016
2006 2008 2010 2012 2014

www.fibl.org
Development of organic land uses 2004-2013
3.4 4.1 4.3 4.6 4.9 5.5 6.27.4 7.6 8.0 8.5
0.9 1.4 1.4 1.9 2.0 2.5 2.6 2.9 3.2 3.3 3.4
21.820.1 20.4 20.0
22.3 22.9 23.1 22.6 22.6
27.0 27.5
0
5
10
15
20
25
30
2004 2005 2006 2007 2008 2009 2010 2011 2012 2013 2014
Million he
ctares
Development of the organic land by land use type 2004‐2014Source: FiBL‐IFOAM‐SOEL‐Surveys 1999‐2016
Arable crops
Permanent crops
Permanentgrassland

www.fibl.org
Land use and key crops 2013
Arable land crops19%
Permanent crops8%
Permanent grassland
63%
Other agr. Land1%
No details9%
Distribution of main land use types and crop categories 2014Source: FiBL Survey 2016; based on information from the private sector, certifiers, and governments.
Land use types 2014
0.290.37
0.982.57
3.36
0.0 1.5 3.0 4.5
VegetablesDried pulses
OilseedsGreen fodders
Cereals
Million hectares
Key arable crops
0.250.290.32
0.630.74
0.0 0.5 1.0
CocoaNuts
GrapesOlivesCoffee
Million hectares
Key permanent crops

www.fibl.org
Development of organic arable and permanent crops/crop groups 2004-2014
0.0
1.0
2.0
3.0
4.0
5.0
6.0
2004
2005
2006
2007
2008
2009
2010
2011
2012
2013
2014
Million he
ctares
Development of organic arable crop groups 2004‐2014Source: FiBL‐IFOAM‐SOEL survey 2006‐2016
Vegetables
Oilseeds
Dried pulses
Cereals
0.0
0.5
1.0
1.5
2.0
2.5
3.0
2004
2005
2006
2007
2008
2009
2010
2011
2012
2013
Million he
ctares
Development of organic permanent crops/crop groups 2004‐2014Source: FiBL‐IFOAM‐SOEL survey 2006‐2016
Olives
Grapes
Fruit, tropical andsubtropical
Fruit, temperate
Coffee
Cocoa
Citrus fruit

www.fibl.org
Organic producers 2014
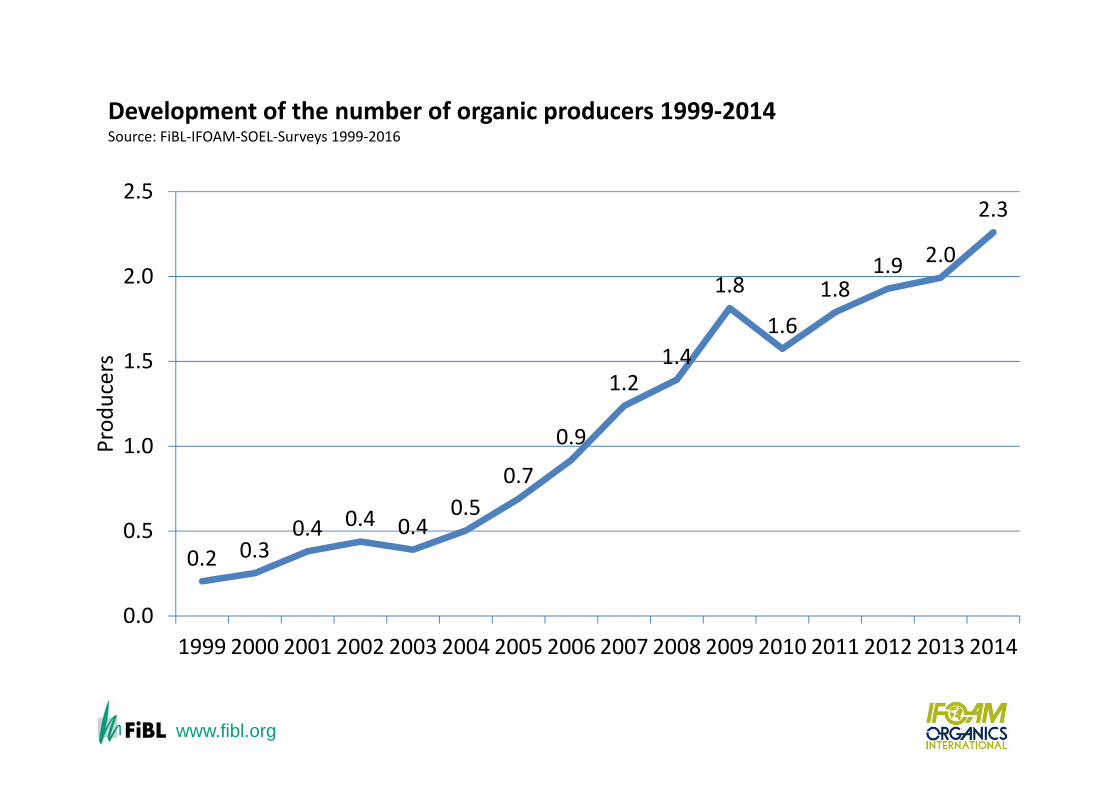
› For the current survey, a total of almost 2.3 million organic producers were reported.
› According to the data obtained, more than three quarters of the producers are located in developing and transition countries.
› The country with the most producers is India (650’000, 2013), followed by Uganda (190’552) and Mexico (169’703, 2013).
› It should be noted that not all certifiers reported the number of producers; their number is probably higher than 2.3 million.

www.fibl.org
The ten countries with the largest numbers of organic producers 2012
48'662
58'258
65'126
71'472
135'827
148'610
165'974
169'703
190'552
650'000
0 200'000 400'000 600'000 800'000
Italy
Paraguay
Peru
Turkey
Ethiopia (2013)
Tanzania (2013)
Philippines
Mexico (2013)
Uganda
India (2013)
Number of producers
The ten countries with the largest numbers of organic producers 2014Source: FiBL survey 2016
Asia40%
Africa26%
Latin America17%
Europe15%
Oceania1%
North America
1%
Organic producers by region 2014Source: FiBL Survey 2016
www.fibl.org
World: Development of organic producers 1999-2012
0.2 0.30.4 0.4 0.4
0.50.7
0.9
1.21.4
1.8
1.61.8
1.9 2.0
2.3
0.0
0.5
1.0
1.5
2.0
2.5
1999 2000 2001 2002 2003 2004 2005 2006 2007 2008 2009 2010 2011 2012 2013 2014
Prod
ucers
Development of the number of organic producers 1999‐2014Source: FiBL‐IFOAM‐SOEL‐Surveys 1999‐2016

www.fibl.org
ORGANIC FARMLAND 2014
Oceania
Europe
Latin Ameri
ca
Asia
North Ameri
caAfrica
0 5 10 15 20
Spain
China
US (2011)
Argentina
Australia (2013)
Million hectares0% 10% 20% 30% 40%
Estonia
Sweden
Austria
Liechtenstein
Falkland Islands
Share of total agricultural land 0
5
10
15
20
25
30
35
40
45
50
1999 2004 2009 2014
Million he
ctares
Approx. 1% of the world’s
farmland is organic
43.7 Mio ha
+300% since 1999
Australia 17.2
Mio ha
In Oceania there were 17.3 Mio ha, in Europe 11.6 Mio ha, and in Latin America 6.8 Mio ha.
The ten countries with the largest organic agricultural areas have combined 73% of the world’s organic agri-cultural land.
11 countries have more than 10% of their agricultural land under organic management.
In 2014, almost 500’000 hectares were reported compared with 2013.
Source: FiBL survey 2016 www.organic‐world.net
Distribution of organic agricultural land by region 2014
The five countries with the largest areas of organic agricultural land 2014
Countries top five with more than 10 percent of organic agricultural land 2014
Growth of the organic agricultural land 1999‐2014

www.fibl.org
ORGANIC PRODUCERS 2014
40% in Asia
Asia
Africa
Latin America
Europe
Oceania North America
0 200000 400000 600000 800000
Tanzania (2013)
Philippines
Mexico (2013)
Uganda
India (2013)
Number of producers
0.0
0.5
1.0
1.5
2.0
2.5
1999 2004 2009 2014
Prod
ucers
+1’000% since 1999
2.3 Mio producers
The country with the most organic producers is India, followed by Uganda and Mexico.
More than 75% of the producers are in Asia, Africa, and Latin America.
There has been an increase in the number of producers by almost 270’000, or over 13%.
The five countries with the largest numbers of organic producers 2014
Distribution of organic producersby region 2014
Development of the number of organic producers 1999‐2014
Source: FiBL survey 2016 www.organic‐world.net

www.fibl.org
ORGANIC LAND USE 2014
63% grassland
+5% more
permanent crops
8.5 Mio ha
arable land
0.0 1.5 3.0 4.5
Vegetables
Protein crops
Oilseeds
Green fodders
Cereals
Million hectares
Europe
Asia
North America
Latin America
Africa
0.0 0.3 0.5 0.8 1.0
Cocoa
Nuts
Grapes
Olives
Coffee
Million hectares
Europe
Latin America
Africa
Asia
North America
Oceania
37.5Mio ha of wild
collection
The organic wild collection areas are concentrated in Europe, Africa, Asia, and Latin America.
Europe
Africa
Asia
Latin Americ
a
0 5 10
Russian…
Namibia
India
Zambia
Finland
Million hectares
27.5 Mio ha of grassland, and an almost 2% increase compared with 2013.
3.4 Mio ha, which is 2% of the world’s permanent cropland, and a 8% share of the organic agricultural land.
Arable land constitutes 19% of the world’s organic agricultural land, and 0.6% of the world’s arable crop land. It increased by 6.7% over 2013.
OceaniaEurope
Latin America
North America
0 5 10 15 20
Spain
US (2011)
Uruguay
Argentina
Australia (2013)
Million hectares
Organic permanent grasslandby region 2014
Organic arable land by region 2014 Organic permanent crops by region 2014 Organic wildcollection by region 2014Organic wild collection: The five countries with the largest areas 2014
Organic permanent crops: Key crops 2014Organic arable land: Key crops 2014Organic permanet grassland: The fivecountries with the largest areas 2014
Source: FiBL survey 2016 www.organic‐world.net

www.fibl.org
Resources
› «The World of Organic Agriculture» at www.organic-world.net
› Slides and infographics at www.organic-world.net and www.organic-europe.net
› Twitter.com/fiblstatistics› Interactive maps at www.organic-world.net› Interactive datatables at www.organicdatanetwork.net
and www.organic-world.net› Interactive infographics at www.ifoam-eu.org
22

www.fibl.org
The World of Organic Agriculture 2016 at www.organic-world.net/yearbook/yearbook-2016.html
Get copy at FiBL stand in Hall 1/549

www.fibl.org
Presentations at www.organic-world.net
24

www.fibl.org
www.twitter.com/fiblstatistics
25

www.fibl.org
www.organic-world.net/statistics/statistics-data-tables/maps.html
26
www.fibl.org
hthttp://www.organic-world.net/statistics/statistics-data-tables/ow-statistics-data-key-data.html
27

www.fibl.org
Results
28

www.fibl.org
www.ifoam-eu.org/en/organic-europe
29
Explore data at the IFOAM/IFOAM-EU Stand in Hall 1/447

www.fibl.org
www.ifoam-eu.org/en/organic-europe
30
Explore data at the IFOAM/IFOAM-eU Stand in Hall 1/447

www.fibl.org
Summary
› In 2014 organic farming continued to grow: More organic farmland, more producers, market growth.
› However, the development varies a lot between countries and regions.
› The outlook on the organic markets continues to be good; there is scope for further growth. However, particularly in Europe, production is not keeping pace with the market development.
› For better monitoring of the development of the sector, data collection and processing need to be improved in many countries, in particular for market and international trade data.

www.fibl.org
Indicator World Leading countries Countries with data on certified organic agriculture 2014: 172 countries
New countries: Kiribati, Puerto Rico,Suriname, United States Virgin Islands
Organic agricultural land 2013: 43.7 million hectares (1999: 11 million hectares)
Australia (17.2 mio. Hectares, 2013)Argentina (3.1 mio. hectares)US (2.2 mio. hectares, 2011)
Share of total agricultural land
2014: 0.99 % Falkland Islands (Malvinas) (36.3 %)Liechtenstein (30.9 %)Austria (19.4 %)
Further, non‐agricultural organic areas (mainly wild collection)
2014: 37.6 million hectares Finland (9.1 million hectares)Zambia (6.18million hectares)India (4 million hectares)
Producers 2.3 million producers (2013: 2 million producers;2012: 1.9 million producers)
India (650’000; 2013), Uganda (190’552), Mexico (169’703; 2013)
Organic market size 80 billion US dollars(1999: 15.2 billion US dollars)Source: Organic Monitor
US (35.9 billion USD; 27.1 billion euros) Germany (10.5 billion USD; 7.9 billion euros)France (6.8 billion USD; 4.8 billion euros)
Per capita consumption 2014: 11 US dollarsSwitzerland (210 euros) Denmark (163 euros)Luxemburg (157 euros)
Number of countries with organic regulations 2015 87 countries
Number of IFOAM affiliates2015: 784 affiliates from 117 countries
Germany ‐ 91 affiliates, China ‐ 57 affiliates, India ‐ 44 affiliates, USA ‐ 40 affiliates