organic aerosol formation in urban and industrial...
TRANSCRIPT

Organic aerosol formation in urban and industrial plumes near
Houston and Dallas, Texas
R. Bahreini,1,2 B. Ervens,1,2 A. M. Middlebrook,3 C. Warneke,1,2 J. A. de Gouw,1,2
P. F. DeCarlo,4,5 J. L. Jimenez,1,6 C. A. Brock,3 J. A. Neuman,1,2 T. B. Ryerson,3
H. Stark,1,2 E. Atlas,7 J. Brioude,1,2 A. Fried,8 J. S. Holloway,1,2 J. Peischl,1,2 D. Richter,8
J. Walega,8 P. Weibring,8 A. G. Wollny,1,9 and F. C. Fehsenfeld1,2
Received 18 November 2008; revised 16 May 2009; accepted 4 June 2009; published 27 August 2009.
[1] We present measurements of organic aerosol (OA) in urban plumes from Houstonand Dallas/Fort Worth as well as in industrial plumes in the Houston area duringTexAQS-2006. Consistent with the TexAQS-2000 study, measurements show greateramount of aerosol mass downwind of the industrial centers compared to urban areas. Thisis likely due to higher emission and processing of volatile organic compounds (VOCs)from the industrial sources along the Houston ship channel. Comparisons of thecurrent measurements with observations from the northeastern (NE) United States indicatethat the observed ratios of the enhancement above background in OA, DOA, to theenhancement above background in CO, DCO, downwind of urban centers of Houston andDallas/Fort Worth are within a factor of 2 of the same values in plumes from urbanareas in the NE United States. In the ship channel plumes, DOA/DCO exceeds that in theurban areas by factors ranging from 1.5 to 7. We use a chemical box model tosimulate secondary organic aerosol (SOA) formation from anthropogenic and biogenicVOCs in different plumes using recently reported dependencies of SOA yields onVOC/NOx ratios. Modeled SOA to CO enhancement ratios are within a factor of 2 ofmeasurements. The increase in SOA from biogenic VOCs (BVOCs) predicted by thechemical box model as well as by a separate analysis using a Lagrangian particledispersion model (FLEXPART) is <0.7 mg per standard m3 (sm�3). We find no evidencefor a substantial influence of BVOCs on OA formation in our measurements inHouston area.
Citation: Bahreini, R., et al. (2009), Organic aerosol formation in urban and industrial plumes near Houston and Dallas, Texas,
J. Geophys. Res., 114, D00F16, doi:10.1029/2008JD011493.
1. Introduction
[2] Aerosol particles in the Earth’s atmosphere havegained much interest in recent years because of theirnegative effects on air quality, visibility and health, as wellas effects on climate through their direct and indirect
forcing. Sources of aerosol particles can be via direct(primary) emissions, as is the case for primary organicaerosols (POA), black carbon (soot), dust, and sea saltparticles, or via secondary gas, surface, or particle phasereactions, as is the case for sulfate and secondary organicaerosol (SOA) species. In urban areas where a pool of gas-phase volatile organic compounds (VOCs) and inorganicprecursors such as sulfur dioxide (SO2) and nitrogen oxides(NOx) exists, secondary formation and growth of aerosolsare important sources, often dominating the total aerosolload. Several field studies in recent years have characterizedthe emissions, growth, and processing of aerosols in anddownwind of polluted urban areas [Brock et al., 2003;Alfarra et al., 2004; Drewnick et al., 2004; Zhang et al.,2004; de Gouw et al., 2005; Volkamer et al., 2006, 2007;Brock et al., 2008; de Gouw et al., 2008; DeCarlo et al.,2008].[3] Although organic aerosols (OA) have been found to
be abundant in the atmosphere and constitute a majorfraction of submicron particles, both at the surface [Zhanget al., 2007a] and in the free troposphere [Heald et al.,2005; Murphy et al., 2006], their formation and abundance
JOURNAL OF GEOPHYSICAL RESEARCH, VOL. 114, D00F16, doi:10.1029/2008JD011493, 2009ClickHere
for
FullArticle
1Cooperative Institute for Research in Environmental Sciences,University of Colorado at Boulder, Boulder, Colorado, USA.
2Also at Earth System Research Laboratory, NOAA, Boulder, Colorado,USA.
3Earth System Research Laboratory, NOAA, Boulder, Colorado, USA.4Department of Atmospheric and Oceanic Sciences, University of
Colorado at Boulder, Boulder, Colorado, USA.5Now at Paul Scherrer Institut, Villigen, Switzerland.6Also at Department of Chemistry and Biochemistry, University of
Colorado at Boulder, Boulder, Colorado, USA.7Rosenstiel School of Marine and Atmospheric Science, University of
Miami, Miami, Florida, USA.8Earth Observing Laboratory, National Center for Atmospheric
Research, Boulder, Colorado, USA.9Now at Max Planck Institute for Chemistry, Mainz, Germany.
Copyright 2009 by the American Geophysical Union.0148-0227/09/2008JD011493$09.00
D00F16 1 of 17
is not yet well understood. In particular, the amount of SOApredicted in models using the measured concentrations ofknown precursor VOCs along with laboratory-based organ-ic aerosol formation yields has been shown to be a factor of3–100 lower than what is measured in the atmosphere [deGouw et al., 2005; Heald et al., 2005; Johnson et al., 2006;Volkamer et al., 2006; de Gouw et al., 2008; Kleinman etal., 2008].[4] Although both biogenic and anthropogenic sources
contribute to SOA, their relative contribution differs consid-erably in many studies. Furthermore, with reductions inanthropogenic VOCs from urban and industrial areas [e.g.,Fiore et al., 1998; Qin et al., 2007], it is of interest tocompare the relative importance of anthropogenic and bio-genic sources toward SOA formation. In an analysis ofpollution from the NE United States, de Gouw et al.[2005] estimated 11% of OA to be POA, 68% to be SOAfrom anthropogenic sources, 12% to be SOA from biogenicsources while the remaining 9% of OA could not beattributed to any of these sources. Similarly, in urban plumesobserved over the NE United States, no strong biogenicsource for water-soluble organic carbon (WSOC) was iden-tified [Quinn et al., 2006; Sullivan et al., 2006; Weber et al.,2007]. However, radiocarbon analysis on WSOC collectedon the ground in Atlanta, Georgia, and on filter-based OCsamples in Nashville, Tennessee, and Tampa, Florida, indi-cated that�50–90% of the measured particulate carbon was
modern, i.e., originating from biogenic VOCs or frombiomass burning [Lewis et al., 2004; Lewis and Stiles,2006;Weber et al., 2007] rather than from fossil fuel sources.Schichtel et al. [2008] reported that modern carbon inArizona and Washington comprised �50% and �80% oftotal carbon in the urban and near-urban areas, respectively.Radiocarbon analysis on summertime filter-based OC mea-surements at Aldine, Texas (a suburban site located �27 kmnorth of Houston), indicated that the fraction of moderncarbon to total carbon varied between 25 and 68% whereasthis fraction was 41–72% at Conroe, Texas (a forested sitelocated �65 km north of Houston) [Lemire et al., 2002].[5] In this study, we report on measurements of OA
with a compact time-of-flight aerosol mass spectrometer[Drewnick et al., 2005; DeCarlo et al., 2006] and ofprimary and secondary VOCs by a proton transfer reactionmass spectrometer (PTR-MS) and by collection of airsamples with a whole air sampler (WAS) and subsequentvaried spectrometric analyses [Schauffler et al., 2003; deGouw and Warneke, 2007]. The measurements and sampleswere acquired aboard the NOAAWP-3D aircraft during theTexas Air Quality Study–2006 (TexAQS-2006). We com-pare the observed OA growth in urban and industrialplumes during TexAQS-2006 to that observed in previousstudies. Using aerosol yields from recent laboratory studies,we interpret these measurements with the aid of a model ofSOA formation. Improved agreement between predicted
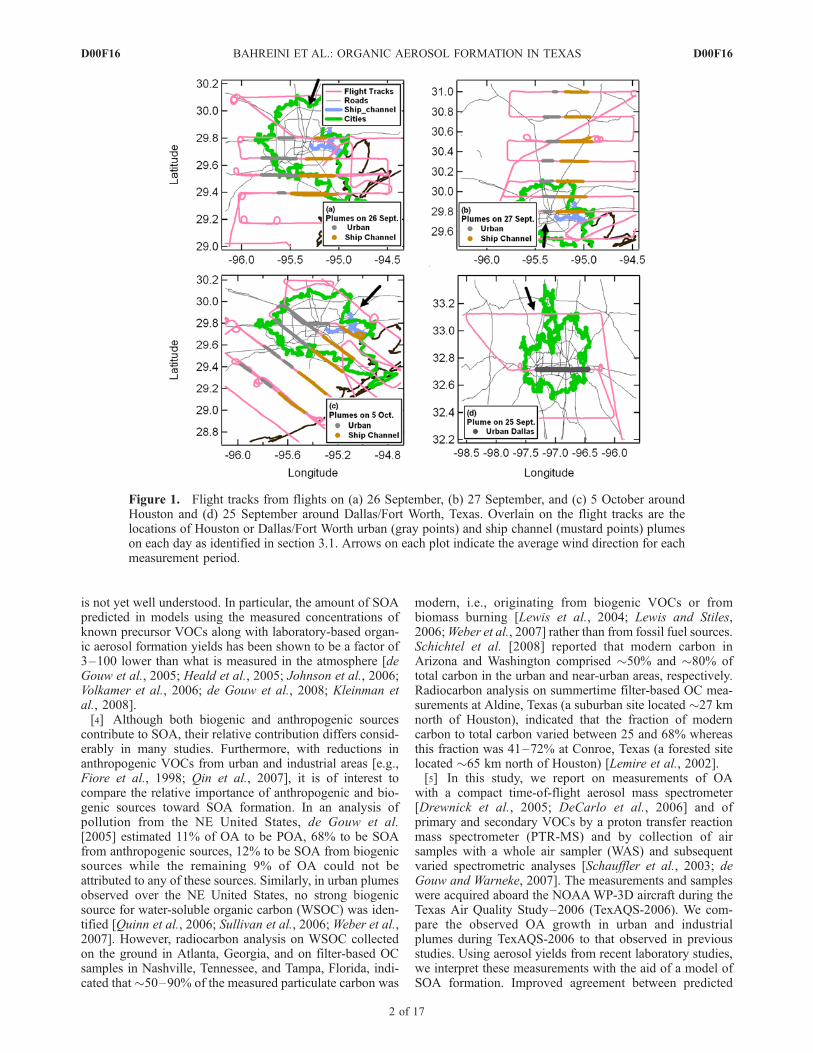
Figure 1. Flight tracks from flights on (a) 26 September, (b) 27 September, and (c) 5 October aroundHouston and (d) 25 September around Dallas/Fort Worth, Texas. Overlain on the flight tracks are thelocations of Houston or Dallas/Fort Worth urban (gray points) and ship channel (mustard points) plumeson each day as identified in section 3.1. Arrows on each plot indicate the average wind direction for eachmeasurement period.
D00F16 BAHREINI ET AL.: ORGANIC AEROSOL FORMATION IN TEXAS
2 of 17
D00F16

and observed OA growth relative to many previous com-parisons shows the effect of these recently updated yields onpredicted SOA formation. In addition, we use the Lagrang-ian particle dispersion model FLEXPART [Stohl et al.,2005] along with a biogenic emission inventory (EPABEIS3.12–3.13) and fixed SOA formation yields to esti-mate the amount of biogenic SOA formed from the pre-dicted isoprene and monoterpenes in the sampled plumes.
2. Measurements
[6] An overview of the project, which included fiveinstrumented aircraft, an instrumented ship, and groundsupersites, is given elsewhere [e.g., Parrish et al., 2009].The NOAA WP-3D aircraft was based at Ellington Field,Houston, Texas, and performed 16 flights during 11 Sep-tember to 12 October 2006. One of the main goals of theTexAQS-2006 study was to characterize urban and indus-trial emissions of various pollutants in the Dallas/FortWorth, Texas, and Houston areas and to improve under-standing of the transport and transformation of these pollu-tants. Therefore, most flight tracks of the WP-3D aircraftwere designed to first sample background air upwind of thesources, and then sample the plumes immediately above anddownwind of the Dallas/Fort Worth or Houston urbancenters, industrial centers along the Houston ship channel,and Houston area power plants. Since the Houston shipchannel, a heavily industrialized area along the shippingcanal that extends from downtown Houston to GalvestonBay, is located mostly due east of the Houston urban center,we have selected data from 3 days when meteorologyallowed for better separation of Houston’s fresh urban andindustrial plumes (Figures 1a–1c). For comparison with theHouston urban plume, we also present data from a flightover and downwind of Dallas/Fort Worth (Figure 1d). TheDallas/Fort Worth region is of comparable population andsize to Houston, but does not have the intensive heavyindustries associated with the Houston ship channel. Amongthe two WP-3D flights downwind of Dallas/Fort Worth, we
present data from 25 September 2009 when chemicalprocessing characteristics of the Dallas urban plume weresimilar to those in the Houston urban plume on 26 Septem-ber. Although local biomass burning plumes were occasion-ally encountered during TexAQS [Schwarz et al., 2008], onthe basis of the observed mixing ratios of acetonitrile, a gas-phase species strongly associated with biomass combustion,the contribution of biomass burning to OA in the plumesdiscussed here is considered to be minimal.[7] Aerosol composition aboard the aircraft was mea-
sured using a compact time-of-flight aerosol mass spec-trometer (C-ToF-AMS, hereinafter ‘‘AMS,’’ Aerodyne,Billerica, Massachusetts) through a low-turbulence inlet(LTI) [Wilson et al., 2004], downstream of a 1 mm impactor[Brock et al., 2008] and a pressure controlled inlet (PCI)[Bahreini et al., 2008]. Details of the design and operationof the AMS are presented elsewhere [Drewnick et al., 2005;DeCarlo et al., 2006]. In short, aerosol particles are sampledthrough a critical orifice and a system of aerodynamiclenses where they are focused into a narrow beam. Non-refractory (NR) components of the particles are vaporizedunder high vacuum upon impaction on a tungsten invertedcone at �550–600�C and ionized by electron impact. Ionsare extracted into the detector region and analyzed using acompact time-of-flight mass spectrometer (Tofwerk, Thun,Switzerland). Mass-weighted size distributions are obtainedby chopping the particle beam and measuring the timeparticles take to cross the vacuum chamber before detectionin order to determine their vacuum aerodynamic diameter(dva) [DeCarlo et al., 2004]. Aerosol and gas-phase massspectra are obtained by the difference between spectraacquired with a totally open and a totally blocked particlebeam. Species concentrations at conditions of standardtemperature and pressure (1 atm and 273 K, in mg sm�3)are calculated from the mass spectra on the basis of the‘‘fragmentation table’’ approach of Allan et al. [2004].During TexAQS-2006 mass distributions and mass spectrawere recorded every 10 or 15 s with a detection limit of0.15 mg sm�3 for OA with a 10-s averaging time.[8] The AMS collection efficiency (CE) was derived
from the measured inorganic mass fraction and the samplerelative humidity, using laboratory and other field CEs as aguide [Quinn et al., 2006; Matthew et al., 2008]. At timeswhen small acidic sulfate particles were present, typicallydownwind of strong SO2 sources, a size-dependent CE wasapplied. Aerosol size distribution measurements [Brock etal., 2008], which were also made downstream of the 1 mmimpactor, were used in combination with the AMS OA massfraction and mass weighted density to estimate the amountof submicron OA mass (i.e., fine OA mass). Comparisonsof AMS OA mass with the estimated fine OA mass showlinear least squared correlation coefficients (r2) of 0.71–0.94 (Figure 2). The flight-to-flight variation in the slopes ofthis comparison shows repeatability for AMS OA measure-ments to be better than ±25%. The overall uncertainty in theOA mass is estimated to be 38% (see auxiliary material for acomprehensive error analysis) and is consistent with otherrecent AMS aircraft studies [DeCarlo et al., 2008; Dunleaet al., 2008].1 As described by Bahreini et al. [2008], using
Figure 2. Comparison of AMS OA with OA estimatedfrom fine volume measurements for the flights discussedhere.
1Auxiliary materials are available in the HTML. doi:10.1029/2008JD011493.
D00F16 BAHREINI ET AL.: ORGANIC AEROSOL FORMATION IN TEXAS
3 of 17
D00F16

the PCI upstream of the AMS allowed for constant inletpressure and flow rate into the instrument, fixed sizecalibration, and constant transmission (close to 100% inthe size range of dva � 100–700 nm, equivalent to physicaldiameters of �70–500 nm for particles with effectivedensity of 1.4 g cm�3), up to about 6.5 km in altitude.Transmission efficiencies for particles larger than dva =700 nm have not been fully characterized for this lens system;however, recent experiments in our laboratory on a similarlens system indicate that the transmission of larger particlesdecreases and approaches 50% for particles at dva � 900 nm(equivalent physical diameter of 640 nm assuming an effec-tive density of 1.4 g cm�3). The closure between the AMSmass and fine mass to within the combined uncertaintieshowever indicates that the effect of possible reduced trans-mission efficiencies for larger particles have been small inthis data set.[9] Measurements of gas-phase VOCs were made using
a proton transfer reaction mass spectrometer (PTR-MS)[de Gouw and Warneke, 2007]. The PTR-MS scannedthrough a series of masses, with a cycle time of 16 s. Inthis study, we use the measurements of anthropogenicVOCs such as benzene, toluene, C8 and C9 aromatics andbiogenic VOCs such as isoprene, the sum of its majoroxidation products methyl vinyl ketone (MVK) and meth-acrolein (MACR), and the sum of monoterpenes. Someof the anthropogenic species, including anthropogenic iso-prene, emitted from the petrochemical and rubber indus-tries in the ship channel may also give rise to a PTR-MSsignal at mass 69, which is usually attributed to biogenicisoprene; however, the contribution of these anthropogenicspecies to the total signal at mass 69 is estimated to benegligible in most ship channel air masses (C. Warneke etal., Biogenic emission measurements and inventories:Determination of biogenic emission in the Eastern UnitedStates and Texas and comparison with biogenic emissioninventories, submitted to Journal of Geophysical Research,2008). We also make use of the speciated VOC data fromthe whole air sampler, that collected air canisters in theplumes for offline GC-MS analysis [Schauffler et al.,2003].[10] Mixing ratios of CO (5% uncertainty) and SO2 (10%
uncertainty) were measured by vacuum UV resonancefluorescence and pulsed UV fluorescence, respectively, at1 Hz [Ryerson et al., 1998; Holloway et al., 2000]. Mixingratios of nitrogen oxides were measured at 1 Hz by ozoneinduced chemiluminescence for NO (5% uncertainty), byUV photolysis followed by NO chemiluminescence for NO2
(9% uncertainty), and by catalytic reduction and subsequentNO chemiluminescence for NOy (12% uncertainty) [Ryersonet al., 1999, 2000]. Formaldehyde mixing ratios (13%uncertainty) were measured at 1 Hz using a tunable differ-ence frequency generation gas absorption laser spectrometer(DFGAS) [Weibring et al., 2007]. Data from an actinic fluxspectroradiometer aboard the aircraft are used to calculatephotolysis rates of various species as described by Stark etal. [2007]. In the current analysis, we use photolysis rates ofO3 (30% uncertainty for the channel to form O1(D)),formaldehyde (15% uncertainty), and acetaldehyde (15%uncertainty) for OH calculations. For the analysis presentedhere, the above measurements were interpolated or averagedonto the AMS time base.
[11] In order to characterize the measurements in theHouston plumes analyzed for the current work, cumulativehistograms of OA (Figure S7), SO4
2� (Figure S8), NO3�
(Figure S9), NH4+ (Figure S10), CO (Figure S11), benzene
(Figure S12), SO2 (Figure S13), NO (Figure S14),NO2 (Figure S15), ambient relative humidity (Figure S16),ambient temperature (Figure S17), and calculated OH values(Figure S18) are provided in the auxiliary material.
3. Methodology for the Analysis
3.1. Plume Identification
[12] As described before, many aircraft flight patternsduring TexAQS-2006 were designed to sample plumesdownwind of downtown Dallas/Fort Worth or Houston,petrochemical and other heavy industries along the Hous-ton ship channel, and in the power plants around Houston(Figures 1a–1d). In order to identify the sources of theplumes, mixing ratios of several primary gas phase specieswere considered. Many urban areas in the United States arecharacterized by [benzene]/[CO] � 0.60–1.10 pptv ppbv�1
[Warneke et al., 2007] due to automotive emissions, where-as this ratio can be much higher in some industrial plumes.For the analysis here, plumes with high SO2 (>2–5 ppbv,depending on the day) or with [benzene]/[CO] > 2 pptvppbv�1 were classified as ‘‘ship channel’’ plumes becauseof large sources of these compounds within the industrialarea. In order to distinguish ship channel plumes from SO2-rich plumes from power plants, the geographic locationwhere the plumes were crossed relative to the power plantsor the ship channel was also considered. Plumes with apredominant influence from the Houston urban center wereclassified by their higher-than-background CO (>120–180 ppbv, depending on the day), low benzene (<200–350 pptv, depending on the day), and low SO2 (<2–5 ppbv,depending on the day) and are thus distinguished fromplumes with ship channel and power plant influence. Theurban plume downwind of Dallas/Fort Worth was identifiedby [benzene]/[CO] < 1 pptv ppbv�1 and CO > 120 ppbv.Moreover, in all the classifications, wind direction wasconsidered in order to make sure plume assignments areconsistent with the geographic distribution of the urban andindustrial sources.[13] Once different plumes were identified, background
values of OA and CO for each plume in each transect weredetermined from measurements outside the plumes (valuesare given in Table S1 in Text S1 of the auxiliary material)and subtracted from the measured concentrations and mix-ing ratios. The enhancements in OA and CO above thesebackground values are DOA and DCO, respectively. On26 September and 5 October, when winds were from anortherly direction, OA and CO levels on the east side ofthe ship channel and west side of the urban plumes weresimilar in magnitude; therefore enhancements were basedupon mean, background values calculated from �1 min ofdata each on the east side of the ship channel and the west sideof the urban plumes. However, on 27 September, FLEX-PART back trajectories indicate recirculation of the previousday’s plumes over the western part of Houston. On this day,OA is �0.8–3 mg sm�3 higher and CO is �17–30 ppbvhigher west of the urban plume compared with east of theship channel, with the greatest longitudinal gradient being
D00F16 BAHREINI ET AL.: ORGANIC AEROSOL FORMATION IN TEXAS
4 of 17
D00F16

observed on the second and third transects of the urbanplume, �40 km downwind of the city center. Backgroundlevels on this day are estimated on the basis of the valuesmeasured on the east side of the ship channel. This back-ground gradient introduces the possibility of some bias in thecalculated DOA and DCO, especially in the urban plumewhere background levels may be higher than for the shipchannel plume on this day; we therefore provide an upperestimate of the bias in Figure S19 of the auxiliary material bycalculating urban DOA and DCO values on the basis ofbackg round l eve l s on the wes t o f t he u rbanplume. Background levels for the Dallas/Fort Worth flight(25 September) were determined from OA and CO measure-ments averaged for �1 min each on the east and west of theurban plume downwind of the city. These determinations ofDOA/DCO agree with OA to CO correlation slopesobtained from the linear orthogonal distance regression fits(see auxiliary material and Figures S20 and S21 therein).
3.2. Semiempirical Relations to CharacterizeOA Growth
[14] To compare OA production in plumes downwind ofurban and industrial centers of Houston with those measure-ments made in the NE United States, we use the semiem-pirical relations of DOA/DCO that de Gouw et al. [2008]developed on the basis of observations in NE U.S. urbanplumes. However, determining plume age requires addition-al consideration here. Since the emission ratios of toluene tobenzene from the petrochemical industries in the shipchannel are not the same for all sources and may vary intime, one cannot calculate the photochemical age on thebasis of the ratio of toluene to benzene and their relativereactivity with respect to OH oxidation as defined by deGouw et al. [2008]. Therefore, we calculate plume age fromtransport time rather than photochemical age. This transportage is determined from the perpendicular distance betweenthe transect where the plumes were sampled and the centerof Dallas/Fort Worth (at 32.760�N, 96.971�W), center ofdowntown Houston (at 29.759�N, 95.363�W), or center ofthe Houston ship channel (at 29.776�N, 95.102�W) and theaveraged perpendicular component of the wind speed in thetransect as measured aboard the aircraft. The wind speedmeasured on the aircraft during Houston flights is within20% of the measurements by the wind profiler at La Porte,Texas, for the altitudes close to where the plumes weresampled. Uncertainty in the calculated transport age isestimated using 15 or 20 km uncertainty in the distancedue to the dispersed nature of the sources for the shipchannel and the urban areas, respectively, ±1 m/s uncer-tainty in the wind measurement, and the variability in theaveraged wind speed in a transect. Note that although theabsolute uncertainty in the calculated transport age is large,the uncertainty in our knowledge about the relative age isnot; therefore, we believe it is valuable to explore theevolution of OA formation in different plumes on differentdays with respect to the transport age. Note that because ofthe different mixture and amounts of NOx and VOCs in theship channel compared to urban plumes, photochemicalaging in the ship channel may be faster because of higherOH concentrations in the industrial plumes than in the urbanplumes (Figure S18 in auxiliary material). Thus, transport
age may represent different photochemical ages for plumeswith different VOC and NOx levels.
3.3. Box Model for Predicting OA Growth
[15] To calculate the formation of SOA downwind ofurban and industrial plumes around Houston, we use achemical box model in which several VOCs are allowedto oxidize and subsequently form SOA on the basis of thepartitioning theory described by Odum et al. [1996]. Thisapproach assumes that semivolatile species partition toparticles by absorption (dissolution) into a liquid organicphase, and makes use of laboratory based SOA formationyields (Y) that can be expressed as
Y ¼ M0
X2i¼1
aiKom;i
1þM0Kom;i
� �ð1Þ
where M0 represents the preexisting organic aerosol massonto which newly formed SOA material can be absorbed(‘‘absorbing mass’’), and ai and Kom,i are parameters for thistwo-product (i = 1, 2) model fitted to the yield observations(Y = DOA/DVOC) for a specific VOC precursor [Odum etal., 1996]. The amount of absorbing mass has a crucial effecton the predicted SOA mass [e.g., Ervens and Kreidenweis,2007]. In previous modeling studies the absorbing mass hasbeen estimated as the sum of the primary organic aerosol(POA) mass, treated as the background, and the newlyformed SOA mass [Chung and Seinfeld, 2002] althoughrecent results suggest that hydrophobic POA may notprovide a suitable partitioning medium for SOA [Song etal., 2007]. Estimates of the fresh versus oxidized fraction ofOA in the Texas plumes, determined from the organic massspectral analysis of AMS data, indicate that less than 20% ofOA is fresh and hydrocarbon-like (HOA) and more than80% of OA is oxygenated OA (OOA) (see Zhang et al.[2005] for details on HOA and OOA analysis technique).This low fraction of HOA in the plumes is expected since theearliest transects occurred in the late morning, long after thenighttime boundary layer had dissipated, and thus primarycombustion OA that is rich in HOA was mixed and dilutedin the daytime boundary layer. In our base case simulations,we assume that the absorbing mass is equal to the sum ofthe background organic mass measured in each transect andthe amount of SOA predicted in the box model in theprevious transects. We explore the effect of partitioning onlyonto the OOA fraction of background organic aerosol in asensitivity case where the absorbing mass is assumed to bethe predicted SOA mass from the previous transects and80% of the background organic mass.[16] The box model is initialized with the measured
mixing ratios of VOCs, NOx, O3, and the absorbing massin the first transect of each plume, and it considers severalVOC oxidation pathways outlined below. Using a pseudo–steady state approximation, OH concentrations along theflight tracks are calculated offline, averaged for each plumetransect, and used in the model. This approximation con-siders OH formation through formaldehyde and ozonephotolysis and OH loss through the reaction with NO2
(see auxiliary material). The relative contribution from theformaldehyde photolysis channel to total OH concentrationon 26 September and 5 October is determined and param-
D00F16 BAHREINI ET AL.: ORGANIC AEROSOL FORMATION IN TEXAS
5 of 17
D00F16

eterized using the measured NO2, acetaldehyde, and O3
concentrations on these days. Unfortunately on 27 Septem-ber, formaldehyde measurements were not available. How-ever, since the measured ambient relative humidity (RH) on27 September was within 15% of the average ambient RHon 27 September and 5 October, we use the averageparameterization values as described above, along withOH concentration estimates from the O3 photolysis channelon 27 September in order to estimate total OH concentra-tions on 27 September. Calculated OH concentrations for thedays discussed here generally range from �2 � 106 to�2.5 � 107 cm�3, depending on the plume and the day.These values are consistent with previous measurements andsimulations for the TexAQS-2000 study at La Porte, Texas[Mao et al., 2009; G. Frost, personal communication, 2008].[17] By using the current literature parameters for
equation (1) and the absorbing mass, certain amounts ofsemivolatile VOCs (SVOCs) from each precursor are pre-dicted to form in each time interval between transects; theseSVOCs are allowed to partition to the particle phase andform SOA. In each subsequent transect, the model isreinitialized using the mean of the calculated OH and themeasured VOCs, NOx, O3, and the absorbing mass. Con-strained by observations in this manner, the cumulative SOAmass produced throughout the plume history is calculated.[18] We note that nontraditional anthropogenic SOA
precursors, such as unmeasured VOCs with intermediatevolatility or those involved in heterogeneous reactions, mayalso contribute to SOA formation [Robinson et al., 2007;Volkamer et al., 2007; Shrivastava et al., 2008]; however,they are not considered in the current box model. Also,considering that the box model incorporates only the two-product parameterization rather than a full, chemical oxida-tion scheme, we are not able to carry through SVOCs fromone transect to another, nor do we repartition SVOCsbecause of changes in the absorbing mass or gas phasepartial pressure differences after dilution in the later trans-ects. This means that VOC oxidation products are irrevers-ibly partitioned to the particle phase in each transect. Inaddition, although SOA formation in aqueous phase and inclouds has previously been reported [Sorooshian et al.,2006; Carlton et al., 2007; Sorooshian et al., 2007; Ervenset al., 2008; Hennigan et al., 2008; Volkamer et al., 2009],the box model described here includes only gas phaseoxidation of VOCs. On the days we examine, skies wereclear to partly cloudy and ambient RH was mostly below70%. Lack of an appreciable change in the measured SO2
flux downwind of Parish power plant on the days discussedhere indicate that cloud processing oxidation pathways havelikely played at most a minor role [Neuman et al., 2009].3.3.1. Contribution From Anthropogenic VOCs[19] Among the known anthropogenic SOA precursors,
long-chain alkanes (i.e., C11 and higher) and aromaticshave high measured SOA yields in the laboratory [Seinfeldand Pandis, 1998; Lim and Ziemann, 2005; Ng et al.,2007b]. On the basis of WAS sample measurements of C4to C8 alkanes, mixing ratios of alkanes decrease withincrease in carbon number such that the sum of C7 andC8 alkanes is about a factor of two lower than their aromaticcounterparts, toluene and C8 aromatics. If this trend con-tinues for higher alkanes, we expect low concentrations oflong-chain alkanes and minimal contribution to total SOA
formation. With this in mind, because of lack of measure-ments of long-chain alkanes, we have only considered OHradical oxidation of benzene, toluene, and C8 and C9aromatics, measured by the PTR-MS, as the formationprocess of anthropogenic SOA mass. Furthermore, sincedetailed yield information of only benzene, toluene, andxylene are available from laboratory experiments, we esti-mate the contribution of C8 and C9 aromatics to SOAformation as follows. Since WAS measurements indicatedthat xylene mixing ratios were higher than ethyl benzene byat least a factor of 2.5 [Schauffler et al., 2003], we allow thesum of the C8 aromatics to be oxidized in the box model asxylene. However, with this assumption the amount of SOAfrom C8 aromatics is an upper limit. Speciated analysis ofC9 aromatics by WAS samples indicate that the sum of thepropyl benzene and ethyl toluene is on average a factor of4–10 more abundant than trimethyl benzene. Since resultsfrom laboratory chamber studies indicate that SOA yields ofpropyl benzene and ethyl toluene are similar to that oftoluene [Odum et al., 1997], C9 aromatics are allowed tooxidize and form SOAwith a yield equal to that of toluene.3.3.2. Contribution From Biogenic VOCs[20] Biogenic SOA was calculated using the measured
mixing ratios of isoprene, MVK and MACR, and mono-terpenes as proxies for biogenic SOA precursors. In the boxmodel, we use Yisoprene along with the measured isopreneconcentrations to estimate the amount of SOA formed fromisoprene in each time step (m(SOA)isoprene). In order to takeinto account isoprene oxidation that has taken place fromthe point of emission to sampling in the first transect (t = t1),an additional isoprene ‘‘initial source,’’ defined as 2�(MACR + MVK)t=t1, is calculated, considering that MACRand MVK are first generation oxidation products of iso-prene with a combined yield of 50% [Carter and Atkinson,1996]. Note that because MACR and MVK react with OHon the order of few hours themselves, it is possible that thiscalculation does not capture the full extent of isopreneoxidation. This additional ‘‘initial source’’ of isoprene isallowed to react away in the model throughout all timesteps, i.e., without being reinitialized in each transect, andsubsequently form SOA (m(SOA)MACR+MVK):
m SOAð ÞMACRþMVK ¼ 2 � MACRþMVK½ t¼t1� Yisoprene ð2Þ
The total amount of SOA formed from isoprene can then beestimated as
m SOAð Þisoprene;total ¼ m SOAð ÞMACRþMVK þ m SOAð Þisoprene ð3Þ
[21] To account for the contribution of different mono-terpenes to SOA formation, on the basis of previousestimates of terpene emissions from different types ofvegetation in the southeastern United States [Geron et al.,2000], 2/3 of the measured monoterpenes were assumed tobe a-pinene and 1/3 b-pinene. We used the two-productparameterizations for a- and b-pinene oxidation by OH andO3 by Griffin et al. [1999] since both oxidation pathwayscan be important for SOA formation. Although oxidation ofterpenes by the NO3 radical can also be important [e.g.,Griffin et al., 1999], this oxidation scheme was not consid-ered in our box model since only data from daytime flights
D00F16 BAHREINI ET AL.: ORGANIC AEROSOL FORMATION IN TEXAS
6 of 17
D00F16

are presented. Given that monoterpene oxidation productswere not measured, we cannot account for terpene oxidationthat has taken place from the point of emission to samplingin the first transect (t = t1) as we did for isoprene oxidationproducts; therefore, total contribution of monoterpenes toSOA formation may be underestimated in the box model.[22] Sesquiterpenes were not measured in the present
study. Furthermore, estimates for their emission ratios arehighly uncertain and variable (�20–50% of monoterpenes)[Ortega et al., 2007; Sakulyanontvittaya et al., 2008].Although recent laboratory studies have shown that selectedsesquiterpenes (e.g., longifolene and aromadendrene) canform SOA with maximum yields that exceed those ofmonoterpenes by a factor of 2–4 (under comparable NOx
conditions) [Ng et al., 2007a], we cannot estimate theircontribution to total SOA because neither their concentra-tions nor mass- and NOx-dependent yield parameters areavailable. However, in a sensitivity case discussed insection 5, we explore the possibility of SOA formationfrom sesquiterpene photooxidation, assuming sesquiterpenemixing ratios are 30% of the monoterpenes and have aconstant SOA yield of 80%.3.3.3. NOx-Dependent SOA Yields[23] Recent laboratory chamber studies have reported that
SOA formation yields for various precursors are NOx-dependent, which indicates a shift in the loss pathway oforgano-peroxy radicals (RO2) in the different NOx regimes;under ‘‘high-NOx’’ conditions RO2 radicals tend to reactpreferentially with NO, forming alkoxy radicals and subse-quently carbonyl compounds, whereas under ‘‘low-NOx’’conditions the reaction proceeds with HO2, yielding organichydroperoxides ROOH [Kroll et al., 2005; Presto et al.,2005; Kroll et al., 2006; Ng et al., 2007a, 2007b]. This shiftin the chemistry affects volatility distribution of the oxida-tion products and thus the aerosol formation yields.[24] In order to account for the NOx dependence of SOA
formation from aromatic VOCs and isoprene, we followedthe same approach as used by Henze et al. [2008]. In thisapproach, the branching ratio of the loss reactions of RO2
radicals due to the reaction with NO or HO2 are calculatedusing the observed NO mixing ratios, which ranged from�0.1–4 ppbv for the plume transects studied here, and anaverage HO2 mixing ratio of 25 pptv (W. Brune, personalcommunication, 2008):
RO2 þ NO ! ROþ NO2
k1stN;aromatics s�1� �
¼ 8:5 � 10�12 NO½ and
k1stN;isoprene s�1� �
¼ 2:1 � 10�12 NO½ ð4aÞ
RO2 þ HO2 ! ROOH þ O2
k1stH;aromatics s�1� �
¼ 1:5 � 10�11 HO2½ and
k1stH;isoprene s�1� �
¼ 7:45 � 10�13 HO2½ ð4bÞ
Using the branching ratio, the total yield for each VOCcompound (aromatics or isoprene) is calculated by
YVOC ¼ k1stN
k1stH þ k1stN
YhighNOx þ k1stH
k1stH þ k1stN
YlowNOx ð5Þ
along with the values for the mass-dependent YhighNOx andYlowNOx (equation (1)) by Ng et al. [2007b], Kroll et al.[2005, 2006], and Henze and Seinfeld [2006].[25] The average HO2 concentration of 25 pptv assumed
in our calculations is an average value from daytimemeasurements in Houston in 2006 at the Moody Tower(about 80 m above ground) on the campus of University ofHouston (W. Brune, personal communication, 2008); thisvalue is also in the range of other measurements andsimulations at La Porte, Texas, in 2000 [Mao et al., 2009;G. Frost, personal communication, 2008]. However, previ-ous measurements (and simulations) have indicated thatalthough HO2 levels are insensitive to NO mixing ratiosfor NO < 1 ppbv, the average value of HO2 decreases by afactor of 3 when NO levels increase from 1 ppbv to 4 ppbv(the maximum value observed in Houston plumes discussedhere). Although in the majority of the plumes, NO levels are<1 ppbv, we explore the effect of variable HO2 mixing ratioin the NO-rich plumes in a case study further discussed insection 5.[26] The yield parameters used to account for SOA
formation from monoterpenes were determined at moderateNOx/monoterpene ratios (about 1–4) [Griffin et al., 1999]and do not take into account the NOx dependence asobserved for a-pinene by Ng et al. [2007a]. However, todate there is no ai, Ki data set available for either compoundthat reflects the NOx dependence. It has been shown that fora-pinene photooxidation, SOA yield can be a factor of3 higher at low-NOx conditions (NOx/VOC < 1 ppbvppbv�1) than at high-NOx conditions [Ng et al., 2007a].With the observed range of NOx/monoterpenes >20 ppbvppbv�1 in Houston, overall yields estimated from Griffin etal. [1999] are therefore upper limits; however, the error fortotal predicted SOA mass is small because of the smallobserved mixing ratios of monoterpenes as compared to theother precursors.
4. Observations and Discussion
4.1. Houston Urban and Industrial Plumes on26 September and Dallas/Fort Worth Urban Plumeon 25 September
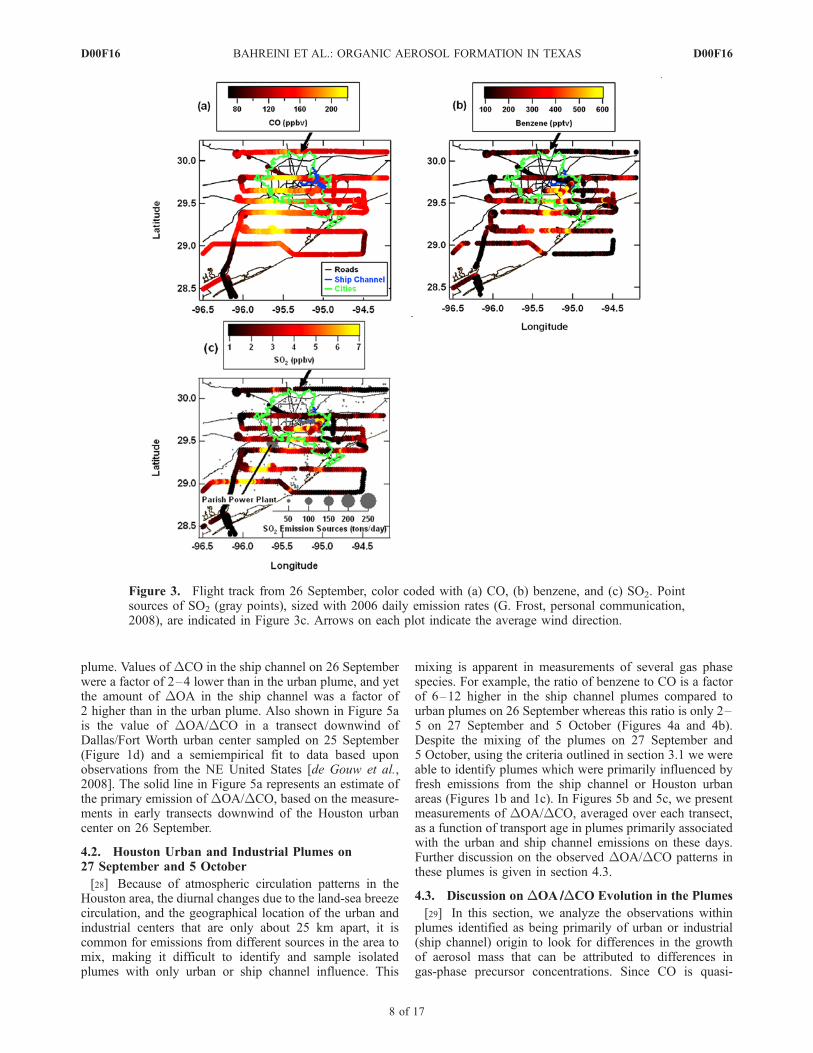
[27] On 26 September, with northeasterly winds (at 3.6 ±1.1 m s�1), the WP-3D flew south–southwest of Houston(Figures 1a and 3a–3c), with 4–5 transects of downtownHouston and ship channel plumes within the well-mixedplanetary boundary layer from 1230–1730 local time (LT)at an altitude of 300–450 m above sea level (Figure 4a).Nonrefractory composition of aerosols on this day, as on allothers, was dominated by OA, with ammonium sulfate thesecond most prevalent compound (Figures S7–S10 inauxiliary material). Ship channel plumes were characterizedby high benzene or SO2 mixing ratios and urban plumes byenhanced CO (Figures 3a–3c and 4a). Enhanced SO2
mixing ratios were also measured downwind of the Parishpower plant, at 1425–1455 LT (Figures 3c and 4a). InFigure 5a, we present measurements of DOA/DCO versustransport age in the Houston urban and ship channel plumeson 26 September, averaged in each plume transect, witherror bars representing standard deviations of the means.Higher values of DOA/DCO, by up to a factor of 7, wereobserved in the ship channel plume compared to the urban
D00F16 BAHREINI ET AL.: ORGANIC AEROSOL FORMATION IN TEXAS
7 of 17
D00F16
plume. Values of DCO in the ship channel on 26 Septemberwere a factor of 2–4 lower than in the urban plume, and yetthe amount of DOA in the ship channel was a factor of2 higher than in the urban plume. Also shown in Figure 5ais the value of DOA/DCO in a transect downwind ofDallas/Fort Worth urban center sampled on 25 September(Figure 1d) and a semiempirical fit to data based uponobservations from the NE United States [de Gouw et al.,2008]. The solid line in Figure 5a represents an estimate ofthe primary emission of DOA/DCO, based on the measure-ments in early transects downwind of the Houston urbancenter on 26 September.
4.2. Houston Urban and Industrial Plumes on27 September and 5 October
[28] Because of atmospheric circulation patterns in theHouston area, the diurnal changes due to the land-sea breezecirculation, and the geographical location of the urban andindustrial centers that are only about 25 km apart, it iscommon for emissions from different sources in the area tomix, making it difficult to identify and sample isolatedplumes with only urban or ship channel influence. This
mixing is apparent in measurements of several gas phasespecies. For example, the ratio of benzene to CO is a factorof 6–12 higher in the ship channel plumes compared tourban plumes on 26 September whereas this ratio is only 2–5 on 27 September and 5 October (Figures 4a and 4b).Despite the mixing of the plumes on 27 September and5 October, using the criteria outlined in section 3.1 we wereable to identify plumes which were primarily influenced byfresh emissions from the ship channel or Houston urbanareas (Figures 1b and 1c). In Figures 5b and 5c, we presentmeasurements of DOA/DCO, averaged over each transect,as a function of transport age in plumes primarily associatedwith the urban and ship channel emissions on these days.Further discussion on the observed DOA/DCO patterns inthese plumes is given in section 4.3.
4.3. Discussion on DOA //DCO Evolution in the Plumes
[29] In this section, we analyze the observations withinplumes identified as being primarily of urban or industrial(ship channel) origin to look for differences in the growthof aerosol mass that can be attributed to differences ingas-phase precursor concentrations. Since CO is quasi-
Figure 3. Flight track from 26 September, color coded with (a) CO, (b) benzene, and (c) SO2. Pointsources of SO2 (gray points), sized with 2006 daily emission rates (G. Frost, personal communication,2008), are indicated in Figure 3c. Arrows on each plot indicate the average wind direction.
D00F16 BAHREINI ET AL.: ORGANIC AEROSOL FORMATION IN TEXAS
8 of 17
D00F16

conserved over the time scales of our observations, andsince it is emitted primarily by the transportation sector, weuse it as a tracer to account for dilution of the emittedplumes with the surrounding air.[30] The value of DOA/DCO measured in the first
transect downwind of the Houston urban center on26 September was similar in magnitude to that in the firsttransect measured downwind of Dallas/Fort Worth on theprevious day, suggesting that these large urban areas hadsimilar precursor concentrations and chemical processes.Furthermore, for plume ages up to �5 h, the Houston plume
had DOA/DCO values that were generally within a factorof 2 of similar measurements made downwind of urbanplumes in NE United States [de Gouw et al., 2008]. Notethat because of the close proximity of the sampling region todowntown Houston and the ship channel, relatively fresherplumes were sampled in TexAQS compared to those sam-pled downwind of urban centers in the NE United States.Despite scatter in the data and large uncertainties in thederived values of DOA/DCO, it is evident that the increasein DOA/DCO with age was substantially greater in the
Figure 4. Time series of OA, benzene, CO, SO2, and aircraft altitude in plumes transected south ofHouston on (a) 26 September and (b) 5 October. Note that the peaks in SO2 on 26 September from1425 to 1455 LT and on 5 October from 1330 to 1355 LT indicate emission from the Parish powerplant, sampled south of Houston (as indicated in Figure 3c for 26 September). Highlighted areasindicate urban (in light blue) and ship channel plumes (light red) as identified in section 3.1.
D00F16 BAHREINI ET AL.: ORGANIC AEROSOL FORMATION IN TEXAS
9 of 17
D00F16

ship channel plumes than in those from the urban areas(Figure 5a).[31] While values of DOA/DCO observed in urban
plumes in Houston (26 September) and Dallas/Fort Worth(25 September) were within a factor of 2 of thosemeasured in the NE United States, the increases observedin the VOC-rich ship channel plume on 26 Septemberwere greater by a factor of �1.5–7 (Figure 5a). Note thatbecause of higher concentrations of OH in the ship
channel plumes (Figure S18 in auxiliary material), photo-chemical aging in these plumes is expected to be faster thanin the urban plumes. Among the urban VOCs measured inthe atmosphere, aromatics are among the compounds withthe highest measured SOA-forming potential [Seinfeld andPandis, 1998]. The sum of the measured aromatics relativeto CO as a function of plume age on 26 September is shownin Figure 6. Considering that the initial carbon mixing ratiosof aromatics in the urban plumes were approximately a
Figure 5. Evolution of DOA/DCO with transport age from (a) Dallas urban plume on 25 Septemberand Houston urban and ship channel plumes on 26 September, (b) Houston urban and ship channelplumes on 27 September, and (c) Houston urban and ship channel plumes 5 October. Error bars forDOA/DCO indicate standard deviation from the mean in each transect. Error bars in transport age indicate theuncertainty in the estimated age. The dashed line in Figure 5a represents calculations of DOA/DCObased on observations in NE United States [de Gouw et al., 2008]. The solid lines represents estimatedurban primary DOA/DCO based on observations in Texas.
D00F16 BAHREINI ET AL.: ORGANIC AEROSOL FORMATION IN TEXAS
10 of 17
D00F16
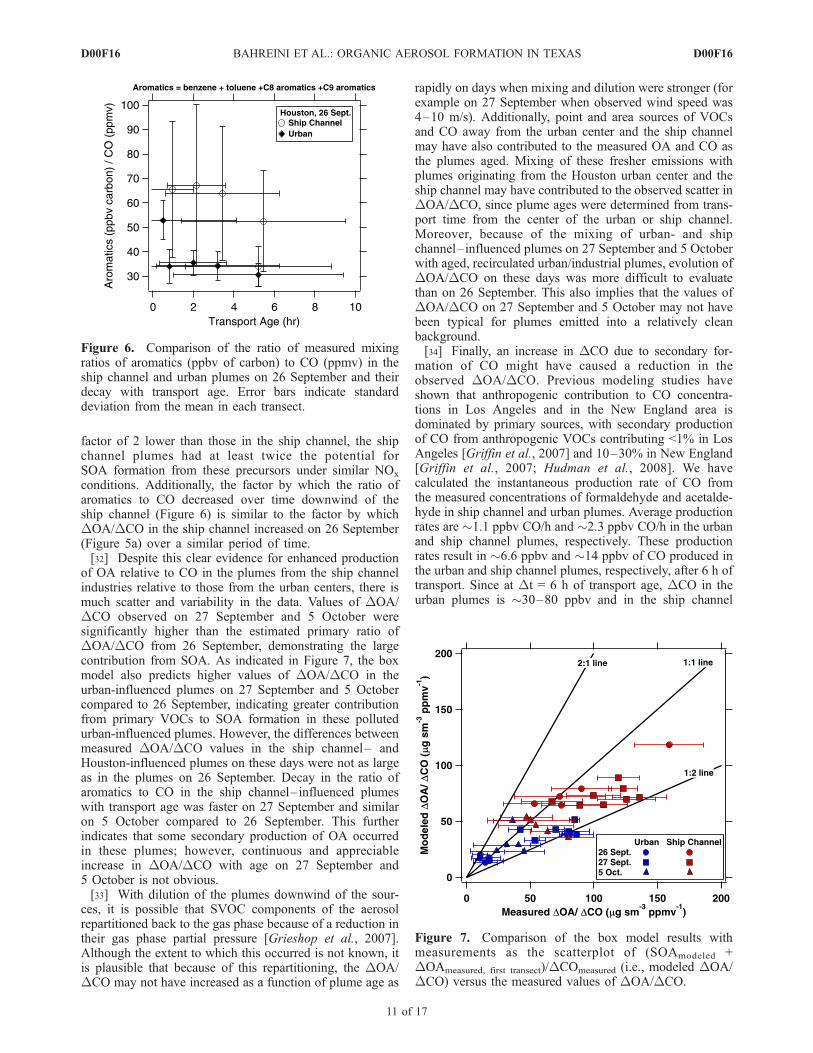
factor of 2 lower than those in the ship channel, the shipchannel plumes had at least twice the potential forSOA formation from these precursors under similar NOx
conditions. Additionally, the factor by which the ratio ofaromatics to CO decreased over time downwind of theship channel (Figure 6) is similar to the factor by whichDOA/DCO in the ship channel increased on 26 September(Figure 5a) over a similar period of time.[32] Despite this clear evidence for enhanced production
of OA relative to CO in the plumes from the ship channelindustries relative to those from the urban centers, there ismuch scatter and variability in the data. Values of DOA/DCO observed on 27 September and 5 October weresignificantly higher than the estimated primary ratio ofDOA/DCO from 26 September, demonstrating the largecontribution from SOA. As indicated in Figure 7, the boxmodel also predicts higher values of DOA/DCO in theurban-influenced plumes on 27 September and 5 Octobercompared to 26 September, indicating greater contributionfrom primary VOCs to SOA formation in these pollutedurban-influenced plumes. However, the differences betweenmeasured DOA/DCO values in the ship channel– andHouston-influenced plumes on these days were not as largeas in the plumes on 26 September. Decay in the ratio ofaromatics to CO in the ship channel–influenced plumeswith transport age was faster on 27 September and similaron 5 October compared to 26 September. This furtherindicates that some secondary production of OA occurredin these plumes; however, continuous and appreciableincrease in DOA/DCO with age on 27 September and5 October is not obvious.[33] With dilution of the plumes downwind of the sour-
ces, it is possible that SVOC components of the aerosolrepartitioned back to the gas phase because of a reduction intheir gas phase partial pressure [Grieshop et al., 2007].Although the extent to which this occurred is not known, itis plausible that because of this repartitioning, the DOA/DCO may not have increased as a function of plume age as
rapidly on days when mixing and dilution were stronger (forexample on 27 September when observed wind speed was4–10 m/s). Additionally, point and area sources of VOCsand CO away from the urban center and the ship channelmay have also contributed to the measured OA and CO asthe plumes aged. Mixing of these fresher emissions withplumes originating from the Houston urban center and theship channel may have contributed to the observed scatter inDOA/DCO, since plume ages were determined from trans-port time from the center of the urban or ship channel.Moreover, because of the mixing of urban- and shipchannel–influenced plumes on 27 September and 5 Octoberwith aged, recirculated urban/industrial plumes, evolution ofDOA/DCO on these days was more difficult to evaluatethan on 26 September. This also implies that the values ofDOA/DCO on 27 September and 5 October may not havebeen typical for plumes emitted into a relatively cleanbackground.[34] Finally, an increase in DCO due to secondary for-
mation of CO might have caused a reduction in theobserved DOA/DCO. Previous modeling studies haveshown that anthropogenic contribution to CO concentra-tions in Los Angeles and in the New England area isdominated by primary sources, with secondary productionof CO from anthropogenic VOCs contributing <1% in LosAngeles [Griffin et al., 2007] and 10–30% in New England[Griffin et al., 2007; Hudman et al., 2008]. We havecalculated the instantaneous production rate of CO fromthe measured concentrations of formaldehyde and acetalde-hyde in ship channel and urban plumes. Average productionrates are �1.1 ppbv CO/h and �2.3 ppbv CO/h in the urbanand ship channel plumes, respectively. These productionrates result in �6.6 ppbv and �14 ppbv of CO produced inthe urban and ship channel plumes, respectively, after 6 h oftransport. Since at Dt = 6 h of transport age, DCO in theurban plumes is �30–80 ppbv and in the ship channel
Figure 6. Comparison of the ratio of measured mixingratios of aromatics (ppbv of carbon) to CO (ppmv) in theship channel and urban plumes on 26 September and theirdecay with transport age. Error bars indicate standarddeviation from the mean in each transect.
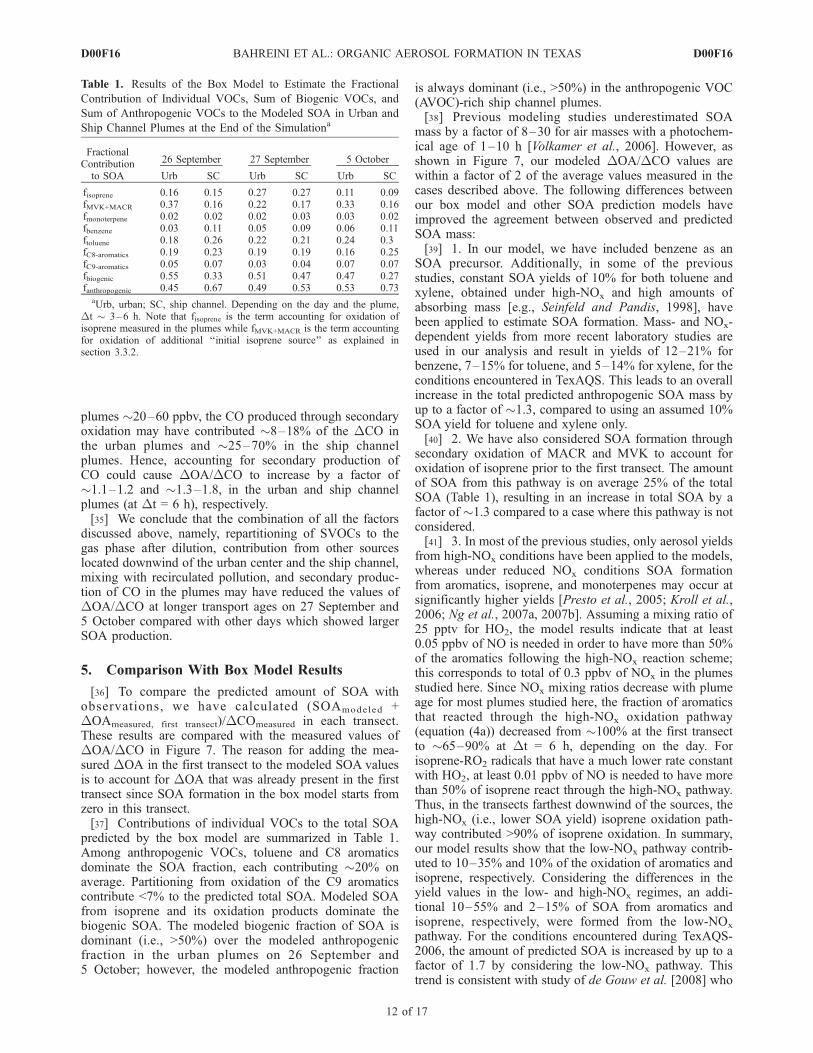
Figure 7. Comparison of the box model results withmeasurements as the scatterplot of (SOAmodeled +DOAmeasured, first transect)/DCOmeasured (i.e., modeled DOA/DCO) versus the measured values of DOA/DCO.
D00F16 BAHREINI ET AL.: ORGANIC AEROSOL FORMATION IN TEXAS
11 of 17
D00F16
plumes �20–60 ppbv, the CO produced through secondaryoxidation may have contributed �8–18% of the DCO inthe urban plumes and �25–70% in the ship channelplumes. Hence, accounting for secondary production ofCO could cause DOA/DCO to increase by a factor of�1.1–1.2 and �1.3–1.8, in the urban and ship channelplumes (at Dt = 6 h), respectively.[35] We conclude that the combination of all the factors
discussed above, namely, repartitioning of SVOCs to thegas phase after dilution, contribution from other sourceslocated downwind of the urban center and the ship channel,mixing with recirculated pollution, and secondary produc-tion of CO in the plumes may have reduced the values ofDOA/DCO at longer transport ages on 27 September and5 October compared with other days which showed largerSOA production.
5. Comparison With Box Model Results
[36] To compare the predicted amount of SOA withobservations, we have calculated (SOAmodeled +DOAmeasured, first transect)/DCOmeasured in each transect.These results are compared with the measured values ofDOA/DCO in Figure 7. The reason for adding the mea-sured DOA in the first transect to the modeled SOA valuesis to account for DOA that was already present in the firsttransect since SOA formation in the box model starts fromzero in this transect.[37] Contributions of individual VOCs to the total SOA
predicted by the box model are summarized in Table 1.Among anthropogenic VOCs, toluene and C8 aromaticsdominate the SOA fraction, each contributing �20% onaverage. Partitioning from oxidation of the C9 aromaticscontribute <7% to the predicted total SOA. Modeled SOAfrom isoprene and its oxidation products dominate thebiogenic SOA. The modeled biogenic fraction of SOA isdominant (i.e., >50%) over the modeled anthropogenicfraction in the urban plumes on 26 September and5 October; however, the modeled anthropogenic fraction
is always dominant (i.e., >50%) in the anthropogenic VOC(AVOC)-rich ship channel plumes.[38] Previous modeling studies underestimated SOA
mass by a factor of 8–30 for air masses with a photochem-ical age of 1–10 h [Volkamer et al., 2006]. However, asshown in Figure 7, our modeled DOA/DCO values arewithin a factor of 2 of the average values measured in thecases described above. The following differences betweenour box model and other SOA prediction models haveimproved the agreement between observed and predictedSOA mass:[39] 1. In our model, we have included benzene as an
SOA precursor. Additionally, in some of the previousstudies, constant SOA yields of 10% for both toluene andxylene, obtained under high-NOx and high amounts ofabsorbing mass [e.g., Seinfeld and Pandis, 1998], havebeen applied to estimate SOA formation. Mass- and NOx-dependent yields from more recent laboratory studies areused in our analysis and result in yields of 12–21% forbenzene, 7–15% for toluene, and 5–14% for xylene, for theconditions encountered in TexAQS. This leads to an overallincrease in the total predicted anthropogenic SOA mass byup to a factor of �1.3, compared to using an assumed 10%SOA yield for toluene and xylene only.[40] 2. We have also considered SOA formation through
secondary oxidation of MACR and MVK to account foroxidation of isoprene prior to the first transect. The amountof SOA from this pathway is on average 25% of the totalSOA (Table 1), resulting in an increase in total SOA by afactor of �1.3 compared to a case where this pathway is notconsidered.[41] 3. In most of the previous studies, only aerosol yields
from high-NOx conditions have been applied to the models,whereas under reduced NOx conditions SOA formationfrom aromatics, isoprene, and monoterpenes may occur atsignificantly higher yields [Presto et al., 2005; Kroll et al.,2006; Ng et al., 2007a, 2007b]. Assuming a mixing ratio of25 pptv for HO2, the model results indicate that at least0.05 ppbv of NO is needed in order to have more than 50%of the aromatics following the high-NOx reaction scheme;this corresponds to total of 0.3 ppbv of NOx in the plumesstudied here. Since NOx mixing ratios decrease with plumeage for most plumes studied here, the fraction of aromaticsthat reacted through the high-NOx oxidation pathway(equation (4a)) decreased from �100% at the first transectto �65–90% at Dt = 6 h, depending on the day. Forisoprene-RO2 radicals that have a much lower rate constantwith HO2, at least 0.01 ppbv of NO is needed to have morethan 50% of isoprene react through the high-NOx pathway.Thus, in the transects farthest downwind of the sources, thehigh-NOx (i.e., lower SOA yield) isoprene oxidation path-way contributed >90% of isoprene oxidation. In summary,our model results show that the low-NOx pathway contrib-uted to 10–35% and 10% of the oxidation of aromatics andisoprene, respectively. Considering the differences in theyield values in the low- and high-NOx regimes, an addi-tional 10–55% and 2–15% of SOA from aromatics andisoprene, respectively, were formed from the low-NOx
pathway. For the conditions encountered during TexAQS-2006, the amount of predicted SOA is increased by up to afactor of 1.7 by considering the low-NOx pathway. Thistrend is consistent with study of de Gouw et al. [2008] who
Table 1. Results of the Box Model to Estimate the Fractional
Contribution of Individual VOCs, Sum of Biogenic VOCs, and
Sum of Anthropogenic VOCs to the Modeled SOA in Urban and
Ship Channel Plumes at the End of the Simulationa
FractionalContributionto SOA
26 September 27 September 5 October
Urb SC Urb SC Urb SC
fisoprene 0.16 0.15 0.27 0.27 0.11 0.09fMVK+MACR 0.37 0.16 0.22 0.17 0.33 0.16fmonoterpene 0.02 0.02 0.02 0.03 0.03 0.02fbenzene 0.03 0.11 0.05 0.09 0.06 0.11ftoluene 0.18 0.26 0.22 0.21 0.24 0.3fC8-aromatics 0.19 0.23 0.19 0.19 0.16 0.25fC9-aromatics 0.05 0.07 0.03 0.04 0.07 0.07fbiogenic 0.55 0.33 0.51 0.47 0.47 0.27fanthropogenic 0.45 0.67 0.49 0.53 0.53 0.73
aUrb, urban; SC, ship channel. Depending on the day and the plume,Dt � 3–6 h. Note that fisoprene is the term accounting for oxidation ofisoprene measured in the plumes while fMVK+MACR is the term accountingfor oxidation of additional ‘‘initial isoprene source’’ as explained insection 3.3.2.
D00F16 BAHREINI ET AL.: ORGANIC AEROSOL FORMATION IN TEXAS
12 of 17
D00F16

reported that using only the low-NOx SOA yields ofaromatics to obtain an upper limit of SOA productionreduced the discrepancy between measured and predictedSOA production from a factor of 10 to �3 in the NE UnitedStates.[42] Combining the enhancement factors listed above
indicates that by considering SOA formation from benzeneand MACR-MVK as well as considering the absorbingmass- and NOx-dependent SOA yields, about a factor of3 improvement in the agreement between modeled andmeasured SOA values is achieved.[43] As discussed in section 3.3, we have run a sensitivity
test with only the OOA fraction (80%) of the backgroundorganics and the newly formed SOA as the absorbing mass.Results indicate that with a 20% reduction in the amount ofbackground absorbing mass due to the presence of HOA,modeled amounts of SOA is reduced by about 5%. Sensi-tivity runs with reduced mixing ratio of HO2 in the plumeswhere NO > 1 ppbv result in reduction of total SOA by<2%.[44] We also explored the role of sesquiterpenes in
biogenic SOA formation, where sesquiterpenes were esti-mated to be 30% of the monoterpenes, representative of theaverage estimated emission ratio of sesquiterpenes to mono-terpenes [Sakulyanontvittaya et al., 2008]. Since most ofthe biogenic VOCs (BVOCs) are emitted outside the urbanand industrial areas of Houston, and since sesquiterpeneshave higher reactivity with OH and O3 compared to mono-terpenes, this leads to overestimating the mixing ratios ofsesquiterpenes in the plumes. With this in mind, if sesqui-terpenes are allowed to form SOA with a yield of 80%,the amount of biogenic SOA would increase by up to afactor of 2.7.[45] To summarize, as indicated in Figure 7, the box
model shows improved agreement between modeled andmeasured values of DOA/DCO when accounting for thecurrently known SOA formation schemes. However, uncer-tainties remain in the identity of both anthropogenic andbiogenic SOA precursors and nontraditional SOA formationprocesses that lead to underestimating SOA formation in thebox model by up to a factor of 2. Because of these caveats,we cannot use the modeled fractions of biogenic versusanthropogenic OA conclusively. We rather explore the roleof BVOCs and AVOCs in SOA formation in section 6,using our measurements of OA and anthropogenic pollutiontracers that show no evidence for significant additional OAformation from BVOCs in plumes with high anthropogenicinfluence.
6. Role of BVOCs in SOA Formation
[46] In addition to the box model calculations of SOAfrom BVOCs described in sections 3.3 and 5, we used aLagrangian particle dispersion model to estimate mixingratios of BVOCs along the flight track. For this analysis,we added the EPA BEIS (BEIS 3.12–3.13) [Pierce andWaldruff, 1991; Pierce et al., 1998] emission inventory forisoprene and monoterpenes to the Lagrangian particledispersion model, FLEXPART [Stohl et al., 2005]. Asdescribed by Warneke et al. (submitted manuscript, 2008),the mixing ratios of isoprene calculated using FLEXPART’s1-h footprint were within a factor of 2 of the isoprene
measured aboard the aircraft. In a similar comparison formonoterpenes, FLEXPART’s estimate was at times a factorof 2 higher than the measurements and thus may lead to anoverestimation of biogenic SOA formation; however, this isstill within the uncertainties of monoterpene emissions andmeasurements (Warneke et al., submitted manuscript,2008). For our analysis here, we allow the amount ofisoprene and monoterpenes, predicted to be present in theplumes by FLEXPART’s 72-h footprint, to oxidize and formSOA using constant SOA formation yields. SOA yieldsassumed here (2.5% for isoprene and 10% for monoter-penes) are the averaged overall yields calculated in the boxmodel that correspond to the NOx/VOC ratios and absorbingmass estimates during the flights. However, some oxidationof isoprene and monoterpenes might have occurred withdifferent SOAyields in earlier parts of the transport when theNOx/VOC ratios or the absorbing mass were different. Theamount of SOA (in mg sm�3) formed from the BVOCs iscalculated by multiplying the above yields and the corres-ponding concentration of BVOCs in mg sm�3. Note thatthis analysis does not allow for reversible partitioning ofBVOC oxidation products, and therefore represents anupper estimate of the SOA formed.[47] Figure 8 shows the enhancement in OA (DOA) that
is predicted from BVOCs in the box model as well as theamount that is predicted by oxidation of isoprene andmonoterpenes in FLEXPART as a function of transportage for plumes transected on 27 September, when plumeswith higher influence of biogenic emissions were samplednorth of Houston. Since SOA formation in the box model isinitialized with zero SOA in the first transect, for thiscomparison, the background value of 0.37 mg sm�3 esti-mated from FLEXPART in the initial transects (i.e., trans-port age � 0 h) has been subtracted from total OA valuespredicted by FLEXPART. The two methods agree well inpredicting the time scale of increase in OA. In addition, theenhancement in biogenic OA predicted from either methodis <0.7 mg sm�3 and the two methods differ by <34% forpredicting the enhancement due to biogenic OA. As men-tioned in section 3.3, the box model accounts for earlieroxidation of isoprene in an air mass by adding 2 � (MACR +MVK)t=t1 in the isoprene budget (equations (2) and (3))whereas FLEXPART directly accounts for total isoprenefootprint in the past 72 h. The good agreement in predictedtotal biogenic OA by the two methods indicates that the boxmodel is reasonably accounting for the oxidation of totalisoprene.[48] Although the model comparisons of DOA/DCO
with measurements are in better agreement than in previousstudies, there is still up to a factor of 2 discrepancy whenaverage modeled DOA/DCO values are compared with theaverage measured values in each transect (Figure 7). Asmentioned in sections 3.3 and 5, our understanding of boththe biogenic and anthropogenic SOA precursors, in terms oftheir identity, ambient precursor concentration, SOA yield,and gas to particle partitioning, is incomplete. Therefore, itis necessary to consider the relationship between anthropo-genic and biogenic organic aerosol precursors in order toidentify the dominant processes responsible for OA forma-tion in the region.[49] In Figure 9a, we present the scatterplot of OA versus
CO on 27 September. A positive correlation of OA versus
D00F16 BAHREINI ET AL.: ORGANIC AEROSOL FORMATION IN TEXAS
13 of 17
D00F16

CO is observed, with a slope of 92 mg sm�3 ppmv�1 andr2 = 0.87. This slope does not change significantly if onlydata points over the forested site north of Houston with[BVOC] > 1500 pptv are considered. Although secondaryCO production through oxidation of BVOCs is also possi-ble, a correlation of r2 = 0.64 between acetylene, ananthropogenic marker, and CO (Figure 9b) indicates thatsources of CO in Houston area are mainly anthropogenic.(The outliers in this scatterplot show enhancements inbenzene, indicating the different emission ratios of acety-lene to CO in different industries of the ship channel.)Therefore, the strong correlation of OA with CO andinsensitivity of the OA/CO slope to biogenic sourcesstrongly suggests that in the time scale of few hours when
anthropogenic precursors are transported to areas with astrong biogenic influence, there is no evidence in ourmeasurements for significant additional OA productionfrom BVOCs. This finding is consistent with previousobservations in the NE United States [Sullivan et al.,2006;Weber et al., 2007; de Gouw et al., 2008] that indicatea strong link between anthropogenic emissions and SOAformation.
7. Comparison to Measurements From theTexAQS-2000 Study
[50] The OA growth shown here helps explain the aerosolgrowth observed in a previous study in the same region.During the first Texas Air Quality Study in 2000 (TexAQS-2000), measurements of particle size distributions, NOx,SO2, and VOCs were made aboard the NCAR Electraaircraft, downwind of urban and industrial centers aroundHouston [Brock et al., 2003]. Particle volume measurementsdownwind of an isolated, rural power plant, which was astrong source of SO2, showed that the observed growth wasconsistent with gas phase SO2 oxidation and the subsequentgas to particle condensation and neutralization of H2SO4.However, downwind of the ship channel industries, thegrowth in particle volume exceeded the amounts predictedfrom gas to particle partitioning of SO2 oxidation productsby factors of 2–10. Although particle composition measure-ments were not available aboard the Electra aircraft in 2000,it was speculated at the time that the unaccounted increasein particle volume was due to nitrate and/or SOA formation[Brock et al., 2003].[51] In Figure 10, we compare the volume-based aerosol
growth measurements on 26 September 2006 with themeasured growth on 27–28 August 2000 presented byBrock et al. [2003]. The average volume-based aerosol datafrom TexAQS-2000 were about a factor of 2–5 higher thanthe average volume-based aerosol measurements duringTexAQS-2006. Comparing the modeled values of the ratioof particulate sulfur to total sulfur (SO4
2�/(SO42� + SO2 (g)))
Figure 8. Evolution of enhancement in OA from BVOCspredicted by the box model and from analysis ofFLEXPART with the 72-h isoprene and monoterpenesurface contribution input with transport age for plumestransected on 27 September. Estimated background value of0.37 mg sm�3 has been subtracted from FLEXPARTpredicted OA values.
Figure 9. (a) Scatterplot and linear fit of OA versus CO on 27 September. Data points from plumes withhigher influence of biogenic (i.e., isoprene + 2 (MVK + MACR) + monoterpenes) and aromatic (i.e., sumof C6-C9 aromatics) VOCs are shown in green and brown, respectively. (b) Scatterplot and linear fit ofacetylene versus CO for all the data points from 27 September. The markers are colored with mixing ratioof benzene.
D00F16 BAHREINI ET AL.: ORGANIC AEROSOL FORMATION IN TEXAS
14 of 17
D00F16

in 2000 and the values measured in 2006 indicate that thedegree of oxidation in the plumes from 27 to 28 August2000 and 26 September 2006 was similar. However, VOCmeasurements in 2006 indicate that the median mixing ratioof many VOCs, including aromatics that are among thedominant known SOA precursors, were a factor of 2 lowerin 2006 compared to 2000 (E. B. Cowling et al., The finalrapid science synthesis report: Findings from the SecondTexas Air Quality Study (TexAQS II), available at http://www.esrl.noaa.gov/csd/2006/rss/rsstfinalreport083107.pdf).Moreover, in 2006 temperatures were lower, wind speedshigher, and pollutant concentrations lower than in 2000. Thedifferences in VOC emissions and meteorology lead todifferences in chemical aging of the pollutants; this mayexplain the observed differences in volume-based growthmeasurements in 2000 and 2006. During TexAQS-2006,more than 60% of the aerosol mass in the oxidized, agedship channel plumes was OA, and the rest mostly ammo-nium sulfate. This is consistent with the conjecture of Brocket al. [2003] that the aerosol growth in the ship channelplumes measured in 2000 was primarily due to SOAformation.[52] Particle composition measurements during TexAQS-
2006 are also used to examine the possibility of acidcatalyzed SOA formation. Because SO2 and particle volumedata downwind of the Houston ship channel were highlycorrelated in 2000, acid-catalyzed SOA formation wasspeculated to have contributed to the observed growth[Brock et al., 2003]. On 26 September 2006, no evidenceof fresh, small acidic sulfate particles was found even inSO2-rich regions of the ship channel plume, and the averagemolar ratio of NH4
+/SO42� was close to 2 even for transport
ages of <2 h indicating dominance of neutralized particles,yet a rapid increase in DOA was observed in the shipchannel plume (Figure 5a). Summertime ground basedmeasurements at the La Porte airport, Texas, �15 km fromthe ship channel, also indicated that fine sulfate particles inthis region are often fully neutralized [Pavlovic et al., 2006].Since the average molar ratio of NH4
+/SO42� in the ship
channel plumes for all the flights discussed here is in therange of �1.4–2, and since a strong increase in DOA isobserved even in the presence of neutralized sulfate par-ticles, consistent with other observations downwind of SO2
sources [Peltier et al., 2007; Zhang et al., 2007b], weconclude that acid-catalyzed SOA formation plays at mosta minor role in the observed growth of particles downwindof the industrial centers along the Houston ship channel.
8. Conclusions
[53] Measurements of OA and CO in urban plumesaround Houston and Dallas/Fort Worth, Texas, and down-wind of the Houston ship channel during TexAQS-2006 arereported here. Formation of SOA in the urban plumes ofHouston and Dallas/Fort Worth was similar to that deter-mined from measurements made downwind of urban areasin the NE United States. The ratio of DOA/DCO in isolatedship channel plumes on 26 September exceeded that in theHouston and Dallas urban plumes by a factor of 1.5–7,partly because of higher mixing ratios of VOCs with highaerosol formation potential in the industrial plumes. Thehigher production of SOA in the ship channel was not dueto acid-catalyzed SOA formation.[54] Box model simulations of SOA formation in the
plumes, using recent results from laboratory studies thataccount for the dependence of SOA formation yield on NOx
and absorbing mass, predict OA that results in DOA/DCOvalues within a factor of 2 of the measurements. Accountingfor SOA formation from benzene and MACR-MVK as wellas the absorbing mass- and NOx-dependent SOA yieldsreduce the model-measurement discrepancy compared toprevious studies. On the basis of the observed improvementbetween the modeling results presented here and previousstudies (factor of 2 here versus 3–30, for similarly agedplumes), it is of interest to apply such modeling efforts toother data sets where plumes with longer photochemical agewere sampled in order to assess the ability of such models topredict SOA mass on a regional scale. The tight correlationof OA versus CO, independent of BVOC influence, indicatethat anthropogenic pollution was the main contributor toSOA formation in Houston area.
[55] Acknowledgments. We thank the WP-3D operation crew fortheir efforts and support during the project, K. Aikin as the project datamanager, M. Trainer for his flight planning efforts during TexAQS-2006,G. Frost and M. Trainer for discussions regarding HOx calculations, andW. Angevine for discussions regarding the wind profiler data set. We alsoappreciate the constructive comments of the reviewers, which helpedstrengthen the manuscript. R.B. and P.F.D. acknowledge a CIRES post-doctoral visiting fellowship and an EPA STAR graduate fellowship(FP-91650801), respectively. B.E. acknowledges support from the Officeof Science (BER), U.S. Department of Energy, grant DE-FG02-08ER64539.
ReferencesAlfarra, M. R., et al. (2004), Characterization of urban and rural organicparticulate in the Lower Fraser Valley using two Aerodyne Aerosol MassSpectrometers, Atmos. Environ., 38, 5745–5758, doi:10.1016/j.atmosenv.2004.01.054.
Allan, J. D., et al. (2004), A generalized method for the extraction ofchemically resolved mass spectra from Aerodyne aerosol mass spectro-meter data, J. Aerosol Sci., 35(7), 909 –922, doi:10.1016/j.jaerosci.2004.02.007.
Bahreini, R., E. J. Dunlea, B. M. Matthew, C. Simons, K. S. Docherty, P. F.DeCarlo, J. L. Jimenez, C. A. Brock, and A. M. Middlebrook (2008),Design and operation of a pressure-controlled inlet for airborne sampling
Figure 10. Comparison of aerosol growth, presented asDVolume/DCO (mm3 scm�3 ppmv�1), in ship channelplumes during TexAQS-2000 [Brock et al., 2003] andTexAQS-2006 studies. Error bars indicate the uncertainty(34%) in the volume measurements.
D00F16 BAHREINI ET AL.: ORGANIC AEROSOL FORMATION IN TEXAS
15 of 17
D00F16

with an aerodynamic aerosol lens, Aerosol Sci. Technol., 42(6), 465–471,doi:10.1080/02786820802178514.
Brock, C. A., et al. (2003), Particle growth in urban and industrial plumes inTexas, J. Geophys. Res., 108(D3), 4111, doi:10.1029/2002JD002746.
Brock, C. A., et al. (2008), Sources of particulate matter in the northeasternUnited States in summer: 2. Evolution of chemical and microphysicalproperties, J. Geophys. Res., 113, D08302, doi:10.1029/2007JD009241.
Carlton, A. G., B. J. Turpin, K. E. Altieri, S. Seitzinger, A. Reff, H.-J. Lim,and B. Ervens (2007), Atmospheric oxalic acid and SOA production fromglyoxal: Results of aqueous photooxidation experiments, Atmos. Envir-on., 41, 7588–7602, doi:10.1016/j.atmosenv.2007.05.035.
Carter, W. P. L., and R. Atkinson (1996), Development and evaluation ofa detailed mechanism for the atmospheric reactions of isoprene andNOx, Int. J. Chem. Kinet., 28(7), 497–530, doi:10.1002/(SICI)1097-4601(1996)28:7<497::AID-KIN4>3.0.CO;2-Q.
Chung, S. H., and J. H. Seinfeld (2002), Global distribution and climateforcing of carbonaceous aerosols, J. Geophys. Res., 107(D19), 4407,doi:10.1029/2001JD001397.
DeCarlo, P. F., J. G. Slowik, D. R. Worsnop, P. Davidovits, and J. L.Jimenez (2004), Particle morphology and density characterization bycombined mobility and aerodynamic measurements. Part 1: Theory,Aerosol Sci. Technol., 38, 1185–1205, doi:10.1080/027868290903907.
DeCarlo, P. F., et al. (2006), Field-deployable, high-resolution, time-of-flight aerosol mass spectrometer, Anal. Chem., 78(24), 8281–8289,doi:10.1021/ac061249n.
DeCarlo, P. F., E. J. Dunlea, J. R. Kimmel, A. C. Aiken, and J. L. Jimenez(2008), Fast airborne aerosol size and chemistry measurements with thehigh resolution aerosol mass spectrometer during the Milagro- Mex FieldCampaign, Atmos. Chem. Phys., 8, 4027–4048.
de Gouw, J. A., and C. Warneke (2007), Measurements of volatile organiccompounds in the Earth’s atmosphere using proton-transfer-reaction massspectrometry, Mass Spectrom. Rev., 26, 223–257, doi:10.1002/mas.20119.
de Gouw, J. A., et al. (2005), Budget of organic carbon in a pollutedatmosphere: Results from the New England Air Quality Study in 2002,J. Geophys. Res., 110, D16305, doi:10.1029/2004JD005623.
de Gouw, J. A., et al. (2008), Sources of particulate matter in the north-eastern United States in summer: 1. Direct emissions and secondaryformation of organic matter in urban plumes, J. Geophys. Res., 113,D08301, doi:10.1029/2007JD009243.
Drewnick, F., J. J. Schwab, J. T. Jayne, M. Canagaratna, D. R. Worsnop,and K. L. Demerjian (2004), Measurements of ambient aerosol composi-tion during PMTACS-NY 2001 using an aerosol mass spectrometer. PartI: Mass concentrations, Aerosol Sci. Technol., 38, suppl. 1, 92–103,doi:10.1080/02786820390229507.
Drewnick, F., S. S. Hings, P. DeCarlo, J. T. Jayne, M. Gonin,K. Fuhrer, S. Weimer, J. L. Jimenez, K. L. D. S. Borrmann, and D. R.Worsnop (2005), A new time-of-flight aerosol mass spectrometer(TOF-AMS)—Instrument description and first field deployment, Aero-sol Sci. Technol., 39(7), 637–658, doi:10.1080/02786820500182040.
Dunlea, E. J., et al. (2008), Evolution of Asian aerosols during transpacifictransport in INTEX-B, Atmos. Chem. Phys. Discuss., 8, 15,375–15,461.
Ervens, B., and S. M. Kreidenweis (2007), SOA formation by biogenic andcarbonyl compounds: Data evaluation and application, Environ. Sci.Technol., 41(11), 3904–3910, doi:10.1021/es061946x.
Ervens, B., A. G. Carlton, B. J. Turpin, K. E. Altieri, S. M. Kreidenweis,and G. Feingold (2008), Secondary organic aerosol yields from cloud-processing of isoprene oxidation products, Geophys. Res. Lett., 35,L02816, doi:10.1029/2007GL031828.
Fiore, A. M., D. J. Jacob, J. A. Logan, and J. H. Yin (1998), Long-termtrends in ground level ozone over the contiguous United States, 1980–1995, J. Geophys. Res., 103(D1), 1471–1480, doi:10.1029/97JD03036.
Geron, C., R. Rasmussen, R. R. Arnts, and A. Guenther (2000), A reviewand synthesis of monoterpene speciation from forests in the United States,Atmos. Environ., 34(11), 1761 – 1781, doi:10.1016/S1352-2310(99)00364-7.
Grieshop, A. P., N. M. Donahue, and A. L. Robinson (2007), Is the gas-particle partitioning in alpha-pinene secondary organic aerosol reversi-ble?, Geophys. Res. Lett., 34, L14810, doi:10.1029/2007GL029987.
Griffin, R. J., I. D. R. Cocker, R. C. Flagan, and J. H. Seinfeld (1999),Organic aerosol formation from the oxidation of biogenic hydrocarbons,J. Geophys. Res., 104(D3), 3555–3567, doi:10.1029/1998JD100049.
Griffin, R. J., J. Chen, K. Carmody, S. Vutukuru, and D. Dabdub (2007),Contribution of gas phase oxidation of volatile organic compoundsto atmospheric carbon monoxide levels in two areas of the United States,J. Geophys. Res., 112, D10S17, doi:10.1029/2006JD007602.
Heald, C. L., D. J. Jacob, R. J. Park, L. M. Russell, B. J. Huebert, J. H.Seinfeld, H. Liao, and R. J. Weber (2005), A large organic aerosol sourcein the free troposphere missing from current models, Geophys. Res. Lett.,32, L18809, doi:10.1029/2005GL023831.
Hennigan, C. J., M. H. Bergin, J. E. Dibb, and R. J. Weber (2008), Enhancedsecondary organic aerosol formation due to water uptake by fine particles,Geophys. Res. Lett., 35, L18801, doi:10.1029/2008GL035046.
Henze, D. K., and J. H. Seinfeld (2006), Global secondary organic aerosolfrom isoprene oxidation, Geophys. Res. Lett., 33, L09812, doi:10.1029/2006GL025976.
Henze, D. K., J. H. Seinfeld, N. L. Ng, J. H. Kroll, T.-M. Fu, D. J. Jacob,and C. L. Heald (2008), Global modeling of secondary organic aerosolformation from aromatic hydrocarbons: High- vs. low- yield pathways,Atmos. Chem. Phys., 8, 2405–2420.
Holloway, J. S., R. O. Jakoubek, D. D. Parrish, C. Gerbig, A. Volz-Thomas,S. Schmitgen, A. Fried, B. Wert, B. Henry, and J. R. Drummond (2000),Airborne intercomparison of vacuum ultraviolet fluorescence and tunablediode laser absorption measurements of tropospheric carbon monoxide,J. Geophys. Res., 105(D19), 24,251–24,261, doi:10.1029/2000JD900237.
Hudman, R. C., L. T. Murray, D. J. Jacob, D. B. Millet, S. Turgwety, S. Wu,D. R. Blake, A. H. Goldstein, J. Holloway, and G. W. Sachse (2008),Biogenic versus anthropogenic sources of CO in the United States, Geo-phys. Res. Lett., 35, L04801, doi:10.1029/2007GL032393.
Johnson, D., S. R. Utembe, M. J. Jenkin, R. G. Derwent, G. D. Hayman,M. R. Alfarra, H. Coe, and G. McFiggans (2006), Simulating regionalscale secondary organic aerosol formation during the TORCH 2003 cam-paign in the southern UK, Atmos. Chem. Phys., 6, 403–418.
Kleinman, L. I., et al. (2008), The time evolution of aerosol compositionover the Mexico City plateau, Atmos. Chem. Phys., 8, 1559–1575.
Kroll, J. H., N. L. Ng, S. M. Murphy, R. C. Flagan, and J. H. Seinfeld(2005), Secondary organic aerosol formation from isoprene photooxida-tion under high-NOx conditions, Geophys. Res. Lett., 32, L18808,doi:10.1029/2005GL023637.
Kroll, J. H., N. L. Ng, S. M. Murphy, R. C. Flagan, and J. H. Seinfeld(2006), Secondary organic aerosol formation from isoprene photooxida-tion, Environ. Sci. Technol., 40(6), 1869–1877, doi:10.1021/es0524301.
Lemire, K. R., D. T. Allen, G. A. Klouda, and C. W. Lewis (2002), Fineparticulate matter source attribution for southeast Texas using 14C/13Cratios, J. Geophys. Res., 107(D22), 4613, doi:10.1029/2002JD002339.
Lewis, C. W., and D. C. Stiles (2006), Radiocarbon content of PM2.5ambient aerosol in Tampa, FL, Aerosol Sci. Technol., 40, 189–196,doi:10.1080/02786820500521007.
Lewis, C. W., G. A. Klouda, and W. D. Ellenson (2004), Radiocarbonmeasurement of the biogenic contribution to summertime PM-2.5 ambi-ent aerosol in Nashville, TN, Atmos. Environ., 38, 6053 – 6061,doi:10.1016/j.atmosenv.2004.06.011.
Lim, Y. B., and P. J. Ziemann (2005), Products and mechanism of second-ary organic aerosol formation from reactions of n-alkanes with OH radi-cals in the presence of NOx, Environ. Sci. Technol., 39, 9229–9236,doi:10.1021/es051447g.
Mao, J., et al. (2009), Atmospheric oxidation capacity in the summer ofHouston 2006: Comparison with summer measurements in other metro-politan studies, Atmos. Environ., doi:10.1016/j.atmosenv.2009.01.013,in press.
Matthew, B. M., A. M. Middlebrook, and T. B. Onasch (2008), Collectionefficiencies in an Aerodyne Aerosol Mass Spectrometer as a function ofparticle phase for laboratory generated aerosols, Aerosol Sci. Technol.,42, 884–898, doi:10.1080/02786820802356797.
Murphy, D. M., D. J. Cziczo, K. D. Froyd, P. K. Hudson, B. M. Matthew,A. M. Middlebrook, R. E. Peltier, A. Sullivan, D. S. Thomson, and R. J.Weber (2006), Single-particle mass spectrometry of tropospheric aerosolparticles, J. Geophys. Res., 111, D23S32, doi:10.1029/2006JD007340.
Neuman, J. A., et al. (2009), Relationship between photochemical ozoneproduction and NOx oxidation in Houston, Texas, J. Geophys. Res., 114,D00F08, doi:10.1029/2008JD011688.
Ng, N. L., et al. (2007a), Effect of NOx level on secondary organic aerosol(SOA) formation from the photooxidation of terpenes, Atmos. Chem.Phys., 7, 5159–5174.
Ng, N. L., J. H. Kroll, A. W. H. Chan, P. S. Chhabra, R. C. Flagan, and J. H.Seinfeld (2007b), Secondary organic aerosol formation from m-xylene,toluene, and benzene, Atmos. Chem. Phys., 7, 3909–3922.
Odum, J. R., T. Hoffmann, F. Bowman, D. Collins, R. C. Flagan, and J. H.Seinfeld (1996), Gas/particle partitioning and secondary organic aerosolyields, Environ. Sci. Technol., 30(8), 2580 – 2585, doi:10.1021/es950943+.
Odum, J. R., T. P. W. Jungkamp, R. J. Griffin, R. C. Flagan, and J. H.Seinfeld (1997), The atmospheric aerosol-forming potential of wholegasoline vapor, Science, 276, 96–99, doi:10.1126/science.276.5309.96.
Ortega, J., D. Helmig, A. Guenther, P. Harley, S. Pressley, and C. Vogel(2007), Flux estimates and OH reaction potential of reactive biogenicvolatile organic compounds (BVOCs) from a mixed northern hardwoodforest, Atmos. Environ., 41, 5479 – 5495, doi:10.1016/j.atmosenv.2006.12.033.
D00F16 BAHREINI ET AL.: ORGANIC AEROSOL FORMATION IN TEXAS
16 of 17
D00F16

Parrish, D. D., et al. (2009), Overview of the Second Texas Air QualityStudy (TexAQS II) and the Gulf of Mexico Atmospheric Compositionand Climate Study (GoMACCS), J. Geophys. Res., 114, D00F13,doi:10.1029/2009JD011842.
Pavlovic, R. T., U. Nopmongcol, Y. Kimura, and D. T. Allen (2006),Ammonia emissions, concentrations and implications for particulate mat-ter formation in Houston, TX, Atmos. Environ., 40, suppl. 2, 538–551,doi:10.1016/j.atmosenv.2006.04.071.
Peltier, R. E., A. P. Sullivan, R. J. Weber, A. G. Wollny, J. S. Holloway,C. A. Brock, J. A. deGouw, and E. L. Atlas (2007), No evidence for acid-catalyzed secondary organic aerosol formation in power plant plumesover metropolitan Atlanta, Georgia, Geophys. Res. Lett., 34, L06801,doi:10.1029/2006GL028780.
Pierce, T., and P. S. Waldruff (1991), PC-BEIS—A personal computerversion of the biogenic emissions inventory system, J. Air Waste Manage.Assoc., 41(7), 937–941.
Pierce, T., C. Geron, L. Bender, R. Dennis, G. Tonnesen, and A. Guenther(1998), Influence of increased isoprene emissions on regional ozonemodeling, J. Geophys. Res., 103(D19), 25,611–25,629, doi:10.1029/98JD01804.
Presto, A. A., K. E. Huff Hartz, and N. M. Donahue (2005), Secondaryorganic aerosol production from terpene ozonolysis. 2. Effect of NOx
concentration, Environ. Sci. Technol., 39(18), 7046–7054, doi:10.1021/es050400s.
Qin, Y., T. Walk, R. Gary, X. Yao, and S. Elles (2007), C2–C10 non-methane hydrocarbons measured in Dallas, USA—Seasonal trends anddiurnal characteristics, Atmos. Environ., 41, 6018–6032, doi:10.1016/j.atmosenv.2007.03.008.
Quinn, P. K., et al. (2006), Impacts of sources and aging on submicrometeraerosol properties in the marine boundary layer across the Gulf of Maine,J. Geophys. Res., 111, D23S36, doi:10.1029/2006JD007582.
Robinson, A. L., N. M. Donahue, M. K. Shrivastava, E. A. Weitkamp,A. M. Sage, A. P. Grieshop, T. E. Lane, J. R. Pierce, and S. N. Pandis(2007), Rethinking organic aerosols: Semivolatile emissions and photo-chemical aging, Science, 315, 1259–1262, doi:10.1126/science.1133061.
Ryerson, T. B., et al. (1998), Emissions lifetimes and ozone formation inpower plant plumes, J. Geophys. Res., 103(D17), 22,569 – 22,583,doi:10.1029/98JD01620.
Ryerson, T. B., L. G. Huey, K. Knapp, J. A. Neuman, D. D. Parrish, D. T.Sueper, and F. C. Fehsenfeld (1999), Design and initial characterizationof an inlet for gas-phase NOy measurements from aircraft, J. Geophys.Res., 104(D5), 5483–5492, doi:10.1029/1998JD100087.
Ryerson, T. B., E. J. Williams, and F. C. Fehsenfeld (2000), An efficientphotolysis system for fast-response NO2 measurements, J. Geophys. Res.,105(D21), 26,447–26,461, doi:10.1029/2000JD900389.
Sakulyanontvittaya, T., T. Duhl, C. Wiedinmyer, D. Helmig, S. Matsunaga,M. Potosnak, J. Milford, and A. Guenther (2008), Monoterpene andsesquiterpene emission estimates for the United States, Environ. Sci.Technol., 42(5), 1623–1629, doi:10.1021/es702274e.
Schauffler, S. M., E. L. Atlas, S. G. Donnelly, A. Andrews, S. A. Montzka,J. W. Elkins, D. F. Hurst, P. A. Romashkin, G. S. Dutton, and V. Stroud(2003), Chlorine budget and partitioning during the Stratospheric Aerosoland Gas Experiment (SAGE) III Ozone Loss and Validation Experiment(SOLVE), J. Geophys. Res., 108(D5), 4173, doi:10.1029/2001JD002040.
Schichtel, B. A., W. C. Malm, G. Bench, S. Fallon, C. E. McDade, J. C.Chow, and J. G. Watson (2008), Fossil and contemporary fine particulatecarbon fractions at 12 rural and urban sites in the United States,J. Geophys. Res., 113, D02311, doi:10.1029/2007JD008605.
Schwarz, J. P., et al. (2008), Measurement of the mixing state, mass, andoptical size of individual black carbon particles in urban and biomassburning emissions, Geophys. Res. Lett., 35, L13810, doi:10.1029/2008GL033968.
Seinfeld, J. H., and S. N. Pandis (1998), Atmospheric Chemistry and Phy-sics: From Air Pollution to Climate Change, John Wiley, New York.
Shrivastava, M. K., T. E. Lane, N. M. Donahue, S. N. Pandis, and A. L.Robinson (2008), Effects of gas particle partitioning and aging of primaryemission on urban and regional organic aerosol concentrations, J. Geo-phys. Res., 113, D18301, doi:10.1029/2007JD009735.
Song, C., R. A. Zaveri, M. L. Alexander, J. A. Thornton, S. Madronich, J. V.Ortega, A. Zelenyuk, X. Y. Yu, A. Leskin, and D. A. Maughan (2007),Effect of hydrophobic primary organic aerosols on secondary organicaerosol formation from ozonolysis of alpha-pinene, Geophys. Res. Lett.,34, L20803, doi:10.1029/2007GL030720.
Sorooshian, A., et al. (2006), Oxalic acid in clear and cloudy atmospheres:Analysis of data from International Consortium for Atmospheric Re-search on Transport and Transformation 2004, J. Geophys. Res., 111,D23S45, doi:10.1029/2005JD006880.
Sorooshian, A., N. L. Ng, A. W. H. Chan, G. Feingold, R. C. Flagan, andJ. H. Seinfeld (2007), Particulate organic acids and overall water-soluble
aerosol composition measurements from the 2006 Gulf of Mexico Atmo-spheric Composition and Climate Study (GoMACCS), J. Geophys. Res.,112, D13201, doi:10.1029/2007JD008537.
Stark, H., B. M. Lerner, R. Schmitt, R. Jakoubek, E. J. Williams, T. B.Ryerson, D. T. Sueper, D. D. Parrish, and F. C. Fehsenfeld (2007), Atmo-spheric in situ measurement of nitrate radical (NO3) and other photolysisrates using spectroradiometry and filter radiometry, J. Geophys. Res., 112,D10S04, doi:10.1029/2006JD007578.
Stohl, A., C. Forster, A. Frank, P. Seibert, and G. Wotawa (2005), Technicalnote: The Lagrangian particle dispersion model FLEXPART version 6.2,Atmos. Chem. Phys., 5, 2461–2474.
Sullivan, A. P., R. E. Peltier, C. A. Brock, J. A. deGouw, J. S. Holloway,C. Warneke, A. G. Wollny, and R. J. Weber (2006), Airborne measure-ments of carbonaceous aerosol soluble in water over northeastern Uni-ted States: Method development and an investigation into water-solubleorganic carbon sources, J. Geophys. Res., 111, D23S46, doi:10.1029/2006JD007072.
Volkamer, R., J. L. Jimenez, F. SanMartini, K. Dzepina, Q. Zhang,D. Salcedo, L. T. Molina, D. R. Worsnop, and M. J. Molina (2006),Secondary organic aerosol formation from anthropogenic air pollution:Rapid and higher than expected, Geophys. Res. Lett., 33, L17811,doi:10.1029/2006GL026899.
Volkamer, R., F. SanMartini, L. T. Molina, D. Salcedo, J. L. Jimenez, andM. J. Molina (2007), A missing sink for gas-phase glyoxal in MexicoCity: Formation of secondary organic aerosol, Geophys. Res. Lett., 34,L19807, doi:10.1029/2007GL030752.
Volkamer, R., P. J. Ziemann, and M. J. Molina (2009), Secondary organicaerosol formation from acetylene (C2H2): Seed effect on SOA yields dueto organic photochemistry in the aerosol aqueous phase, Atmos. Chem.Phys., 8, 14,841–14,892.
Warneke, C., et al. (2007), Determination of urban volatile organic com-pound emission ratios and comparison with an emissions database,J. Geophys. Res., 112, D10S47, doi:10.1029/2006JD007930.
Weber, R. J., et al. (2007), A study of secondary organic aerosol formationin the anthropogenic-influenced southeastern United States, J. Geophys.Res., 112, D13302, doi:10.1029/2007JD008408.
Weibring, P., D. Richter, J. G. Walega, and A. Fried (2007), First demon-stration of a high performance difference frequency spectrometer onairborne platforms, Opt. Express, 15(21), 13,476–13,495, doi:10.1364/OE.15.013476.
Wilson, J. C., B. G. Lafleur, H. Hilbert, W. R. Seebaugh, J. Fox, D. W.Gesler, C. A. Brock, B. J. Huebert, and J. Mullen (2004), Function andperformance of a low turbulence inlet for sampling supermicron particlesfrom aircraft platforms, Aerosol Sci. Technol., 38(8), 790 – 802,doi:10.1080/027868290500841.
Zhang, Q., C. O. Stanier, M. R. Canagaratna, J. T. Jayne, D. R. Worsnop,S. N. Pandis, and J. L. Jimenez (2004), Insights into the chemistry of newparticle formation and growth events in Pittsburgh based on aerosol massspectrometry, Environ. Sci. Technol., 38(18), 4797–4809, doi:10.1021/es035417u.
Zhang, Q., D. R. Worsnop, M. R. Canagaratna, and J. L. Jimenez (2005),Hydrocarbon-like and oxygenated organic aerosols in Pittsburgh: Insightsinto sources and processes of organic aerosols, Atmos. Chem. Phys., 5,3289–3311.
Zhang, Q., et al. (2007a), Ubiquity and dominance of oxygenated species inorganic aerosols in anthropogenically influenced Northern Hemispheremidlatitudes, Geophys. Res. Lett., 34 , L13801, doi:10.1029/2007GL029979.
Zhang, Q., J. L. Jimenez, D. R. Worsnop, and M. Canagaratna (2007b), Acase study of urban particle acidity and its influence on secondary organicaerosol, Environ. Sci. Technol., 41(9), 3213 – 3219, doi:10.1021/es061812j.
�����������������������E. Atlas, Rosenstiel School of Marine and Atmospheric Science,
University of Miami, Miami, FL 33149, USA.R. Bahreini, J. Brioude, J. A. de Gouw, B. Ervens, F. C. Fehsenfeld, J. S.
Holloway, J. L. Jimenez, J. A. Neuman, J. Peischl, H. Stark, and C.Warneke, Cooperative Institute for Research in Environmental Sciences,University of Colorado at Boulder, Boulder, CO 80309, USA. ([email protected])C. A. Brock, A. M. Middlebrook, and T. B. Ryerson, Earth System
Research Laboratory, NOAA, Boulder, CO 80305, USA.P. F. DeCarlo, Paul Scherrer Institut, CH-5232 Villigen PSI, Switzerland.A. Fried, D. Richter, J. Walega, and P. Weibring, Earth Observing
Laboratory, National Center for Atmospheric Research, Boulder, CO80307, USA.A. G. Wollny, Max Planck Institute for Chemistry, D-55020 Mainz,
Germany.
D00F16 BAHREINI ET AL.: ORGANIC AEROSOL FORMATION IN TEXAS
17 of 17
D00F16