oregon state rail plan wa future demand is somewhat likely to exceed track capacity. a third...
TRANSCRIPT

March 31, 2014 www.camsys.com
Oregon State Rail Plan
Freight Rail Needs Assessment
prepared for
Oregon Department of Transportation
prepared by
Cambridge Systematics, Inc.
draft
report


draft
Oregon State Rail Plan
Freight Rail Needs Assessment
prepared for
Oregon Department of Transportation
prepared by
Cambridge Systematics, Inc. 555 12th Street, Suite 1600 Oakland, CA 94607
date
March 31, 2014


Oregon State Rail Plan DRAFT Freight Rail Needs Assessment
Cambridge Systematics, Inc. i
Table of Contents
3.0 Freight Rail Needs Assessment ........................................................................ 3-1
3.1 Physical Needs ............................................................................................ 3-1
3.2 Service Needs and Connectivity Gaps ................................................... 3-15
3.3 Operational Needs .................................................................................... 3-38
A. Class I Bottleneck Assessment Assumptions and Methodology ............. A-1
B. Data and Methodology for Updating Oregon CFF Data ............................ B-1
C. Inter-State and Inter-County Freight Rail Market Assessment Information by County in Oregon ................................................................. C-1
D. Description of “At-Risk” Rail Service by Railroad in Oregon .................D-1


Oregon State Rail Plan DRAFT Freight Rail Needs Assessment
Cambridge Systematics, Inc. iii
List of Tables
Table 3.1 Class I Track Infrastructure Needs and Opportunities in Oregon ....................................................................................................... 3-2
Table 3.2 Class I Signal System Needs and Opportunities in Oregon .............. 3-3
Table 3.3 Class I Train Operating Speed Needs and Opportunities in Oregon ....................................................................................................... 3-4
Table 3.4 State of Oregon – UP Rail Projects ......................................................... 3-7
Table 3.5 Summary of Non-Class I Conditions .................................................. 3-11
Table 3.6 Commodities That Typically Move in in Carload Service ............... 3-16
Table 3.7 Ton 10 Commonly Rail-Shipped Oregon Commodities .................. 3-28
Table 3.8 Top 5 Counties by “Potential” Increase in Rail Volumes, 2010 ....... 3-29
Table 3.9 Top 10 Commodities by “Potential” Rail Volume Growth in Oregon, 2010-2035 .................................................................................. 3-30
Table 3.10 Oregon Counties where Analysis Points to Economic Development Opportunities for Rail ................................................... 3-33
Table 3.11 Rail Lines at Risk for Abandonment 2013-2020 ................................. 3-36
Table B.1 Commodities Likely to be Moved as Rail Carloads ........................... B-3
Table C.1 Inter-State and Inter-County Freight Rail Market Assessment Information by County in Oregon ........................................................ C-2


Oregon State Rail Plan DRAFT Freight Rail Needs Assessment
Cambridge Systematics, Inc. v
List of Figures
Figure 3.1 Class I Rail Network Assessment Needs .............................................. 3-5
Figure 3.2 Inter-State and Inter-County Annual Total Rail Market (in Tonnage) by County in Oregon, 2010 ................................................. 3-20
Figure 3.3 Inter-State and Inter-County Annual Rail Volume (in Tonnage) by County in Oregon, 2010 ................................................................... 3-21
Figure 3.4 Inter-State and Inter-County Annual Rail Density (Tonnage/Mile) by County in Oregon, 2010 ...................................... 3-23
Figure 3.5 Inter-State and Inter-County Rail Utilization by County in Oregon, 2010 ........................................................................................... 3-24
Figure 3.6 Inter-State and Inter-County Change in Total Rail Market by County in Oregon, 2010-2035 ............................................................... 3-26
Figure 3.7 Inter-State and Inter-County “Potential” Rail Utilization by County in Oregon, 2035 ........................................................................ 3-27


Oregon State Rail Plan DRAFT Freight Rail Needs Assessment
Cambridge Systematics, Inc. 3-1
3.0 Freight Rail Needs Assessment
This chapter presents an assessment of freight rail needs and is divided into the following three sections:
Physical Needs. This section identifies Class I and non-Class I capacity needs and bottlenecks derived from system inventory information. It also includes needs identified directly by Burlington Northern Santa Fe Railway (BNSF) and Union Pacific Railroad (UP).
Service Needs and Connectivity Gaps. This section presents an assessment of the rail system with respect to the accessibility of the system for all commodities that could be served by rail today and in the future. It also identifies those parts of the system that have high- and low-growth potential in the future, as a point of consideration for future investment.
Operational Needs. This section presents a number of considerations for freight system planning and operations including planning passenger service on shared freight corridors, the relationship between Class I and non-Class I operators for local freight service, and the importance of maintaining and improving rail system safety.
3.1 PHYSICAL NEEDS
Class I Needs
Today, the Class I rail network in Oregon is in good condition. Both BNSF and UP regularly invest in track and other infrastructure improvements throughout the state to maintain the quality of their lines. All Class I rail lines in the state are capable of carrying the standard 286,000 (286K) pound freight rail cars, and all but the Oregon Trunk and Gateway subdivisions have Centralized Traffic Control (CTC) and are cleared for double-stacked containers (as described in the Freight and Passenger Rail System Inventory Tech Memo). However, as demand for rail services grows in the future, the freight rail system may require investments to serve that growth.
Using information collected in the rail inventory, an assessment of the potential of bottlenecks to form on rail lines in the future due to an increase in demand, without an increase in rail capacity, was made. The assessment identified opportunities for increasing rail capacity and eliminating bottlenecks in three ways - via siding and mainline track upgrades, signal system upgrades, or

Oregon State Rail Plan
3-2 Cambridge Systematics, Inc.
other upgrades to increase operating speeds. More information on the assumptions used in this assessment can be found in Appendix A.
Siding and Mainline Track Upgrades
The mainline bottlenecks analysis was limited to Oregon’s Class I mainlines, or primary rail network, because train volumes on the secondary rail network are not large enough to warrant a system-scale bottleneck analysis. The results of this mainline bottleneck analysis are shown in Table 3.1 and Figure 3.1. The green numbers in the map correspond to the numbers in Table 3.1.
Table 3.1 Class I Track Infrastructure Needs and Opportunities in Oregon
ID Segment /
RR Subdivisions Start End
Track Infrastructure Preliminary Needs and Opportunities
1 UP La Grande / Huntington
Hinkle Nampa, Idaho
Future demand is very likely to exceed track capacity. A Second Mainline Track, wherever feasible, may be considered after 2025, but may be required by 2033.
2 UP Portland Troutdale Hinkle Future demand is very likely to exceed track capacity. A Second Mainline Track, wherever feasible, may be considered after 2019 but may be required by 2027. As an interim solution, track ratio can be improved by Adding Sidings, wherever feasible.
3 UP Portland (via Kenton Line)
Peninsula Junction
Troutdale Future demand is somewhat likely to exceed track capacity. A Second Mainline Track, wherever feasible, may be considered after 2034.
4 UP Seattle Peninsula Junction
North Portland Junction
Future demand is somewhat likely to exceed track capacity. A Second Mainline Track, if feasible, may be considered after 2028 but may be required by 2035.
5 BNSF Oregon Trunk Bend Oregon Trunk
Junction
Sidings are very short, and may not be sufficient for all train operations. Siding Extensions may be considered.
6 BNSF Fallbridge North Portland Junction
Vancouver, WA
Future demand is somewhat likely to exceed track capacity. A Third Mainline Track, may need to be considered after 2033, although feasibility of this may be challenging due to crossing the Columbia River.
Signal System Upgrades
For each rail segment, the adequacy of the existing signal control system for operating current and future daily total train volumes was qualitatively assessed.

Oregon State Rail Plan DRAFT Freight Rail Needs Assessment
Cambridge Systematics, Inc. 3-3
Centralized Traffic Control (CTC) is the standard control system technology for high-volume lines, and therefore, the need for signal system upgrades was assessed for only locations those locations not already using CTC. The opportunities for eliminating the bottlenecks (if any) based on signal control system were identified. The results of this signal system bottleneck analysis are shown in Table 3.2 and Figure 3.1. The blue numbers in the map correspond to the numbers in Table 3.2.
Table 3.2 Class I Signal System Needs and Opportunities in Oregon
ID Segment /
RR Subdivisions Start End
Signal Control System Preliminary Needs and Opportunities
1 UP Portland Troutdale Hinkle ABS/DT can work in place CTC/1MT for current demand but as the future demand requires a second mainline track, the signal control system will require an upgrade to CTC/2MT at a later time.
2 BNSF Oregon Trunk Chemult Oregon Trunk
Junction
Current demand is on average 5 trains/day (low) and expected CAGR for freight trains is about 1.9% (low to moderate), but if faster volume growth is achieved, then an upgrade to CTC may be considered. However, it would cost less to upgrade the signal control system on a per mile basis, north of Bend (where ABS is currently used), than south of it (where No Signal / only a TWC is currently used).
NOTES: 1MT = One Mainline Track; 2MT = Two Mainline Tracks; ABS = Automatic Block Signals; CAGR = Compound Annual Growth Rate; CTC = Centralized Traffic Control; DT = Double Track; TWC = Track Warrant Control

Oregon State Rail Plan
3-4 Cambridge Systematics, Inc.
Other Upgrades, Including Increasing Speed
For each rail segment, train operating speed-related restriction statistics were collected to identify the opportunities for eliminating train operating speed based bottlenecks (if any). The results of this operating speed bottleneck analysis are shown in Table 3.3 and Figure 3.1. The purple numbers in the map correspond to the numbers in Table 3.3.
Table 3.3 Class I Train Operating Speed Needs and Opportunities in Oregon
ID Segment /
RR Subdivisions Start End
Train Operating Speed Preliminary Needs
1 UP La Grande / Huntington
Hinkle Nampa, Idaho
25% of the rail line miles are currently restricted to speeds <=25 mph due to track geometry. Impedes line capacity and service performance on this transcontinental link..
2 UP Brooklyn / Cascade
Eugene Chemult Between Oakridge and Chemult, heavy grade and tunnels currently restrict 57% of the rail line miles to speeds <=25 mph.
3 BNSF Oregon Trunk Chemult Oregon Trunk
Junction
Heavy grade between South Junction and Paxton and high track curvature restrict allowable maximum train speeds north of Madras. However, improved signaling and traffic control is likely to improve freight train speeds and capacity south of Bend.
4 BNSF Fallbridge Portland Union Station
Vancouver, WA
Increasing passenger and freight train volumes combined with slow junctions and bridge openings from waterborne traffic will require capacity improvements. Needs have been examined in the context of Cascades Corridor service.
5 UP Brooklyn E. Portland Oakridge Growing freight and passenger traffic over slow trackage may require improvement. Has been examined in Cascades Corridor studies.
6 UP “Portland Triangle” Segments
Congested area with poor track geometry and slow junctions hosting through and local passenger and freight traffic. Growing rail traffic volumes will require capacity and speed improvements.
NOTES: Dark Territory = no signal control; TWC = Track Warrant Control
These preliminary assessment results were presented to the State Rail Plan Steering Committee, a committee that both Oregon Class I operators sit on – BNSF and UP. During the presentation they generally concurred with the findings, and subsequently provided their own identification of their system needs in Oregon, noted in the following section.

Oregon State Rail Plan
Cambridge Systematics, Inc. 3-5
Figure 3.1 Class I Rail Network Assessment Needs
Note: Green numbers correspond to Table 3.1; Blue numbers correspond to Table 3.2; and Purple numbers correspond to Table 3.3.

Oregon State Rail Plan
3-6 Cambridge Systematics, Inc.
BNSF Identified Needs
BNSF is working through the process of identifying needs for their rail system in Oregon. At this point projects have been identified in several categories, but have not been prioritized, nor implementation schemes developed. BNSF is currently working through an outreach process with their major customers to understand their preferences and input on potential improvements that could benefit from public-private partnerships. BNSF’s potential projects fall into the following categories:
Projects that BNSF may submit for ConnectOregon in future rounds or that may be suitable for public-private partnerships. These projects also include intermodal and other terminal capacity issues where a supporting role by the public sector may be beneficial:
– Portland Intermodal Facility Improvements. Project would install Automated Gate System Technology at BNSF’s Portland Intermodal Facility to improve the cargo pick-up and delivery process for trucks. The project would increase truck productivity and efficiency while reducing congestion, noise, emissions, and fuel usage. Portland Intermodal Facility is an integral link in the supply chain that provides efficient transfer between the highway and rail modes for trailers and containers. Approximate cost estimate $4.9M
– Oregon Trunk and Gateway Subdivision Sidings and Siding Extensions. Install and extend sidings for meets/passes to increase capacity and velocity. For example, two sidings under consideration for extension are Moody and Merrill sidings. Moody siding is 4,330 feet long and located on the Oregon Trunk Subdivision at Mile Post (MP) 5.4 south of Wishram. Merrill siding is 2,400 feet long and is located on the Gateway Subdivision at MP 15.4 south of Klamath Falls. Sidings would be extended to 7,500 feet or greater.
– Power North and South Switches at Lake Yard. Train movement through Lake Yard is currently managed by hand-thrown switches causing slow and impeded movement for switching, mainline freight and Amtrak trains into and through Lake Yard. The proposed project would replace hand-thrown switches between the mainline and yard tracks with automated power switches.
– Willbridge Crossover. Upgrade from No. 11 power double crossovers. Project would increase train velocity by allowing higher train speeds through the crossovers. With federal funding, ODOT is preparing the PE/NEPA project to 30% design with expected completion March 2014.
– Bieber Junction, Klamath Falls. Power switches at Bieber Junction where BNSF and Union Pacific connect to improve velocity.

Oregon State Rail Plan DRAFT Freight Rail Needs Assessment
Cambridge Systematics, Inc. 3-7
Identification of multistate corridor needs where an ODOT supporting role would be beneficial:
– Oregon’s active participation in Great Northern Corridor coalition. This provides the state with the opportunity to work collaboratively in corridor-level improvement opportunities, needs and strategies by partnering with coalition members which include state DOT’s and major ports. ODOT provided a letter of support for the Great Northern Corridor Multistate Planning and Development Study grant application to U.S. DOT’s Multistate Corridor Operations and Management Program. Funding was awarded and analysis will begin in late 2013. A second grant application that would expand on the work of the first study was submitted and funded in 2013. Oregon’s participation in the north/south corridor is also important.
UP Identified Needs
UP provided this study the projects identified in UP’s 5-Year Plan. The specific timing and funding commitments for these projects are confidential.
Table 3.4 State of Oregon – UP Rail Projects
Project Location Description
Estimated Cost In Progress
$0-10M $10-20M >$20M
North Portland Junction (UP & BNSF)
North Portland
Track Realignment – speed increase
X X
6 MPH Curves Portland Track Realignment – speed increase
X
Mosier 2 MT Mosier New 2MT section on Portland Sub – additional capacity
X
Hinkle Gravel Tracks
Hermiston
New tracks for bulk staging – additional capacity/fluidity at major yard
X
Milam-Gibbon 2 MT Milam New 2MT section on LaGrande Sub – additional capacity
X X
Graham Line Midpoint Siding
East Portland New siding on Graham Line for meets/pass – increased fluidity
X X
East Portland Connection
East Portland Additional connection to Graham Line – increased fluidity
X X

Oregon State Rail Plan
3-8 Cambridge Systematics, Inc.
Project Location Description
Estimated Cost In Progress
$0-10M $10-20M >$20M
Hinkle 2nd Trim Lead
Hermiston Additional capacity/fluidity at major yard
X
CTC Crates to Biggs
The Dalles Signal improvements – increased fluidity
X
Source: UP
NOTES: MPH = Miles Per Hour; 2MT = Two Mainline Tracks
Non-Class I Needs
Traditionally the major operational issues facing railroads include speed restrictions, weight restrictions, and vertical clearance restrictions often caused by bridges and tunnels. As shown in the rail inventory, these issues are most prominent for the non-Class I railroads in Oregon (i.e. regional and short line railroads), and often their inability to reach one or more of the required dimensions affects their performance, limits their growth and sometimes threatens their existence. For example, many non-Class I railroads in the state are not capable of handling 286K loads, placing the shippers on those lines at an economic disadvantage due to the fact that they are unable to fully exploit the efficiencies of rail for heavy commodities.
This section reviews non-Class I railroad needs through several lenses including weight restriction, track class, bridge conditions, number of carloads and whether the railroads were previously assessed to be at risk. Each of the factors examined is shown in Table 3.5 and discussed below.
Percent Non-Class I Mileage that is 286K-Capable. Rail lines that are not286K compliant limit a railroad’s ability to serve certain types of loads andconnectivity to Class I railroad (as all Class I railroads in Oregon are 286Kcompliant). The 286K information from Table 3.5 was obtained from asurvey conducted by ODOT in 2006, updated using the most recent data.
Percent Non-Class I Mileage that is FRA Class 2+1. Track class impacts arailroad’s ability to serve certain types of loads and to achieve higher speeddelivery. Portions of rail lines that do not meet FRA track Class 2 standards(25 mph operating speed) can become chokepoints. It is ODOT’s goal, thatwhenever possible, to upgrade track to FRA Class 2 when ODOT is a fundingpartner of an improvement project. Information on track class was also
1 Definitions for FRA Track Class are found in the Code of Federal Regulations. These track classes dictate maximum operating speeds for freight and passenger trains on a segment of track. https://www.gpo.gov/fdsys/pkg/CFR-2011-title49-vol4/xml/CFR-2011-title49-vol4-sec213-9.xml

Oregon State Rail Plan DRAFT Freight Rail Needs Assessment
Cambridge Systematics, Inc. 3-9
determined from the 2006 survey carried out by ODOT, updated with the most recent data.
Percent Non-Class I Mileage that uses 110+lb Rail. Rail profiles that can support 110 lb./yard of rail are preferred to safely and economically support 286K operations. Therefore this factor can be looked at in conjunction with 286K information. Information on 110 lb. rail was also determined from the 2006 survey updated with the most recent data.
Number of Bridges in Poor Condition. The existing conditions of bridges located on 15 short lines were assessed in 2008 as part of the 2010 Oregon Rail Study. The evaluation looked at load capacity and life spans of the bridges. The overall condition and suitability of a rail line to carry loads directly relates to the ability of bridges on the line to carry loads. This information will help determine the line’s viability in the future should bridge(s) not be improved.
Number of Carloads and Percent Total of Non-Class I Carloads. Another important piece of information is the number of carloads each line supports. Understanding the current utilization of a railroad may help understand the future demand and needs on the line. This may also provide an indication of where investments may potentially result in gains in carload volume. Information on number of carloads was provided by ODOT for 2011.
At-Risk Segments. At-risk rail lines were identified as part of the 2010 Rail Study that assessed the vulnerability of non-Class I rail lines at the peak of the economic recession. Though conditions may have improved since 2009, this information helps link system condition, volume and vulnerability of a line and to determine if future investments are warranted. Later in this Tech Memo, Table 3.11 presents updated information provided by ODOT on their 2013 assessment of at-risk segments in the state.
Table 3.5 shows great variability in conditions and needs across the non-Class I railroads. Larger railroads, such as Portland & Western Railroad (PNWR), Willamette & Pacific Railroad (WPRR), Central Oregon & Pacific Railroad (CORP) and Coos Bay Rail Link (CBR), in general, have better track conditions than other non-Class I railroads, with the majority of the track mileage at ideal weight and speed standards (286K-capable, FRA Class 2 +, 110+lb.). Smaller railroads, however, have less desirable conditions, as entire lines are unable to meet any of the weight and speed standards. Examples of short lines that do not meet any of the conditions criteria for any portion of the line include Lake Railway (LRY), Wyoming & Colorado Railroad (WYCO), Hampton Railway, Inc (HLSC) and Longview Portland & Northern Railway (LPN).
Rail line condition is closely linked to the number of carloads on the line; lines in better condition are likely to attract more customers, and the revenue can in turn be used to invest in the lines. Examples of lines that have good conditions and high carload volumes include PNWR, WPRR and CORP. Lines that are in poor condition also suffer from low carload volumes, or no volumes in some cases.

Oregon State Rail Plan
3-10 Cambridge Systematics, Inc.
However, some lines are able to attract a significant amount of carload traffic despite insufficient conditions on the lines. Specifically, the PCC carried 18 percent of non-Class I carload volumes, though only 36 percent of its tracks are in “adequate” condition.

Oregon State Rail Plan DRAFT Freight Rail Needs Assessment
Cambridge Systematics, Inc. 3-11
Table 3.5 Summary of Non-Class I Conditions
Railroad
Standard Carrier
Alpha Code (SCAC)
Route Miles in Oregon
% Non-Class I Mileage that
are 286K-Capable
% Non-Class I Mileage
that is FRA Class 2+
% Non-Class I Mileage that uses 110+ lb.
Rail
# Bridges in Poor Condition
(2008)
Carloads (2011)
% of Total Non-Class I
Carloads At Risk Segments
Albany & Eastern Railroad
AERC 72 100% 0% 50% 3 3,011 3% Sweet Home Branch – Little traffic
Central Oregon & Pacific Railroad
CORP 247 100% 98% 80% 21 16,113 14% Ashland to Montague, CA – little trafifc
City of Prineville Railway
COP 18 100% 100% 94% 0 899 1%
Coos Bay Rail Link
CBR 133 100% 88% 98% 70 194 0% Began operations in October 2011
Hampton Railwayb
HLSC 5 0% 0% 0% 0 0 0% Entire Line – little traffic
Idaho Northern & Pacific Railroad
INPR 20 0% 100% 96% 1 2,367 2%
Klamath Northern Railway
KNOR 11 100% 0% 0% 0 2,354 2%
Lake Railway (miles in OR only)
LRY 15 0% 0% 0% 0 1,501 1% Entire line- little traffic
Longview Portland & Northern Railway
LPN 3.3
(Inactive) 0% 0% 0% N/A 0 0% Entire line – no traffic

Oregon State Rail Plan
3-12 Cambridge Systematics, Inc.
Railroad
Standard Carrier
Alpha Code (SCAC)
Route Miles in Oregon
% Non-Class I Mileage that
are 286K-Capable
% Non-Class I Mileage
that is FRA Class 2+
% Non-Class I Mileage that uses 110+ lb.
Rail
# Bridges in Poor Condition
(2008)
Carloads (2011)
% of Total Non-Class I
Carloads At Risk Segments
Mount Hood Railroad
MH 21 100% 100% 1% 0 448 0%
Oregon Pacific Railroadb
OPR 13 100% 0% 4% 2 1,038 1% Liberal to Mollala – track removed
Palouse River & Coulee City Railroadb
PCC 32 36% 36% 36% 1 20,816 18%
Peninsula Terminal Company
PT 1 100% 0% 0% N/A 2,694 2%
Port of Tillamook Bay Railroadb
POTB 84 0% 0% 94% N/A 362 0% Out of service – storm damage
Portland & Western Railroad b
PNWR 447 98% 89% 72% 11 39,511 33% Astoria District – no customer; Forest Grove District – Poor condition
Portland Terminal Railroad
PTRC 0.5 100% 0% 100% N/A N/A N/A
Rogue Valley Terminal Railroada
RTV 12 33% 0% 0% N/A 557 0%
Wallowa Union Railroad
WURR 63 0% 0% 20% 0 0 0% Entire line – little traffic
Willamette & Pacific Railroad
WPRR Mileage included in PNWR
90% 78% 72% 44 24,327 21% Bailey District – Abandoned in 2011; Dallas District – no customer

Oregon State Rail Plan DRAFT Freight Rail Needs Assessment
Cambridge Systematics, Inc. 3-13
Railroad
Standard Carrier
Alpha Code (SCAC)
Route Miles in Oregon
% Non-Class I Mileage that
are 286K-Capable
% Non-Class I Mileage
that is FRA Class 2+
% Non-Class I Mileage that uses 110+ lb.
Rail
# Bridges in Poor Condition
(2008)
Carloads (2011)
% of Total Non-Class I
Carloads At Risk Segments
Willamette Valley Railwayb
WVR 33 50% 0% 13% 4 923 1% Entire line – little traffic
Wyoming & Colorado Railroad
WYCO 25 0% 0% 0% 0 1,156 1% Entire line – little traffic
Source: ORNL Network with Cambridge Systematics Analysis; Oregon Department of Transportation - Rail Division; 2010 Oregon Rail Study
aThe WCTU Railway recently changed its name to Rogue Valley Terminal Railroad Corp (RVTR). In addition, the non-Class I’s holding company has been renamed CCT Rail System Corp. In December, RVTR Rail Holdings L.L.C. acquired the WCTU Railway from Berkshire Hathaway Inc. subsidiary Marmon Transportation Services L.L.C. The Surface Transportation Board had required Marmon to divest two short lines that Berkshire obtained in 2010 when it acquired BNSF Railway Co. Progressive Railroading, 4/1/2013
bDenotes a railroad with line segments “at-risk” by ODOT in their 2013 assessment.

Oregon State Rail Plan
3-14 Cambridge Systematics, Inc.
Additional needs of particular non-Class I railroads include:
Portland & Western Railroad. The PNWR was Oregon’s largest non-Class I railroad from a carload traffic perspective in 2011 (33 percent). PNWR’s many branch lines carry commodities including aggregates, bricks and cement, chemicals, construction and demolition debris, food, forest products, metallic ores and minerals, steel and scrap. While the line is mostly 286K-capable, 11 percent of trackage is under 25 mph, and 28 percent of trackage is 110 lb. and lighter. Out of its 125 bridges, 11 are poor condition. Portions of the rail line from Hillsboro to Forest Grove are in poor condition and low traffic volumes on this branch do not justify reinvestment. Another portion, the Astoria District, has no active customers located on the last 25 miles; however, the Port of Astoria has taken control of Tongue Point and continues to pursue industrial development opportunities.
Willamette & Pacific Railroad. The WPRR connects with UP’s Pacific Northwest Corridor and traffic consists primarily of forest/paper products, scrap and steel. The line is mostly in good condition with rail strength that varies between 75 lbs. and 136 lbs. A portion of the Bailey District was approved for abandonment in 2013, and the Dallas District is currently used for car storage after the last lumber mill on the line closed in 2009. WPRR also suffers from under-maintained bridges, as 44 out of its 158 bridges are in poor condition.
Central Oregon & Pacific. The CORP is a railroad that operates between Eugene and Northern California, providing north-south service moving lumber, logs and plywood of national account lumber companies. The line has fairly well maintained tracks that can support 286K cars and operates at speeds of 25 mph or greater, but it also has a high number of bridges in poor condition. A portion of the line from Ashland to Montague has not operated since 2009 due to high pricing actions. A federal grant awarded in 2013 will result in reopening this line segment for traffic in 2014.
Rogue Valley Terminal Railroad. This railroad was known as the WCTU Railway prior to April 2013. While the line currently transports wood products, asphalt, and fly ash, under its new name and ownership it may upgrade existing track infrastructure to heavier rail, and try to attract other potential customers such as Boise Cascade and other area plywood manufacturers. The future of this line may be very different from what it currently is.
Coos Bay Rail Link. The CBR was reopened in October 2011 after several years of closure due to deferred maintenance, including 70 bridges in poor condition. The line received significant funding for repairs and maintenance from sources such as TIGER, ConnectOregon, ODOT and others. When fully restored, the line will have a mix of FRA Class 2 and 3 track. In the first full year of operation, 2012, the line transported 2,501 carloads.
Oregon State Rail Plan DRAFT Freight Rail Needs Assessment
Cambridge Systematics, Inc. 3-15
All other non-Class I railroads with poor conditions and little to no traffic. The remaining rail lines that are in poor condition also suffer from having little to no traffic. It is hard to say whether one caused the other, but some of the decreases in traffic are due to the decreased activity by traditional rail-oriented industries. For instance, the Hampton Railway was built to support the lumber industry, but with the decline of logging in Oregon, especially after the housing slump, many factories closed. In general, reliance on one shipper or one type of industry creates great risks for shortlines and thus strategies that can help diversify customers may be needed before or as part of investments to upgrade the lines.
3.2 SERVICE NEEDS AND CONNECTIVITY GAPS As previously described, the freight rail system in Oregon consists of an extensive network of Class I and non-Class I rail lines. In order to assess the need for rail service in Oregon, and whether or not there are any service or connectivity gaps in the state, an analysis of recent (2010) and projected (2035) freight volumes and density was conducted at the county-level. Data for this analysis was primarily drawn from the Oregon Commodity Flow Forecast (CFF), produced as part of the 2011 Oregon Freight Plan, and updated to reflect the 2008-2009 recession. Overlaid onto the rail network in Oregon, this data offers a county-level perspective on the carload freight rail market and provides an indication as to whether projected 2035 volumes will be sufficient to sustain rail operations in the future.
This assessment focuses on examining the linkage between economic activity and potential rail traffic in a county. It thus does not reflect rail traffic that neither originates nor terminates in a county. In some cases, for example with Class I mainlines, through traffic represents the vast majority of the volume. Furthermore, the analysis does not indicate the performance of specific rail operators, particularly in counties with multiple carriers. A simplifying assumption that was used is that the traffic associated with a county will access the rail system in that same county; this is not always the case, but it usually holds true for all but intermodal traffic. Further information on the data and methodology for creating the updated Oregon CFF is in Appendix B.
A number of terms are used in this assessment including:
Total rail market - refers to those movements by either truck or rail that have a minimum county-to-county distance of 150 miles, or have an origin or destination outside of Oregon.
“Carload-friendly” commodities - as indicated in Table 3.6, these are commodities that are efficiently moved by railroads as carloads.

Oregon State Rail Plan
3-16 Cambridge Systematics, Inc.
Table 3.6 Commodities That Typically Move in in Carload Service
STCC 2-digit Code STCC 2-Digit Commodity Description
1 Farm Products
8 Forest Products
10 Metallic Ores
11 Coal
13 Crude Petroleum
14 Non-metallic Minerals
24 Lumber/Wood
26 Pulp/Paper
28 Chemicals
29 Petro/Coal Products
30 Rubber/Plastics
32 Concrete/Glass
33 Primary Metals
40 Waste/Scrap
48 Hazmat Waste
49 Hazmat Products
NOTE: Standard Transportation Commodity Code (STCC) is a seven digit numeric code representing 38 commodity groupings developed in the 1960s, maintained and published by Association of American Railroads (AAR), and issued in the annual Railroad Waybill data. The 38 commodity groupings are represented using a two digit numeric code.
Rail utilization - is the rail volume percentage share of total rail market volume.
Rail volume density - for a county, this equals the rail volume in tonnage leaving or entering the county divided by rail mileage in that county.
“Potential” rail volume - refers to a hypothetical 2035 scenario with the following definition:
– Total rail market volume will be determined by the updated Oregon CFF data, this will provide the current value, future value and the change in total rail market volume; and
– Rail utilization of the total rail market by county and commodity will be assumed to be the higher of the following two values: (1) the 2010 rail utilization by county and by commodity as given by the updated Oregon CFF data, or (2) the most recent (2011) national average rail utilization by commodity for an equivalent commodity in the most recent Freight Analysis Framework data (FAF 3.4).
The following are the key findings, which are discussed further in this section:

Oregon State Rail Plan DRAFT Freight Rail Needs Assessment
Cambridge Systematics, Inc. 3-17
Freight rail market and rail volumes by county. There is likely a large market for carload freight rail in Oregon that is not currently being served by rail today. These volumes are currently carried by truck and may continue to be carried by truck in the future absent targeted infrastructure investments that would enhance the efficiency of using rail.
Commodities with high current rail volumes. Rail commodities in Oregon that have high volumes reflect the state’s economy and consist of lumber/wood, chemicals, concrete/glass, pulp/paper, waste/scrap, hazmat products, coal, primary metals and non-metallic minerals. Among these commodities, opportunities exist for further increasing rail utilization for chemicals, concrete/glass, etc., farm products, coal and non-metallic minerals. The best approach to increasing utilization for these commodities can only be determined through an examination of the logistics of each industry and its place in Oregon’s economy. However, from a high level, concentrating shipping activity at specific locations within these counties has been identified as one of several potential strategies for achieving increased rail utilization.
Commodities with high “potential” rail volume growth. It is essential that rail lines be prepared to handle projected high “potential” growth commodities. Concrete/glass, farm products, chemicals, waste/scrap and lumber/wood are the top commodities based on overall rail tonnage growth. Waste/scrap, lumber/wood and chemicals top the list based on growth in rail volumes due to changes in rail market volume, alone, with rail utilization remaining the same as the current day. Concrete/glass, farm products and chemicals top the list based on additional growth that is likely due to rail utilization increases.
At the same time, lines that are dependent on declining rail commodities such as non-metallic minerals and coal need to look to diversifying their commodity base to avoid possible “at-risk” situations in the future.
Port connectivity to freight rail. Many of Oregon’s Coast and Columbia River ports are served by rail. The Port of Tillamook Bay’s rail service was severed during a storm in 2007, and the cost of full restoration has exceeded the available financial resources. The only county located on the coast that lacks a rail-served port is Curry County. This county does not have any ports with significant commercial freight activity.
In general, assessing freight rail-related traffic potential for rail-served ports poses a particular challenge, in that they typically compete for a range of cargoes with other ports in the Pacific Northwest. These cargoes often have little or no association with industry in Oregon or the county where the port is located, and thus macroeconomic county and even state-level forecasts do not serve as a useful guide to projecting potential volumes. For the port that secures a particular export or import flow, the rail carrier serving the port

Oregon State Rail Plan
3-18 Cambridge Systematics, Inc.
effectively gains a traffic windfall that is impossible to predict without an understanding of the situational specifics.
Economic development and freight rail investment needs and opportunities. Klamath, Umatilla, Union and Wasco Counties have significant rail infrastructure but low rail volume density. These counties present opportunities for economic development in order to improve rail transportation asset utilization.
Some Oregon counties, including Baker, Gilliam, Lincoln and Yamhill, have low to moderate rail mileage but high rail volume density and moderate to high growth in rail volumes. Accommodation of expected growth may require investment in rail system capacity.
Freight rail service risks and impacts. Aside from the nine counties that are served by one short line, this assessment does not address the extent to which the closure of an “at-risk” line will impact the county’s access to rail freight transportation. This would require additional research, including a more detailed examination of the rail-oriented industrial sectors that exist at present or might develop in the future in the affected counties.
Freight Rail Market and Rail Volumes by County
Recent (2010) and future (2035) total rail market volumes and rail volumes by county in Oregon were estimated. A table showing this data along with related information including serving carriers, rail mileage, rail volume density, projected compounded annual growth rates in rail volumes and current top rail commodities is included in Appendix C.
Figure 3.2 indicates 2010 total rail market volumes (i.e. truck and rail tonnage of “carload friendly” commodities) in Oregon, in terms of tonnage originated and/or terminated by county. The figure shows the various rail lines that serve each county. Today, four counties - Curry, Grant, Harney and Wheeler - lack any rail mileage, and do not have any direct access to the rail network; therefore any volumes in those counties can be assumed to be carried by truck. All other counties are served by a Class I and/or one or more non-Class I railroad. The counties with the highest rail market volumes are mainly located along the I-5 highway corridor due to the presence of major population centers and goods movement dependent industrial sectors.
Figure 3.3 shows 2010 rail volumes in Oregon, in terms of tonnage originated and/or terminated by county. Multnomah County has the highest rail volumes of about 17.4 million tons annually. The rail volumes were far lower for the nine counties that follow by rank – Lane, Douglas, Baker, Linn, Gilliam, Morrow, Yamhill, Lincoln and Klamath. All of these counties have traditional rail-reliant industries. Annual rail volumes range from about 2.8 million tons annually for Lane in 2nd place down to about 0.9 million tons annually for Klamath in 10th place. Although, most counties are served by rail, Figure 3.3 indicates that in

Oregon State Rail Plan DRAFT Freight Rail Needs Assessment
Cambridge Systematics, Inc. 3-19
2010 the rail volumes were concentrated in fewer counties than the total rail market volumes.

Oregon State Rail Plan
3-20 Cambridge Systematics, Inc.
Figure 3.2 Inter-State and Inter-County Annual Total Rail Market (in Tonnage) by County in Oregon, 2010
Source: 2011 Oregon Freight Plan Commodity Flow Forecast with Adjustments using FHWA FAF 3.4 Data.
NOTE: Flows indicated in this map include those entering or leaving Oregon counties through truck or rail, but do not include flows within or through a county. The flows are also limited to commodities that are likely to be moved as rail carloads and origin-destination pair travel distances by rail of over 150 miles.

Oregon State Rail Plan DRAFT Freight Rail Needs Assessment
Cambridge Systematics, Inc. 3-21
Figure 3.3 Inter-State and Inter-County Annual Rail Volume (in Tonnage) by County in Oregon, 2010
Source: 2011 Oregon Freight Plan Commodity Flow Forecast with Adjustments using FHWA FAF 3.4 Data. 2010 rail tonnage data for Clatsop, Sherman and Wallowa are missing.
NOTE: Flows indicated in this map include those entering or leaving Oregon counties through rail, but do not include flows within or through a county. The flows are also limited to commodities that are likely to be moved as rail carloads and origin-destination pair travel distances by rail of over 150 miles.

Oregon State Rail Plan
3-22 Cambridge Systematics, Inc.
Figure 3.4 shows 2010 rail volume density in Oregon in terms of tonnage originated and/or terminated per mile of rail line by county. Multnomah County had the highest rail volume density of about 140.9 thousand tons per mile annually. Morrow, Lincoln, Gilliam, Yamhill, Baker, Coos, Douglas, Lane, Linn and Columbia Counties follow by rank and have far lower rail volume densities but higher than 10 thousand tons per mile annually (~100 carloads per mile annually, a measure of rail line viability).
The low rail volume density in the other counties in Oregon only indicates that these counties are currently not sustaining sufficient rail traffic on their own; it does not suggest an “at-risk” traffic situation. The reason is that the rail volume density by county does not include movements through the county. Traffic from outside a county’s rail market may contribute to support rail lines in that county. For example, Clackamas and Marion Counties are likely to have higher total rail volume densities due to contributions from through traffic operations in the northern Willamette Valley.
Figure 3.5 shows 2010 rail utilization. Multnomah County had the highest rail utilization percentage of about 50 percent. The rail utilization levels drop rapidly (but less prominently than the rail volumes) for the nine counties that follow by rank - Yamhill, Baker, Gilliam, Morrow, Columbia, Lincoln, Linn, Douglas and Lane. Their utilization levels range from 45 percent for Yamhill in 2nd place down to 14 percent for Lane in 10th place. Nearly half of the counties in Oregon have very low rail utilizations, including Marion, Jackson, Washington, Deschutes and Josephine Counties. Therefore, there is still a large part of the rail market that is not currently served by rail.
Rail utilization for a county is not dependent on the presence of “at-risk” rail mileage, unless all mileage in the county is at “at-risk.” Nevertheless, the counties in Oregon with “at-risk” rail mileage currently have lower rail utilization, averaging2 approximately 10.3 percent, where as those without “at-risk” mileage have a higher rail utilization average of about 14.3 percent.
2 The average simply uses the rail market shares by county; they were not weighted by tons originating/terminating by county, as such a weighting would introduce errors due to counting inter-county movements twice.

Oregon State Rail Plan DRAFT Freight Rail Needs Assessment
Cambridge Systematics, Inc. 3-23
Figure 3.4 Inter-State and Inter-County Annual Rail Density (Tonnage/Mile) by County in Oregon, 2010
Source: 2011 Oregon Freight Plan Commodity Flow Forecast with Adjustments using FHWA FAF 3.4 Data. 2010 rail volumes data in tonnage for the following counties is missing: Clatsop, Sherman and Wallowa. Hence, these appear to have zero rail tonnage density in the map.
NOTE: Flows indicated in this map include those entering or leaving Oregon counties through rail, but do not include flows within or through a county. The flows are also limited to commodities that are likely to be moved as rail carloads and origin-destination pair travel distances by rail of over 150 miles.

Oregon State Rail Plan
3-24 Cambridge Systematics, Inc.
Figure 3.5 Inter-State and Inter-County Rail Utilization by County in Oregon, 2010
Source: 2011 Oregon Freight Plan Commodity Flow Forecast with Adjustments using FHWA FAF 3.4 Data. 2010 rail volumes data in tonnage for the following counties is missing: Clatsop, Sherman and Wallowa. Hence, these appear to have zero rail utilization in the map.
NOTE: Flows indicated in this map include those entering or leaving Oregon counties through truck or rail, but do not include flows within or through a county. The flows are also limited to commodities that are likely to be moved as rail carloads and origin-destination pair travel distances by rail of over 150 miles.

Oregon State Rail Plan DRAFT Freight Rail Needs Assessment
Cambridge Systematics, Inc. 3-25
Figure 3.6 indicates the percent change in total rail market by county in Oregon between 2010 and 2035. The pattern of change looks somewhat different from that in Figure 3.2. The growth anticipated in Washington County is about 111 percent, which is significantly higher than the remaining counties. The next top nine counties in terms of the percentage change are: Deschutes, Clackamas, Yamhill, Crook, Jackson, Josephine, Gilliam, Polk and Umatilla. Their anticipated increases in volume range from 71 percent to 88 percent.
Figure 3.7 shows 2035 rail utilization. This looks quite different from Figure 3.5. Most counties in Oregon are projected to have a net increase in rail utilization in the range of 5-10 percent. A slight net decline in rail utilization is projected in Morrow, Multnomah and Columbia Counties due to decline in the total rail market for some commodities in these counties. However, growth in shale oil exports may increase tonnage in Columbia County.
Overall in the state, the “potential” growth in rail volumes between 2010 and 2035 is anticipated to be about 32.7 million tons, split as 8.3 million inbound, 11.4 million outbound and 13.0 million intra-Oregon flows3.
3 The summation of county statistics for change in rail volumes would count inter-county movements twice, as in a paired inter-county movement, an outbound move for an origin county is also an inbound move for a terminating county. Therefore, a state total for the change was computed overcoming this barrier.

Oregon State Rail Plan
3-26 Cambridge Systematics, Inc.
Figure 3.6 Inter-State and Inter-County Change in Total Rail Market by County in Oregon, 2010-2035
Source: 2011 Oregon Freight Plan Commodity Flow Forecast with Adjustments using FHWA FAF 3.4 Data.
NOTE: Flows indicated in this map include those entering or leaving Oregon counties through truck or rail, but do not include flows within or through a county. The flows are also limited to commodities that are likely to be moved as rail carloads and origin-destination pair travel distances by rail of over 150 miles.

Oregon State Rail Plan DRAFT Freight Rail Needs Assessment
Cambridge Systematics, Inc. 3-27
Figure 3.7 Inter-State and Inter-County “Potential” Rail Utilization by County in Oregon, 2035
Source: 2011 Oregon Freight Plan Commodity Flow Forecast with Adjustments using FHWA FAF 3.4 Data.
NOTE: Flows indicated in this map include those entering or leaving Oregon counties through truck or rail, but do not include flows within or through a county. The flows are also limited to commodities that are likely to be moved as rail carloads and origin-destination pair travel distances by rail of over 150 miles.
0-10%
11%
12-14%
15-25%
>25% (max 48% - Yamhill Co.)

Oregon State Rail Plan
3-28 Cambridge Systematics, Inc.
Commodities with High Current Rail Volumes
In 2010, the top ten commodities most commonly shipped by rail in Oregon, and their respective rail utilization are shown in Table 3.7. The top commodities in 2010 by county in Oregon are indicated in Table C.1 of Appendix C.
Table 3.7 Ton 10 Commonly Rail-Shipped Oregon Commodities
Rank Commodity 2010 Actual Rail Volume (’000 tons)a
2010 Actual Rail
Utilization
2010 “Potential” Rail Volume (’000
tons)b
2010 “Potential” Rail Utilization
Difference between “Potential” and Actual Rail Volume (’000 tons)
1 Lumber/wood 10,111 38% 10,294 39% 183
2 Chemicals 7,099 53% 7,978 59% 879
3 Concrete/glass 4,178 9% 7,222 15% 3,044
4 Pulp/paper 3,622 59% 3,814 62% 192
5 Waste/scrap 3,407 34% 3,587 35% 180
6 Farm products 2,493 11% 4,021 18% 1,528
7 Hazmat products
2,165 100% 2,165 100% 0
8 Coal 1,571 27% 3,223 55% 1,652
9 Primary metals 1,056 42% 1,117 44% 61
10 Non-metallic minerals
341 22% 771 50% 431
Source: 2011 Oregon Freight Plan Commodity Flow Forecast with Adjustments using FHWA FAF 3.4 Data.
a2010 actual rail volume in the current year is based on the current total rail market and the current actual rail utilization.
b2010 “Potential” rail volume in the current year is based on the current total rail market and hypothetical rail utilization.
NOTE: Flows indicated in this table include those entering or leaving Oregon but do not include flows through the State. The flows are also limited to commodities that are likely to be moved as rail carloads and origin-destination pairs of over 150 miles.
As shown in Table 3.7, there exist opportunities for increasing rail utilization within the current rail market for concrete/glass, coal, farm products, chemicals and non-metallic minerals. The particular approaches to increasing utilization for these commodities can only be determined through an examination of the supply chain logistics of the particular industries in Oregon. However, from a high level, rail aggregation facilities for these commodities were assessed. The top five counties in terms of the 2010 “potential” increase in rail volumes and therefore also potential aggregation locations by commodity are shown in Table 3.8. The table indicates the “potential” increase in rail volume and the corresponding rail volume density by commodity and by top county.

Oregon State Rail Plan DRAFT Freight Rail Needs Assessment
Cambridge Systematics, Inc. 3-29
While no county’s single commodity meets the rule of thumb of 10 thousand tons per mile annually, which equates to potential rail line viability, multiple commodities within counties may have potential for shared aggregation facilities which would generate 10 thousand tons per mile annually.
Table 3.8 Top 5 Counties by “Potential” Increase in Rail Volumes, 2010
Rank
Top Counties by Commodity with Current High Rail Utilization Increase Opportunity
Concrete/ glass Coal Farm products Chemicals Non-metallic
minerals
1 Marion (571.3/4.7) Marion (249.1/2.0) Marion (284.9/2.3) Washington (130.6/1.3)
Multnomah (62.4/0.5)
2 Lane (553.1/2.5) Lane (236.3/1.1) Lane (267.5/1.2) Marion (104.9/0.9) Lane (60.6/0.3)
3 Jackson (387.4/5.3) Multnomah (227.5/1.8)
Jackson (216.1/3.0) Multnomah (84.1/0.7)
Marion (59.8/0.5)
4 Josephine (263.2/7.1) Jackson (183.2/2.5) Douglas (138.6/1.0) Jackson (83.3/1.1) Washington (50.4/0.5)
5 Coos (236.9/6.5) Washington (134.1/1.3)
Deschutes (126.1/2.0)
Lane (81.0/0.4) Jackson (50.1/0.7)
Source: 2011 Oregon Freight Plan Commodity Flow Forecast with Adjustments using FHWA FAF 3.4 Data.
NOTES: Among the numbers in the parentheses (X/Y), X refers to “potential” increase in rail volumes in thousands of tons in the current year and Y refers to the rail volume density corresponding to the “potential” increase in thousands of tons per mile in the current year. Rule of thumb, 10 thousand tons per mile annually equates to approximately 100 carloads per mile annually, and is a measure of rail line viability.
Flows indicated in this table include those entering or leaving Oregon but do not include flows within or through a county. The flows are also limited to commodities that are likely to be moved as rail carloads and origin-destination pairs of over 150 miles.
Oregon State Rail Plan
3-30 Cambridge Systematics, Inc.
Commodities with High “Potential” Rail Volume Growth
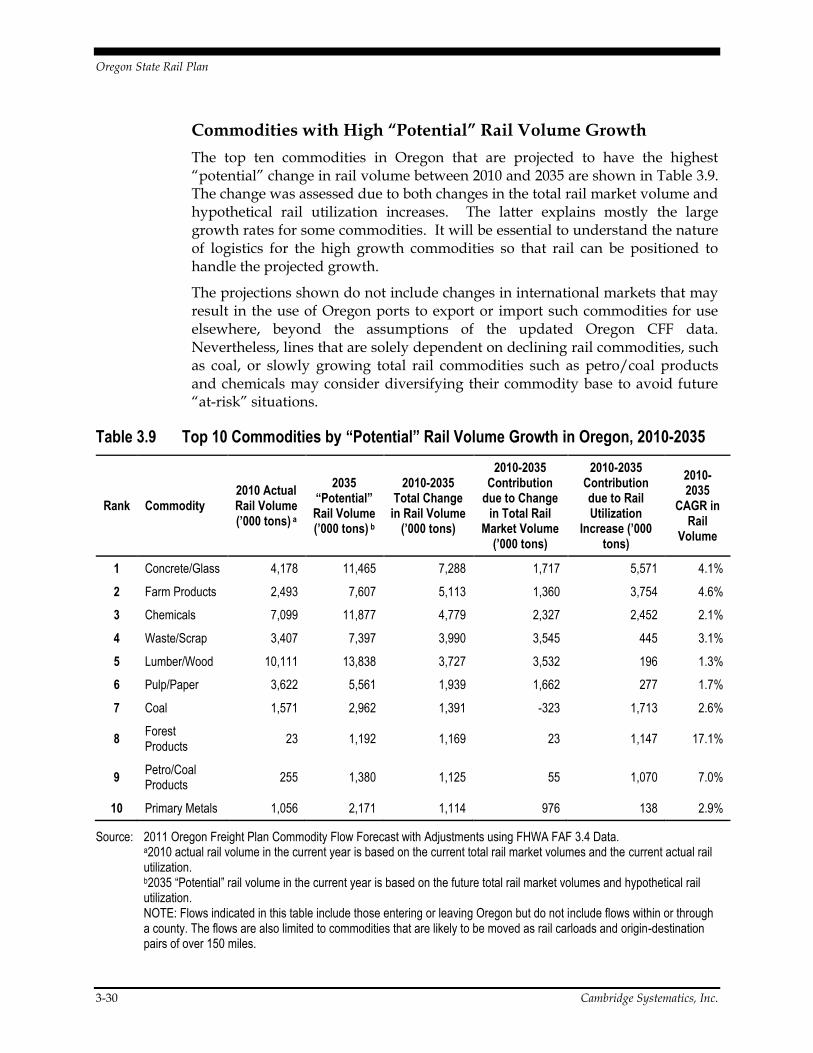
The top ten commodities in Oregon that are projected to have the highest “potential” change in rail volume between 2010 and 2035 are shown in Table 3.9. The change was assessed due to both changes in the total rail market volume and hypothetical rail utilization increases. The latter explains mostly the large growth rates for some commodities. It will be essential to understand the nature of logistics for the high growth commodities so that rail can be positioned to handle the projected growth.
The projections shown do not include changes in international markets that may result in the use of Oregon ports to export or import such commodities for use elsewhere, beyond the assumptions of the updated Oregon CFF data. Nevertheless, lines that are solely dependent on declining rail commodities, such as coal, or slowly growing total rail commodities such as petro/coal products and chemicals may consider diversifying their commodity base to avoid future “at-risk” situations.
Table 3.9 Top 10 Commodities by “Potential” Rail Volume Growth in Oregon, 2010-2035
Rank Commodity 2010 Actual Rail Volume (’000 tons) a
2035 “Potential” Rail Volume (’000 tons) b
2010-2035 Total Change
in Rail Volume (’000 tons)
2010-2035 Contribution
due to Change in Total Rail
Market Volume (’000 tons)
2010-2035 Contribution due to Rail Utilization
Increase (’000 tons)
2010-2035
CAGR in Rail
Volume
1 Concrete/Glass 4,178 11,465 7,288 1,717 5,571 4.1%
2 Farm Products 2,493 7,607 5,113 1,360 3,754 4.6%
3 Chemicals 7,099 11,877 4,779 2,327 2,452 2.1%
4 Waste/Scrap 3,407 7,397 3,990 3,545 445 3.1%
5 Lumber/Wood 10,111 13,838 3,727 3,532 196 1.3%
6 Pulp/Paper 3,622 5,561 1,939 1,662 277 1.7%
7 Coal 1,571 2,962 1,391 -323 1,713 2.6%
8 Forest Products
23 1,192 1,169 23 1,147 17.1%
9 Petro/Coal Products
255 1,380 1,125 55 1,070 7.0%
10 Primary Metals 1,056 2,171 1,114 976 138 2.9%
Source: 2011 Oregon Freight Plan Commodity Flow Forecast with Adjustments using FHWA FAF 3.4 Data. a2010 actual rail volume in the current year is based on the current total rail market volumes and the current actual rail utilization. b2035 “Potential” rail volume in the current year is based on the future total rail market volumes and hypothetical rail utilization. NOTE: Flows indicated in this table include those entering or leaving Oregon but do not include flows within or through a county. The flows are also limited to commodities that are likely to be moved as rail carloads and origin-destination pairs of over 150 miles.

Oregon State Rail Plan DRAFT Freight Rail Needs Assessment
Cambridge Systematics, Inc. 3-31
Port Connectivity
Many of Oregon’s coastal and Columbia River ports are served by rail. Ports located in Coos, Douglas, Lincoln, Tillamook and Clatsop Counties are rail served. However, the Lane County port is not rail served, and the Port of Tillamook Bay (POTB) in Tillamook County lost its direct rail access in 2007 due to severe storms and flooding. In the aftermath of that natural disaster, the POTB Board of Commissioners determined the public would not be best served by repairing the damaged railroad line and requested funding from the Federal Emergency Management Agency (FEMA) Public Assistance Program for an alternate project.
Curry is the only county on Oregon’s Coast that does not have any rail service. The 2035 “potential” rail volume originating/terminating in this county is projected to be about 820,000 tons, which would be roughly equivalent to about 9,000 carloads annually4. This projected volume is likely to be insufficient to economically justify construction of new rail access to a commercial port in Curry County.
Assessing future rail-related traffic volumes for rail-served ports is difficult. Ports generally compete for a range of cargoes with other ports in the Pacific Northwest. These cargoes often have little or no association with industry in Oregon or the county where the port is located, and thus macroeconomic county and even state-level forecasts do not serve as a useful guide to projecting potential volumes. For the port that secures a particular export or import flow that utilizes rail, the serving rail carrier effectively gains a traffic windfall that is impossible to predict without an understanding of the situational specifics.
Economic Development and Freight Rail Investment Needs and Opportunities
Some Oregon counties have considerable rail mileage and low rail volume density (or, rail tonnage per mile of rail line). Klamath, Umatilla, Union and Wasco Counties fall into this category. These present opportunities for economic development in order to improve rail transportation asset utilization.
Counties in Oregon with low to moderate rail mileage but with high current rail volume density and moderate/high “potential” growth in rail volumes include Baker, Gilliam, Lincoln and Yamhill. These counties may present opportunities for additional investment in rail capacity.
Table 3.11 presents a summary of the rail market assessment information for the counties mentioned above. In order to identify the key industries in these
4 One rail car (non-intermodal) in Oregon carries roughly 88 tons of load according to the 2010 Confidential Waybill Sample database.

Oregon State Rail Plan
3-32 Cambridge Systematics, Inc.
counties, the current top commodities in these counties based on the current rail volumes and the “potential” growth in rail volumes are indicated.

Oregon State Rail Plan DRAFT Freight Rail Needs Assessment
Cambridge Systematics, Inc. 3-33
Table 3.10 Oregon Counties where Analysis Points to Economic Development Opportunities for Rail
County Serving
RRs Service
Type Rail
Mileage
2010 Rail Volume
(’000 Tons)
2010 Rail Density
(’000 Tons/ Mile)
2010 Rail Utilization
Top Commodities
based on Current Rail
Volumes
2035 Rail Volume
(’000 Tons)
2035 Rail Utilization
Top Commodities
based on “Potential” Rail Volume Growth
2010-2035 CAGR for
Rail Volume
Counties with high rail mileage but low rail volume density
Klamath BNSF, KNOR, UP
Both Class I and Short Lines
220 884 4.0 12.3%
Lumber/Wood, Concrete/Glass etc, Hazmat Products, Chemicals, Farm Products
2,030 12.3%
Concrete/Glass etc, Farm Products, Lumber/Wood, Chemicals, Coal
3.4%
Umatilla PCC, UP Both Class I and Short Lines
166 458 2.8 10.3%
Lumber/Wood, Chemicals, Farm Products, Hazmat Products
1,262 10.3%
Concrete/Glass etc, Farm Products, Chemicals, Lumber/Wood, Coal
4.1%
Union INPR, UP, WURR**
Both Class I and Short Lines
92 343 3.7 9.4%
Lumber/Wood, Hazmat Products, Chemicals, Farm Products
978 9.4%
Concrete/Glass etc, Farm Products, Lumber/Wood, Chemicals, Coal
4.3%
Wasco BNSF, UP Class I only 113 22 0.2 0.5%
Hazmat Products, Chemicals, Primary Metals, Lumber/Wood, Petro/Coal Products
676 0.5%
Concrete/Glass etc, Farm Products, Coal, Chemicals, Forest Products
14.7%
Counties with moderate rail mileage, high current rail volume density and moderate/high “potential” growth in rail volume
Baker UP Class I only 70 1,774 25.3 37.4%
Concrete/Glass etc, Lumber/Wood, Non-metallic minerals, Coal, Hazmat Products,
2,597 37.4%
Concrete/Glass etc, Farm Products, Lumber/Wood, Chemicals, Forest Products
1.5%
Gilliam PCC, UP Both Class I and Short
Lines 46 1,571 34.1 35.2%
Waste/Scrap, Hazmat Waste, Concrete/Glass etc, Petro/Coal Products
3,572 35.2%
Waste/Scrap, Concrete/Glass etc, Farm Products, Coal, Forest Products
3.3%
Oregon State Rail Plan
3-34 Cambridge Systematics, Inc.
County Serving
RRs Service
Type Rail
Mileage
2010 Rail Volume
(’000 Tons)
2010 Rail Density
(’000 Tons/ Mile)
2010 Rail Utilization
Top Commodities
based on Current Rail
Volumes
2035 Rail Volume
(’000 Tons)
2035 Rail Utilization
Top Commodities
based on “Potential” Rail Volume Growth
2010-2035 CAGR for
Rail Volume
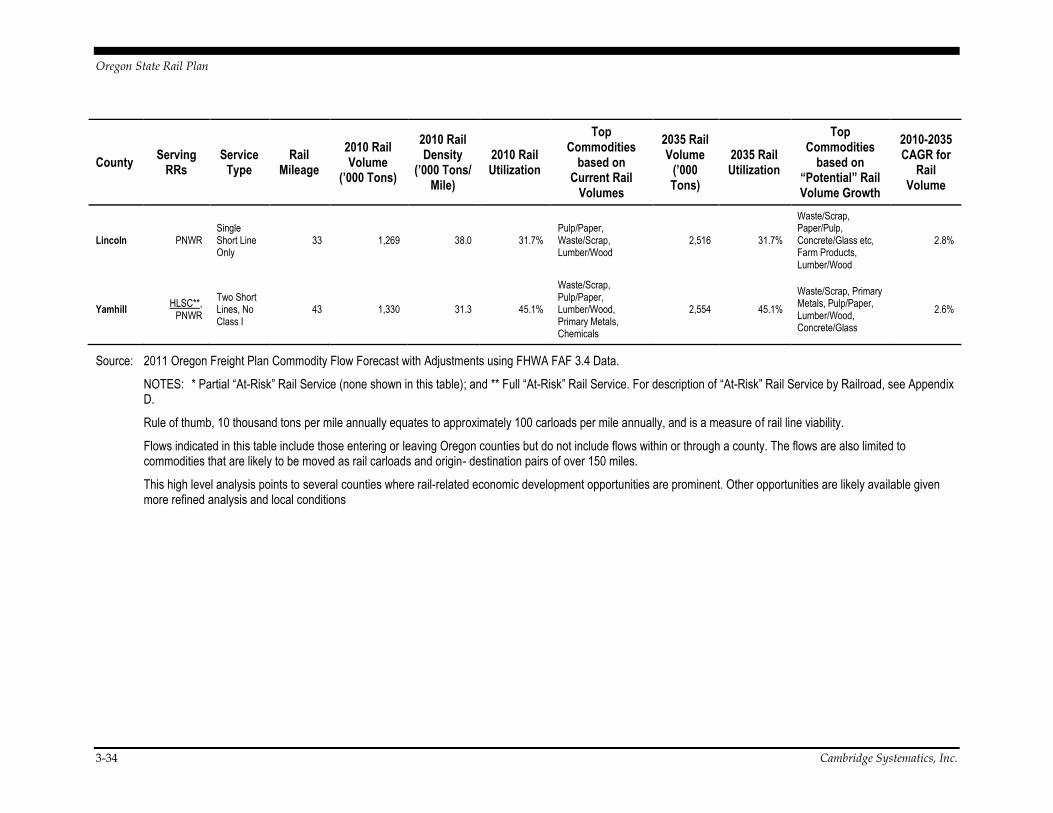
Lincoln PNWR Single Short Line Only
33 1,269 38.0 31.7% Pulp/Paper, Waste/Scrap, Lumber/Wood
2,516 31.7%
Waste/Scrap, Paper/Pulp, Concrete/Glass etc, Farm Products, Lumber/Wood
2.8%
Yamhill HLSC**,
PNWR
Two Short Lines, No Class I
43 1,330 31.3 45.1%
Waste/Scrap, Pulp/Paper, Lumber/Wood, Primary Metals, Chemicals
2,554 45.1%
Waste/Scrap, Primary Metals, Pulp/Paper, Lumber/Wood, Concrete/Glass
2.6%
Source: 2011 Oregon Freight Plan Commodity Flow Forecast with Adjustments using FHWA FAF 3.4 Data.
NOTES: * Partial “At-Risk” Rail Service (none shown in this table); and ** Full “At-Risk” Rail Service. For description of “At-Risk” Rail Service by Railroad, see Appendix D.
Rule of thumb, 10 thousand tons per mile annually equates to approximately 100 carloads per mile annually, and is a measure of rail line viability.
Flows indicated in this table include those entering or leaving Oregon counties but do not include flows within or through a county. The flows are also limited to commodities that are likely to be moved as rail carloads and origin- destination pairs of over 150 miles.
This high level analysis points to several counties where rail-related economic development opportunities are prominent. Other opportunities are likely available given more refined analysis and local conditions

Oregon State Rail Plan
Cambridge Systematics, Inc. 3-35
Freight Rail Service Risks and Impacts
Understanding the potential of “at-risk” rail lines to be abandoned is critical for three main reasons. The first is loss of transportation options to current and potential industries. The loss is not limited to existing industries, but also to the potential for attracting new businesses along the line. The second issue is that once abandoned, a rail line is very difficult to reconstruct, and thus rail service for freight purposes may be lost forever. Not only is rail line construction physically intensive, right-of-way encroachment that happens while the line is in a state of disrepair may also seriously impede viability of a new line. Finally, interim conversions to trail use have strong political constituencies, which can make it difficult to convert a line back to active use once it has been converted to a trail and opened to the public.
It is very difficult to calculate the economic impact of abandonments. The impacts may be small if there are no existing industries that are served by the line, or if there are competitive trucking options. However, in other cases, the impacts may be severe, and result in significantly higher transportation costs. Some states have conducted rail abandonment impact studies to quantify the effect of short line rail abandonments through a benefit-cost analysis. For instance, Kansas DOT estimated that abandonment of short line railroads in the state resulted in $58 million road damage costs, $20 million transportation and handling costs, and $1.3 million in incremental highway safety costs. If Kansas farmers were to absorb these costs, the farm income would decline by $20.5 million. It would be prudent to say that rail preservation projects should take in to consideration the full cost and benefit of preserving a rail line.
For the purpose of this analysis, “at-risk” lines are those lines that were identified in the 2010 Oregon Rail Study as being “at-risk” (either wholly, or in part), as well as from stakeholder comments. Apart from situations where a county is served exclusively by an “at-risk” rail line, this assessment does not permit assessing the degree to which the closure of an “at-risk” rail line is likely to impact overall rail service in that county. The CFF county-level data does not provide the geographic resolution necessary to examine the future development of traffic volumes among the industries that are specifically served by an “at-risk” rail line. This requires additional research, including a more detailed examination of the rail-oriented industrial sectors that exist at present, or might develop in the future, in the affected counties.
Lake, Tillamook, Wallowa, Clatsop and Umatilla are counties in Oregon that each have rail mileage contributed by a single “at-risk” railroad. The impact of losing the service of any of these “at-risk” railroads in these counties can result in about 3 million tons of truck movements by 2035 that could have “potentially” been moved by rail. This is roughly equivalent to about 500 truckloads a day. In 2013 ODOT estimated which lines in the state have the greatest risk for abandonment, as shown in Table 3.11.

Oregon State Rail Plan
3-36 Cambridge Systematics, Inc.
Table 3.11 Rail Lines at Risk for Abandonment 2013-2020
Line Segment Miles County Operator Owner Remarks
Reith to Pilot Rock 14.25 Umatilla UP UP In Sept. 2013 UP advised that abandonment of this line was under consideration. Boise Cascade operates a ponderosa pine mill at Pilot Rock where there are several hundred acres of land zoned for industrial development. This line segment conceivably could be a candidate for a new short line operation.
Silverton to Stayton 21 Marion WVR UP Owner UP and lessee Willamette Valley Railway propose filing for abandonment after Feb. 2, 2014, which will mark 2 full years with no traffic south of Silverton. Point of abandonment could be north of Silverton at Abiqua Creek, 8.9 miles from Woodburn.
Spofford to Weston 19 Umatilla PCC UP In Nov. 2012 officials of Watco Cos., parent of short line Palouse River & Coulee City Railroad said they were considering abandoning this line from Spofford, 4 miles north of Milton-Freewater, to Weston, 15 miles south of Milton-Freewater, because of low traffic volume. Principal user is Smith Frozen Foods at Weston. Spofford is approximately 2 miles south of the Oregon/Washington state line. The branch starts at Walla Walla, WA.
Gerlinger to Dallas 5.2 Polk PNWR UP This branch serving the Polk County seat of Dallas has no active customers although there are suitable sites and buildings in Dallas for potential new industrial development. However as a business, the railroads do not have infinite patience to await new customers. Portland & Western has been the lessee since 1993.
Wauna to Tongue Point
23.2 Clatsop PNWR PNWR ODOT
Portland & Western owns the track and ODOT owns the corridor real estate. PNWR continues to show patience and keep this line even though there has been no revenue freight traffic west of Wauna for 20 years. The line did host a summer tourist train for 3 years, 2003-2005. There continues to be hope that new industry will locate at the site of the former naval base at Tongue Point and generate new rail business.
Hillsboro to Forest Grove
5.4 Washington PNWR PNWR ODOT
This line is lightly trafficked and operated only once or twice weekly. It doesn't produce enough revenue to justify capitalized maintenance programs so abandonment is inevitable absent other funding sources. PNWR owns the track and appurtenances and ODOT owns the right-of-way. The corridor could host an extension of Westside MAX or other rail/transit services at some point in the future.
Willamina to Fort Hill
5.3 Polk PNWR HLSC Hampton Railway is a subsidiary of Hampton Lumber Co. PNWR provides service when necessary. There are no active customers on the line in 2013 so it is a vulnerable abandonment candidate.

Oregon State Rail Plan DRAFT Freight Rail Needs Assessment
Cambridge Systematics, Inc. 3-37
Line Segment Miles County Operator Owner Remarks
Banks to Enright 37 Washington & Tillamook
POTB POTB Except for Banks Lumber Co. at Banks, which is switched by PNWR on behalf of the Port of Tillamook Bay Railroad, there are no customers or operations on this 37-mile segment of out-of-service track in the Coast Range. The line was heavily damaged by a storm in Dec. 2007 and not repaired. Another 45 miles of railroad, from Enright to Tillamook, has been leased to the Oregon Coast Scenic Railroad for tourist train use.
East Portland to Milwaukie
4 Multnomah &
Clackamas
OPR OPR This segment of Oregon Pacific Railroad serves the Milwaukie Industrial Park where rail freight volumes have declined in recent years. If this trend continues the railroad may become uneconomical and go out of business. Most of the right of way real estate is publicly owned. This line is important to the Oregon Rail Heritage Foundation because it hosts ORHF's annual Christmas train fund-raising excursions. Therefore, ORHF is a possible successor to OPR if the line succumbs. OPR also has a 9-mile line between Canby and Liberal that enjoys a more robust business level.
Source: ODOT Rail Division

Oregon State Rail Plan
3-38 Cambridge Systematics, Inc.
3.3 OPERATIONAL NEEDS This section presents a number of considerations for freight system planning and operations including planning passenger service on shared freight corridors, the relationship between Class I and non-Class I operators for local freight service, and the importance of maintaining and improving rail system safety.
Class I Requirements - Freight Rail Operating Principles
In recent years, both BNSF and UP have established requirements for any public or private third party contemplating use of their lines for passenger service. Proposed new operations should address the following issues:
Compensation. The freight railroads expect compensation for time and effort in planning or preparing for passenger rail proposals, and for the access to and use of the freight rail facilities;
Capacity. Passenger rail agencies should pay for any incremental capacity requirements above the ability to serve current customers and expected freight rail growth;
Access to customers. The freight railroad should have use of its current capacity to serve current and future customers, and new passenger rail services should not inhibit the freight railroads from being able to serve its customers;
Liability. Passenger rail sponsors should be prepared to accept to fully indemnify the host railroad and carry all legal liability for passenger rail operations, and for liability that would not be the responsibility of the freight railroad but for the passenger operations; and,
Safety. New passenger rail services should expect to help fund implementation of Positive Train Control systems if not already in use in the corridor. In addition, all safety regulations associated with the passenger traffic (i.e. higher speeds require stricter track standards, grade crossing improvements) should be covered by the passenger rail agency; and all passenger rail equipment must meet North American industry standards.
In addition, where higher passenger train speeds are anticipated (definition varies), the host roads would prefer to have separate passenger and freight tracks. These tracks should be located 50 feet from the center line of the existing freight tracks to protect passenger trains from freight train derailments.
Class I – Short Line Relationships and Needs
The relationship between short lines (and all non-Class I railroads) and the Class I railroads is one of continuous evolution. The streamlining of the line-sale and abandonment process incorporated in the Staggers Act of 1980 precipitated a

Oregon State Rail Plan DRAFT Freight Rail Needs Assessment
Cambridge Systematics, Inc. 3-39
flurry of new small rail carriers as Class I railroads cast off lines that were not viewed as central to their business. In most transactions, a fundamental goal of the divesting railroad was to retain traffic and revenue that had been previously handled, while shedding ongoing costs and future obligations such as costly infrastructure repairs. Thus, the typical short line spin-off handled relatively modest traffic, moving in single carloads or multi-car loads that were not full unit trains. While these traffic characteristics are still common among many of the 500 or so small railroads operating in the U.S., they do not reflect the full and varying range of today’s short lines, nor are they indicative of the small railroads’ evolving market position. This continued evolution lies at the heart of the role that short lines will have in the future.
Short lines serve an important role in the North American rail sector. Overall, around one-quarter to one-fifth of traffic handled by Class I railroads starts and/or ends its trip on a short line railroad. For BNSF, short lines accounted for 20 percent of their total unit volume in 2011. For some commodities, short lines are even more critical to BNSF, with 45 percent of industrial products and 35 percent of agricultural traffic handled by short lines at some point.5 On the UP, short line related traffic accounted for approximately 15 percent of volume.6 As noted elsewhere, in Oregon Class I railroads rely on their short line connections to primarily serve some of the state’s key industries, particularly forest products.
From the perspective of the Class I railroads, short lines serve several functions:
Provide access to customers that are not within reach of the Class I.
Afford operationally intensive functions that Class I railroads havedifficulty in providing from a cost and service management standpoint.This is often the case in the provision of switching services to industriesand public transloading facilities. For example, some industries requirefrequent switching that a Class I carrier could not provide economically.
Serve as a retailer to smaller shippers that do not produce sufficientvolume for a Class I carrier to service directly. From the short line’sperspective, smaller shippers boost overall volumes, and thus theviability of the railroad. From the Class I perspective, having short linesperform the function of aggregating traffic boosts volumes whiletransferring the disproportionate costs associated with switching andmanaging customers to other parties.
Provide access to rail service away from Class I mainlines. Theincreasingly intensive utilization of many Class I mainlines have made it
5 https://www.bnsf.com/employees/communications/railway-magazine/flash/winter2013/files/assets/basic-html/page9.html6 https://www.progressiverailroading.com/short_lines_regionals/article.aspx?id=32022

Oregon State Rail Plan
3-40 Cambridge Systematics, Inc.
more operationally difficult and costly to serve customers located on many mainlines. In years past, trains engaged in local pickup and delivery could occupy mainlines for hours switching customers without impacting through traffic. Increased train volumes have made this practice more problematic and costly. Increasing physical mainline capacity to better serve on-line industry is often expensive. Serving a shipper on a short line may be more cost effective, even with potential dilution of revenues.
The common thread for all of these functions is the ability for the Class I carrier to use a short line connection to complement its services. The basis for the relationship is the revenue and profit potential that the Class I carrier can derive from a particular service. This includes considering options that might exclude the short line entirely. For example, instead of using the short line to directly reach the customer, the Class I could offer to route it through a port, logistics center or transload facility that is located on the Class I railroad. Or, the Class I carrier could offer an intermodal option (handling by intermodal trailer or container) in lieu of a carload shipment.
Beyond the issue of the specific profitability of particular short line traffic to its Class I connection(s), lies the broader issue of the Class I railroad’s outlook on carload service, i.e. the traditional practice of having trains carry traffic associated with multiple customers and destinations. As recently as the mid-1960’s, carload service represented 100 percent of rail traffic. Since then, the advent of bulk unit trains, intermodal, and other dedicated trainload services have diminished loose car traffic to approximately 50 percent of Class I railroad gross revenues. While these changes have brought substantial cost and service gains to the railroads and their customers that utilize these dedicated services, users of carload service generally have the same or worse service experience than was the case 40 years ago.
The individual Class I railroads have varying perspectives on carload service, with some viewing it as a core business with a strong future, while others view it as an increasingly niche product lacking in growth potential. These perspectives affect the carrier’s overall strategies towards carload traffic, including investment, operations, pricing, as well as their approach to short lines. As has always been the case, to a substantial degree, the successful short line will have to take its cues from their Class I connections. In the future, these will be marked by:
Increased use of higher volume multi-car shipments, high capacity equipment (286K weight limit) and more generally greater concentration of traffic;
Continued shifting of “retail” carload services to short lines as Class I railroads seek to minimize handling of less than trainload traffic;
With some exceptions, the role of Class I carriers in supplying equipment for short line originated traffic will continue to diminish;

Oregon State Rail Plan DRAFT Freight Rail Needs Assessment
Cambridge Systematics, Inc. 3-41
Improved integration of service and visibility across an entire move, through adoption of integrative technologies such as Interline Service Management; and,
Implementation of improved Interchange Service Agreements that clearly define service standards for traffic interchanged between a short line and its Class I connection.
The primary beneficiaries of these strategies will be the well capitalized and more successful short lines that can afford to effectively engage their Class I connections. The successful short lines will keep up with the Class I service initiatives, and invest in their physical infrastructure to efficiently serve their customers with modern equipment. These trends may favor the large multi-property short line operators, such as Genesee & Wyoming, OmniTrax, Anacostia and Pacific, which can wield greater leverage over their Class I connections, due not only to the larger volume of business that they control, but also geographic diversity and a broad range of issues with varying priorities. In contrast, single property short lines with modest volumes may find it increasingly difficult to maintain market competitive service.
Regulatory Issues Affecting Class I - Short Line Relationships
A further consideration affecting commercial relations between Class I railroads and their short line connections is federal regulation as administered by the Surface Transportation Board (STB). Following enactment of the Staggers Act in 1980, the Interstate Commerce Commission and later the STB generally maintained a hands-off approach to the short line - Class I relationship. In recent years, the STB has taken a more active role in examining competitive issues, including some that directly affect short lines. These include paper barriers, expanded industry switching access, and bottleneck rates.
Paper barriers and competitive industry switching have received particularly intense attention. Paper barriers7 describe the common practice of controlling access to interchanges through legal agreements between the divesting carrier and the buyer. The trade-off for the buyer is a lower acquisition cost in return for the divesting carrier having greater control over the traffic handled by the short line. However, the existence of these barriers can sometimes impede the ability of a short line to handle specific traffic, thereby impacting its economic viability and limiting shipper service options. Thus far, the STB has not taken direct action to regulate paper barriers in line sales, but in November 2012 it issued a notice of proposed rulemaking that requires an applicant to include with its initial filing
7 See Ex Parte 714, Information Required in Notices and Petitions Containing Interchange Commitments.

Oregon State Rail Plan
3-42 Cambridge Systematics, Inc.
additional information on the impact of any interchange commitment on shippers and on the purchaser or lessee railroad.8
Competitive industry switching access would permit carriers to gain access to customers that are presently captive to a single carrier. Presently there is a proposal (Ex Parte 711) submitted by the National Industrial Traffic League (NITL) and the American Chemical Council (ACC) before the STB that would allow a competing carrier to gain access to a captive industry that is located within 30 miles of the interchange point.9 For a new carrier to gain access to the facility, the revenue/variable cost threshold must be in excess of 240 percent for rates paid by the customer, and the present carrier must be handling more than 75 percent of all rail traffic at the facility. ACC and NITL feel that this expanded access would restore some competitive balance in a rail industry that has come to be dominated by seven large Class I carriers. The Class I railroads are strongly opposed to this proposal, as they feel that implementation would substantially complicate operations, reduce rail revenues, profitability, and thereby the ability to make the investment necessary to keep up with capacity needs and competitive service requirements.
Rail System Safety
In response to several fatal rail accidents between 2002 and 2008, Congress passed the Rail Safety Improvement Act of 2008 (RSIA), the first authorization of FRA’s safety programs since 1994. The RSIA directs FRA to, among other things, circulate new safety regulations. These new regulations govern different areas related to railroad safety, and each may have an impact on future rail system usage, infrastructure investment and freight and passenger rail operations. Select issues of relevance to this Plan include (each is discussed in more detail in the following subsections):
Require implementation of Positive Train Control (PTC) systems by certainrailroads on certain lines;
Extensively amend the hours of service (HS) laws; and
Provide for highway-rail crossing safety.
Each of these topics is briefly described, below.
8
https://www.stb.gov/Decisions/readingroom.nsf/WEBUNID/C9E40181B718CD1485257AA9004BA42A?OpenDocument
9 Ex Parte 711, Petition for Rulemaking to Adopt Revised Competitive Switching Rules, https://www.stb.gov/stb/index.html

Oregon State Rail Plan DRAFT Freight Rail Needs Assessment
Cambridge Systematics, Inc. 3-43
Positive Train Control
Positive Train Control (PTC) refers to technology that is capable of preventing train-to-train collisions, overspeed derailments, and casualties or injuries to railroad workers (e.g., maintenance-of-way workers, bridge workers, and signal maintainers). Due to these benefits, the National Transportation Safety Board (NTSB) named PTC as one of its “most-wanted” initiatives for national transportation safety. PTC requires the installation of a significant amount of hardware and software, in the field and on locomotives, that provides for active train location detection and tracking, computer networking, accurate braking distance calculations for different types of trains, and reliable wireless communication to link all of these operating elements and system components.
The RSIA of 2008 requires, by December 2015, certain freight and passenger railroads to implement PTC on their mainlines systems carrying 5 million or more gross ton miles annually over which intercity rail passenger transportation or commuter rail passenger transportation is regularly provided, or poison or toxic-by-inhalation hazardous (PIH/TIH) materials are transported. It is currently estimated that approximately 70,000 miles of track and 20,000 locomotives will have to be equipped with interoperable PTC technology,10 effectively mandating PTC on a significant portion of the Class I rail network. In Oregon, at a minimum, UP’s and BNSF’s mainlines that host regularly scheduled passenger service, will require PTC installation.
Among short lines, nationally fewer than 100 among the approximately 550 operating in the U.S. will require the installation of PTC. However, even those that do not require its installation may still incur PTC-related expenditures if their locomotives operate over Class I lines that are required to have PTC installed. Installation costs of on-board hardware are expected to be at least $50,000, and considerably more for the older units that lack microprocessor control systems – many of which are operated by short lines.
All railroads, even those that are exempt from the PTC requirements, had to submit a PTC Implementation Plan (PTCIP) to the FRA by April 16, 2010. Thus, in addition to the Class I railroads and passenger carriers, various short lines and their holding companies, responded with declarations of exemption and/or implementation plans. In Oregon, PTC will be implemented along the several
main lines of UP and BNSF.11
Although development of PTC technologies dates back to the 1980s, the RSIA initiated a concerted industry effort to implement PTC within the specified timetable. As such, the initial PTCIPs submitted by railroads to the FRA for
10 https://www.fra.dot.gov/Elib/Details/L03178 (accessed March 28, 2013)
11 BNSF currently has no plans to implement PTC on the either the Oregon Trunk or
Gateway subdivisions.

Oregon State Rail Plan
3-44 Cambridge Systematics, Inc.
approval stated they would complete implementation by the 2015 deadline on the assumption that there would be no technical or programmatic issues in the design, development, integration, deployment, and testing of the PTC systems they adopted. However, the state of hardware and software development and availability remains a substantial challenge to deployment.
These issues have led many in the industry to question the merits of the entire mandate. Research by the FRA and others have found that the costs of implementation and maintenance of PTC systems over the next 20 years are expected to be a minimum of $10 billion for the freight carriers, which will far outweigh potential benefits at a ratio of 11:1 or more.12 Without significant financial assistance from the federal government, implementation of PTC is seen as effectively an unfunded mandate, with the railroad industry burdened with the full cost of its implementation, and one that would not be possible absent the Class I railroads’ present strong financial condition. However, the financial demands of PTC certainly have an effect on the railroads’ investment decisions, by diverting funds from other needs that may directly benefit capacity and service.
In August 2012 the FRA wrote a report to Congress on PTC implementation status, issues, and impacts13 stating that they believe that the majority of railroads will not be able to complete PTC implementation by the 2015 deadline. Partial deployment may be achieved; however, the extent of which is dependent upon the successful resolution of known issues and any emergent issues. As a result, FRA recommended that if Congress were to consider legislation extending the PTC implementation deadline it should consider several factors, including the extent to which each railroad has demonstrated due diligence in its efforts to successfully implement PTC technologies on its rail system.
Hours of Service
The Hours of Service (HS) laws, first enacted in 1907 and most recently amended in 2008, control how many hours train employees, dispatching service employees, and signal employees may work. The statute provides maximum on-duty periods for each group of employees, minimum off-duty periods for train employees and signal employees, and establishes how time on duty is to be calculated. The statute also provides additional limitations on consecutive-days and certain monthly limitations on the activity of train employees. In this latest revision changes included limiting the number of consecutive days on duty
12 William C. Vantuono, PTC: Is Everyone on Board, Railway Age, May 2010, pp. 29-37. https://www.railwayage.com/cs/ptc-is-everyone-on-board/ (accessed March 28, 2013). Also see Commercial Benefits of Positive Train Control, Oliver Wyman Inc. for the Association of American Railroads, April 2010.
13 Positive Train Control Implementation Status, Issues, and Impacts, FRA, August 2012. https://www.fra.dot.gov/eLib/Details/L03718 (accessed March 28, 2013)

Oregon State Rail Plan DRAFT Freight Rail Needs Assessment
Cambridge Systematics, Inc. 3-45
before rest is required, increasing minimum rest time from 8 to 10 hours, and requiring rest time to be undisturbed.
Because the HS laws are currently statutory provisions, not regulations, only Congress can amend them. However, in the RSIA of 2008, FRA received regulatory authority to establish hours of service limitations for train employees providing commuter and intercity rail passenger transportation service (passenger train employees). On August 12, 2011, FRA published its final rule providing new limitations for passenger train employees, based on the limitations in the HS law as it existed prior to 2008. The regulation adds a requirement to analyze employee work schedules with fatigue modeling tools, and consecutive-days limitations that recognize the difference between work during daylight hours and work during nighttime hours.14
These HS laws impact both freight and passenger rail operations in Oregon. In September 2011 the Government Accountability Office (GAO) published a report of their analysis related to the HS changes, specifically on the freight industry.15 As might be expected from changes aimed at improving safety by reducing employee fatigue, the railroad industry reported that RSIA’s hours of service changes had operational and administrative effects on it, some of which increased some railroads’ one-time or ongoing costs. The GAO report did not determine how RSIA’s changes affected railroads’ earnings. Through its industry survey and interviews, GAO found that RSIA’s changes affected railroad operations, including changes to crew and train schedules and increases in staffing levels. Similar results may be expected on passenger operations as additional crew rest time is required between work shifts, and limits are placed on consecutive tours of duty.
Rail Crossings
At-grade rail crossings are one of the most pressing issues for state and local jurisdictions and the railroads themselves due to their substantial safety and operational risk and cost. Reasons such as growth in population, motor vehicle, and rail traffic will increasingly pose concern for the public at at-grade crossings, including potential safety implications, vehicle delays and associated environmental impacts. The FRA notes that nearly every 180 minutes in the U.S., someone is hit by a train. And, combined highway-rail crossing and trespasser deaths account for 95 percent of all rail-related deaths, most of which are avoidable. Trespassing along railroad rights-of-way is the leading cause of rail-related deaths in America. Nationally, more than 431 trespass fatalities occur
14 49 CFR Part 228.
15 Freight Railroad Safety: Hours of Service Changes Have Increased Rest Time, but More Can Be Done to Address Fatigue Risks, GAO, September 2011.

Oregon State Rail Plan
3-46 Cambridge Systematics, Inc.
each year, and nearly as many injuries, the vast majority of which are preventable.
In Oregon, between 2008 and 2012 there were 74 highway-rail incidents, 57 of which took place at public crossings, resulting in 20 casualties (fatalities and injuries).16 Between 2008 and 2012 there were also 79 casualties due to trespassing (death or injury) and 68 of them occurred at locations other than at-
grade crossings.17 While Oregon has a comparatively low occurrence of at-grade crossing incidents and deaths compared to other states, ensuring the safest transportation system possible is still a top priority of the FRA, ODOT, railroads operating in the state and others. To raise awareness, ODOT identified the Top 25 high-risk crossings in the state, which are presented in the rail inventory tech memo.
The FRA, Oregon and other rail stakeholders encourage at-grade crossing safety and trespasser prevention through public education efforts. FRA launched a public information campaign to educate people that they should Always Expect A Train. They also coordinated the Right-of-Way Fatality and Trespass Prevention Workshop in 2012 to bring together transit, freight, and commuter rail stakeholders to focus on common problems and solutions surrounding ROW fatality and trespass prevention. There is also an Oregon division of Operation Lifesaver, which is a non-profit that helps promote awareness via a public information program dedicated to reducing collisions, injuries and fatalities at crossings and on rail right-of-way. They do this through promoting education, enforcement and engineering.
16 FRA, Office of Safety Analysis’ accidents and incidents, inventory and highway-rail crossing data.
17 Ibid.

Oregon State Rail Plan DRAFT Freight Rail Needs Assessment
Appendix
Cambridge Systematics, Inc. A-1
A. Class I Bottleneck Assessment Assumptions and Methodology
Using information collected in the rail system inventory, an assessment of the potential of bottlenecks to form on rail lines in the future due to an increase in demand, without an increase in rail capacity, was made. The assessment also determined some opportunities for increasing rail capacity and eliminating bottlenecks. This was done in three ways; via siding and mainline track upgrades, signal system upgrades, or other upgrades to increase operating speeds.
The bottlenecks analysis was limited to Oregon’s Class I mainlines, or primary rail network, because train volumes on the secondary rail network are not large enough to warrant a system-wide bottlenecks analysis. The bottlenecks analysis used the following data and assumptions:
Daily Train Volumes: Data and estimates of current and future daily freight train volumes based on Waybill Sample data, commodity flow forecasts developed as part of this Plan, and current actual and tentative future year passenger train volumes18.
Primary rail network track characteristics data: Information on number of tracks, signal type and siding tracks from UP and BNSF timetable data.
Rule-of-thumb assumption on mainline track throughput: 50 trains/day/track19 was used as the physical rail capacity for a comparison with the demand in total trains per day.
The bottleneck analysis steps included:
1. The Class I primary rail network was broken into rail segments with almost uniform daily total train volumes and no major Class I railroad junctions.20
18 The future passenger train volumes are based on past studies, including the 2010 Oregon Rail Study and Washington State Long-Range Plan for Amtrak Cascades, February 2006. No ridership forecasting was done as part of Plan.
19 2009 “I-710 Railroad Goods Movement Study” for the Los Angeles County Metropolitan Transportation Authority by URS and Cambridge Systematics, Inc.

Oregon State Rail Plan Appendix
A-2 Cambridge Systematics, Inc.
2. Existing physical rail capacity was calculated on all rail segments by multiplying the existing track ratios21 with the rule-of-thumb assumption on mainline track throughput.
For each rail segment, a comparison of the future daily total train volume demand was made to the existing physical rail capacity. If the future demand approached the physical rail capacity (total trains per day is greater than 0.7522 times daily track capacity), then the rail segment was identified as a bottleneck and the need for an increase in capacity was identified. The capacity increase can be achieved through: (a) increasing the miles of existing siding tracks, or (b) adding a new siding, reducing the spacing between sidings, or (c) adding a new mainline track. The most relevant opportunities for eliminating the physical rail capacity based bottlenecks (if any) were identified.
20 A major junction is defined here as one between a Class I mainline and another Class I mainline only. It does not include junction between a Class I mainline and a Class I industrial lead or Class I mainline and a short line.
21 Track ratio for a rail segment is total miles of all tracks divided by route miles (or miles of the first mainline track only) of the rail segment. This represents an average number of tracks in the rail segment.
22 The 0.75 threshold value was selected as it is assumed that as train volumes approach the physical rail capacity, the rail operator’s flexibility in scheduling trains reduces and train delays rapidly increase.

Oregon State Rail Plan DRAFT Freight Rail Needs Assessment
Appendix
Cambridge Systematics, Inc. B-1
B. Data and Methodology for Updating Oregon CFF Data
According to the 2011 Oregon Freight Plan, the Oregon Commodity Flow Forecast (CFF) is a county level forecast in tons and vehicles (where applicable) for truck, rail, marine, air, and pipeline modes from 2002 to 2035. Factors to convert the results to dollar value are also provided. The approach builds on the Federal Highway Administration (FHWA) Freight Analysis Framework (FAF2) national commodity flow forecast, which disaggregates the data to the sub-state level using local data and expertise on historical and forecast economic and modal trends. Local data is included to either verify that the national forecast provides accurate data for Oregon, or to modify or supplement the national data, as well as to disaggregate the data to the county level.
The Waybill Sample data was not used in this needs assessment for the following two reasons: (1) The total rail market volume was understood in terms of the total surface transportation demand of truck and rail modes combined, and the Waybill Sample contains data only on the rail mode; and (2) The geographical distribution of rail flows in the Waybill Sample may not be as well adjusted to the local data as the Oregon CFF.
Due to the fact that the Oregon CFF is a pre-recession forecast, it was necessary to adjust the forecast to current conditions and forecast taking into account the 2008-2009 global recession. The FHWA’s Freight Analysis Framework version 3.4 (FAF 3.4) commodity flow database released in January 2013 was used for this purpose.
The data was analyzed using the following steps of methodology:
1. Data Formatting: The Oregon CFF is available in a format that was not meeting the requirements of this assessment. The raw data consisted of separate modal comma separated value (csv) files and with inconsistent geographies, the data for the truck and rail modes were combined into a single dataset consistent county level commodity flows format.
The Oregon CFF uses 2-digit Standard Transportation Commodity Code (STCC), for comparisons with the freight analysis framework (FAF) data in the later steps, therefore the analysis created an equivalent Standard Classification of Transported Goods (SCTG2) commodity classification format of the Oregon CFF (as and when needed), using a simple STCC2-

Oregon State Rail Plan Appendix
B-2 Cambridge Systematics, Inc.
SCTG2 crosswalk provided in the FHWA’s Quick Response Freight Manual II23.
2. Other Support Data Collection: In addition to the Oregon CFF, theinformation on rail miles by county in Oregon and presence of “at-risk” shortlines within a county using GIS data were collected and used in the analysis.The information on inter-county distances by rail was also used.
3. Data Verification: Since the Oregon CFF is derived from FAF2 commodityflow forecast, a top level (Oregon FAF2 zone level and by movementdirection) and consistency check of the data was made with FAF2 forecast(this information was retrieved from a past study by the consultant) for railand truck modes combined.
4. Data Filtering: Not all traffic moved by trucks is a likely candidate for railbased transportation from/to a county in Oregon. Therefore, to assess thefreight total rail market volume (opportunities and risks) more accurately,movements in the “reformatted” Oregon CFF (see Step 1 above) with inter-county distance by rail < 150 miles were eliminated. Also, some commoditiesthat are more likely than others to be moved as rail carloads were identifiedas shown in Table A.1 below. The filtered truck and rail flows through theelimination/selection process together form the total rail market volume.Hereafter the “reformatted” and “filtered” Oregon CFF will be referred to asthe “reduced” Oregon CFF.
5. Traffic Adjustments using FAF3.4: The base and future year total rail marketvolume by a commodity based on the “reduced” Oregon CFF were comparedagainst the corresponding values in FAF3.4 flows in tonnage. Forcommodities with large differences, that is a ratio between the FAF3.4 dataand forecast and the Oregon CFF lying outside the range of 0.75-1.25, theOregon CFF was adjusted by the ratio. This represented updated OregonCFF. The rail based tonnage portion of the total rail market volume was calledrail utilization.
23 FHWA’s Quick Response Freight Manual II, Page B-13, Also, available at:
https://ops.fhwa.dot.gov/freight/publications/qrfm2/qrfm.pdf (last accessed on June 18, 2013)
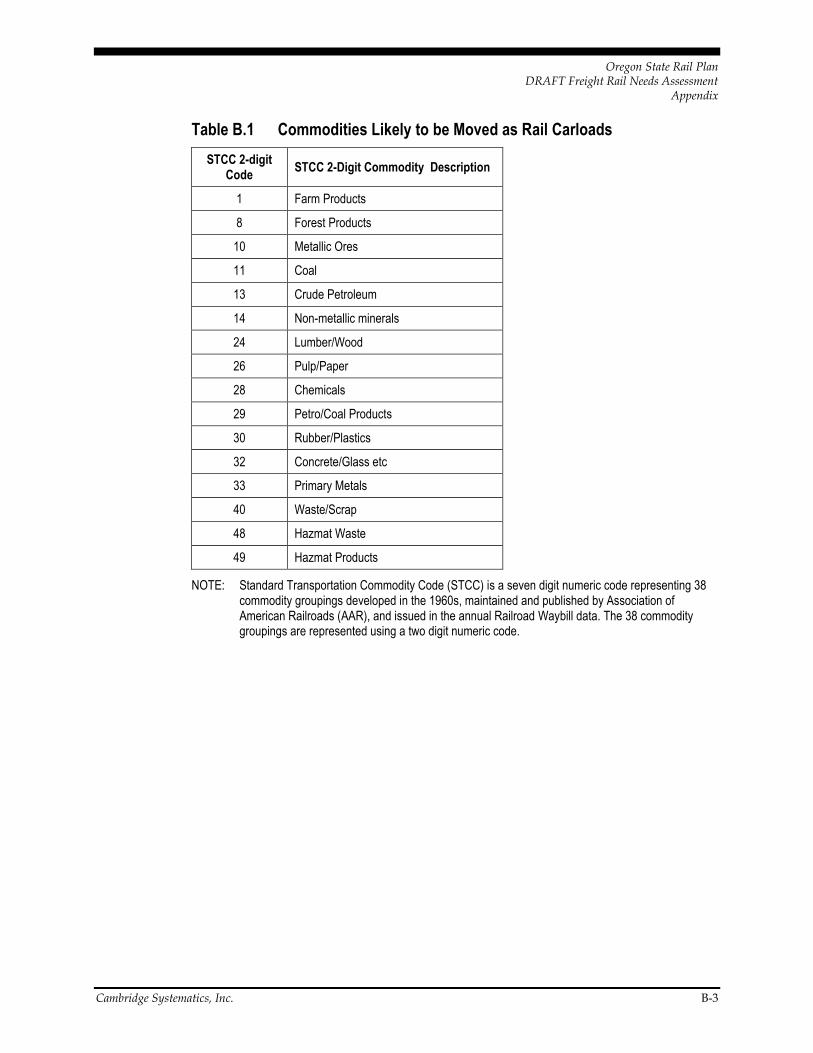
Oregon State Rail Plan DRAFT Freight Rail Needs Assessment
Appendix
Cambridge Systematics, Inc. B-3
Table B.1 Commodities Likely to be Moved as Rail Carloads
STCC 2-digit Code
STCC 2-Digit Commodity Description
1 Farm Products
8 Forest Products
10 Metallic Ores
11 Coal
13 Crude Petroleum
14 Non-metallic minerals
24 Lumber/Wood
26 Pulp/Paper
28 Chemicals
29 Petro/Coal Products
30 Rubber/Plastics
32 Concrete/Glass etc
33 Primary Metals
40 Waste/Scrap
48 Hazmat Waste
49 Hazmat Products
NOTE: Standard Transportation Commodity Code (STCC) is a seven digit numeric code representing 38 commodity groupings developed in the 1960s, maintained and published by Association of American Railroads (AAR), and issued in the annual Railroad Waybill data. The 38 commodity groupings are represented using a two digit numeric code.


Oregon State Rail Plan DRAFT Freight Rail Needs Assessment
Appendix
Cambridge Systematics, Inc. C-1
C. Inter-State and Inter-County Freight Rail Market Assessment Information by County in Oregon
Table C.1, Inter-State and Inter-County Freight Rail Market Assessment Information by County in Oregon, is on the following pages.

Oregon State Rail Plan Appendix
C-2 Cambridge Systematics, Inc.
Table C.1 Inter-State and Inter-County Freight Rail Market Assessment Information by County in Oregon
County Serving Railroads
Type Rail
Mileage
2010 Total Rail Market
Volume (’000 tons)
2035 Total Rail Market
Volume (’000 tons)
2010-2035 Comp. Annual Growth
Rate for Total Rail Market Volume
2010 Rail Volume (’000
tons)
2010 Rail Density (’000 Tons/ mile)
2010 Rail Utilization
Top Commodities based on Current Rail Volumes
2035 Rail Volume
(’000 tons)
2035 Rail Utilization
Top Commodities based on “Potential” Rail Volume Growth
2010-2035 Comp. Annual Growth
Rate for Rail Volume
Baker UP Class I only 70 4,741 6,903 1.5% 1,774 25.3 37.4% Concrete/Glass etc, Lumber/Wood, Non-metallic minerals, Coal, Hazmat Products,
2,597 37.4% Concrete/Glass etc, Farm Products, Lumber/Wood, Chemicals, Forest Products
1.5%
Benton AERC, PNWR* Multiple Short Lines, No Class I
59 5,250 8,658 2.0% 93 1.6 1.8% Lumber/Wood, Farm Products, Chemicals 947 1.8% Concrete/Glass etc, Farm Products, Chemicals, Coal, Forest Products
9.7%
Clackamas OPR*, PNWR, UP
Both Class I and Short Lines
43 6,156 11,452 2.5% 384 8.9 6.2% Chemicals, Pulp/Paper, Waste/Scrap, Concrete/Glass etc, Lumber/Wood
1,510 6.2% Concrete/Glass etc, Chemicals, Farm Products, Coal, Petroleum
5.6%
Clatsop PNWR** Single Short Line Only
27 4,274 6,979 2.0% 0.0 0.0% NA 679 0.0% Concrete/Glass etc, Farm Products, Chemicals, Coal, Forest Products
NA
Columbia PNWR* Single Short Line Only
54 1,636 2,755 2.1% 554 10.3 33.9% Concrete/Glass etc, Lumber/Wood, Pulp/Paper, Chemicals, Non-metallic minerals
916 33.9% Concrete/Glass etc, Lumber/Wood, Farm Products, Pulp/Paper, Chemicals
2.0%
Coos CBR Single Short Line Only
37 7,331 11,970 2.0% 519 14.2 7.1% Lumber/Wood, Pulp/Paper, Waste/Scrap, Hazmat Products, Rubber/Plastics
1,853 7.1% Concrete/Glass etc, Farm Products, Chemicals, Pulp/Paper, Waste/Scrap
5.2%
Crook COP Single Short Line Only
17 2,645 4,770 2.4% 16 0.9 0.6% Lumber/Wood 495 0.6% Concrete/Glass etc, Farm Products, Chemicals, Coal, Forest Products
14.7%
Curry None No Rail Access 0 4,905 8,314 2.1% 0.0% NA NA 0.0% NA NA
Deschutes BNSF, COP Both Class I and Short Lines
65 7,959 14,906 2.5% 382 5.9 4.8% Hazmat Products, Lumber/Wood, Concrete/Glass etc, Non-metallic minerals, Rubber/Plastics
1,871 4.8% Concrete/Glass etc, Farm Products, Chemicals, Coal, Forest Products
6.6%
Douglas CBR, CORP, LPN**
Multiple Short Lines, No Class I
143 10,453 17,003 2.0% 1,894 13.2 18.1% Lumber/Wood, Concrete/Glass etc, Petro/Coal Products, Chemicals
3,929 18.1% Lumber/Wood, Concrete/Glass etc, Farm Products, Chemicals, Coal
3.0%
Gilliam PCC, UP Both Class I and Short Lines
46 4,459 7,815 2.3% 1,571 34.1 35.2% Waste/Scrap, Hazmat Waste, Concrete/Glass etc, Petro/Coal Products
3,572 35.2% Waste/Scrap, Concrete/Glass etc, Farm Products, Coal, Forest Products
3.3%
Grant None No Rail Access 0 2,150 3,504 2.0% 0.0% NA NA 0.0% NA NA
Harney None No Rail Access 0 2,404 3,982 2.0% 0.0% NA NA 0.0% NA NA
Hood River MH, UP Both Class I and Short Lines
47 3,709 6,022 2.0% 23 0.5 0.6% Lumber/Wood, Farm Products 611 0.6% Concrete/Glass etc, Farm Products, Chemicals, Coal, Forest Products
14.0%
Jackson CORP*, WCTU Multiple Short Lines, No Class I
73 13,834 24,710 2.3% 544 7.5 3.9% Lumber/Wood, Chemicals, Concrete/Glass etc, Waste/Scrap, Hazmat Products
2,986 3.9% Concrete/Glass etc, Farm Products, Chemicals, Coal, Forest Products
7.0%
Jefferson BNSF Class I only 38 3,056 5,130 2.1% 120 3.2 3.9% Hazmat Products, Farm Products, Lumber/Wood, Chemicals
614 3.9% Concrete/Glass etc, Farm Products, Chemicals, Coal, Forest Products
6.7%
Josephine CORP Single Short Line Only
37 7,401 13,065 2.3% 36 1.0 0.5% Lumber/Wood, Hazmat Products 1,337 0.5% Concrete/Glass etc, Farm Products, Chemicals, Coal, Forest Products
15.6%
Klamath BNSF, KNOR, UP
Both Class I and Short Lines
220 7,160 11,787 2.0% 884 4.0 12.3% Lumber/Wood, Concrete/Glass etc, Hazmat Products, Chemicals, Farm Products
2,030 12.3% Concrete/Glass etc, Farm Products, Lumber/Wood, Chemicals, Coal
3.4%
Lake LRY** Single Short Line Only
15 3,435 5,580 2.0% 74 4.8 2.2% Non-metallic minerals, Lumber/Wood 599 2.2% Concrete/Glass etc, Farm Products, Coal, Chemicals, Forest Products
8.7%
Lane CBR, CORP, PNWR, UP
Both Class I and Short Lines
224 20,246 33,553 2.0% 2,817 12.6 13.9% Lumber/Wood, Pulp/Paper, Chemicals, Hazmat Products, Waste/Scrap
6,600 13.9% Concrete/Glass etc, Farm Products, Lumber/Wood, Chemicals, Pulp/Paper
3.5%
Lincoln PNWR Single Short Line Only
33 4,008 6,760 2.1% 1,269 38.0 31.7% Pulp/Paper, Waste/Scrap, Lumber/Wood 2,516 31.7% Waste/Scrap, Paper/Pulp, Concrete/Glass etc, Farm Products, Lumber/Wood
2.8%

Oregon State Rail Plan DRAFT Freight Rail Needs Assessment
Appendix
Cambridge Systematics, Inc. C-3
County Serving Railroads
Type Rail
Mileage
2010 Total Rail Market
Volume (’000 tons)
2035 Total Rail Market
Volume (’000 tons)
2010-2035 Comp. Annual Growth
Rate for Total Rail Market Volume
2010 Rail Volume (’000
tons)
2010 Rail Density (’000 Tons/ mile)
2010 Rail Utilization
Top Commodities based on Current Rail Volumes
2035 Rail Volume
(’000 tons)
2035 Rail Utilization
Top Commodities based on “Potential” Rail Volume Growth
2010-2035 Comp. Annual Growth
Rate for Rail Volume
Linn AERC*, PNWR, UP
Both Class I and Short Lines
145 8,452 13,628 1.9% 1,750 12.1 20.7% Lumber/Wood, Pulp/Paper, Concrete/Glass etc, Waste/Scrap, Chemicals
3,515 20.7% Concrete/Glass etc, Lumber/Wood, Farm Products, Paper/Pulp, Waste/Scrap
2.8%
Malheur UP, WYCO** Both Class I and Short Lines
41 3,953 6,374 1.9% 333 8.1 8.4% Farm Products, Chemicals, Non-metallic minerals, Coal, Petro/Coal Products
966 8.4% Concrete/Glass etc, Farm Products, Chemicals, Coal, Forest Products
4.4%
Marion PNWR, UP, WVR**
Both Class I and Short Lines
122 18,942 32,381 2.2% 781 6.4 4.1% Lumber/Wood, Chemicals, Pulp/Paper, Farm Products, Concrete/Glass etc
3,945 4.1% Concrete/Glass etc, Farm Products, Chemicals, Coal, Forest Products
6.7%
Morrow UP Class I only 41 4,533 6,255 1.3% 1,563 38.4 34.5% Coal, Chemicals, Waste/Scrap, Farm Products 1,780 34.5% Concrete/Glass etc, Farm Products, Chemicals, Waste/Scrap, Forest Products
0.5%
Multnomah BNSF, OPR, PNWR, PT, PTRR, UP
Both Class I and Short Lines
124 35,110 54,521 1.8% 17,412 140.9 49.6% Chemicals, Lumber/Wood, Concrete/Glass etc, Farm Products, Hazmat Products
25,127 49.6% Chemicals, Concrete/Glass etc, Farm Products, Primary Metals, Lumber/Wood
1.5%
Polk HLSC**, PNWR*
Multiple Short Lines, No Class I
39 3,640 6,259 2.2% 121 3.1 3.3% Lumber/Wood, Chemicals, Farm Products, Petro/Coal Products, Coal
740 3.3% Concrete/Glass etc, Farm Products, Chemicals, Forest Products, Coal
7.5%
Sherman BNSF, UP Class I only 22 2,770 4,456 1.9% 0.0 0.0% NA 428 0.0% Concrete/Glass etc, Farm Products, Coal, Forest Products, Chemicals
NA
Tillamook POTB** Single Short Line Only
57 2,879 4,748 2.0% 12 0.2 0.4% Lumber/Wood 474 0.4% Concrete/Glass etc, Farm Products, Chemicals, Lumber/Wood, Coal
15.9%
Umatilla PCC, UP Both Class I and Short Lines
166 4,449 7,614 2.2% 458 2.8 10.3% Lumber/Wood, Chemicals, Farm Products, Hazmat Products
1,262 10.3% Concrete/Glass etc, Farm Products, Chemicals, Lumber/Wood, Coal
4.1%
Union INPR, UP, WURR**
Both Class I and Short Lines
92 3,663 5,835 1.9% 343 3.7 9.4% Lumber/Wood, Hazmat Products, Chemicals, Farm Products
978 9.4% Concrete/Glass etc, Farm Products, Lumber/Wood, Chemicals, Coal
4.3%
Wallowa WURR** Single Short Line Only
45 2,834 4,559 1.9% 0.0 0.0% NA 441 0.0% Concrete/Glass etc, Farm Products, Coal, Chemicals, Forest Products
NA
Wasco BNSF, UP Class I only 113 4,310 6,799 1.8% 22 0.2 0.5% Hazmat Products, Chemicals, Primary Metals, Lumber/Wood, Petro/Coal Products
676 0.5% Concrete/Glass etc, Farm Products, Coal, Chemicals, Forest Products
14.7%
Washington PNWR*, POTB*
Multiple Short Lines, No Class I
100 9,770 20,612 3.0% 649 6.5 6.6% Lumber/Wood, Chemicals, Concrete/Glass etc, Hazmat Products, Pulp/Paper
2,977 6.6% Concrete/Glass etc, Chemicals, Farm Products, Lumber/Wood, Coal
6.3%
Wheeler None No Rail Access 0 2,330 3,774 1.9% 0.0% NA NA 0.0% NA NA
Yamhill HLSC**, PNWR
Multiple Short Lines, No Class I
43 2,949 5,309 2.4% 1,330 31.3 45.1% Waste/Scrap, Pulp/Paper, Lumber/Wood, Primary Metals, Chemicals
2,554 45.1% Waste/Scrap, Primary Metals, Pulp/Paper, Lumber/Wood, Concrete/Glass
2.6%
Source: 2011 Oregon Freight Plan Commodity Flow Forecast with Adjustments using FHWA FAF 3.4 Data.
NOTES: * Partial “At-Risk” Rail Service; and ** Full “At-Risk” Rail Service.
Flows indicated in this table include those entering or leaving Oregon counties but do not include flows within or through a county. The flows are also limited to commodities that are likely to be moved as rail carloads and origin-destination pairs of over 150 miles.


Oregon State Rail Plan DRAFT Freight Rail Needs Assessment
Appendix
Cambridge Systematics, Inc. D-1
D. Description of “At-Risk” Rail Service by Railroad in Oregon
Table D.1 Description of “At-Risk” Rail Service by Railroad in Oregon
Railroad Description of Rail Service Risk Faced
Albany &
Eastern
Railroad Co.
(AERC)
Inside Linn County - The Sweet Home branch from Bauman to Sweet Home may be at-risk due to current low traffic
volumes.
Central Oregon
& Pacific
Railroad
(CORP)
Inside Jackson County - Ashland, OR to Montague, CA is not being operated due to low traffic volumes. Due to a
recently received federal grant, this is likely to be back in service in 2014.
Hampton
Railway, Inc
(HLSC)
The entire line is at-risk due to no traffic volumes.
Lake Railway
(LRY)
The entire line is at-risk due to low traffic volumes.
Longview
Portland &
Northern
Railway (LPN)
The entire line is at-risk due to no traffic volumes.
Oregon Pacific
Railroad Co
(OPR)
Inside Clackamas County - The track from Liberal to Molalla has been removed without STB approval.
Port of
Tillamook Bay
Railroad
(POTB)
Due to severe storm damage in 2007 that left most of the line inaccessible, Port of Tillamook Bay Railroad has
curtailed service. Although repaired between Banks and Cochran, the line is not in use.
Portland &
Western
Railroad/
Willamette &
Pacific
Railroad
(PNWR/
WPRR)
Inside Washington County - Forest Grove (Hillsboro to Forest Grove), 5 miles – Line is in poor condition and current
low traffic volumes do not justify reinvestment. Has been considered as a possible route for light rail extension from
Hillsboro.

Oregon State Rail Plan Appendix
D-2 Cambridge Systematics, Inc.
PNWR /WPRR Inside Clatsop County - Astoria District (Wauna to Tongue Point) – There are no active customers on the line. Port
of Astoria has recently taken control of Tongue Point and is actively pursuing industrial development opportunities.
PNWR/ WPRR Inside Benton County - Bailey District (Greenberry to Monroe and Dawson). Approved for abandonment in 2011.
Salvage of line expected in 2014.
PNWR/ WPRR Inside Polk County - Dallas District (Gerlinger to Dallas) – The last shipper on the route, a Weyerhaeuser lumber
mill, closed permanently in 2009. Line currently being used for car storage.
Wallowa Union
Railroad
(WURR)
The entire line is at-risk due to almost no traffic volumes.
Willamette
Valley Railway
Co.(WVR)
The line is at-risk due to no traffic south of Silverton for almost two years.
Wyoming &
Colorado
Railroad
(WYCO)
The entire line is at-risk due to low traffic volumes.
Source: 2010 Oregon Rail Study; Information from stakeholders.