oregon global warming ommission - eenews.net · oregon global warming commission 2017 biennial...
TRANSCRIPT

Oregon Global Warming Commission
Biennial Report to the Legislature 2017
Oregon Global Warming Commission 2017 Biennial Report to the Legislature 2
The before-and-after cover photographs of Mt. Hood are from Gary Braasch,
an Oregon-based international environmental photo-journalist who died in
2016 while pursuing his passion of documenting the painful progress of
climate change around the world. Braasch was known and appreciated
worldwide for both his artistry and his social conscience. He had wide
experience in reporting on and photographing natural history, science and
environmental issues. He wrote two books on climate change; and his images
and stories have been published by the United Nations, major news websites,
magazines ranging from Scientific American to Vanity Fair, and as postage
stamps and iPhone and iPad apps.

Oregon Global Warming Commission 2017 Biennial Report to the Legislature 3
Oregon Global Warming Commission Chair
Angus Duncan President, Bonneville Environmental Foundation
Vice–Chair
Vacant
Voting Members*
Alan Zelenka Eugene City Councilor & Director of Energy Services for Kennedy/Jenks Consultants
Catherine Mater President, Mater Engineering
Andrea Durbin Executive Director, Oregon Environmental Council
Jill Eiland Oregon Corporate Affairs Manager, Intel Corporation
Jim Piro CEO and President, Portland General Electric
Gregg Kantor Former President and COO, Northwest Natural Gas
Eric Lemelson Owner and Manager, Lemelson Vineyards
Bill Wyatt Executive Director, Port of Portland
Ex Officio Members
Bill Bradbury Council Member, Northwest Power and Conservation Council
Lillian Shirley Director, Oregon Health Department
Michael Kaplan Director, Oregon Department of Energy
Matt Garrett Director, Oregon Department of Transportation
Richard Whitman Acting Director, Oregon Department of Environmental Quality
Lisa Hanson Acting Director, Oregon Department of Agriculture
Tom Byler Director, Oregon Department of Water Resources
Peter Daugherty Oregon State Forester
Lisa Hardie Chair, Oregon Public Utility Commission
Vacant Oregon State Legislature
Senator Bill Hansell Oregon State Legislature
Vacant Oregon State Legislature
*Two voting member positions of the Commission are vacant at the time of this Report

Oregon Global Warming Commission 2017 Biennial Report to the Legislature 4
OREGON GLOBAL
WARMING COMMISSION
Biennial Report to the Legislature
February 2017
Oregon Global Warming Commission 2017 Biennial Report to the Legislature 5
For more information on the Oregon Global Warming Commission please visit the
Commission’s website at www.KeepOregonCool.org.
For electronic copies of this Report visit the Commission’s website. For printed copies of the
Report please contact:
Oregon Global Warming Commission
1-800-221-8035 (toll free in Oregon)
Commission email: [email protected]

Oregon Global Warming Commission 2017 Biennial Report to the Legislature 6
Table of Contents Executive Summary ......................................................................................................................... 8
Letter from the Chair .................................................................................................................... 11
Oregon’s Greenhouse Gas Emissions: In-Boundary Inventory Update ........................................ 16
Key Takeaway: Rising Transportation Emissions ...................................................................... 16
Overview ................................................................................................................................... 16
In-Boundary Emissions Inventory ............................................................................................. 17
Inventory Overview............................................................................................................... 17
Total Emissions ..................................................................................................................... 17
Transportation Sector Emissions .......................................................................................... 19
Residential and Commercial Emissions ................................................................................ 21
Industrial Emissions .............................................................................................................. 22
Agriculture Emissions ............................................................................................................ 23
Oregon’s Greenhouse Gas Emission Projection ........................................................................... 24
Key Takeaway ............................................................................................................................ 24
Methodology ............................................................................................................................. 24
Conclusions ............................................................................................................................... 27
Forest Carbon Accounting in Oregon............................................................................................ 28
Key Takeaways and Recommendations for the Oregon Legislature ........................................ 28
Introduction .............................................................................................................................. 28
The OGWC Roadmap to 2020 ................................................................................................... 29
Forest Wildfire .......................................................................................................................... 30
Harvest ...................................................................................................................................... 33
Proposed Forest Carbon Accounting Methodology Development, Progress and Status ........ 34
Conclusion and Recommendations .......................................................................................... 36
Members of the OGWC Forest Carbon Accounting Advisory Task Force ................................. 43
Fixing State Climate Policymaking ................................................................................................ 44
Key Takeaways and Recommendations for the Oregon Legislature ........................................ 44
Statement of the Problem ........................................................................................................ 44
Remedy: Agency Accountability for Climate Action ................................................................ 46
Remedy: An OGWC Operating Budget and Resources ............................................................ 47

Oregon Global Warming Commission 2017 Biennial Report to the Legislature 7
Summing Up .............................................................................................................................. 47
OGWC Deliverables and Contributions to State and Community Climate Efforts ................... 48
Climate Impacts, Adaptation and Preparation ............................................................................. 50
OCCRI Third Assessment Key Takeaways.................................................................................. 50
State Agency Efforts to Prepare for Climate Impacts ............................................................... 51
Oregon Health Authority ...................................................................................................... 51
Oregon Department of Transportation ................................................................................ 52
Oregon Parks and Recreation Department .......................................................................... 53
Appendix: Oregon “In-Boundary” Greenhouse Gas Emission Data, 1990-2015 .......................... 54
Oregon Global Warming Commission 2017 Biennial Report to the Legislature 8
Executive Summary This Oregon Global Warming Commission (OGWC) 2017 Biennial Report to the Legislature
contains five somewhat distinct sections covering a wide range of the topics that the OGWC is
statutorily directed to track and evaluate. Some sections, like providing the most current
available greenhouse gas inventory data and recently updated emission projection, are topics
that the Commission has covered in detail in previous reports. Others, notably a discussion of
forest carbon accounting in Oregon, represent new or updated work by the Commission that
remains ongoing at the time that this report is being published. The key takeaways and
recommendations from each of these sections are summarized below.
Oregon’s Greenhouse Gas Emissions: In-Boundary Inventory Update
Key Takeaway: Rising transportation emissions are driving increases in statewide emissions.
As the updated greenhouse gas inventory data clearly indicate, Oregon’s emissions had been
declining or holding relatively steady through 2014 but recorded a non-trivial increase between
2014 and 2015. The majority of this increase (60%) was due to increased emissions from the
transportation sector, specifically the use of gasoline and diesel. The reversal of the recent
trend in emissions declines, both in the transportation sector and statewide, likely means that
Oregon will not meet its 2020 emission reduction goal. More action is needed, particularly in
the transportation sector, if the state is to meet our longer-term GHG reduction goals.
In the 2017 session, the Oregon Legislature has an opportunity in the context of discussing a
transportation funding package to prioritize policies and programs that will make material
differences in the GHG emissions from transportation, and, by extension, the state’s ability to
meet its legislatively adopted reduction goals.
The Commission recommends that the 2017 Legislature, in addressing Oregon’s overall
transportation and transportation funding needs, use the occasion to devise and adopt
measures that will bring transportation GHG emissions under control and aligned with
Oregon’s Greenhouse Gas Reduction Goals.
Oregon’s Greenhouse Gas Emission Projection
Key Takeaway: Oregon’s GHG goals are not likely to be met with existing and planned
actions.
The new forecast clearly shows the expected impacts of legislation from 2016 which extended
the renewable portfolio standard and implemented a coal import ban that comes into effect in
2030. We appear to be on track to miss our 2020 goal by just under 11 million MTCO2e. In
2035, we project we will miss the Commission’s adopted interim goal by just under 22 million
MTCO2e.

Oregon Global Warming Commission 2017 Biennial Report to the Legislature 9
Figure 1: Statewide Emission Projection
Despite the anticipated reductions due to implementation of Oregon’s RPS and other policies,
the state’s forecast is not expected to come within striking distance of either the statutorily
mandated 2020 and 2050 emission reduction goals, or the 2035 interim goal that the
Commission proposed in our last report.
Forest Carbon Accounting in Oregon
Key Takeaways and Recommendations for the Oregon Legislature: The Commission
recommends that the Legislature defer enacting new forest management policies that would
significantly affect carbon balances in Oregon’s forests until the Commission’s Forest Carbon
Accounting Project is complete and can inform such policies.
Oregon’s forests sequester very large quantities of carbon, presenting both risks (of release)
and opportunities (for greater capture and containment). Tools for quantifying amounts and
tracking flows and fluctuations – due to normal forest function, to climate change-induced
effects, and to human intervention – are evolving but incomplete.
There are three observations that argue for paying new and urgent attention to tracking forest
carbon fluctuations (flux):
1. Oregon forests contain on the order of 3 BILLION tons of carbon (roughly equal to 9.7
billion tons of CO2 equivalent), variously in standing timber and vegetation, standing
and fallen dead trees, and soils.
2. In the two reference periods (2001-05, and 2011-15) identified by the OGWC Forest
Carbon Task Force and involved experts, average CO2e emissions from wildfire averaged
between 1.5 and 4 million tons (mmT) annually. We are unable to establish yet if this
can be considered excessive, or normal, or somewhere in between. We find it difficult,
in fact, to define and identify a normative period. Absent additional information and
analysis, we hesitate to assert that this is a significant, or non-significant, addition to
Oregon’s + 60 mmT overall emissions inventory, especially after it is netted against
0
10
20
30
40
50
60
70
80
19
90
19
93
19
96
19
99
20
02
20
05
20
08
20
11
20
14
20
17
20
20
20
23
20
26
20
29
20
32
20
35
20
38
20
41
20
44
20
47
20
50
Mill
ion
Met
ric
Ton
s C
arb
on
Dio
xid
e Eq
uiv
alen
t
Historicalemissions
LEAP modelBAUprojectionGHG GoalTrajectory

Oregon Global Warming Commission 2017 Biennial Report to the Legislature 10
carbon taken up by and sequestered in growing trees? We also need to better
understand the flux effects of human interventions in the forests, whether for timber
harvest, forest health (thinnings), forest biomass-to-energy or other purposes.
3. When we have reliable inventory and flux numbers, we will still need to anticipate how
they may evolve as climate change increasingly affects Oregon’s forests? What does
this suggest about modifying forest practices going forward? What does it suggest
about human interventions in forests, whether to harvest for lumber or biomass-to-
energy feedstock, or to address forest health concerns resulting from historical and
prevailing practices (fire suppression; clear-cutting)? If forest health considerations
indicate removal of overgrowth and/or controlled fire as remediation, what are the
implications for both forest carbon accounts and carbon reduction options in other
sectors?
Fixing State Climate Policymaking
Key Takeaways and Recommendations for the Oregon Legislature: the State’s climate
policymaking machinery is not measuring up to the task of achieving GHG reduction goals
and preparing the state for the effects of climate change.
This failure is especially noteworthy for tasks not being informed by rigorous cost/benefit
analysis, guided by agency assignments and benchmarks, and tracked for performance.
The Commission recommends that the Legislature direct agencies to collaborate with the
Commission to set assignments (from the Commission’s Roadmap) and benchmarks, and to
report annually to the Commission on progress or lack of progress, and reasons why.
The Commission further recommends that the Legislature provide the Commission with
modest but sufficient resources – staff and budget – to enable it to discharge its
responsibilities in a timely and efficient way, including its analysis, communications and
tracking functions.
Climate Impacts, Adaptation and Preparation
Key Takeaways: Oregon is warming and the consequences are, and will be, notable.
Adaptation is necessary, as mitigation alone will not prevent serious impacts. Oregon must
do more to adapt to climate changes already underway.
Oregon at its peril remains unprepared for the health, flooding, drought, fire and ecosystem
damages that climate change is likely to bring. As noted in the Third Assessment Report from
the Oregon Climate Change Research Institute (OCCRI), some Oregon agencies have begun
work to prepare for the future effects of climate change. Despite efforts at a few select
agencies, there remains no statewide strategy for identifying adaptation and preparation needs
or tracking progress toward meeting those needs. At the State level the only effort to look
broadly across all agencies’ responsibilities took place in 2010 and needs updating, particularly
in light of the accumulated analysis and findings by OCCRI and other climate scientists.

Oregon Global Warming Commission 2017 Biennial Report to the Legislature 11
Letter from the Chair This Oregon Global Warming Commission 2017 Report to the Legislature differs from
previous reports in important respects – including specific recommendations – that we
hope the Legislature will carefully consider in its 2017 session deliberations.
Urgency of Action: Two recent developments argue for the Legislature to address
climate issues in 2017 with new urgency. The first is the not-unexpected but still
sobering news that 2016 has become the planet’s warmest year since reliable records
have been kept. In taking that dubious honor, 2016 edged out 2015, which in turn had
eclipsed 2014. The steadily accumulating evidence should erase any lingering doubts
that we are rapidly transforming the fundamental climatic conditions under which
human civilization emerged and evolved into the world we inherited, and of which we
are the stewards for succeeding generations. If it is not too late to protect our children
from the most severe effects of climate change, it soon will be.
At the same time the political pendulum in the federal government has swung 180
degrees, from an Administration that committed to an historic 2016 global Paris
Agreement and was actively driving down power plant and vehicle emissions, to one
that has characterized climate change as a Chinese hoax. While this shift was largely
unrelated to climate policy, it casts a dark cloud over prospects for progress at the
federal level.
Both developments underscore the importance of elevating our commitments – and
deliveries – at the state and community levels in regions of the country that are already
the climate leaders. The west coast states, including Oregon, have special obligations
and opportunities to re-commit to our goals and the fulfilling of those commitments.
Oregon took a nationally significant step last year in committing to end coal generation
serving Oregon electricity customers and in setting a new, higher standard for reliance
on renewably generated electricity. We cannot rest on those achievements in 2017, but
must build on them instead, most emphatically in our largest greenhouse gas-emitting
sector, transportation.
Timeliness of Report Delivery: For the first time we are delivering this 2017
Commission Biennial Report to the Legislature in advance of a legislative session rather
than four or five months into the session. In doing so we seek to inform the legislature
in advance of consideration of the important energy and climate decisions are made,
and not after they are set in stone or nearly so. Pending legislative decisions this year
on transportation, forest management, and how state agencies discharge their climate
responsibilities are critically important to the state making progress in a timely and

Oregon Global Warming Commission 2017 Biennial Report to the Legislature 12
meaningful way. The legislature must also address these issues in a timely way, not
defer them to a later session or allow the immediate to again drive out the important.
This Report, by providing timely data and recommendations, allows the legislature to
in turn do its job.
Transportation Emissions: Reliable 2015 data on transportation GHG emissions –
Oregon’s largest emissions sector; see pp. 17-18 of this report -- will allow 2017’s
legislators to rationally weigh choices to substantially reduce those emissions alongside
other transportation policies that provide economic stimulation and congestion relief (of
course many clean transportation choices also contribute materially to these other
important policy outcomes). The 2015 numbers suggest this debate is timely if not
overdue, as the increasing transportation emissions describe a perilous reversal of the
progress we’ve made over the last 15 years. This disturbing trend may be resulting
from the compounded effects of (1) a 2013-2015 upturn in Vehicle Miles Traveled by
Oregon drivers, and (2) a flattening out, since early 2015, of vehicle fuel efficiency
(MPG) gains nationally.
As legislators gather for their 2017 session and likely transportation legislation
including a gas tax increase, their choices should be guided by both economic and
environmental outcomes including these disturbing transportation emissions trends,
and by the findings of the 2013 Sustainable Transportation Strategy ODOT analysis that
identifies increased transit service levels, and wider deployment of Electric Vehicles
(EV’s) reliant on a clean electrical grid as two critical strategies to contain those
emissions.
Other GHG Sector Emissions Data: Addressing utilities and transportation leaves an
important 25% of emissions needing attention as well. Our data for these areas are
slower to assemble, although we’ll be working on their timeliness also. For now we’ll
use two year old data in most cases, a lag that should not greatly impair legislative
decision-making as technology and policy changes accumulate more slowly in sectors
such as agriculture and materials management.
Forest Carbon Accounting: A signal exception to this generalization is, we believe, in
forests and forest carbon accounting. The potential game-changer in forest carbon
management is climate change itself, acting through insects, disease and wildfire, to
change the carbon equation in Oregon’s forests. Reliable, comprehensive data on
greenhouse gas emissions and sequestration associated with forests was largely non-
existent when the Commission proposed policies in its 2010 Roadmap to 2020.

Oregon Global Warming Commission 2017 Biennial Report to the Legislature 13
There are three observations that argue for paying new and urgent attention to tracking
forest carbon flux.
1. Oregon forests contain on the order of 3 BILLION tons of carbon1, variously in
standing timber and vegetation, standing and fallen dead trees, and soils.2
2. In the two reference periods (2001-05, and 2011-15) identified by the OGWC
Forest Carbon Task Force and involved experts, average CO2e emissions from
wildfire averaged between 3 and 4 million tons annually. It’s unclear whether
we should consider this excessive, or normal, or somewhere in between when
compared to a “normative” period . . . if we can define and identify a normative
period at all? What, if anything, does it add to Oregon’s + 60 mm Ton overall
emissions inventory after it is netted against carbon taken up by and sequestered
in growing trees?3
3. When we have the numbers, how should we expect them to evolve as climate
change tightens its grip on Oregon and its forests? What does this suggest about
modifying forest practices going forward? What does it suggest about human
interventions in forests, whether to harvest for lumber or biomass-to-energy
feedstock, or to address forest health concerns resulting from past and prevailing
practices (fire suppression; clear-cutting)? If forest health considerations indicate
removal of overgrowth and/or controlled fire as remediation, what are the
implications for both forest carbon accounts and other carbon reduction options?
The OGWC recommends that the Legislature defer new policies or management actions
until the accounting project now underway is complete. At that point legislators,
agency staff and the Commission will have a clearer idea what combination of actions
can best optimize for both forest health and carbon sequestration outcomes.
Adaptation and Preparation: We are pleased to highlight the work of the Oregon
Health Authority in preparing Oregonians for the health risks anticipated as climate
1 When calculating a forestry carbon impact per ton it’s important to distinguish between the element “carbon” and the molecule “carbon dioxide (CO2).” For purposes of analyzing forest carbon, the focus is on the flow of the carbon atom among the pools (or into a forest products pool); and then, if carbon-based plants and trees are combusted (oxidized) in or out of the forest, on the flow of the resulting carbon dioxide into the atmosphere. To convert from “carbon” to “carbon dioxide equivalent/CO2e” multiply the carbon/acre by 3.67, then divide by 1.102. Thus the total FIA all-pools Oregon forest carbon amount of 2,907.6 mm tons equals 9,683.2 mm tons CO2e. 2 Per USFS Forest Inventory and Analysis (FIA) data (2016). 3 For purposes of comparison, the Boardman coal-fired power plant, the largest single point source of in-state carbon emissions, emits an average of around 2mm tons of carbon dioxide annually.

Oregon Global Warming Commission 2017 Biennial Report to the Legislature 14
change takes a firmer grip on our state. This report, and the actions recommended,
stand in stark contrast to the general absence of systematic, comprehensive preparation
by the State of Oregon as a whole. There are instances of other individual agencies
studying climate trends and effects, and as well some local jurisdictions have attended
to these, but at the State level the only effort to look broadly across all agencies’
responsibilities took place in 2010 (see: Oregon Climate Change Adaptation
Framework;
http://www.oregon.gov/LCD/docs/climatechange/framework_summary.pdf). That
admirable but limited effort sorely needs updating, particularly in light of the
accumulated analysis and findings over the last six years by the Oregon Climate
Change Research Institute.4 The OGWC had hoped to revisit adaptation issues in 2016
but was unable to do so for the same reasons the agencies have deferred: limited
resources and competing priorities. Nonetheless, Oregon at its peril remains
unprepared for the health, flooding, drought, fire and ecosystem unraveling that
climate change is likely to bring.
Timeliness of Data: The Commission, and staff at ODEQ and ODOE, have worked
diligently to accelerate the assembly and verification of greenhouse gas emissions data
for Oregon. The Legislature and the Governor, going forward from this Report, will
have data on transportation- and utility-related GHG emissions that are no more than
six to nine months old. This Report includes 2015 emissions numbers in these two
areas, which comprise + 75% of overall state emissions.
Having timely electric utility numbers would have better informed the Legislature on
both urgency and outcomes when it considered SB 1547 (the Clean Electricity and Coal
Transition Act) last February. Instead it had to make do with three-year old data – an
age when electricity technologies and resource choices are rapidly and dramatically
changing.
Consistent Climate Policies, Implementation, Oversight and Accountability: To take up
adaptation and preparation, to provide the Legislature with a workable forest carbon
accounting methodology, to provide Oregonians with useful and accurate information
on the risks they should be preparing for and the preventative actions they can take,
and to track and work with State agencies as they discharge their climate
responsibilities, Oregon needs better machinery than it’s got today.
4 The most recent comprehensive assessment was published in 2013. An updated assessment is due in early 2017.

Oregon Global Warming Commission 2017 Biennial Report to the Legislature 15
The OGWC, early on, adopted Principles that said in summary: first, follow the science;
second, figure out least cost remedies and frame our recommendations around these.
But absent the minimal resources and access to professional analysis, neither the OGWC
nor any other State entity has been able to make more than a cursory stab at ranking
and prioritizing such remedies across the range of State programs and responsibilities.
From agency to agency, climate considerations surface and submerge in priority in no
predictable pattern except as immediate demands drive out any consistent climate
focus. The OGWC was established by the 2007 Legislature as the party responsible for
making sense of this ball of yarn, but then was given neither budget nor authority, and
only limited staff support, to discharge responsibilities that extend across most State
agencies and actions. Climate change causes and effects involve jurisdictions outside
the State as well: businesses, private citizens, ecosystems and interactions with Federal
regulatory and resource management entities.
The OGWC (or any replacement entity) isn’t responsible for all such interactions; isn’t,
couldn’t be and shouldn’t be. But the State’s climate policies need an entity that can
assure important questions aren’t being deferred or falling through the cracks; that can
work with State agencies and their stakeholders to create goals and benchmarks; and
that can track progress or its absence, the reasons why, and what the Governor and
Legislature should do to sustain the first and address the second.
The OGWC has worked with Members of this 2017 Legislature on crafting statutory
language that could begin to address this unwholesome absence of accountability. We
are prepared to meet with legislators at their request to explain, clarify, rewrite or
otherwise assist in bringing Oregon’s ability to deal with its climate responsibilities in
ways commensurate with the opportunities and hazards they contain.
Sincerely,
Angus Duncan, Chair
Oregon Global Warming Commission
Oregon Global Warming Commission 2017 Biennial Report to the Legislature 16
Oregon’s Greenhouse Gas Emissions: In-Boundary Inventory Update
Key Takeaway: Rising Transportation Emissions As the data summarized below clearly indicate, Oregon’s greenhouse gas emissions had been
declining or holding relatively steady through 2014 but recorded a non-trivial increase between
2014 and 2015. The majority of this increase (60%) was due to increased emissions from the
transportation sector, specifically the use of gasoline and diesel.5 The reversal of the recent
trend in emissions declines, both in the transportation sector and statewide, likely means that
Oregon will not meet its 2020 emission reduction goal (more on the GHG forecast below).
More action is needed, particularly in the transportation sector, if the state is to meet our
longer-term GHG reduction goals. In the 2017 session, the Oregon Legislature has an
opportunity in the context of discussing a transportation funding package to prioritize policies
and programs that will make material differences in the GHG emissions from transportation,
and, by extension, the state’s ability to meet its legislatively adopted reduction goals.
The Commission recommends that the 2017 Legislature, in addressing Oregon’s overall
transportation and transportation funding needs, use the occasion to devise and adopt
measures that will bring transportation GHG emissions under control and aligned with
Oregon’s GHG reduction goals.
Overview Oregonians contribute to greenhouse gas emissions in a variety of ways, spanning nearly all of
the activities that we engage in. Having a solid understanding of these emissions, including
those that occur both in-state and out-of-state and from both production and consumption, is
the first step to analyzing what sorts of actions might be required for us to meet our long-term
emission reduction goals.
Prior to 2010, Oregon’s GHG inventory was constructed in a “top-down” fashion, using an
inventory tool published by the U.S. Environmental Protection Agency (EPA). Beginning in 2010,
Oregon’s largest emitters of GHGs began reporting their emissions to the Oregon DEQ as part of
the mandatory GHG reporting program. In 2013, the Oregon Departments of Environmental
Quality, Energy, and Transportation produced a technical report6 which utilized both the “top-
down” method and the reported data, and provided a greenhouse gas inventory using multiple
emission accounting methodologies.
The report analyzed data up to the year 2010 and described three inventories: in-boundary
emissions, which are those that occur within Oregon’s borders plus emissions associated with
the use of electricity within Oregon; consumption-based emissions, which are those global
5 Most of the balance of the increase was in residential/commercial emissions, where action taken by the 2016 legislative session to back out coal-by-wire electricity imports and increase the Renewable Portfolio Standard should result in long-term decreased sector emissions. There is no parallel driver to reduce transportation emissions. 6 http://www.oregon.gov/deq/AQ/Documents/OregonGHGinventory07_17_13FINAL.pdf

Oregon Global Warming Commission 2017 Biennial Report to the Legislature 17
emissions associated with satisfying Oregon’s consumption of goods and services, including
energy; and expanded transportation sector emissions, which evaluated the full life-cycle
emissions from fuel use by ground and commercial vehicles, freight movement of in-bound
goods, and air passenger travel. The 2015 Oregon Global Warming Commission (OGWC)
Biennial Report to the Legislature contained the first update to these inventories.7
This 2017 OGWC Biennial Report to the Legislature provides an update to the in-boundary
emissions inventory through 2015. Although EPA’s inventory tool only currently contains data
through 2013, Oregon DEQ is able to construct a “hybrid” inventory through 2015 using the
most recently reported GHG data that it collects along with slightly older GHG data for other
sectors available through the EPA’s tool. The data that comprise the in-boundary inventory are
contained in the Appendix to this Report.
In-Boundary Emissions Inventory
Inventory Overview
Oregon’s in‐boundary inventory estimates greenhouse gas emissions that occur within the
State’s jurisdictional boundary and those that are associated with the generation of electricity
used by Oregonians within that boundary. This inventory includes emissions from the
combustion of fuel used in Oregon, the processing and disposal of waste and other materials,
the generation and transmission of electricity used in Oregon, agricultural and industrial
operations, and a variety of other processes. Most of these emissions occur within the State,
though a substantial share of the electricity used by Oregonians is generated out of state, and
the emissions from this out of state generation are included in this inventory. Likewise,
emissions from electricity generation occurring in Oregon that is used out of state are
presented separately and not included in the statewide emission totals of this inventory.
Total Emissions
Following is a discussion of the 2015 inventory, how it compares with prior years, and how the
estimates of prior year emissions have changed slightly since the last inventory.8 Key economic
sectors and their trends are presented, followed by an examination of those sectors in greater
detail. Additional information and data on sources of emissions is available in the Appendix. In
addition, the Appendix contains data on per capita emissions and the carbon intensity of
Oregon’s economy over time.
7 http://www.keeporegoncool.org/sites/default/files/ogwc-standard-documents/OGWC_Rpt_Leg_2015_final.pdf 8 We endeavor to work with state agencies to reduce the time to 1-2 years between when raw data is reported and when the updated state inventory is available.

Oregon Global Warming Commission 2017 Biennial Report to the Legislature 18
Table 1: Oregon Emissions by Sector, 1990-2015 (Million MT CO2e) 1990 1995 2000 2005 2010 2011 2012 2013 2014 2015
Transportation 21.0 22.6 24.4 24.7 23.2 22.3 22.3 21.3 21.4 23.2
Residential &
Commercial 16.6 19.9 23.1 22.0 23.3 22.5 20.8 22.0 21.4 22.2
Industrial 13.9 16.9 18.0 13.7 12.3 12.2 11.5 11.9 12.4 12.8
Agriculture 4.9 5.5 5.3 5.7 5.2 5.5 5.5 5.2 5.2 5.2
Total 56.4 64.9 70.7 66.2 63.9 62.4 60.2 60.3 60.3 63.4
Table 1 summarizes greenhouse gas emissions by economic sectors since 1990. Transportation
remains the largest contributor to the State’s in‐boundary emissions. Residential and commercial
activity continues to be the second largest contributor. The industrial sector is the third largest
contributor, with about half as much emissions as the transportation or the residential and
commercial sectors. Finally, agricultural activity is a distant fourth. Overall, emissions declined
approximately 15 percent between 2000 and 2014, but increased by 5% in just one year
(between 2014 and 2015). A more detailed discussion of this increase is included below and in
the sector-specific sections on the pages that follow.
Figure 2: Oregon Emissions by Sector, 1990-2015 (Million Metric Tons of Carbon Dioxide Equivalent)
Figure 2 illustrates how the state’s emissions have changed in each economic sector since 1990.
Emissions from agriculture have been relatively constant, at slightly above 5 million MTCO2e
each year. The transportation sector has failed to show needed emissions reductions,
0.00
10.00
20.00
30.00
40.00
50.00
60.00
70.00
80.00
19
90
19
91
19
92
19
93
19
94
19
95
19
96
19
97
19
98
19
99
20
00
20
01
20
02
20
03
20
04
20
05
20
06
20
07
20
08
20
09
20
10
20
11
20
12
20
13
20
14
20
15
Mill
ion
met
ric
ton
s
Transportation Residential & Commercial Industrial Agriculture

Oregon Global Warming Commission 2017 Biennial Report to the Legislature 19
remaining mostly flat since 1990 at just above 20 million MTCO2e, with slight declines in recent
years largely erased by increased emissions in 2015. The residential and commercial sector
grew through the 1990s, in part due to the retirement of GHG free Trojan Nuclear Plant, but
has since declined to approximately 1993 emission levels, likely due to the drop in emissions
associated with electricity use over that time. However, similar to the transportation sector,
residential and commercial sector emissions increased in 2015 due primarily to increased
emissions from electricity use. The industrial sector’s emissions rose gradually through the
1990s to a peak in 1999 of 19.3 million MTCO2e, and declined most years since then, and were
12.8 million MTCO2e in 2015.
Transportation Sector Emissions
Emissions attributed to transportation are primarily from fuel used by on-road vehicles,
including passenger cars and trucks, as well as freight and commercial vehicles. This sector also
includes aviation fuel and off-road transportation such as farm vehicles, locomotives, and
boats.
Figure 3 illustrates how the state’s emissions from transportation fuel have changed since 1990
by the relative contribution of each fuel type. Non-CO2 gases include methane and nitrous oxide
that are byproducts of fuel combustion and fluorinated gases with high global warming
potential from air conditioning and other auxiliary systems on vehicles. The other fuels category
includes propane, natural gas, lubricant emissions and electricity. Aviation fuels include
kerosene jet fuel, aviation-grade gasoline, and naphtha jet fuel. Diesel & residuals include all
distillate and residual fuels used for transportation.
Total emissions from transportation have fluctuated since 1990 rather than declining consistent
with Oregon’s goals. From 2007 to 2014, emissions from transportation were either relatively
flat or declining. In 2015, there was a noticeable uptick in emissions from motor gasoline and
diesel use which caused emissions from the sector to increase by 1.8 million MTCO2e, an 8
percent increase between 2014 and 2015. It is possible that this is a reflection of the economy
rebounding from the recession, and the corresponding increase in driving and purchases of
goods. The increase is also likely driven in part by increasing vehicle miles traveled (VMT) which
saw a dramatic spike in 2015 compared to 2014 (See Figure 4).9
9 Note: This chart only shows vehicle miles traveled on Oregon highways and excludes VMT on other types of roads because the rest of the data for 2015 was not available at the time of writing.

Oregon Global Warming Commission 2017 Biennial Report to the Legislature 20
Figure 3: Oregon Emissions from Transportation Fuel Use (Million Metric Tons of Carbon Dioxide Equivalent)
Figure 4: Statewide Highway Vehicle Miles Traveled (Billion)
Source: Oregon Department of Transportation, http://www.oregon.gov/ODOT/TD/TDATA/Pages/tsm/vmtpage.aspx
0
5
10
15
20
25
30M
illio
n m
etri
c to
ns
CO
2 e
qu
ival
ent
Gasoline Diesel & residuals Aviation fuels Other fuels Non CO2 gases
15
16
17
18
19
20
21
22
19
90
19
91
19
92
19
93
19
94
19
95
19
96
19
97
19
98
19
99
20
00
20
01
20
02
20
03
20
04
20
05
20
06
20
07
20
08
20
09
20
10
20
11
20
12
20
13
20
14
20
15
Bill
ion
Hig
hw
ay M
iles
Trav
eled

Oregon Global Warming Commission 2017 Biennial Report to the Legislature 21
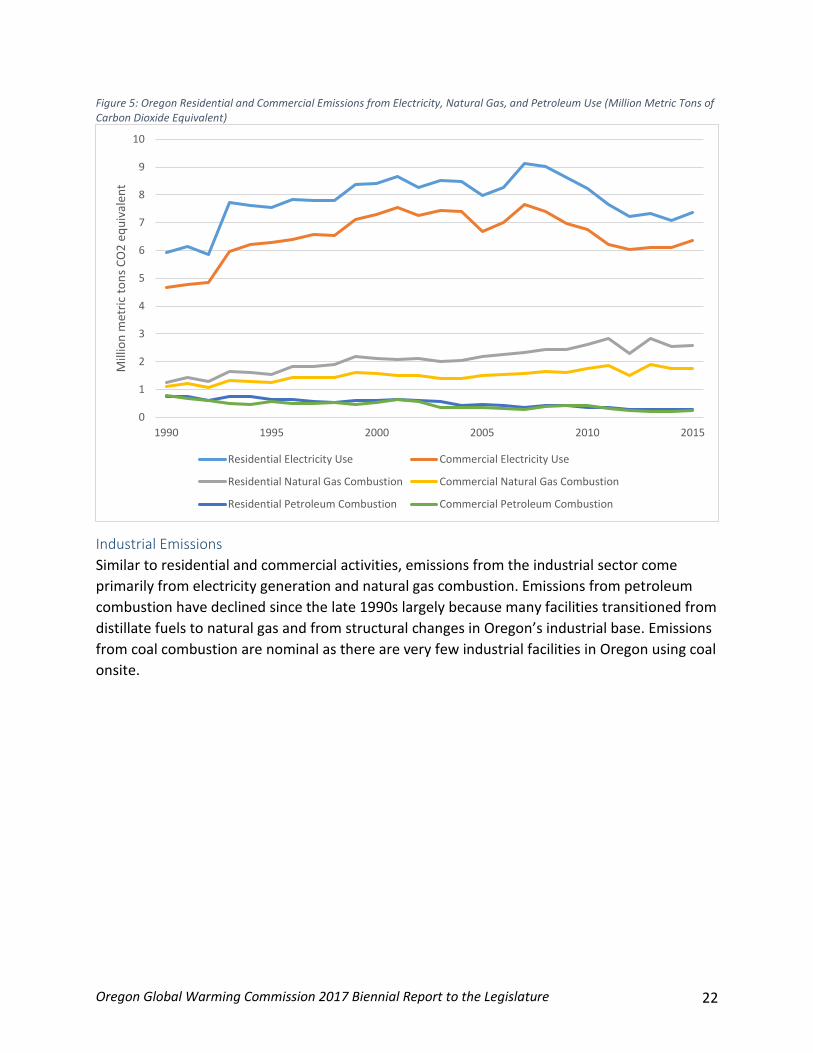
Residential and Commercial Emissions
Emissions from residential and commercial activities come primarily from generation of
electricity and natural gas combustion to meet the energy demand from this sector. Other
sources of emissions from this sector include small amounts of petroleum fuels burned
primarily for heating, decomposition of waste in landfills, waste incineration, wastewater
treatment, fugitive emissions associated with the distribution of natural gas, and from the
fertilization of landscaped areas. Fluorinated gases from refrigerants, aerosols, and fire
protection are also a small but increasing source of emissions from this sector.
Figure 5 illustrates how the state’s emissions from electricity, natural gas, and petroleum use in
residential and commercial activities have changed since 1990. Emissions from residential and
commercial electricity use have followed a similar trend during this period, with residential use
consistently between one and two million MTCO2e higher than commercial use each year.
Annual variation in weather influences both electricity demand and the supply of renewable
energy from wind and hydroelectric sources. Emissions associated with natural gas direct use in
residential and commercial applications have increased steadily since 1990 with the exception
of 2012.
The annual emissions intensity of Oregon’s electricity is influenced by weather and hydrological
conditions that affect hydroelectric generation. The less power that is available from dams, the
more electricity Oregon utilities must acquire from other sources, much of which is generated
with fossil fuels. So, changes in annual emissions from various uses within each sector may have
as much or more to do with annual differences in the emissions intensity of Oregon’s electricity
as with changes in demand. Emissions associated with electricity use rose during the 1990s but
have been on a downward trend in recent years, although the last few years have seen flat or
increasing emissions from electricity.
Oregon Global Warming Commission 2017 Biennial Report to the Legislature 22
Figure 5: Oregon Residential and Commercial Emissions from Electricity, Natural Gas, and Petroleum Use (Million Metric Tons of Carbon Dioxide Equivalent)
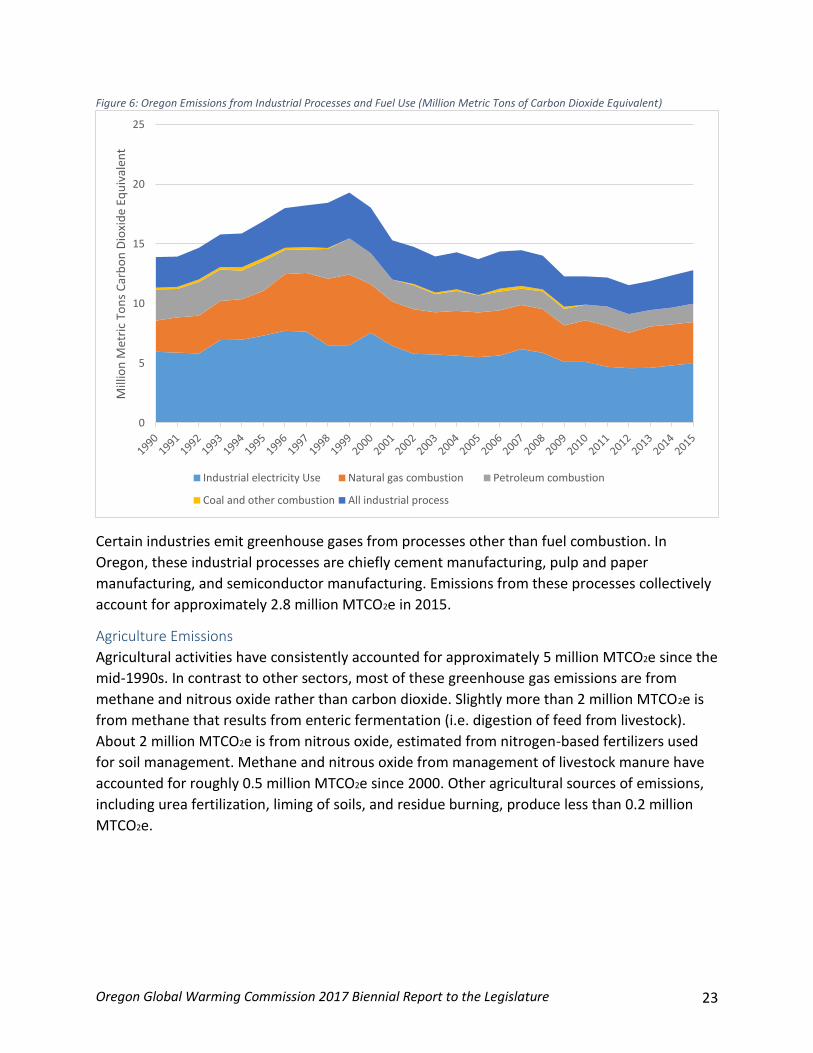
Industrial Emissions
Similar to residential and commercial activities, emissions from the industrial sector come
primarily from electricity generation and natural gas combustion. Emissions from petroleum
combustion have declined since the late 1990s largely because many facilities transitioned from
distillate fuels to natural gas and from structural changes in Oregon’s industrial base. Emissions
from coal combustion are nominal as there are very few industrial facilities in Oregon using coal
onsite.
0
1
2
3
4
5
6
7
8
9
10
1990 1995 2000 2005 2010 2015
Mill
ion
met
ric
ton
s C
O2
eq
uiv
alen
t
Residential Electricity Use Commercial Electricity Use
Residential Natural Gas Combustion Commercial Natural Gas Combustion
Residential Petroleum Combustion Commercial Petroleum Combustion
Oregon Global Warming Commission 2017 Biennial Report to the Legislature 23
Figure 6: Oregon Emissions from Industrial Processes and Fuel Use (Million Metric Tons of Carbon Dioxide Equivalent)
Certain industries emit greenhouse gases from processes other than fuel combustion. In
Oregon, these industrial processes are chiefly cement manufacturing, pulp and paper
manufacturing, and semiconductor manufacturing. Emissions from these processes collectively
account for approximately 2.8 million MTCO2e in 2015.
Agriculture Emissions
Agricultural activities have consistently accounted for approximately 5 million MTCO2e since the
mid-1990s. In contrast to other sectors, most of these greenhouse gas emissions are from
methane and nitrous oxide rather than carbon dioxide. Slightly more than 2 million MTCO2e is
from methane that results from enteric fermentation (i.e. digestion of feed from livestock).
About 2 million MTCO2e is from nitrous oxide, estimated from nitrogen-based fertilizers used
for soil management. Methane and nitrous oxide from management of livestock manure have
accounted for roughly 0.5 million MTCO2e since 2000. Other agricultural sources of emissions,
including urea fertilization, liming of soils, and residue burning, produce less than 0.2 million
MTCO2e.
0
5
10
15
20
25M
illio
n M
etri
c To
ns
Car
bo
n D
ioxi
de
Equ
ival
ent
Industrial electricity Use Natural gas combustion Petroleum combustion
Coal and other combustion All industrial process

Oregon Global Warming Commission 2017 Biennial Report to the Legislature 24
Oregon’s Greenhouse Gas Emission Projection
Key Takeaway Despite the anticipated reductions due to implementation of Oregon’s RPS and other policies,
the state’s forecast is not expected to come within striking distance of either the statutorily
mandated 2020 and 2050 emission reduction goals, or the 2035 interim goal that the
Commission proposed in our last report.
Methodology Using data available through the Mandatory Reporting program at Oregon DEQ and other tools
available to Oregon, we are able to continually assess whether or not we are likely to meet our
statutorily required emission reduction goals, and where the best opportunities lie for the most
efficient reductions. This section examines what the data tell us about whether we are on track
to meet our goals, which are to reduce emissions by 10% and 75% below 1990 levels by 2020
and 2050, respectively.
For this Report we have access to an analysis of Oregon’s projected future greenhouse gas
emissions that was conducted by a consultant for Oregon DEQ in response to a legislative
request during the 2016 legislative session.10 The analysis was conducted using the Long-range
Energy Alternatives Planning (LEAP) model which was developed by the Stockholm
Environment Institute for the purposes of conducting long-term energy and greenhouse gas
forecasts and scenario analyses. State staff are hoping to make use of this tool for future
Oregon GHG forecasts because it is superior to our previous methodology in several ways,
notably its ability to disaggregate the forecast by sector and/or fuel type.11 The forecast allows
us to see the direction the state’s emissions are headed in the absence of additional policy
intervention.
Figure 9 shows the current “business as usual” (BAU) forecast using the new methodology
discussed above in comparison to the Commission’s previous estimate of BAU. Our new
forecast for BAU includes one significant update from our last forecast:
In 2016, the Oregon Legislature increased and extended the Renewable Portfolio Standard
(RPS) and banned the import of coal-fired power into Oregon after 2030.12 The two largest
investor-owned utilities (Portland General Electric and Pacificorp) are now required to acquire
50 percent of the power they use to serve Oregon customers from qualifying renewable
sources by 2040.13 In addition, these utilities may not allocate the costs or benefits of coal-fired
10 http://www.deq.state.or.us/aq/climate/GHGmarket.htm 11 In preparing the data for this report, state staff compared the GHG forecasting methodology with the previous methodology (using EPA’s SIT tool) and found the resulting state-wide forecasts to be similar with a couple of differences that can be explained. The similar nature of the overall forecasts allows us to be confident in switching to a new modeling tool for future forecasts, while being able to take advantage of the benefits of the new tool. 12 The coal import ban may apply in 2035 to Portland General Electric’s ownership share of Colstrip. 13 The original RPS required the largest utilities to acquire 25 percent of their power from renewable sources by 2025 with no further increased requirements after 2025.
Oregon Global Warming Commission 2017 Biennial Report to the Legislature 25
power to Oregon customers after 2030, effectively banning its import into Oregon. These two
utilities provided an estimate of resource procurement strategies that would allow them to
meet the new requirements for purposes of constructing a new statewide GHG forecast (See
Figures 7 and 8). The individual utility forecasts are shown below. These forecasts were
included in the modeling of the statewide GHG forecast conducted using the LEAP model,
shown in Figure 9.

Oregon Global Warming Commission 2017 Biennial Report to the Legislature 26
Figure 7: Pacificorp Oregon Emissions Projection
Figure 8: PGE Emissions Projection
0
2
4
6
8
10
12
20
17
20
19
20
21
20
23
20
25
20
27
20
29
20
31
20
33
20
35
20
37
20
39
20
41
20
43
20
45
20
47
20
49
Mill
ion
Me
tric
To
ns
of
Car
bo
n D
ioxi
de
Eq
uiv
len
t
PACProjectedemissions
Trajectory ofPAC "share"of state goal
0
1
2
3
4
5
6
7
8
9
20
17
20
19
20
21
20
23
20
25
20
27
20
29
20
31
20
33
20
35
20
37
20
39
20
41
20
43
20
45
20
47
20
49
Mill
ion
Me
tric
To
ns
of
Car
bo
n D
ioxi
die
Eq
uiv
ale
nt
PGEProjectedemissions
Trajectoryof PGE"share" ofstate goal

Oregon Global Warming Commission 2017 Biennial Report to the Legislature 27
It is clear from the utilities’ projections that their strategies for meeting the new resource
procurement requirements will produce mixed results with regard to meeting a proportional
share of the state’s GHG reduction goals.14 These projections will change over time as the
utilities develop strategies to meet their competing demands and requirements. The data
behind these projections is incorporated into the statewide forecast below.
Figure 9: Current and Previous Business-as-Usual GHG Forecasts
Conclusions The new forecast clearly shows the expected impacts of the 2016 legislation, particularly the
coal import ban that comes into effect in 2030. In the years leading up to 2030, the previous
forecast and our new projection look quite similar, which would be expected given that there
are no new major planned policy changes during those years as compared to our last forecast.
Despite the anticipated reductions due to implementation of Oregon’s RPS and other policies,
the state’s forecast is not expected to come within striking distance of either the statutorily
mandated 2020 and 2050 emission reduction goals, or the 2035 interim goal that the
Commission proposed in our last report. We appear to be on track to miss our 2020 goal by
just under 11 million MTCO2e. In 2035, we project we will miss our interim goal by just under
22 million MTCO2e, which is an improvement from the gap for 2035 that we projected in our
last report (32 million MTCO2e).
14 The GHG reduction goals adopted by the 2007 Legislature are for the state economy overall and are not specific
to any single source (company or facility).
0
10
20
30
40
50
60
70
80
19
90
19
93
19
96
19
99
20
02
20
05
20
08
20
11
20
14
20
17
20
20
20
23
20
26
20
29
20
32
20
35
20
38
20
41
20
44
20
47
20
50
Mill
ion
Met
ric
Ton
s C
arb
on
Dio
xid
e Eq
uiv
alen
t
Historicalemissions
LEAP modelBAU projection
Previous BAUForecast
GHG GoalTrajectory

Oregon Global Warming Commission 2017 Biennial Report to the Legislature 28
Forest Carbon Accounting in Oregon
Key Takeaways and Recommendations for the Oregon Legislature Oregon’s forests sequester very large quantities of carbon, presenting both risks (of release)
and opportunities (for greater capture and containment). Tools for quantifying amounts and
tracking flows and fluctuations – due to normal forest function, to climate change-induced
effects, and to human intervention – are evolving but incomplete.
The Commission recommends that the Legislature defer enacting new forest management
policies that would significantly affect carbon balances in Oregon’s forests until the
Commission’s Forest Carbon Accounting Project is complete and can inform such policies.
Introduction There are three observations that argue for paying new and urgent attention to tracking forest
carbon fluctuations (flux).
1. Oregon forests contain on the order of 3 BILLION tons of carbon,15 variously in standing
timber and vegetation, standing and fallen dead trees, and soils.16
2. In the two reference periods (2001-05, and 2011-15) identified by the OGWC Forest
Carbon Task Force and involved experts, average CO2e emissions from wildfire averaged
between 1.5 and 4 million tons (mmT) annually. We are unable to establish yet if this
can be considered excessive, or normal, or somewhere in between. We find it difficult,
in fact, to define and identify a normative period. Absent additional information and
analysis, we hesitate to assert that this is a significant, or non-significant, addition to
Oregon’s + 60 mmT overall emissions inventory, especially after it is netted against
carbon taken up by and sequestered in growing trees?17 We also need to better
understand the flux effects of human interventions in the forests, whether for timber
harvest, forest health (thinnings), forest biomass-to-energy or other purposes.
3. When we have reliable inventory and flux numbers, we will still need to anticipate how
they may evolve as climate change increasingly affects Oregon’s forests? What does
this suggest about modifying forest practices going forward? What does it suggest
15 “Carbon dioxide” (CO2) is a colorless, odorless gas that exists in the earth’s atmosphere at a present ratio of + 402 ppm and acts as a “greenhouse gas” that reflects radiated heat back to earth and adds to atmospheric warming and planetary climate disruption. “Carbon” is an element with an atomic weight of 12; add two oxygen atoms to create a molecule of CO2 with an atomic weight of 44. When calculating a “carbon cost” per ton it’s important to distinguish between the two. For purposes of analyzing forest carbon, the focus is on the flow of the carbon atom among the pools (or into a forest products pool); and then, if carbon-based plants and trees are combusted (oxidized) in or out of the forest, on the flow of the resulting carbon dioxide into the atmosphere. To convert from “carbon” to “carbon dioxide equivalent/CO2e” multiply the carbon/acre by 3.67, then divide by 1.102. Thus the total FIA all-pools Oregon forest carbon amount of 2,907.6 mm tons equals 9,683.2 mm tons CO2e. ) in or out of the forest, on the flow of the resulting carbon dioxide into the atmosphere. 16 Per USFS Forest Inventory and Analysis (FIA) data (2016). 17 For purposes of comparison, the Boardman coal-fired power plant, the largest single point source of in-state carbon emissions, emits an average of around 2mm tons of carbon dioxide annually.

Oregon Global Warming Commission 2017 Biennial Report to the Legislature 29
about human interventions in forests, whether to harvest for lumber or biomass-to-
energy feedstock, or to address forest health concerns resulting from historical and
prevailing practices (fire suppression; clear-cutting)? If forest health considerations
indicate removal of overgrowth and/or controlled fire as remediation, what are the
implications for both forest carbon accounts and carbon reduction options in other
sectors?
Carbon flux in forests is both an Oregon and a national concern. US Senator Susan Collins (R-
Maine) has offered language over the last several years that would define forest biomass-to-
energy conversions as “carbon neutral,” intentionally overlooking the critical time dimension to
emissions impacts.18 Oregon has considered legislation that would connect wildfire to black
carbon emissions and potentially lead to new forest wildfire suppression policies, in the
absence of being able to quantify either net GHG benefits or forest health tradeoffs.
The OGWC Roadmap to 2020 The Roadmap to 2020, adopted by the Commission in 2010, sets out broad objectives and
specific tasks for managing the carbon contained in Oregon’s forests.
The Roadmap sets forth an overall goal, between 2010 and 2150, of “no net loss of Oregon
forested lands and a net gain in carbon storage in an amount to be determined.”
The Roadmap sees “Eastside forests . . . managed primarily for ecosystem restoration, safety
and climate adaptation with a minimum of incurred carbon (loss). West-side forests (are)
managed . . . to increase carbon storage. . . . .private forestlands (are) managed primarily for
production of timber and wood products . . .” with carbon stores remaining stable or increasing.
Specific tasks identified include:
Establish a Carbon Inventory for Oregon Forests
Pursue Reforestation/Afforestation
Invest in Key Research Actions ‐ impacts of climate change, adaptation tools, and benefits of durable products
Advance Energy and Forest policies supporting biomass facilities With this Report the Commission will have completed its first task, and commenced serious enquiry into its third task.
18 That is, a forest harvested for biomass-to-energy combustion may regenerate and reclaim its carbon content over the succeeding 100 years or so. This may be true but not relevant, since the critical period for cutting carbon releases is in the next 10-30 years if we are to avoid the worst effects of global climate disruption later in this century.

Oregon Global Warming Commission 2017 Biennial Report to the Legislature 30
Forest Wildfire Historical Context: Managing for forest carbon releases is often associated with, and offered as
supporting, new policies to limit forest wildfire. The historical role fire has played in forest
ecosystem health and in forest products harvest is a complex one. For most of the 20th
Century, federal and state forest management practices included fire suppression as a default
strategy in dealing with forest wildfire (see: Smokey The Bear). This was in reaction to
extensive fires during the 1850-1940 period that included the largest forest wildfires in
recorded Oregon history.
Reconsidering the Utility of Forest Fire: In the last 20 years or so of the last century and
continuing into this one, forest management professionals have come to acknowledge the
natural and essential role fire has historically played in forest ecology (or “roles” to be more
precise, since wildfire contributes differently in different forest ecosystems19 but is generally
seen now to be essential in most or all forests). Some informed observers posit a wildfire
“deficit” persisting from the many years of fire suppression, as forest stands have grown
crowded with smaller trees, altering ecosystem balances and increasing the risk of catastrophic
wildfire that can “ladder” up the small trees to reach the crowns of large ones, then move from
crown to crown. Such modern era “crown” fires are seen by many as doing greater forest
ecosystem damage than might have been caused by earlier conflagrations extending over more
acres but, by burning closer to the forest floor, proceeded at lower intensities and contributed
to overall forest health. Whether to respond actively to address this deficit (by forest thinning
and controlled burning) or more passively (letting wildfires themselves redress the imbalance
more slowly) is an ongoing debate.
Forest Management Practices for Forest and Watershed Ecosystem Health:
Whether or not such a deficit is accepted as context for ongoing forest management, it is clear
that there are large extents of Oregon forest congested with small trees that would likely have
been cleared by normal fire regime. In some instances forests may be afflicted with abnormal
disease and insect activity, killing trees or weakening their resistance to further infestations or
to wildfire. High levels of infestation and/or overcrowding represent a departure from what
many forestry professionals would deem a more normative condition of forest health, and one
more historically resilient to fire when it occurs. Overstocked conditions, especially when
accompanied by extended seasonal or interannual dry periods, may result in more, and more
extensive, wildfires. While clearly a normative level of wildfire is a necessary and important
feature of a living forest ecosystem, higher levels of infestation and fire can seriously stress
both natural ecosystem function (e.g., regeneration) and essential habitat for indigenous
species (e.g., resident and anadromous fish populations in mountain waters). Describing a
19 Fire is necessary in the regeneration of lodgepole forests, as the fallen cones rely on fire to activate seed dispersal and rooting. Fire opens the understory of Ponderosa forests, keeping new seedlings and saplings from crowding the forest and enabling fire to “ladder” its way into the mature treetops. Grassland fire has historically limited the intrusion of juniper into central Oregon grasslands, where it competes with and can overwhelm native grasses and sagebrush, by destroying seedlings that otherwise would grow into fire-resistant mature juniper.

Oregon Global Warming Commission 2017 Biennial Report to the Legislature 31
desired future condition for all of Oregon’s diverse forests that integrates a normative level of
disease, insect infestation, fire and vegetative densities is a major challenge for forest
management professionals. It is made more difficult still by the two factors described below.
Wild-Urban Interface: Over the same three to four decades past a new complication has
entered the equation: the “wild-urban interface (WUI).” This is generally described as human
settlement that in recent decades has extended further and further into native forests and
grasslands, creating a conflict between a “normative”20 forest fire regime that can allow for
necessary rejuvenating wildfire, and protecting against fire risk to these homes and
communities21. In recent years, forest management professionals have generally favored
controlling and suppressing fires in WUI areas while allowing back-country wildfires to burn as
they might have pre-settlement periods; and they have favored preventive control measures –
thinning overgrown forests in WUI areas along with controlled burns during low fire hazard
seasons – over a return to historical fire suppression practices.
Human settlement continues to intrude, however, as most states are without even the modest
land use tools Oregon uses to prioritize and preserve farm and forest land.
Since 1990, some 8.5mm new homes, or 60% of the new homes built in the US, have been
located in the WUI, resulting in around 46 million homes now occupying the defined areas.22
Over the period in question the average number of structures burned has increased an order of
magnitude (from 405 structures in the 1970’s to 4500 in 2015). Managing and controlling WUI
fires has put intense pressure on forest management budgets,23 pressure that is crowding out
other management responsibilities – including, most critically and ironically, forest health
treatments that would reduce the probability and severity of WUI fires.
Climate Change and Forest Fire: If land development complications weren’t headache enough
for policymakers, climate change further complicates the challenges. It remains unclear
whether total precipitation will increase or decrease in Pacific Northwest forests (and may
increase in certain forests while decreasing in others). But it is apparent that critical
precipitation patterns are changing already. Research shows that precipitation between May
20 A normative forest and grassland fire regime might be defined as one in which fire occurs at intervals, in extents and degrees of severity, as it did prior to Euro-American development, but including both natural causes (e.g., lightning) and active use of fire by Native American tribes to manage vegetation and animal habitat. 21 A wildland–urban interface refers to the zone of transition between unoccupied land and human development. Communities that are within 0.5 miles (0.80 km) of the zone may also be included. These lands and communities adjacent to and surrounded by wildlands are considered at risk from forest and grassland wildfire.
22 InternaPonal Code Council. The Blue Ribbon Panel Report on Wildland Urban Interface. April 4, 2008. hMps://inawf.memberclicks.net/assets/blueribbonreport-low.pdf . The 2008 data need updating, and likely would show these conditions have worsened. 23 From + $1B/year in the 1990s to +$3B/year in the 2000’s.

Oregon Global Warming Commission 2017 Biennial Report to the Legislature 32
and September is expected to decrease through this century (Figure 1)(Davis et al, In press).24
More moisture is falling as rain than as snow; mountain snowpacks are on average declining;
snowpacks are melting earlier, potentially leading to increased spring flooding and to drier
summers and early falls. More earlier precipitation may actually lead to larger understory fuel
loading (annual grasses and brush). The summers and falls that are historical forest and range
fire seasons are growing longer,25 and drier. We should expect, then, both more and more
extensive fires than before.26
Figure 10: (a) increasing July-August temperature TMAX (b), decreasing May-September precipitation, and (c)
increasing areas with novel TMAX over time across the forests of Oregon and Washington under RCP 4.5
Some of the newest research shows that the amount of area exposed to climate conditions
moderately and highly suitable for large wildfires is predicted to increase in forests of Oregon
and Washington through this century (Davis et al. In press). It remains unclear, however,
whether and to what extent a next generation of wildfires will depart from historical norms.
Whether this will also result in more or fewer carbon emissions than would be expected in a
“normative” state is also unclear, in part because of the difficulty of describing, with supporting
24 Davis R, Yang Z, Yost AC, Belongie C, Cohen W. In press. The normal fire environment—modeling environmental suitability for large forest wildfires using past, present, and future climate normal. Manuscript “accepted with revision” to Forest Ecology Management. 25 “. . . over two months (longer) since the 1970’s” per Tom Tidwell, USFS Chief, in Senate testimony June 2, 2013. 26 There remains considerable uncertainty whether the resulting fires may also be more severe, i.e., hotter and more adverse to forest regeneration. Recent experience in California suggests this may be the case in drier southern and eastside forests, but evidence in the Pacific Northwest does not now appear to support the same conclusion.

Oregon Global Warming Commission 2017 Biennial Report to the Legislature 33
evidence, just what a normative state might be. This analytic challenge is important to take up
and clarify if only so we have a benchmark from which to measure the effects of our
interventions.
That said, however, any substantial forest carbon emissions in the near term, from fire, harvest
practices or other causes, and even if consistent with a normative condition or with redressing
a long-standing fire deficit, may still prove too great to accept until other, manmade emissions
from fossil fuel combustion and other sources can be capped and reduced.
On the other hand, the forest thinning and fuels reduction work that would reduce fire
prevalence and extent will also, by definition, reduce the total quantity of sequestered carbon
in the forests. While such practices may reduce fire risk whether we choose to practice them
widely or target them narrowly (e.g., to Wild-Urban Interface areas), either way we will be
removing carbon stores from forest. We may be obliged to make an explicit tradeoff between
keeping total quantities of carbon sequestered in our forests, or accepting the removal of some
quantity of carbon from those sequestered stores as the price of restoring some measure of
forest health.
Harvest About half of Oregon’s 63mm acres of land is forested, and a little over a third has historically
been considered harvestable. Historical timber harvest in Oregon, primarily for construction
lumber and paper products has declined from an annual average of 8.7mm board feet in the
1950’s to 3.8mm board feet in the 2000’s. While the reasons for the decline and the justice of
the reductions are argued, generally it reflects a growing understanding of the requirements of
ecological balance in forests and forest watersheds and the need to redress the effects of
overharvest in some areas. Notwithstanding these trends, Oregon remains the largest supplier
of softwood (usually fir and pine) products among US states.
The role of forests in a world increasingly reshaped by climate change will likely need to change
again. Forest ecosystems are greatly affected by climate change-driven conditions of higher
average temperatures, more frequent drought and fire, and migration of species, both flora and
fauna, from south to north and from lower to higher elevations. At the same time, forests play
a remediating role in responding to climate change, acting as storage and sink of atmospheric
carbon (by growing and retaining more carbon-based vegetation) and moderating climate
change effects through watershed and species protection from these effects.
It is critical that we understand, describe and quantify forest function in these respects.
Where the Roadmap to 2020 found conditional agreement among stakeholders on allocating
roles among public westside and eastside forests, and privately-held forests, thorough forest
carbon accounting requires that we look at carbon flux in each of these forest categories; and
that we further differentiate among different kinds of forest ecosystems (dry-side lodgepole,
dry-side Ponderosa, as well as more diverse forest makeups such as are found in the Siskiyou’s
Oregon Global Warming Commission 2017 Biennial Report to the Legislature 34
of Southern Oregon; wet-side coastal cedar forests, wet-side Douglas Fir-dominated Cascade
forests; etc.). If carbon uptake and retention varies among these types, so will the carbon
release effects of harvest. It is likely that different harvest techniques – clear-cuts vs. selective
logging – may have different carbon release outcomes.
Calculating the carbon flux resulting from harvest further varies with the uses to which product
is put. Carbon from trees that are harvested to feed paper mills or packaging will likely be
cycled and released rapidly (e.g., from disposal through incineration or open dumps) or more
slowly (if recycled or buried in landfills). When fiber is embedded in structures (framing;
cabinetry) its carbon is sequestered for longer periods. In both cases the forest product may
displace another product (plastic bags; steel framing) that has a higher (or lower) carbon
footprint, requiring analysis to net the carbon effect.
If trees are harvested to feed biomass-to-energy facilities, a net carbon calculation is also
required. The result may be positive (more carbon released) if, say, generation from a wind or
solar facility is displaced; or negative (less net carbon released) if displacement is for a coal or
gas facility. This net calculation also must consider whether the harvested fiber would
otherwise have been burned intentionally (e.g., in a controlled burn or burned as stacked
thinnings) or, on a probability basis, in an unintended forest fire (either caused naturally, e.g.,
from a lightning strike, or from human agency).
These are all complicated calculations, but they are not beyond our ability to frame and solve.
Indeed, when the stakes are so very high, we are obliged to develop a methodology that can
support chosen policies in an informed way. That’s the objective the OGWC has in view.
Proposed Forest Carbon Accounting Methodology Development, Progress and Status Early in 2016 the OGWC created a Forest Carbon Accounting Task Force to assist the
Commission to gain a better understanding of forest carbon dynamics and accounting. The
Task Force ultimately agreed on the foundational first step of establishing a forest carbon
content baseline. The Task Force and staff understood that such a baseline could serve as a
reference point for necessary quantitative analysis, while understanding that the designation
was an arbitrary but functionally necessary point in time and forest condition.
Another way of expressing this is to acknowledge that we are unable to describe a normative
condition for Oregon forests; a “desired future condition” as we say of watersheds. There
simply aren’t the data to support such a description, as they would need to arise from a period
prior to Euro-American settlement when no one was collecting, or able to collect, the needed
data. Additionally there are multi-year and multi-decadal climate cycles to which forests
respond; which can be said to represent the normative state if all are natural and recurring?
And there are now the superimposed effects of man-made climate change which have been
accumulating for most of Oregon’s recorded scientific history.

Oregon Global Warming Commission 2017 Biennial Report to the Legislature 35
This first step of establishing a baseline became possible in 2016 with the availability of USFS
Forest Inventory and Analysis (FIA)-collected carbon content data for Oregon forestlands. Using
these data as a starting point, technical members of the Task Force advise us that it should be
possible to proceed through the following steps:
1. Measure and/or model existing aboveground living matter carbon stores in Oregon
forests. This will include living woody and non-woody plants, and include both their
aboveground and root fiber. It captures carbon flux from growth and mortality,
including transfers from this pool to other pools (see below) including to harvested fiber
for all purposes.
2. Measure and/or model existing aboveground dead carbon stores. Dead carbon stores
include woody and non-woody matter that has died from all causes but remains
standing or down in the forest, and continues to store carbon. There are different
causes for carbon to flow into and out of this pool, including decomposition,
combustion and harvest, that will need to be accounted for.
3. Measure and/or model dead belowground carbon. This is likely a small pool of dead
woody roots that can be sampled, modeled and calculated.
4. Measure and/or model soil carbon. This is a very large pool that must be included
because a very large amount of carbon flows into and out of the pool. We are advised
that measuring and modeling these flows will be difficult and require informed
assumptions that can be modified as data and tools improve in the future.
With the publication herein of the USFS/FIA data on carbon pools in Oregon forests we can
check off the basic inventory task (summary tables follow this section of the report). These
data should then allow us to take the essential next steps: to measure and/or model the
fluctuations within each pool and the flows among the pools. When this is accomplished we
will have a dynamic description of forest carbon amounts within forest boundaries that will
enable the critical next steps – critical because they begin to involve policy choices for forest
ecosystem sustainability, carbon sequestration and acquisition, harvest (and choice of harvest
practices) for commercial use, and the role of commercial forest products in reducing or
increasing forest carbon releases into the atmosphere.
The next steps:
5. Describe through modeling the likely effects of climate change in Oregon on in-forest
carbon quantities and flows. These effects may variously include near-term increased
acquisition of carbon into the in-forest pools, the modification of flows among pools
(e.g., from increased mortality), and increased releases of carbon into the atmosphere
from insect-, disease- and fire-related mortality. Human intervention to redress effects
of climate change – for example, from fuels reduction through controlled burn and/or
thinning operations and disposal in situ -- will also need to be modeled here, based on a

Oregon Global Warming Commission 2017 Biennial Report to the Legislature 36
reasonable range of assumptions. Effects of fire management practices, which will be
sternly tested in a climate-change influenced future, could be quantified here or in a
separate step, to be determined.
6. Describe and quantify effects on reference in-forest carbon pools from harvest and
other interventions. Harvest may occur for multiple reasons and with different carbon
consequences; e.g., for forest health (thinning and removal), for commercial products
(structural lumber; paper products), and for forest biomass-to-energy conversion. In
these cases further calculations will be required to establish the net carbon outcomes of
different uses and means of disposal. For example, structural wood products may
continue to sequester carbon for extended periods of time measured in decades (e.g., a
structure’s lifetime) while paper products will have a much shorter time before releasing
a greenhouse gas (carbon; methane) into the atmosphere. Methods of end-of-lifetime
disposition will affect both quantity and timing of such releases. In the case of some
structural products and forest biomass-to-energy uses, a further calculation is required
to determine if there is a substitution effect; i.e., did the forest product displace a
product with greater or lesser life cycle GHG effect? Thus forest biomass-to-energy
would most likely displace a fossil (coal or gas) fueled source of electricity on the grid, in
which case the biomass GHG emissions would be netted against the avoided fossil fuel
emissions.
Conclusion and Recommendations The sheer size of the carbon reservoir in Oregon’s forests and grasslands – three billion tons –
and the comparison with annual Oregon CO2e emissions – about 60 million tons – is a first clue
to why State policy needs a forest carbon accounting methodology. If those 3B tons were
locked in and disconnected with the earth’s atmosphere we could put this in a footnote and
move on.
But there are active flows among the different carbon pools in the forest, which may add to or
deplete forest carbon stores; and there are flows into and out of the forest from harvest,
wildfire, clearing for development and/or thinning for ecosystem health. The latter result in
lowering the total quantity of carbon stored in forests and grasslands, and may result in
increases in atmospheric greenhouse gases released into the atmosphere when combusted
(carbon dioxide) or decayed (methane). Both increased GHG sequestration and increased GHG
release need to be understood to inform public policy on forest and grassland management for
carbon outcomes.
Because all of these conditions are not now well documented and tracked, the OGWC has
undertaken this project to advance our forest carbon accounting capabilities. The first product
of this work is the FIA-scored quantification of total forest carbon stores, stores by pool, stores
within different publicly- and privately-owned forests and stores that will vary by the different
species that will be regionally dominant.

Oregon Global Warming Commission 2017 Biennial Report to the Legislature 37
The OGWC, working with its Task Force (including USFS and academic forest scientists) has laid
out an approach to complete the remaining tasks described above. When this work is
completed, Oregon’s policymakers will have a reliable, scientific basis for considering what
changes, if any, to forest practices in Oregon are warranted.
Until then, the Commission recommends that the Legislature defer enacting new forest
management policies that would significantly affect carbon balances in Oregon’s forests until
the Commission’s Forest Carbon Accounting Project is complete and can inform such policies.
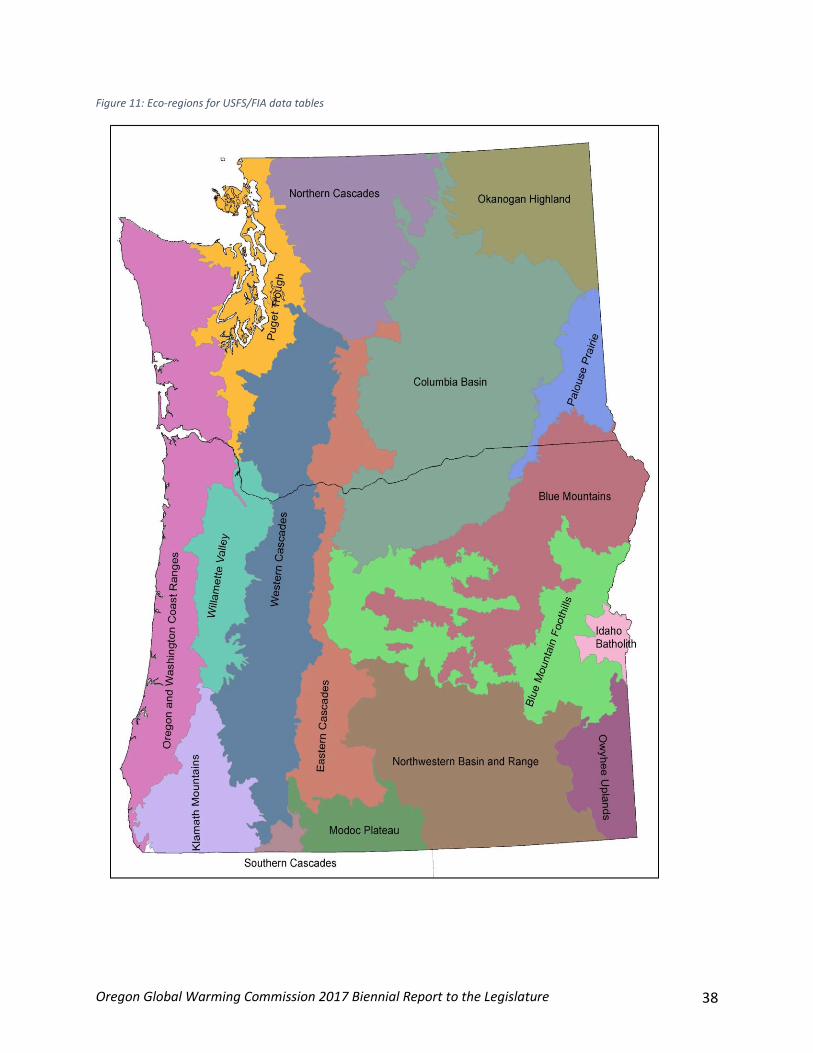
Oregon Global Warming Commission 2017 Biennial Report to the Legislature 38
Figure 11: Eco-regions for USFS/FIA data tables

Oregon Global Warming Commission 2017 Biennial Report to the Legislature 39
Table 2: Legend of terms for USFS/FIA data tables
Label Translation Label Translation BLM Bureau of Land Management PNI Private non-industrial
NFSres National Forest Service Restricted State State-owned
NFSunr National Forest Service unrestricted Eco-total Total for the eco-region
Other Other land ownerships not captured by rest of categories Tg CO2e Teragrams carbon dioxide equivalent
PI Private Industrial Mg/ha Megagrams per hectare (equivalent to metric tons per hectare
Table 3: USFS/FIA data on carbon pools in Oregon forests (part 1)
Blue Mtns
Owner Area (ac) Tg CO2e Mg/ha Tg CO2e Mg/ha Tg CO2e Mg/ha Tg CO2e Mg/ha Tg CO2e Mg/ha Tg CO2e Mg/ha
BLM 906,003 13.9 38.2 1.7 4.8 3.0 8.3 5.2 14.3 116.0 317.4 139.9 383.0
NFSres 862,078 72.6 208.9 22.9 65.9 19.4 55.8 13.1 37.6 104.6 300.9 232.6 669.1
NFSunr 3,967,071 253.5 158.5 38.9 24.3 76.8 48.0 77.2 48.2 475.7 297.4 922.1 576.4
Other 24,758 0.8 83.4 0.0 0.0 0.1 14.4 0.1 11.5 3.6 361.6 4.7 471.0
PI 779,574 28.3 90.0 1.9 6.1 10.6 33.6 9.1 28.8 87.2 277.5 137.1 436.1
PNI 1,481,124 40.0 67.0 1.9 3.2 9.2 15.5 17.7 29.6 192.4 322.2 261.3 437.5
State 42,032 2.4 138.9 0.3 20.2 0.2 11.1 0.5 31.9 5.5 323.9 8.9 526.0
Eco Total 8,062,640 411.5 126.6 67.7 20.8 119.4 36.7 122.9 37.8 985.1 303.0 1706.6 524.9
Coast Range
Owner Area (ac) Tg CO2e Mg/ha Tg CO2e Mg/ha Tg CO2e Mg/ha Tg CO2e Mg/ha Tg CO2e Mg/ha Tg CO2e Mg/ha
BLM 794,448 185.2 578.0 12.2 38.2 27.7 86.4 16.9 52.6 142.1 443.4 384.0 1,198.6
NFSres 62,281 18.5 738.1 1.8 70.4 1.7 65.8 2.1 85.0 12.7 504.2 36.8 1,463.5
NFSunr 711,453 196.5 685.0 19.0 66.1 22.9 79.8 25.5 88.9 145.8 508.4 409.7 1,428.2
Other 62,114 7.9 316.7 0.5 21.8 1.2 47.0 2.9 114.4 15.3 609.3 27.8 1,109.4
PI 2,203,390 248.7 279.9 13.1 14.8 72.7 81.9 66.0 74.3 431.1 485.3 831.7 936.2
PNI 736,450 79.1 266.3 3.2 10.9 15.6 52.4 22.4 75.3 166.4 560.3 286.6 965.2
State 656,638 123.1 464.8 9.8 37.0 27.1 102.2 22.0 83.3 124.8 471.5 306.8 1,158.8
Eco Total 5,226,774 859.0 407.6 59.7 28.3 168.7 80.1 157.8 74.9 1038.2 492.6 2283.4 1,083.4
Live Trees Dead Trees Down wood Forest Floor (litter + duff) soil (includes roots) Forest Total
Live Trees Dead Trees Down wood Forest Floor (litter + duff) soil (includes roots) Forest Total
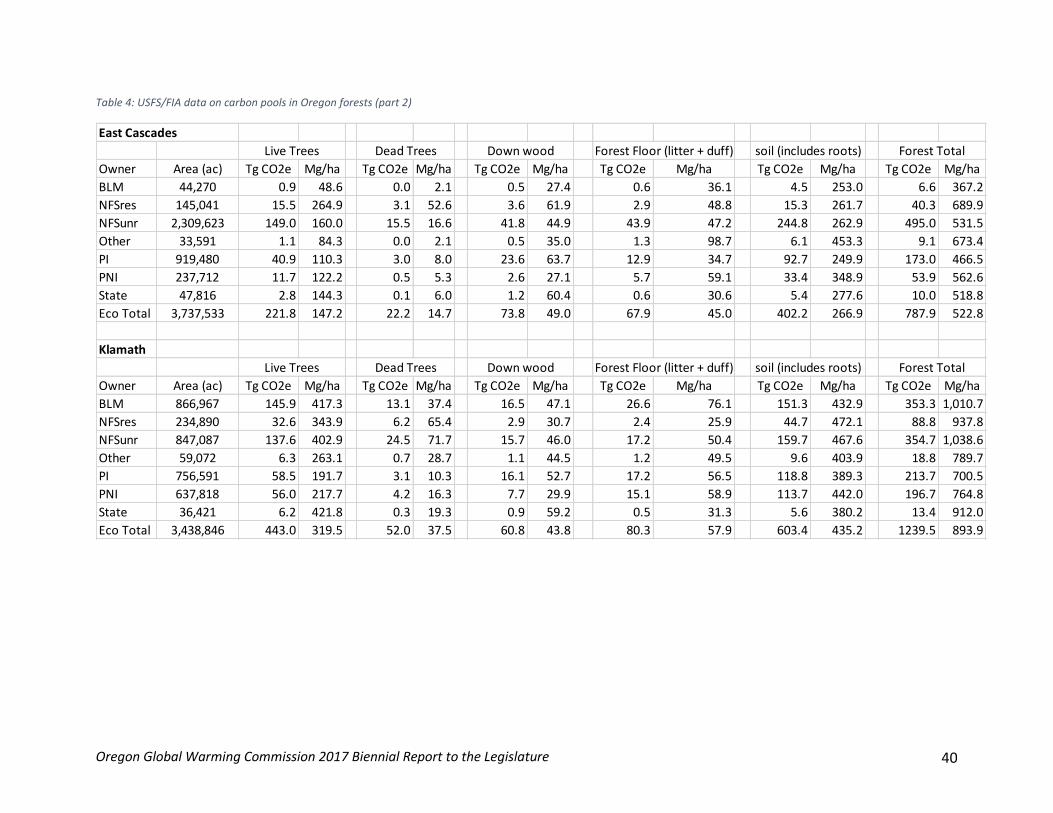
Oregon Global Warming Commission 2017 Biennial Report to the Legislature 40
Table 4: USFS/FIA data on carbon pools in Oregon forests (part 2)
East Cascades
Owner Area (ac) Tg CO2e Mg/ha Tg CO2e Mg/ha Tg CO2e Mg/ha Tg CO2e Mg/ha Tg CO2e Mg/ha Tg CO2e Mg/ha
BLM 44,270 0.9 48.6 0.0 2.1 0.5 27.4 0.6 36.1 4.5 253.0 6.6 367.2
NFSres 145,041 15.5 264.9 3.1 52.6 3.6 61.9 2.9 48.8 15.3 261.7 40.3 689.9
NFSunr 2,309,623 149.0 160.0 15.5 16.6 41.8 44.9 43.9 47.2 244.8 262.9 495.0 531.5
Other 33,591 1.1 84.3 0.0 2.1 0.5 35.0 1.3 98.7 6.1 453.3 9.1 673.4
PI 919,480 40.9 110.3 3.0 8.0 23.6 63.7 12.9 34.7 92.7 249.9 173.0 466.5
PNI 237,712 11.7 122.2 0.5 5.3 2.6 27.1 5.7 59.1 33.4 348.9 53.9 562.6
State 47,816 2.8 144.3 0.1 6.0 1.2 60.4 0.6 30.6 5.4 277.6 10.0 518.8
Eco Total 3,737,533 221.8 147.2 22.2 14.7 73.8 49.0 67.9 45.0 402.2 266.9 787.9 522.8
Klamath
Owner Area (ac) Tg CO2e Mg/ha Tg CO2e Mg/ha Tg CO2e Mg/ha Tg CO2e Mg/ha Tg CO2e Mg/ha Tg CO2e Mg/ha
BLM 866,967 145.9 417.3 13.1 37.4 16.5 47.1 26.6 76.1 151.3 432.9 353.3 1,010.7
NFSres 234,890 32.6 343.9 6.2 65.4 2.9 30.7 2.4 25.9 44.7 472.1 88.8 937.8
NFSunr 847,087 137.6 402.9 24.5 71.7 15.7 46.0 17.2 50.4 159.7 467.6 354.7 1,038.6
Other 59,072 6.3 263.1 0.7 28.7 1.1 44.5 1.2 49.5 9.6 403.9 18.8 789.7
PI 756,591 58.5 191.7 3.1 10.3 16.1 52.7 17.2 56.5 118.8 389.3 213.7 700.5
PNI 637,818 56.0 217.7 4.2 16.3 7.7 29.9 15.1 58.9 113.7 442.0 196.7 764.8
State 36,421 6.2 421.8 0.3 19.3 0.9 59.2 0.5 31.3 5.6 380.2 13.4 912.0
Eco Total 3,438,846 443.0 319.5 52.0 37.5 60.8 43.8 80.3 57.9 603.4 435.2 1239.5 893.9
Forest Totalsoil (includes roots)Forest Floor (litter + duff)Down woodDead TreesLive Trees
Live Trees Dead Trees Down wood Forest Floor (litter + duff) soil (includes roots) Forest Total

Oregon Global Warming Commission 2017 Biennial Report to the Legislature 41
Table 5: USFS/FIA data on carbon pools in Oregon forests (part 3)
West Cacades
Owner Area (ac) Tg CO2e Mg/ha Tg CO2e Mg/ha Tg CO2e Mg/ha Tg CO2e Mg/ha Tg CO2e Mg/ha Tg CO2e Mg/ha
BLM 443,141 94.5 529.1 9.1 50.9 13.7 76.5 9.0 50.6 82.6 462.5 209.0 1,169.5
NFSres 1,103,828 241.2 541.8 45.8 103.0 34.0 76.3 24.6 55.3 144.1 323.7 489.6 1,100.0
NFSunr 3,218,228 727.2 560.4 89.4 68.9 117.5 90.6 84.8 65.3 540.3 416.3 1559.2 1,201.5
NPS 166,922 27.9 415.2 3.7 54.5 3.9 58.3 2.1 31.9 16.2 240.9 53.9 800.8
Other 14,577 3.0 518.1 0.2 37.2 0.2 39.9 0.3 43.8 4.0 672.6 7.7 1,311.5
PI 1,294,278 133.1 255.1 8.2 15.8 43.2 82.7 26.7 51.2 228.9 438.5 440.1 843.3
PNI 385,612 45.2 290.6 1.8 11.3 12.6 81.1 9.3 59.9 76.1 489.7 145.0 932.6
State 60,873 8.4 342.2 0.8 30.7 4.4 179.1 1.3 54.7 11.5 469.2 26.4 1,075.9
Eco Total 6,687,459 1280.6 474.9 158.9 58.9 229.5 85.1 158.2 58.7 1103.7 409.3 2931.0 1,086.9
Other
Owner Area (ac) Tg CO2e Mg/ha Tg CO2e Mg/ha Tg CO2e Mg/ha Tg CO2e Mg/ha Tg CO2e Mg/ha Tg CO2e Mg/ha
BLM 687,547 26.5 95.7 1.1 4.1 4.0 14.4 4.6 16.5 87.4 315.4 123.7 446.1
NFSunr 638,576 45.1 175.0 5.8 22.6 10.9 42.4 12.4 48.0 76.9 298.5 151.0 586.6
Other 25,993 1.4 129.8 0.0 2.9 0.2 15.0 0.5 43.9 4.8 458.4 6.8 650.0
PI 592,142 42.4 177.4 1.8 7.4 11.8 49.3 9.7 40.7 96.3 403.2 161.9 678.1
PNI 872,661 63.7 181.1 2.6 7.3 8.6 24.6 15.4 43.8 174.6 496.3 265.0 753.0
State 95,318 7.3 190.6 0.4 9.7 0.7 18.4 1.4 35.2 16.8 436.0 26.5 689.9
Eco Total 2,912,237 186.4 158.7 11.7 10.0 36.2 30.8 43.9 37.4 456.8 389.0 734.9 625.8
Forest Totalsoil (includes roots)Forest Floor (litter + duff)Down woodDead TreesLive Trees
Live Trees Dead Trees Down wood Forest Floor (litter + duff) soil (includes roots) Forest Total

Oregon Global Warming Commission 2017 Biennial Report to the Legislature 42
Table 6: USFS/FIA data on carbon pools in Oregon forests (part 4)
All
Owner Area (ac) Tg CO2e Mg/ha Tg CO2e Mg/ha Tg CO2e Mg/ha Tg CO2e Mg/ha Tg CO2e Mg/ha Tg CO2e Mg/ha
BLM 3,742,376 466.9 309.4 37.3 24.7 65.3 43.3 63.0 41.7 584.0 387.0 1216.4 806.1
NFSres 2,408,117 380.4 391.7 79.8 82.1 61.5 63.4 45.1 46.5 321.3 330.9 888.1 914.6
NFSunr 11,692,038 1508.9 320.0 193.0 40.9 285.7 60.6 260.9 55.3 1643.3 348.6 3891.8 825.5
NPS 166,922 27.9 415.2 3.7 54.5 3.9 58.3 2.1 31.9 16.2 240.9 53.9 800.8
Other 220,105 20.6 231.9 1.5 17.0 3.2 36.6 6.2 70.0 43.4 488.9 74.9 844.4
PI 6,545,455 551.8 209.1 31.2 11.8 177.9 67.4 141.6 53.7 1054.9 399.7 1957.5 741.7
PNI 4,351,377 295.7 168.5 14.2 8.1 56.3 32.1 85.6 48.8 756.7 431.3 1208.5 688.8
State 939,097 150.1 396.5 11.7 30.8 34.4 90.8 26.3 69.5 169.5 447.7 392.1 1,035.4
State total 30,065,488 3402.3 280.6 372.3 30.7 688.4 56.8 630.9 52.0 4589.4 378.6 9683.2 798.7
Live Trees Dead Trees Down wood Forest Floor (litter + duff) soil (includes roots) Forest Total

Oregon Global Warming Commission 2017 Biennial Report to the Legislature 43
Members of the OGWC Forest Carbon Accounting Advisory Task Force
Catherine Mater, Chair (CEO Mater Engineering and OGWC Member) Dr. Jeremy Fried (USFS_PNW Research Station) Dr. Mark Harmon (Oregon State University Department of Forestry) Dr. Beverly Law (Oregon State University Department of Forestry Brien Kittler (Pinchot Institute) Dr. Thomas Buchholz (Spatial Informatics) Mark Stern (The Nature Conservancy) Cassie Phillips (Weyerhaeuser Company) Dr. Dominick DellaSalla (Geos Institute) Dr. Greg Latta (University of Idaho) Andy Elsbree (Green Diamond Lumber Co) Staff Dr. Andrew Yost (Oregon Department of Forestry) Jessica Shipley (Oregon Department of Energy) Colin McConnaha (Oregon Department of Environmental Quality) Ex Officio Angus Duncan (President, Bonneville Environmental Foundation and Chair, OGWC)

Oregon Global Warming Commission 2017 Biennial Report to the Legislature 44
Fixing State Climate Policymaking
Key Takeaways and Recommendations for the Oregon Legislature The State’s climate policymaking machinery is not measuring up to the task of achieving GHG
reduction goals and preparing the state for the effects of climate change. This failure is
especially noteworthy for tasks not being informed by rigorous cost/benefit analysis, guided
by agency assignments and benchmarks, and tracked for performance.
The Commission recommends that the Legislature direct agencies to collaborate with the
Commission to set assignments (from the Commission’s Roadmap) and benchmarks, and to
report annually to the Commission on progress or lack of progress, and reasons why.
The Commission further recommends that the Legislature provide the Commission with
modest but sufficient resources – staff and budget – to enable it to discharge its
responsibilities in a timely and efficient way, including its analysis, communications and
tracking functions.
Statement of the Problem Oregon ought to be a national leader in advancing sound climate policy, and in many respects it
is – in energy efficiency, renewables deployment, and urban transportation. These interim
successes make the failures and blank spots more galling and less forgivable.
While individual agencies have taken up both emissions reduction and adaptation issues
episodically, the State has no overall climate change adaptation/preparation strategy, action
plan or investment criteria.
In 2016 Oregon made decided progress in addressing electric utility greenhouse gas (GHG)
emissions,27 but continued diligence is required to ensure our utilities are not replacing their
reliance on one fossil fuel – coal – with overreliance on another – gas – to a degree that would
ensure failure to meet Oregon’s GHG goals. However, in the near- and mid-term, utilities face a
need for resources that provide firm, on-peak energy. The challenge for utilities in pursuit of
the state’s low-carbon future is the current limited availability of non-emitting or low-carbon
resources and technologies such as energy storage to meet this need in a least cost and least
risk manner.
Oregon has limited State funding for the critical elements of transportation greenhouse gas
reduction: electric vehicles incentives and transit/bike/pedestrian infrastructure, equipment
and operations.28
27 SB 1547, passed in the short 2016 session, commits PGE and PAC to eliminating coal-generated electricity from Oregon’s mix by not later than 2035 (and mostly by 2030), and increases the State Renewable Portfolio Standard for these utilities in steps to 50% by 2040. 28 Per ORS 366.514, 1% of annual gas tax revenues are dedicated to bike and pedestrian infrastructure.
Oregon Global Warming Commission 2017 Biennial Report to the Legislature 45
Oregon has insufficient understanding of the carbon contributions – credits and debits – of our
forests29 and agricultural lands and activities.
Oregon doesn’t keep systematic track of, or seek to manage, consumption-associated emissions
(e.g., waste management).
Oregon has no integrated state GHG policy on non-carbon/methane GHG’s (e.g., CFC’s, Ozone,
N2O).
Oregon does not have a comprehensive current strategy for adapting to and preparing for the
accumulating and already visible effects of climate change. Individual agencies and some
communities have acted in this critical area, but their actions are isolated and often seriously
dated.30
Oregon doesn’t have a cost- and consequences-driven agenda of the most effective GHG
abatement measures apart from an extremely modest31 and dated analysis. When legislators
ask if we’re doing what’s cost-effective first, we answer formulaically that energy efficiency is
our priority (but even that’s misleading since it’s true primarily for electric and gas utilities, and
not for other critical sectors such as transportation).
The Oregon Global Warming Commission was established by the 2007 Legislature and
empaneled by Governor Kulongoski in 2008. The Legislature gave the Commission broad
statutory responsibilities32 but no authority and no operating budget. While the statute
directed all State agencies to “support” the work of the Commission, that support is always
subject to existing agency priorities for staff and budget. As a practical matter, the OGWC has
had to rely on its own sparse resources, principally volunteer experts and funding raised from
foundations.
These limitations notwithstanding, the Commission has provided significant value added to the
State in numerous ways in its first eight years or so, often by acting as a stakeholder in
29 In 2016 the OGWC undertook to develop a basis for carbon accounting in Oregon’s forests, and that work proceeds, but slowly, reflecting again the absence of resources to proceed with more dispatch. 30 In 2010 Oregon State agencies undertook a planning exercise that resulted in a published Framework for Climate Adaptation. There has been no further cross-agency work since; neither has there been any lookback review of whether any of the recommendations were acted upon, and with what outcomes. 31 Oregon spent $50K of federal recession grant money on a “McKinsey” curve analysis that left much to be desired when it was current, a condition it left behind years ago. 32 “The Oregon Global Warming Commission shall recommend ways to coordinate state and local efforts to reduce greenhouse gas emissions in Oregon consistent with the greenhouse gas emissions reduction goals established by section 2 of this 2007 Act and shall recommend efforts to help Oregon prepare for the effects of global warming. In furtherance of the greenhouse gas emissions reduction goals established by section 2 of this 2007 Act, the Oregon Global Warming Commission may recommend statutory and administrative changes, policy measures and other recommendations to be carried out by state and local governments, businesses, nonprofit organizations or residents. In developing its recommendations, the commission shall consider economic, environmental, health and social costs, and the risks and benefits of alternative strategies, including least-cost options. The commission shall solicit and consider public comment relating to statutory, administrative or policy recommendations.”
Oregon Global Warming Commission 2017 Biennial Report to the Legislature 46
prompting and shaping State agency work. At the end of this section we have provided a short
list of the more important contributions made by the Commission.
Remedy: Agency Accountability for Climate Action This state of affairs has many causes which need not be belabored here. The remedy could be
some combination of comprehensive enforceable emissions standards, and/or a cap-and-trade
mechanism or carbon tax. In addition, but especially in the absence of any of these, there
should be assignments to State agencies of principal responsibility for implementing aspects of
the OGWC Roadmap, together with intermediate progress benchmarks and a reporting process
that includes reasons for making or missing benchmarks. Reporting is not the same as
directing; there need be no displacement of existing board and commission authority, still less
of legislative oversight, which would be better informed with the fruit of the reporting.
This would, however, require a collecting-and-evaluation function that could be housed within
a staffed OGWC that is authorized to negotiate benchmarks with agencies and require annual
progress reporting. Initially working from the Commission’s 2010 “Roadmap to 2020” (and
revising as necessary), and with legislatively-adopted State emissions reduction goals33 and
adaptation/preparation needs, the Commission would:
1. consult with the State agencies in assigning primary responsibility for specific Roadmap34
recommendations (and climate change adaptation/preparation recommendations,
when completed); jointly with agencies, develop benchmarks where appropriate, and
assign;
2. receive annual or biennial reports from the responsible agencies on progress on
recommendations, or failure to make progress, and reasons for each;
3. evaluate these reports against goals and needs, and integrate commission findings into
its Biennial Report to the Legislature in advance of each long session.
The Commission could request (but not require) similar reports from other parties (e.g., cities;
Metropolitan Planning Organizations), following where recommendations lead.
The Commission would have no authority to direct State agencies, intervene between the
agency and its governing board or commission, or compel any action. The authority would only
be to assign responsibilities and receive annual progress reports. Since agency reasons for
failure to make progress are often lack of resources or authority, this process is as likely to
provide support for an agency as to be critical of its progress while informing the Legislature of
needs for implementation resources and tools.
33 The 2007 Legislature adopted three emissions reduction goals: begin lowering emissions not later than 2010; be 10% below 1990 levels by 2020; and be at least 75% below 1990 levels by 2050. The OGWC subsequently recommended an interim goal: approximately 40% below 1990 levels by 2035. 34 “Interim Roadmap to 2020” Recommendations adopted by the OGWC October 28, 2010 and submitted to the Legislature as the Commission’s 2011 Biennial Report.
Oregon Global Warming Commission 2017 Biennial Report to the Legislature 47
Remedy: An OGWC Operating Budget and Resources The Commission’s ability to evaluate the work of the agencies, and to consolidate the
information into a form usable by the Legislature and Governor, is close to zero today. The
Commission’s ability to pursue a substantive agenda – for example, the Forestry Carbon
Accounting project now underway – is challenging, requiring almost entire reliance on the
availability of volunteered expertise and without funding to support even minimal professional
analysis. In particular, the Commission’s inability to apply systematic cost/benefit analysis to
the range of emissions reduction strategies and adaptation planning choices available to the
state is costly and crippling.
The Commission is (ably) supported by ODOE at a 1/3 FTE level when there is not a pre-empting
demand for that person’s time and expertise.35 The Commission has no independent funding to
contract for technical expertise, and no budget for communications36 or citizen involvement.
The 2017 Legislature could elect to provide a small budget for minimal staff support (an
Executive Director and a staff support position) and for a level of technical analytic support
sufficient to review agency reports and perform independent analysis (e.g., of the economic
feasibility and cost-efficiency of alternative approaches to GHG abatement).
Summing Up
Oregon’s GHG emissions are not under control, and both GHG abatement and
preparation for impending climate change need systematic, not random and
opportunistic, attention.
Not all, or even the largest part, of Oregon’s GHG emissions are from utilities. The
largest, and fastest growing such emissions are from transportation. Other sources
(forests; agriculture) are unattended. A separate, cross-cutting function begs to be
performed.
The Legislature and Governor need systematic, carefully evaluated reporting from State
agencies and the Commission on where progress is being made (and why), and where it
is not (and needs attention from policymakers). They need to be provided this
information in context, so they can distinguish between the immediate and the
important, understand what their policy choices, and be informed of the associated
costs and consequences as they consider different strategies.
35 For example, for much of 2016 OGWC’s staff support was seconded to ODEQ to assist in producing a “carbon market mechanism” report required of ODEQ by the Legislature. The task was aligned with the work of the OGWC, but necessarily required deferral of elements of the OGWC’s own chosen agenda. 36The OGWC web site was designed and constructed with private foundation funding solicited by the Commission. It has no funds to maintain even site security, and still less to use the site to actively engage Oregonians in State climate policymaking or planning, or provide access to means for Oregonians to reduce their carbon footprint or prepare for the effects of climate change.

Oregon Global Warming Commission 2017 Biennial Report to the Legislature 48
The Oregon Global Warming Commission needs at least the modest level of budget and
staff support that would enable it to discharge the very broad range of responsibilities it
has been assigned by the Oregon Legislature.
OGWC Deliverables and Contributions to State and Community Climate Efforts 1. Since 2008, provided the Legislature and Governor with four Biennial Reports, as required
by law, that have tracked progress toward State GHG emissions reduction goals, have
highlighted specific agency and community work in service to the goals, and have identified
challenges and failures. The 2011 Report included the “Roadmap to 2020” strategy for
meeting Oregon’s 2020 GHG reduction goal, subsequently offered for review in community
meetings around the state.
2. Participated with State agency heads and staff in development of Oregon Climate Change
Adaptation Framework (2010), the State’s only existing adaptation strategy document.
3. Participated and contributed as a stakeholder in ODOT processes leading to:
o Development of GreenSTEP, an ODOT analytic model for identifying GHG-reduction
transportation and land use choices;
o Sustainable Transportation Strategy (STS_20XX);
o Integration of GHG criteria within MOSAIC/Least Cost Transportation Planning tool
development (20XX);
o Developing GHG criteria for STIP (State Transportation Improvement Program)
allocation of ODOT discretionary funding.
4. Participated and contributed as a stakeholder in ODEQ processes leading to:
o Developing timely GHG emissions inventory data, especially for utilities and
transportation, improving lag time from four years to six months.
o Development of consumption-based GHG inventory, offering a different perspective
on GHG’s for which Oregonians are responsible.
o Development of a “market mechanism” (e.g., carbon cap or tax) as an option for
Oregon’s management of GHG’s.
5. Participated and contributed as a stakeholder in DLCD process leading to adoption of GHG
targets for Oregon communities (Metropolitan Planning Organizations, or MPPO’s);
reviewing progress and revising goals in 2017.
6. Participated and contributed as a stakeholder in Oregon Health process leading to its
Climate and Health Resilience Plan (2016).
7. Provided the 2016 Legislature with GHG reduction analysis of SB 1547, legislation to
eliminate coal-generated electricity from serving Oregon loads and ramping up the State’s
Renewable Portfolio Standard to a 50% level by 2040.
8. Initiated a Forest Carbon Accounting project in 2016 to develop data and a basis for
integrating carbon storage and release outcomes in forests with different State policies on
forest health, harvest, forest biomass-to-energy choices, and other forest management
practices.

Oregon Global Warming Commission 2017 Biennial Report to the Legislature 49
9. The Commission and individual Members have also participated in and contributed to
community-based climate and GHG reduction activities, including the Portland/Multnomah
County Climate Action Plan, Metro’s Climate Smart Strategy, and the City of Eugene Climate
Action Plan.

Oregon Global Warming Commission 2017 Biennial Report to the Legislature 50
Climate Impacts, Adaptation and Preparation Among the OGWC’s many charges are to track and evaluate the “economic, environmental,
health, and social assessments of global warming impacts on Oregon and the Pacific
Northwest”37 and to “recommend efforts to help Oregon prepare for the effects of global
warming.”38 Fortunately for the state (and augmenting the OGWC’s limited efforts on this
front), the 2007 Oregon Legislature created the Oregon Climate Change Research Institute
(OCCRI), a network of over 150 researchers at Oregon universities and federal and state labs,
with the purpose of facilitating research on climate change impacts in Oregon and supporting
the OGWC in efforts to prepare for the effects of climate change.39 OCCRI has just released
their third Oregon Climate Assessment Report,40 and we provide select excerpts from that
report below.
OCCRI Third Assessment Key Takeaways Oregon is warming and the consequences are, and will be, notable.
Three years have passed since the previous Oregon Climate Assessment Report
(Dalton et al., 2013). These years have been the three warmest years globally
(NOAA, 2016), and the last three decades have been the warmest three decades
(IPCC, 2013). The Earth’s climate undoubtedly is warming. The warming observed
since the mid-20th century is largely due to an increase in greenhouse gas
concentrations caused by human activities (IPCC, 2013).
Oregon is warming, too. Consequences of this warming are already being felt by
Oregonians. Snowpack is declining, summer streamflow is lowering, wildfire activity
is increasing, sea level is rising, and coastal waters are acidifying. Such
consequences and others are expected to continue into the decades to come. Indeed,
the year 2015, in which global and Oregon temperatures were the warmest on
record, foreshadows what typical conditions may look like by the middle of this
century.
Adaptation is necessary, as mitigation alone will not prevent serious impacts.
In order to avoid negative impacts, now and in the future, we must both mitigate
climate change and adapt to climate change. That is, we must try to reduce or even
eliminate greenhouse gas emissions, and we must make preparations and
adjustments that will be needed to meet new environmental conditions, doing so at
all levels of government and society, from the highest international agreements
down to our own personal actions (Bierbaum et al., 2014). International and local
mitigation efforts are already underway, but these are not yet sufficient to limit
global warming to 2°C (3.6°F) above preindustrial levels and to avoid the serious
37 https://www.oregonlaws.org/ors/468A.250 38 https://www.oregonlaws.org/ors/468A.235 39 https://www.oregonlaws.org/ors/352.823 40 http://www.occri.net/media/1042/ocar3_final_125_web.pdf
Oregon Global Warming Commission 2017 Biennial Report to the Legislature 51
impacts of climate change. Accounting for the future emissions reduction pledges by
countries participating in the 2015 Paris Agreement, the globe would still likely
warm by 3°C (5.4°F) above pre-industrial levels by 2100 (Le Quéré et al., 2016).
Oregon must do more to adapt to climate changes already underway.
Climate change is happening here, now. The climate in our dear state is already
changing and will continue to change. We know much about the expected effects of
climate change that Oregon is likely to see. We must strive, in our governments and
in our communities, to build resilience to climate change, and we must do so now.
Although building resilience could be costly, it could be even more costly to suffer
the losses and the damage that come from not being prepared for new conditions. A
few state agencies, such as the Oregon Health Authority and the Oregon Department
of Transportation, have already begun planning; and there are opportunities to
build preparedness for climate change into existing planning efforts such as the
Oregon Water Resources Strategy and the Natural Hazards Mitigation Plan.
Furthermore, implementing climate adaptation actions can be compatible with
other societal goals, such as sustainable development and disaster risk reduction
(Bierbaum et al., 2014).
State Agency Efforts to Prepare for Climate Impacts As noted in the OCCRI report, some Oregon agencies have begun work to prepare for the future
effects of climate change. Despite efforts at a few select agencies, there remains no statewide
strategy for identifying adaptation and preparation needs or tracking progress toward meeting
those needs. At the State level the only effort to look broadly across all agencies’
responsibilities took place in 201041 and needs updating, particularly in light of the accumulated
analysis and findings by OCCRI and other climate scientists. Some agencies, such as the
Department of Forestry42 and Department of Land Conservation and Development (through its
support for local initiatives)43 have begun work to develop adaptation strategies and make
recommendations to decision-makers, but these efforts have not been carried through into
actual work plans. Three agencies that have developed plans or strategies for addressing
climate impacts are highlighted below.
Oregon Health Authority
In 2014, the Oregon Health Authority completed the Climate and Health Profile Report, which
outlines the different health risks that will increase as our climate changes and describes the
populations who are most vulnerable to these risks.44 The report highlights increased
41 Oregon Climate Change Adaptation Framework; http://www.oregon.gov/LCD/docs/climatechange/framework_summary.pdf 42 https://www.oregon.gov/ODF/Documents/ForestBenefits/BOFATTCH201503040702ClimateChangeRecommendations.pdf 43 http://www.oregon.gov/LCD/CLIMATECHANGE/Pages/index.aspx 44 https://public.health.oregon.gov/HealthyEnvironments/climatechange/Pages/profile-report.aspx

Oregon Global Warming Commission 2017 Biennial Report to the Legislature 52
occurrences of chronic diseases such as asthma, respiratory illnesses from increased ground-
level ozone and wildfire smoke, and increased hospitalizations during extreme heat events,
among other risks. It also describes how some communities, such as low-income households,
American Indians, older adults, children, and communities of color, will be more affected than
others.
The Oregon Health Authority recently released a Climate and Health Resilience plan that
highlights strategies and policy priorities for state, local, and tribal public health practitioners
and partners within the public health system.45 The Resilience Plan focuses on strategies that
not only prioritize hazards and increase preparedness, but also build community resilience to
multiple hazards and climate impacts.
Oregon Department of Transportation
In 2012, ODOT produced a Climate Change Adaptation Strategy Report that assessed the
potential impacts of climate change on Oregon’s transportation infrastructure and the
associated economic impacts.46 The strategy outlines the range of possible actions that ODOT
could take within its existing programs and initiatives, begins a discussion of the costs of
inaction and the costs of adaptation strategies themselves, and suggests some next steps for
the agency. The strategy recommended a comprehensive vulnerability and risk assessment to
more clearly demonstrate the areas of higher risk, the formation of an ODOT Climate Change
adaptation work group, and the identification of further research needs and data gaps. ODOT
has developed analytic tools and data to help it plan for increased climate resilience, especially
with respect to accelerating coastal erosion and landslide risk47. Beyond this, there remains
much work to be done in identifying risks, developing operational and physical remedies, and
45 http://public.health.oregon.gov/HealthyEnvironments/climatechange/Pages/resilience-plan.aspx 46 http://www.oregon.gov/ODOT/TD/CLIMATECHANGE/docs/odot_adaptation_strategy_final.pdf 47 (1) ODOT formed an Adaptation Work Group in 2013 to help inform and guide the agency’s adaptation planning efforts.; (2) ODOT completed work on a Vulnerability Assessment and Adaptation Options Study in 2015, focused on state highways on the North Coast. The study was funded through the Federal Highway Administration (FHWA) Climate Resilience Pilot Program. Findings and lessons learned from the pilot study have informed ODOT’s current and planned adaptation efforts. (3) ODOT has a Sea Level Rise Mapping and Guidance project currently underway. Through this project ODOT will determine how and when to use sea level rise data to inform planning and design of transportation projects. The project will use new flood and sea level rise inundation models available through a geographic information system (GIS) tool being developed as part of the project. (4) ODOT is looking to expand the use of data monitoring and risk assessments at high-priority coastal landslide sites. A coastal landslide and bluff retreat monitoring project is currently underway. Results from this research will inform rates of coastal change and targeted risk assessments for vulnerable coastal highways. This is long-term research scheduled for completion in 2023. (5) In 2016 ODOT received a federal (FHWA) applied research grant to explore the use of green infrastructure (or nature-based) engineering techniques that can help increase resilience of highways that are vulnerable to coastal erosion and storm surge. The project will develop a range of protection options at high risk sites and with input from land use regulators and coastal geo-morphologists. (6) ODOT is also participating in a national research panel focused on the use of climate change models to inform hydraulics and hydrologic design for bridges and culverts. (7) An emerging priority is the need to assess wildfire risks and mitigation strategies used before and immediately after catastrophic wildfire events that impact state highways.
Oregon Global Warming Commission 2017 Biennial Report to the Legislature 53
deploying them elsewhere in the state’s transportation infrastructure (for example, assessing
wildfire risks and mitigation strategies that affect state transportation facilities).
Oregon Parks and Recreation Department
OPRD produced a Climate Response Preparedness and Action Plan in 2010 to help the
department understand the potential effects of climate change and create a plan to inform
actions.48 It noted actions that could be taken within the department, such as incorporating
sustainable practices into all facets of OPRD’s mission, looking for opportunities to pursue
carbon sequestration projects, and acquiring and restoring properties with wetlands that
provide important ecosystem services that may help buffer against the effects of climate
change.
48 http://www.oregon.gov/LCD/CLIMATECHANGE/Pages/index.aspx

Oregon Global Warming Commission 2017 Biennial Report to the Legislature 54
Appendix: Oregon “In-Boundary” Greenhouse Gas Emission Data, 1990-2015 Note: All emissions data are expressed in million metric tons of carbon dioxide equivalent (MMTCO2e)
Table 8: Total Oregon Gross GHG Emissions, Including Emissions Associated with the Use of Electricity
1990 1991 1992 1993 1994 1995 1996 1997 1998 1999 2000 2001 2002 2003 2004 2005 2006 2007 2008 2009 2010 2011 2012
56 58 58 63 64 65 68 69 70 72 71 67 67 66 68 66 68 70 68 65 64 62 60
2013 2014 2015
60 60 63
Carbon Intensity Data: A Different Light on our Emissions
In addition to our overall emissions, we should consider how our emissions per capita and per dollar of state GDP have changed over time. Looking at this data can help us be sure that recent declines in our in-boundary emissions are not due to the effects of net migration out of the state or loss of economic activity. The table below indicates that per capita emissions and the carbon intensity of our economy have declined since 2000, while our state population and GDP have risen over the same time period. In 2015, per capita emissions increased for the first time since 2000, although it is too early to know whether this is a trend that will continue.
Table 7: Carbon intensity data
1990 1995 2000 2005 2006 2007 2008 2009 2010 2011 2012 2013 2014 2015
Total emissions (Million Metric Tons)1
56.4
64.9
70.7
66.2
67.9
69.8
67.6
64.9
63.9
62.4
60.2
60.3
60.3
63.4
Population (Millions)3
2.8
3.2
3.4
3.6
3.7
3.7
3.8
3.8
3.8
3.9
3.9
3.9
4.0
4.0
Statewide per capita emissions (metric tons per
person)1,3
19.8
20.4
20.7
18.3
18.4
18.7
17.9
17.0
16.7
16.2
15.5
15.4
15.2
15.8
State GDP ($2009 million)2 64,881 81,919
130,992
153,771
167,952
173,109
182,813
181,022
190,371
198,298
192,598
189,645
192,119
201,484
Carbon intensity (Metric tons/ $2009 million GDP)1,2
869.3
792.2
539.7
430.5
404.3
403.5
369.9
358.5
335.8
314.8
312.4
318.0
313.9
314.5
Sources: 1. Oregon GHG Inventory; 2. U.S. Department of Commerce (http://bea.gov/iTable/index_regional.cfm); 3. Portland State University Population Research Center
(https://www.pdx.edu/prc/home)
While the carbon intensity data are a useful comparison to our inventory data, it is important to note that solving the problem of climate change will require absolute reductions in GHGs, not only reductions in emissions per person or per unit of output. It is for this reason that GHG reduction goals and targets around the world – including ours – are expressed in absolute terms. Nonetheless, we endeavor to present these additional data points wherever possible.

Oregon Global Warming Commission 2017 Biennial Report to the Legislature 55
Table 9: Oregon Greenhouse Gas Emissions, Proportions by Economic Sector
Proportion by Key Sector
Transportation Residential & Commercial
Industrial Agriculture
1990 37% 29% 25% 9%
1991 39% 29% 24% 8%
1992 39% 28% 25% 8%
1993 35% 32% 25% 8%
1994 36% 31% 25% 8%
1995 35% 31% 26% 8%
1996 35% 31% 27% 8%
1997 35% 31% 27% 8%
1998 35% 30% 26% 8%
1999 35% 31% 27% 7%
2000 34% 33% 26% 7%
2001 35% 35% 23% 7%
2002 35% 34% 22% 8%
2003 35% 35% 21% 9%
2004 36% 34% 21% 9%
2005 37% 33% 21% 9%
2006 37% 33% 21% 8%
2007 37% 35% 21% 8%
2008 35% 36% 21% 8%
2009 37% 37% 19% 8%
2010 36% 36% 19% 8%
2011 36% 36% 20% 9%
2012 37% 35% 19% 9%
2013 35% 36% 20% 9%
2014 35% 35% 21% 9%
2015 37% 35% 20% 8%
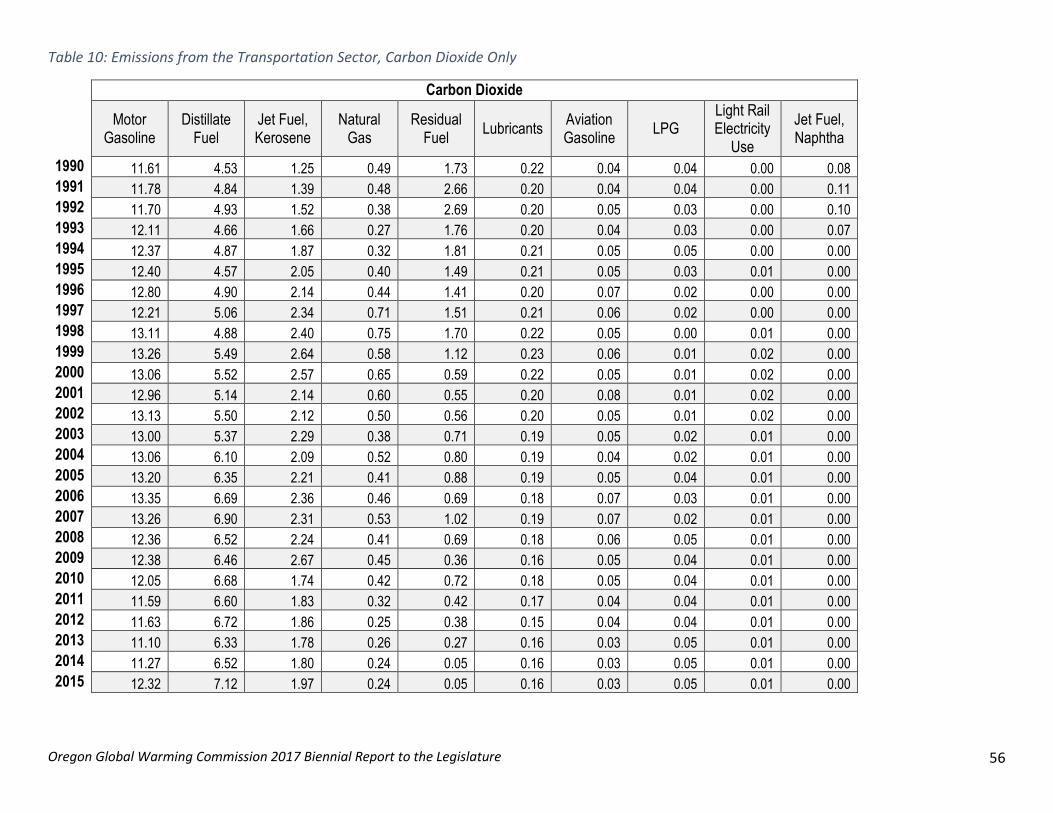
Oregon Global Warming Commission 2017 Biennial Report to the Legislature 56
Table 10: Emissions from the Transportation Sector, Carbon Dioxide Only
Carbon Dioxide
Motor
Gasoline Distillate
Fuel Jet Fuel, Kerosene
Natural Gas
Residual Fuel
Lubricants Aviation Gasoline
LPG Light Rail Electricity
Use
Jet Fuel, Naphtha
1990 11.61 4.53 1.25 0.49 1.73 0.22 0.04 0.04 0.00 0.08 1991 11.78 4.84 1.39 0.48 2.66 0.20 0.04 0.04 0.00 0.11 1992 11.70 4.93 1.52 0.38 2.69 0.20 0.05 0.03 0.00 0.10 1993 12.11 4.66 1.66 0.27 1.76 0.20 0.04 0.03 0.00 0.07 1994 12.37 4.87 1.87 0.32 1.81 0.21 0.05 0.05 0.00 0.00 1995 12.40 4.57 2.05 0.40 1.49 0.21 0.05 0.03 0.01 0.00 1996 12.80 4.90 2.14 0.44 1.41 0.20 0.07 0.02 0.00 0.00 1997 12.21 5.06 2.34 0.71 1.51 0.21 0.06 0.02 0.00 0.00 1998 13.11 4.88 2.40 0.75 1.70 0.22 0.05 0.00 0.01 0.00 1999 13.26 5.49 2.64 0.58 1.12 0.23 0.06 0.01 0.02 0.00 2000 13.06 5.52 2.57 0.65 0.59 0.22 0.05 0.01 0.02 0.00 2001 12.96 5.14 2.14 0.60 0.55 0.20 0.08 0.01 0.02 0.00 2002 13.13 5.50 2.12 0.50 0.56 0.20 0.05 0.01 0.02 0.00 2003 13.00 5.37 2.29 0.38 0.71 0.19 0.05 0.02 0.01 0.00 2004 13.06 6.10 2.09 0.52 0.80 0.19 0.04 0.02 0.01 0.00 2005 13.20 6.35 2.21 0.41 0.88 0.19 0.05 0.04 0.01 0.00 2006 13.35 6.69 2.36 0.46 0.69 0.18 0.07 0.03 0.01 0.00 2007 13.26 6.90 2.31 0.53 1.02 0.19 0.07 0.02 0.01 0.00 2008 12.36 6.52 2.24 0.41 0.69 0.18 0.06 0.05 0.01 0.00 2009 12.38 6.46 2.67 0.45 0.36 0.16 0.05 0.04 0.01 0.00 2010 12.05 6.68 1.74 0.42 0.72 0.18 0.05 0.04 0.01 0.00 2011 11.59 6.60 1.83 0.32 0.42 0.17 0.04 0.04 0.01 0.00 2012 11.63 6.72 1.86 0.25 0.38 0.15 0.04 0.04 0.01 0.00 2013 11.10 6.33 1.78 0.26 0.27 0.16 0.03 0.05 0.01 0.00 2014 11.27 6.52 1.80 0.24 0.05 0.16 0.03 0.05 0.01 0.00 2015 12.32 7.12 1.97 0.24 0.05 0.16 0.03 0.05 0.01 0.00

Oregon Global Warming Commission 2017 Biennial Report to the Legislature 57
Table 11: Emissions from the Transportation Sector, Methane, Nitrous Oxide, and HGWP Gases (Million Metric Tons of Carbon Dioxide Equivalent)
Methane Nitrous Oxide HGWP
Passenger & Light Vehicles
Non-Road Vehicles & Equipment
Heavy-Duty Vehicles
Natural Gas Distribution (sector share)
Passenger & Light Vehicles
Non-Road Vehicles & Equipment
Heavy-Duty Vehicles
Refrigerants, A/C, Fire Protection Use
1990 0.10 0.01 0.01 0.05 0.76 0.03 0.02 0.00 1991 0.09 0.01 0.01 0.05 0.76 0.04 0.02 0.00 1992 0.09 0.01 0.01 0.04 0.85 0.04 0.02 0.01 1993 0.09 0.01 0.01 0.03 0.92 0.04 0.02 0.04 1994 0.09 0.01 0.01 0.03 0.92 0.04 0.02 0.09 1995 0.08 0.01 0.01 0.04 0.94 0.04 0.02 0.21 1996 0.08 0.01 0.01 0.04 0.93 0.04 0.03 0.29 1997 0.08 0.01 0.01 0.06 0.98 0.05 0.03 0.38 1998 0.08 0.01 0.01 0.05 0.98 0.05 0.03 0.43 1999 0.07 0.01 0.01 0.04 0.97 0.04 0.03 0.49 2000 0.07 0.01 0.00 0.05 0.93 0.04 0.03 0.54 2001 0.06 0.01 0.00 0.04 0.86 0.04 0.03 0.58 2002 0.05 0.01 0.00 0.04 0.77 0.04 0.03 0.62 2003 0.05 0.01 0.00 0.03 0.71 0.04 0.03 0.64 2004 0.05 0.01 0.00 0.04 0.65 0.04 0.03 0.66 2005 0.04 0.01 0.00 0.03 0.58 0.04 0.02 0.68 2006 0.04 0.01 0.00 0.03 0.52 0.04 0.01 0.72 2007 0.03 0.01 0.00 0.03 0.44 0.04 0.01 0.76 2008 0.03 0.01 0.00 0.03 0.37 0.04 0.01 0.80 2009 0.03 0.01 0.00 0.03 0.31 0.04 0.02 0.85 2010 0.03 0.01 0.00 0.03 0.27 0.04 0.01 0.90 2011 0.02 0.01 0.00 0.02 0.23 0.04 0.01 0.92 2012 0.02 0.01 0.00 0.02 0.20 0.04 0.01 0.95 2013 0.02 0.01 0.00 0.02 0.18 0.05 0.01 0.99 2014 0.02 0.01 0.00 0.02 0.18 0.05 0.01 0.99 2015 0.03 0.01 0.00 0.02 0.16 0.04 0.01 0.99
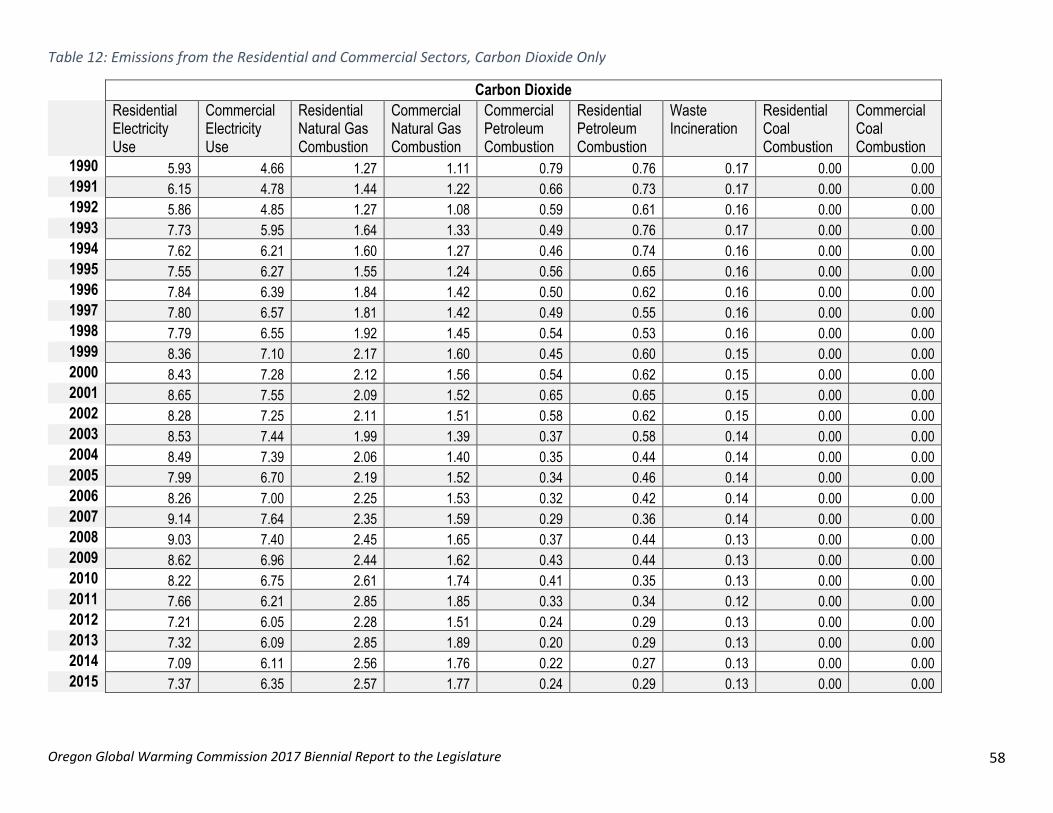
Oregon Global Warming Commission 2017 Biennial Report to the Legislature 58
Table 12: Emissions from the Residential and Commercial Sectors, Carbon Dioxide Only
Carbon Dioxide Residential Electricity Use
Commercial Electricity Use
Residential Natural Gas Combustion
Commercial Natural Gas Combustion
Commercial Petroleum Combustion
Residential Petroleum Combustion
Waste Incineration
Residential Coal Combustion
Commercial Coal Combustion
1990 5.93 4.66 1.27 1.11 0.79 0.76 0.17 0.00 0.00 1991 6.15 4.78 1.44 1.22 0.66 0.73 0.17 0.00 0.00 1992 5.86 4.85 1.27 1.08 0.59 0.61 0.16 0.00 0.00 1993 7.73 5.95 1.64 1.33 0.49 0.76 0.17 0.00 0.00 1994 7.62 6.21 1.60 1.27 0.46 0.74 0.16 0.00 0.00 1995 7.55 6.27 1.55 1.24 0.56 0.65 0.16 0.00 0.00 1996 7.84 6.39 1.84 1.42 0.50 0.62 0.16 0.00 0.00 1997 7.80 6.57 1.81 1.42 0.49 0.55 0.16 0.00 0.00 1998 7.79 6.55 1.92 1.45 0.54 0.53 0.16 0.00 0.00 1999 8.36 7.10 2.17 1.60 0.45 0.60 0.15 0.00 0.00 2000 8.43 7.28 2.12 1.56 0.54 0.62 0.15 0.00 0.00 2001 8.65 7.55 2.09 1.52 0.65 0.65 0.15 0.00 0.00 2002 8.28 7.25 2.11 1.51 0.58 0.62 0.15 0.00 0.00 2003 8.53 7.44 1.99 1.39 0.37 0.58 0.14 0.00 0.00 2004 8.49 7.39 2.06 1.40 0.35 0.44 0.14 0.00 0.00 2005 7.99 6.70 2.19 1.52 0.34 0.46 0.14 0.00 0.00 2006 8.26 7.00 2.25 1.53 0.32 0.42 0.14 0.00 0.00 2007 9.14 7.64 2.35 1.59 0.29 0.36 0.14 0.00 0.00 2008 9.03 7.40 2.45 1.65 0.37 0.44 0.13 0.00 0.00 2009 8.62 6.96 2.44 1.62 0.43 0.44 0.13 0.00 0.00 2010 8.22 6.75 2.61 1.74 0.41 0.35 0.13 0.00 0.00 2011 7.66 6.21 2.85 1.85 0.33 0.34 0.12 0.00 0.00 2012 7.21 6.05 2.28 1.51 0.24 0.29 0.13 0.00 0.00 2013 7.32 6.09 2.85 1.89 0.20 0.29 0.13 0.00 0.00 2014 7.09 6.11 2.56 1.76 0.22 0.27 0.13 0.00 0.00 2015 7.37 6.35 2.57 1.77 0.24 0.29 0.13 0.00 0.00

Oregon Global Warming Commission 2017 Biennial Report to the Legislature 59
Table 13: Emissions from the Residential and Commercial Sectors, Methane, Nitrous Oxide, and HGWP Gases (Million Metric Tons of Carbon Dioxide Equivalent)
Methane Nitrous Oxide HGWP
Municipal Solid Waste Landfills
Natural Gas Distribution (sector share)
Municipal Wastewater
Residential Combustion Byproducts
Commercial Combustion Byproducts
Waste Incineration
Fertilization of Landscaped Areas
Residential Combustion Byproducts
Waste Incineration
Commercial Combustion Byproducts
Municipal Wastewater
Refrigerants, Aerosols, Fire Protection Use
1990 1.15 0.26 0.23 0.06 0.02 0.00 0.05 0.01 0.01 0.00 0.07 0.00
1991 1.16 0.27 0.23 0.06 0.02 0.00 0.05 0.01 0.01 0.00 0.08 0.00
1992 1.10 0.25 0.24 0.07 0.02 0.00 0.06 0.01 0.01 0.00 0.08 0.01
1993 1.08 0.29 0.24 0.08 0.02 0.00 0.05 0.01 0.01 0.00 0.08 0.03
1994 1.06 0.27 0.25 0.08 0.01 0.00 0.06 0.01 0.01 0.00 0.08 0.07
1995 1.02 0.27 0.25 0.08 0.01 0.00 0.06 0.01 0.01 0.00 0.08 0.15
1996 1.07 0.26 0.26 0.08 0.01 0.00 0.06 0.01 0.01 0.00 0.09 0.21
1997 1.14 0.26 0.26 0.07 0.02 0.00 0.07 0.01 0.01 0.00 0.09 0.26
1998 1.17 0.22 0.26 0.06 0.01 0.00 0.07 0.01 0.01 0.00 0.09 0.30
1999 1.18 0.24 0.27 0.06 0.01 0.00 0.05 0.01 0.01 0.00 0.09 0.34
2000 1.21 0.26 0.27 0.07 0.02 0.00 0.04 0.01 0.01 0.00 0.09 0.38
2001 1.27 0.25 0.28 0.11 0.02 0.00 0.06 0.02 0.01 0.01 0.09 0.41
2002 1.30 0.29 0.28 0.11 0.02 0.00 0.08 0.02 0.01 0.01 0.10 0.43
2003 1.37 0.26 0.28 0.11 0.02 0.00 0.09 0.02 0.01 0.00 0.10 0.45
2004 1.41 0.24 0.29 0.12 0.02 0.00 0.09 0.02 0.01 0.00 0.10 0.46
2005 1.40 0.26 0.29 0.08 0.02 0.00 0.08 0.01 0.01 0.00 0.10 0.48
2006 1.36 0.28 0.29 0.07 0.02 0.00 0.08 0.01 0.01 0.00 0.10 0.50
2007 1.46 0.26 0.30 0.08 0.02 0.00 0.08 0.01 0.01 0.00 0.10 0.53
2008 1.59 0.26 0.30 0.08 0.02 0.00 0.07 0.01 0.01 0.00 0.10 0.56
2009 1.62 0.28 0.31 0.12 0.02 0.00 0.06 0.02 0.01 0.00 0.11 0.59
2010 1.51 0.27 0.31 0.11 0.02 0.00 0.08 0.02 0.01 0.00 0.11 0.63
2011 1.45 0.37 0.31 0.11 0.02 0.00 0.08 0.02 0.01 0.00 0.11 0.64
2012 1.50 0.29 0.31 0.10 0.02 0.00 0.08 0.02 0.00 0.00 0.11 0.67
2013 1.55 0.30 0.31 0.14 0.02 0.00 0.05 0.02 0.00 0.00 0.11 0.69
2014 1.57 0.30 0.31 0.14 0.02 0.00 0.05 0.02 0.00 0.00 0.11 0.69
2015 1.76 0.34 0.35 0.14 0.02 0.00 0.05 0.02 0.00 0.00 0.10 0.69
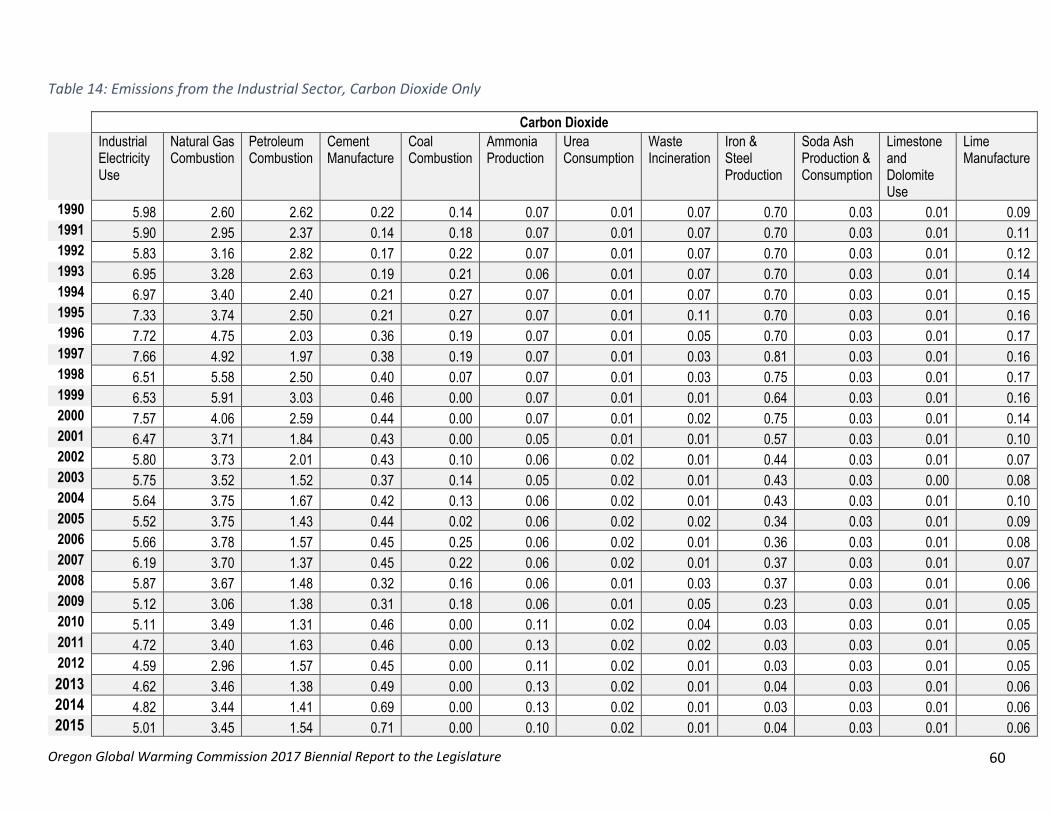
Oregon Global Warming Commission 2017 Biennial Report to the Legislature 60
Table 14: Emissions from the Industrial Sector, Carbon Dioxide Only
Carbon Dioxide Industrial Electricity Use
Natural Gas Combustion
Petroleum Combustion
Cement Manufacture
Coal Combustion
Ammonia Production
Urea Consumption
Waste Incineration
Iron & Steel Production
Soda Ash Production & Consumption
Limestone and Dolomite Use
Lime Manufacture
1990 5.98 2.60 2.62 0.22 0.14 0.07 0.01 0.07 0.70 0.03 0.01 0.09
1991 5.90 2.95 2.37 0.14 0.18 0.07 0.01 0.07 0.70 0.03 0.01 0.11
1992 5.83 3.16 2.82 0.17 0.22 0.07 0.01 0.07 0.70 0.03 0.01 0.12
1993 6.95 3.28 2.63 0.19 0.21 0.06 0.01 0.07 0.70 0.03 0.01 0.14
1994 6.97 3.40 2.40 0.21 0.27 0.07 0.01 0.07 0.70 0.03 0.01 0.15
1995 7.33 3.74 2.50 0.21 0.27 0.07 0.01 0.11 0.70 0.03 0.01 0.16
1996 7.72 4.75 2.03 0.36 0.19 0.07 0.01 0.05 0.70 0.03 0.01 0.17
1997 7.66 4.92 1.97 0.38 0.19 0.07 0.01 0.03 0.81 0.03 0.01 0.16
1998 6.51 5.58 2.50 0.40 0.07 0.07 0.01 0.03 0.75 0.03 0.01 0.17
1999 6.53 5.91 3.03 0.46 0.00 0.07 0.01 0.01 0.64 0.03 0.01 0.16
2000 7.57 4.06 2.59 0.44 0.00 0.07 0.01 0.02 0.75 0.03 0.01 0.14
2001 6.47 3.71 1.84 0.43 0.00 0.05 0.01 0.01 0.57 0.03 0.01 0.10
2002 5.80 3.73 2.01 0.43 0.10 0.06 0.02 0.01 0.44 0.03 0.01 0.07
2003 5.75 3.52 1.52 0.37 0.14 0.05 0.02 0.01 0.43 0.03 0.00 0.08
2004 5.64 3.75 1.67 0.42 0.13 0.06 0.02 0.01 0.43 0.03 0.01 0.10
2005 5.52 3.75 1.43 0.44 0.02 0.06 0.02 0.02 0.34 0.03 0.01 0.09
2006 5.66 3.78 1.57 0.45 0.25 0.06 0.02 0.01 0.36 0.03 0.01 0.08
2007 6.19 3.70 1.37 0.45 0.22 0.06 0.02 0.01 0.37 0.03 0.01 0.07
2008 5.87 3.67 1.48 0.32 0.16 0.06 0.01 0.03 0.37 0.03 0.01 0.06
2009 5.12 3.06 1.38 0.31 0.18 0.06 0.01 0.05 0.23 0.03 0.01 0.05
2010 5.11 3.49 1.31 0.46 0.00 0.11 0.02 0.04 0.03 0.03 0.01 0.05
2011 4.72 3.40 1.63 0.46 0.00 0.13 0.02 0.02 0.03 0.03 0.01 0.05
2012 4.59 2.96 1.57 0.45 0.00 0.11 0.02 0.01 0.03 0.03 0.01 0.05
2013 4.62 3.46 1.38 0.49 0.00 0.13 0.02 0.01 0.04 0.03 0.01 0.06
2014 4.82 3.44 1.41 0.69 0.00 0.13 0.02 0.01 0.03 0.03 0.01 0.06
2015 5.01 3.45 1.54 0.71 0.00 0.10 0.02 0.01 0.04 0.03 0.01 0.06

Oregon Global Warming Commission 2017 Biennial Report to the Legislature 61
Table 15: Emissions from the Industrial Sector, Methane, Nitrous Oxide, and HGWP Gases (Million Metric Tons of Carbon Dioxide Equivalent)
Methane Nitrous Oxide HGWP
Pulp & Paper Wastewater
Natural Gas Distribution & Production
Industrial Landfills
Combustion Byproducts
Food Processing Wastewater
Waste Incineration
Combustion Byproducts
Waste Incineration
Nitric Acid Production
Semiconductor Manufacturing
Refrigerant, Foam, Solvent, Aerosol Use
Aluminum Production
1990 0.34 0.08 0.03 0.01 0.00 0.05 0.00 0.00 0.36 0.00 0.31 0.34
1991 0.37 0.09 0.03 0.01 0.00 0.05 0.00 0.00 0.36 0.00 0.32 0.37
1992 0.42 0.09 0.02 0.01 0.00 0.04 0.00 0.00 0.36 0.00 0.31 0.42
1993 0.42 0.09 0.02 0.01 0.00 0.04 0.00 0.00 0.45 0.01 0.28 0.42
1994 0.46 0.09 0.02 0.01 0.00 0.04 0.00 0.00 0.50 0.03 0.25 0.46
1995 0.47 0.10 0.02 0.01 0.00 0.04 0.00 0.00 0.63 0.06 0.26 0.47
1996 0.50 0.10 0.03 0.01 0.00 0.04 0.00 0.00 0.69 0.09 0.27 0.50
1997 0.50 0.11 0.03 0.01 0.00 0.05 0.00 0.00 0.73 0.11 0.27 0.50
1998 0.56 0.11 0.03 0.01 0.00 0.04 0.00 0.00 0.97 0.13 0.28 0.56
1999 0.56 0.12 0.02 0.01 0.00 0.04 0.01 0.00 1.07 0.15 0.28 0.56
2000 0.56 0.13 0.02 0.01 0.00 0.04 0.00 0.00 0.97 0.16 0.27 0.56
2001 0.58 0.13 0.02 0.01 0.00 0.04 0.01 0.00 0.74 0.17 0.19 0.58
2002 0.55 0.14 0.02 0.01 0.00 0.03 0.01 0.00 0.83 0.18 0.08 0.55
2003 0.59 0.14 0.02 0.01 0.00 0.03 0.01 0.00 0.79 0.19 0.08 0.59
2004 0.61 0.14 0.02 0.01 0.00 0.03 0.01 0.00 0.75 0.20 0.09 0.61
2005 0.60 0.15 0.02 0.01 0.00 0.03 0.01 0.00 0.70 0.20 0.09 0.60
2006 0.59 0.16 0.02 0.01 0.00 0.04 0.01 0.00 0.77 0.22 0.09 0.59
2007 0.61 0.18 0.02 0.01 0.00 0.04 0.01 0.00 0.70 0.23 0.00 0.61
2008 0.63 0.19 0.02 0.01 0.00 0.03 0.01 0.00 0.64 0.24 0.00 0.63
2009 0.62 0.21 0.02 0.01 0.00 0.03 0.01 0.00 0.46 0.25 0.00 0.62
2010 0.64 0.23 0.02 0.01 0.00 0.03 0.01 0.00 0.36 0.15 0.00 0.64
2011 0.54 0.24 0.02 0.01 0.00 0.03 0.01 0.00 0.55 0.10 0.00 0.54
2012 0.62 0.24 0.02 0.01 0.00 0.04 0.01 0.00 0.46 0.13 0.00 0.62
2013 0.62 0.25 0.03 0.01 0.00 0.04 0.01 0.00 0.45 0.11 0.00 0.62
2014 0.62 0.26 0.03 0.01 0.00 0.04 0.01 0.00 0.51 0.11 0.00 0.62
2015 0.70 0.26 0.03 0.01 0.00 0.04 0.01 0.00 0.54 0.11 0.00 0.70

Oregon Global Warming Commission 2017 Biennial Report to the Legislature 62
Table 16: Emissions from the Agriculture Sector (Million Metric Tons of Carbon Dioxide Equivalent)
Carbon Dioxide Methane Nitrous Oxide
Urea Fertilization
Liming of Agricultural Soils
Enteric Fermentation
Manure Management
Agricultural Residue Burning
Agricultural Soil Management
Manure Management
Agricultural Residue Burning
1990 0.06 0.03 2.58 0.30 0.00 1.82 0.10 0.00 1991 0.06 0.02 2.60 0.30 0.00 1.73 0.10 0.00 1992 0.06 0.03 2.61 0.31 0.00 1.69 0.10 0.00 1993 0.07 0.03 2.60 0.30 0.00 1.83 0.09 0.00 1994 0.07 0.03 2.78 0.32 0.00 1.84 0.11 0.00 1995 0.07 0.03 2.94 0.32 0.00 2.00 0.12 0.00 1996 0.07 0.04 3.01 0.31 0.00 2.03 0.11 0.00 1997 0.08 0.04 3.00 0.32 0.00 2.16 0.11 0.00 1998 0.08 0.04 2.92 0.32 0.00 2.06 0.12 0.00 1999 0.07 0.04 2.93 0.34 0.00 1.91 0.13 0.00 2000 0.05 0.04 2.82 0.36 0.00 1.87 0.14 0.00 2001 0.08 0.04 2.66 0.37 0.00 1.72 0.14 0.00 2002 0.13 0.03 2.77 0.43 0.00 2.06 0.15 0.00 2003 0.14 0.03 2.76 0.42 0.00 2.13 0.15 0.00 2004 0.12 0.04 2.95 0.47 0.00 2.14 0.16 0.00 2005 0.12 0.04 2.97 0.47 0.00 1.92 0.14 0.00 2006 0.12 0.04 2.94 0.45 0.00 2.00 0.14 0.00 2007 0.13 0.04 2.63 0.45 0.00 2.01 0.14 0.00 2008 0.11 0.04 2.75 0.45 0.00 1.80 0.14 0.00 2009 0.10 0.03 2.58 0.44 0.00 1.70 0.13 0.00 2010 0.12 0.03 2.56 0.45 0.00 1.93 0.13 0.00 2011 0.13 0.04 2.68 0.47 0.01 2.01 0.13 0.00 2012 0.13 0.04 2.67 0.47 0.00 2.02 0.13 0.00 2013 0.14 0.05 2.44 0.47 0.00 1.94 0.13 0.00 2014 0.14 0.05 2.44 0.47 0.00 1.94 0.13 0.00 2015 0.14 0.05 2.44 0.47 0.00 1.94 0.13 0.00

Oregon Global Warming Commission 2017 Biennial Report to the Legislature 63
Table 17: In-State Electric Power Generation Emissions and Derivation of Production-Based Emissions Inventory
Carbon Dioxide Methane Nitrous Oxide
HGWP
In-State Electric Power Generation Sub-total A
dd
In-S
tate Electric P
ow
er Gen
eration
Su
b-T
otal to
Statew
ide E
missio
ns T
otal
Production-Based Emissions Calculation Adjustment
OR Power Plant Natural Gas Combustion
OR Power Plant Coal Combustion
OR Power Plant Petroleum Combustion
OR Power Plant Combustion Byproducts
OR Power Plant Combustion Byproducts
Transmission and Distribution Systems
Remove Total Electricity Use Emissions
Gross Emissions, Production Basis
1990 0.40 1.37 0.02 0.00 0.01 0.42 2.23 -16.57 42.02
1991 0.62 2.98 0.01 0.00 0.02 0.40 4.04 -16.83 45.57
1992 0.79 3.71 0.01 0.00 0.02 0.39 4.93 -16.55 46.80
1993 0.93 3.36 0.02 0.00 0.02 0.38 4.72 -20.63 46.76
1994 1.43 4.01 0.00 0.00 0.02 0.36 5.84 -20.81 48.81
1995 1.05 1.67 0.01 0.00 0.01 0.32 3.07 -21.16 46.80
1996 1.42 1.77 0.00 0.00 0.01 0.31 3.52 -21.96 49.42
1997 1.30 1.39 0.01 0.00 0.01 0.28 2.99 -22.02 49.58
1998 2.86 3.31 0.03 0.01 0.02 0.22 6.44 -20.85 55.49
1999 2.68 3.54 0.01 0.00 0.02 0.22 6.47 -22.00 56.96
2000 3.75 3.55 0.04 0.01 0.02 0.22 7.59 -23.29 55.04
2001 4.47 3.98 0.08 0.01 0.03 0.19 8.75 -22.69 53.47
2002 3.01 3.36 0.01 0.00 0.02 0.17 6.58 -21.35 52.35
2003 4.03 3.98 0.04 0.01 0.03 0.16 8.24 -21.73 52.80
2004 4.80 3.21 0.02 0.00 0.02 0.15 8.20 -21.53 54.18
2005 4.76 3.25 0.04 0.01 0.03 0.14 8.22 -20.21 54.18
2006 4.08 2.22 0.00 0.01 0.02 0.13 6.46 -20.93 53.47
2007 5.56 3.95 0.00 0.01 0.03 0.11 9.66 -22.97 56.54
2008 6.31 3.64 0.01 0.01 0.02 0.11 10.10 -22.31 55.41
2009 5.89 2.86 0.00 0.01 0.02 0.10 8.88 -20.71 53.06
2010 5.95 4.04 0.00 0.02 0.03 0.09 10.13 -20.09 53.97
2011 3.25 3.32 0.00 0.01 0.02 0.09 6.70 -18.61 50.52
2012 4.46 2.65 0.00 0.01 0.02 0.08 7.22 -17.86 49.52
2013 5.47 3.65 0.00 0.01 0.02 0.07 9.23 -18.04 51.49
2014 4.86 3.10 0.01 0.01 0.02 0.07 8.07 -18.02 50.46
2015 5.91 2.30 0.01 0.01 0.02 0.07 8.31 -18.74 52.95

Oregon Global Warming Commission 2017 Biennial Report to the Legislature 64