orbital-scale variation in the magnetic content as a
TRANSCRIPT

Huang et al. Earth, Planets and Space (2015) 67:128 DOI 10.1186/s40623-015-0300-5
FULL PAPER Open Access
Orbital-scale variation in the magneticcontent as a result of sea level changes inPapua New Guinea over the past 400 ka
Yin-Sheng Huang1,2*, Teh-Quei Lee1 and Shu-Kun Hsu2Abstract
We describe the orbital-scale environmental variation around Papua New Guinea (PNG) for the last 400 ka based onthe environmental magnetism. Six magnetic parameters and the δ18O record of the core MD05-2928 are presentedin the study. Results of magnetic analyses reveal opposite responses to different environmental conditions:Magnetic minerals were relatively fewer and finer in interglacial periods and were more and coarser in glacialperiods. The reason could be suggested: In interglacial periods, sediments coming from central New Guinea weretransported by the coastal currents in the northern Coral Sea and then imported to the core site location. Magneticminerals would be relatively fewer and finer due to this longer transportation process. In glacial periods, the routesof the currents might regress seaward with reduced current intensity because of lower sea level. Main sedimentsources would shift to the Papuan Peninsula relatively near the core site, and therefore, the magnetic mineralsbecame more and coarser. Further, period analyses using the eccentricity, tilt, and precession (ETP) curves and thewavelet spectra were applied to the study to analyze the periodicities embedded in the parameters. Results of bothperiod analyses clearly present the Milankovitch periods, indicating the dominance of the orbital forcing in thisarea. The strongest signal of 100-ka period reveals that sea level change played the dominant role in long-termenvironmental setting for the past ~400 ka. However, influences of 40- and 20-ka periods, possibly related toregional precipitation, should also be considered though they might be second factors affecting the environmentalvariation around PNG.
Keywords: Papua New Guinea; Coral Sea; Wavelet analysis; Orbital forcing; Milankovitch cycles
BackgroundThe Western Pacific Warm Pool (WPWP), with the aver-age sea surface temperatures (SST) over 28 °C (Yan et al.1992), is generally considered to be the global transportedengine and important source providing water vapors. NewGuinea, locating at the edge of the WPWP, is affected byseveral environmental factors, such as the intertropicalconvergence zone (ITCZ) migration, the Asian-Australianmonsoon system, and the El-Niño Southern Oscillation(ENSO). Wind-driven currents and precipitation variationaround the area are controlled by a biannual monsoonsystem. The ITCZ migration is proposed to be the drivingforce behind this biannual variability (Wang 2009). Inaustral summer, the ITCZ situates near/over northern
* Correspondence: [email protected] of Earth Science, Academia Sinica, Taipei, Taiwan2Institute of Geophysics, National Central University, Chung-Li, Taiwan
© 2015 Huang et al. Open Access This articleInternational License (http://creativecommons.oreproduction in any medium, provided you givthe Creative Commons license, and indicate if
Australia (Fig. 1), while in austral winter, the ITCZ shiftsnorthward (Hobbs et al. 1998).At the present day, New Guinea is politically divided into
two portions, Irian Jaya in the west and Papua New Guineain the east. Papua New Guinea (PNG), with the averageprecipitation about 2000–3000 mm a−1 (McAlpine et al.1983), is embraced by the Bismarck Sea, Solomon Sea,Coral Sea, and Arafura Sea (Fig. 1). Major rivers, comingfrom central New Guinea, receive input from rainfall andglacier meltwater, and then drain to the Gulf of Papua(GoP) (Brunskill 2004). These rivers deliver more than~365 mT sediments per year to the GoP (Milliman 1995).Most detritus discharged by the rivers from New Guinea isstored on the inner shelf (Brunskill et al. 1995; Wolanskiet al. 1995; Harris et al. 1996; Walsh et al. 2004; Keen et al.2006). Only less than 5 % of finer (suspended) sedimentsmay be delivered eastwardly along the shelf by the coastal
is distributed under the terms of the Creative Commons Attribution 4.0rg/licenses/by/4.0/), which permits unrestricted use, distribution, ande appropriate credit to the original author(s) and the source, provide a link tochanges were made.

Fig. 1 Bathymetric map of the study area. The red star symbol is the location of the core MD05-2928. White areas show the regions shallower than125 m water depth which may be above sea level in glacial periods. The red dashed line is the position of the ITCZ in austral summer. Blue dashedlines and arrows represent the ocean currents. SEC South Equatorial Current, Hiri Hiri current, NGCC New Guinea Coastal Current, ITF IndonesianThroughflow, EUC Equatorial Under Current
Huang et al. Earth, Planets and Space (2015) 67:128 Page 2 of 16
currents (Walsh and Nittrouer 2003; Muhammad et al.2008). Shallower ocean currents are important in deliveringthe suspended sediments. Modern ocean currents aroundPNG are dominated by the global thermohaline circulation.The South Equatorial Current (SEC) inflows to the CoralSea and forms a clockwise gyre named the Hiri Current inthe northern Coral Sea (Fig. 1). Along the coast of NewGuinea, the current then flows into the Solomon Seaand forms the New Guinea Coastal Current (NGCC).The maximum speed of this coastal current, lyingnear 200–300 m in water depth, is greater than8 cm s−1 (Qu and Lindstrom 2002).Evidences of recent glaciations, mostly observed in
western New Guinea, are limited to vanishing glaciersonly on higher mountains, but evidences of past glacia-tions are also observed in eastern PNG (Hastenrath2009). In addition, during the Last Glacial Maximum(LGM), global sea level reached ~125 m below thepresent sea level (Yokoyama et al. 2000; Clark et al.2004; Bassett et al. 2005). Large portions of the ArafuraSea and the GoP would expose above sea level (Fig. 1),and river mouths would become relatively near to the
shelf edge during glacial periods. Sediments trans-ported from the land and the GoP to the Coral Seashould be significantly modified by the glaciations andsea level change.In general, siliciclastic fluxes from the land to the
slope in passive continental margin should be higher inmajor sea level lowstands and become lower duringtransgressions (Nelson 1990; Handford and Loucks1993; Schlager et al. 1994). Past study in the PandoraTrough (nearby the GoP) has shown this similar prop-erty: Numerous siliciclastic turbidites were recorded inthe LGM and Younger Dryas in the Pandora Trough,and extremely high accumulation rate was observed dur-ing 15,800–17,700 years (Febo et al. 2008). However,also nearby the GoP, some studies showed differentflux features: Records of the siliciclastic fluxes fromthe Great Barrier Reef (GBR), Queensland Trough,and Ashmore Troughs were lower in lowstand periodsand were higher during late transgression (Dunbaret al. 2000; Page et al. 2003; Carson et al. 2008).Therefore, sedimentary responses to sea level changewould vary from one margin to another due to

Huang et al. Earth, Planets and Space (2015) 67:128 Page 3 of 16
regional effects, such as the sediment supply, compos-ition, and regional climate.To understand more about the sedimentary response to
sea level changes and the paleoenvironmental settingaround PNG, a viewpoint from environmental magnetismis provided in the study. Magnetic parameters related tothe environmental variation of the core MD05-2928from southern offshore PNG were presented, includ-ing magnetic susceptibility (χ), anhysteretic remanentmagnetization (ARM), saturated isothermal remanentmagnetization (SIRM), χARM/χ (χARM, the ARM ob-tained in 0.1 mT DC field within 100 mT alternatingfield), SIRM/χ, χARM/SIRM, and S-ratio. Period analysisis further applied to the time series data to study the peri-odicities. Dominant periods embedded in these magneticparameters and their relation to environmental variationcan be understood based on these analyses.
MethodsMaterials and samplesThe Calypso core MD05-2928, taken from the slope ofsouthern PNG in the northernmost Coral Sea (Lat. 11°17.26′ S, Long. 148° 51.60′ E; water depth, 2250 m; corelength, 26.10 m; Fig. 1), was obtained during the Inter-national Marine Past Global Change Study (IMAGES)PECTEN Cruise in 2005. Core sediments are composedof mixtures of biogenic carbonate and siliciclastic de-tritus (Beaufort et al. 2005). No visible turbidite or ashlayer is found, and only minor biodisturbance is ob-served in the core. Therefore, the core could provide asuitable material for paleomagnetic study. Core sedi-ments were sampled with u-channels for paleomagneticmeasurements. In total, 18 u-channel sections were ob-tained for the paleomagnetic study.
Paleomagnetic experiment proceduresAll magnetic experiments of the study were performedin a magnetic shielding room. The interval of magneticmeasurements, including the magnetic susceptibility,natural remanent magnetization (NRM), ARM, andIRM, were set to be 1 cm. The magnetic susceptibilitywas first measured by using Bartington MS-2 magneticsusceptibility meter with a long core transporting sys-tem. Detailed alternating field (AF) demagnetization wasthen preformed by using 2G 755 SRM SuperconductingQuantum Interference Device (SQUID) cryogenic mag-netometer. In the study, the NRMs were measured at every10 mT interval from 0 to 100 mT AF demagnetizationalong three orthogonal axes. The ARMs were acquiredin a 0.1 mT DC bias field within a 100 mT alternat-ing field simultaneously and then demagnetized byusing AF demagnetization with an increment of 10mT from 0 to 60 mT field. Finally, the IRMs were in-duced along the z-axis by using a spiral coil impulse
magnetizer at steps of 25, 50, 75, 100, 150, 200, 250,300, 500, 750, and 950 mT peak fields, and then, thesamples were demagnetized and measured with thesame procedure as for the ARM.
Environmental magnetismMagnetic parameters such as magnetic susceptibility,SIRM, ARM, HIRM, S-ratio, χARM/χ, χARM/SIRM, andSIRM/χ, are often used in paleoenvironmental studies.These parameters have different environmental mean-ings based on their physical characteristics. In general,magnetic parameters could be roughly classified into threecategories, representing variations of magnetic concentra-tion, magnetic grain size, and magnetic mineralogy,respectively.Magnetic susceptibility generally represents the con-
centration of all magnetic minerals while SIRM primarilyrelates to the change of RM carriers, such as magnetiteand hematite (Opdyke and Channell 1996). Larger valuesof both parameters indicate more magnetic minerals incore sediments, and smaller values give an opposite situ-ation. ARM is usually sensitive to the concentration offerromagnetic minerals, but it is also strongly grain sizedependent. ARM may decrease with increasing concentra-tion due to interactions among magnetic particles(Sugiura 1979). In general, ARM preferentially respondsto the concentration of finer grain (<10 μm) magnetite(Opdyke and Channell 1996).HIRM, the hard component of IRM, is derived from
the formula: HIRM = (SIRM + bIRM)/2, where thebIRM is usually defined as IRM-0.3T (the IRM value ob-tained at 300 mT back field). HIRM measures the con-centration of the magnetic material with higher coercivity(e.g., hematite) and is often discussed together with theparameter S-ratio. S-ratio, generally defined as IRM-0.3T/SIRM, is associated with the change of magnetic mineral-ogy (Opdyke and Channell 1996). S-ratio close to one in-dicates the dominance of lower coercivity ferrimagneticmineralogy (e.g., magnetite) while S-ratio decreasing awayfrom one represents the increment of higher coercivitymagnetic mineralogy (e.g., hematite).The parameters χARM/χ (χARM is the ARM obtained by
applying 0.1 mT DC field within 100 mT AF field) andSIRM/χ indicate changes in grain size of magnetic min-erals dominated by magnetite. Both parameters vary in-versely with magnetic grain size. χARM/χ is sensitive tofiner magnetic grains, particular in the ranges of singledomain (SD) and pseudo-single domain (PSD), whileSIRM/χ responds more to larger (multi-domain, MD)grains (Opdyke and Channell 1996). In addition, for thegrain size study, King et al. (1982) plotted the values ofχARM versus χ in a coordinate plane and obtained the ra-tio of χARM/χ by using numerous magnetite samples withvariety grain sizes. Based on the plot, they had proposed

Huang et al. Earth, Planets and Space (2015) 67:128 Page 4 of 16
a convenient model to detect the change of magneticgrain size dominated by magnetite in natural magneticmaterials.In this study, the HIRM and S-ratio almost show a
synchronously reverse pattern, implying that both pa-rameters could offer similar information. Thus, only theS-ratio was adopted as the magnetic mineralogy proxyin the paper. Moreover, the IRM0.95T (the IRM valueobtained at a peak field of 950 mT) was defined to bethe SIRM in the study and the S-ratio was defined asIRM-0.3T/IRM0.95T due to the definition of the SIRM.
Wavelet spectral analysisWavelet transform of a time series signal f(t) is definedas:
Wψ fð Þ a; bð Þ ¼ 1ffiffiffia
pZ∞
−∞
f tð Þψ t−ba
� �dt
where ψ (t) is the basis wavelet function with an effectivelength usually shorter than f(t). The variable a is thedilation/compression scale factor determining the char-acteristics frequency, and the variable b shows the trans-lation in time representing the shifting/sliding of thebasis wavelet over the time series f(t). Following the schemeof Chao and Naito (1995), we adopted the Morlet wavelet(Morlet et al. 1982), a normalized Gaussian-envelopedcomplex sinusoid with zero mean, as the basis waveletfunction ψ (t) in the study.Wavelet spectrum, varying with the variables a and b, is
usually displayed in a time-frequency domain. The ampli-tude oscillation of a time series (variation between peaksand troughs) can be identified by using color contours.Higher contrast of the color indicates the presence ofstronger oscillation while lower contrast shows weakeramplitude or background signals in the spectrum.Some limitations of the scheme pointed out by Chao
and Naito (1995) are as follows: The frequency reso-lution is limited to no better than a quarter octave be-cause of the temporal localization of the wavelet. Inaddition, time series values outside the time span aresimply assumed as zero and such step may bring edgeeffect to the spectrum, especially for longer periods.Details of the method and applications of the orbital for-cing were discussed in the papers (Chao and Naito 1995;Liu and Chao 1998).
Magnetic analysis and age controlMagnetic properties of the coreIn the study, most S-ratio values are above 0.9 (Fig. 2a),and the IRM acquisition curves show that the IRMs al-most situate at 300 mT field (Fig. 2b). Both propertiesreveal that the magnetic minerals of the core should be
dominated by magnetite. The parameter χARM/χ there-fore could be approximately considered to be the proxydescribing the grain size variation of the magnetic min-erals in the core. By applying the grain size model (χARMversus χ) established by King et al. (1982) to the study,the major grain size of the magnetic minerals is smallerthan 0.1 μm in this core (Fig. 2c). RM carriers of thecore could be roughly determined to be dominated bySD and finer PSD magnetite.Another notable feature is that several peaks rising
over a relatively constant value of ~8 were recorded inthe χARM/χ ratio (Fig. 3a). These peaks indicate the pres-ence of finer magnetic minerals at these locations butmay also indicate the contribution of magnetosomes.The magnetic materials of the core therefore appear tobe consisted of dominant detrital input and minor bio-genic origin. To clarify the issue whether magnetosomesexisted in the core or not, some measurements were fur-ther applied to the study.
Detection of magnetosomesTo detect the magnetic properties of biogenic magnetite,Moskowitz et al. (1993) had proposed some magneticcriteria for biogenic magnetite after measuring severalmagnetic parameters. A convenient and useful param-eter is the ratio, χARM/SIRM. High ratios of χARM/SIRM,ranging from 0.15 to 0.25 for an inducing field of 0.1mT, are a characteristic of the presence of magnetic bac-teria (Moskowitz et al. 1993). In our study, some higherratios (peak values) are found in both χARM/χ and χARM/SIRM (the χARM was also induced within a 0.1 mT field),but almost all the χARM/SIRM ratios are smaller than0.15 (Fig. 3a, b). Only the peaks presented between 21and 22 m core depth, with the maximum over 0.5, ex-ceed this range (Fig. 3b). These peaks possibly imply thepresence of magnetosomes between 21 and 22 m depthof the core.However, high χARM/SIRM ratios over this range are
not only unique to biogenic magnetite but have also ob-served in rocks and sediments consisting of noninteract-ing SD particles (Moskowitz et al. 1993). To obtain amore direct proof, first-order reversal curves (FORC)measurements were further applied to detect the pres-ence of magnetosomes (Pike et al. 1999; Roberts et al.2000). FORC diagram is a convenient tool to identify thepresence or absence of magnetostatic interactions and toidentify the contributions to the magnetization of sam-ples with different magnetic particles (Roberts et al.2000). A single FORC measurement first applied a posi-tive saturated field (Hs) and then decreased to a reversalfield (Hr), and the magnetization is measured at eachstep of field (H). FORC diagrams are generally plottedby using the transformed coordinates Hc = (H − Hr)/2and Hu = (H + Hr)/2.

Fig. 2 a The S-ratio data of the core MD05-2928 (in depth). b The IRM acquisition curves of the studied samples. Lines and numbers with differentcolors represent the sampling depths (unit, m), respectively. The black dashed line indicates the applied field at 300 mT. c The diagram of χARMversus χ used to detect the grain size of the magnetic mineral dominated by magnetite. Red dashed lines and values show the grain size model(King et al. 1982)
Huang et al. Earth, Planets and Space (2015) 67:128 Page 5 of 16
High-precision FORC models have been well devel-oped for several cases of magnetic particles. For uni-axial SD magnetite particles, FORC diagrams show anarrow ridge shape centered along the Hc axis (Pikeet al. 1999). This shape has never been observed inFORC diagrams of other magnetic particles, whichmay support that the narrow ridge shape is a uniquefeature of SD magnetite (Egli et al. 2010). For SDmagnetite homogeneously diluted in a nonmagneticmatrix, FORC diagrams roughly show a teardropshape with the center symmetric about the Hc axis(Pike et al. 1999; Egli 2006). As for the coarser mag-netic particles (PSD and MD dominance), FORC dia-grams have a larger spread along the Hu axis (Robertset al. 2000).
Because magnetosomes usually synthesize chains ofSD crystals with extremely well-controlled sizes andshapes (Egli et al. 2010; Heslop et al. 2013), a narrowridge feature is expected to be presented in our FORCdiagrams. We selected four samples for FORC measure-ments: At 0.59 and 6.91 m core depth, the two samplesrepresented the locations where a higher peak value anda relatively constant value were recorded in the χARM/χand χARM/SIRM ratios, respectively (Fig. 3a, b). At 21.21and 21.81 m core depth, the two samples were selectedbecause of two maximum values (>0.5) presented in theχARM/SIRM ratio (Fig. 3b), possibly denoting the pres-ence of magnetosomes. For the FORC measurements,150 FORCs were measured and a field spacing of 2 mTwas set, with coercivity (Hc) between 0 and 120 mT, and
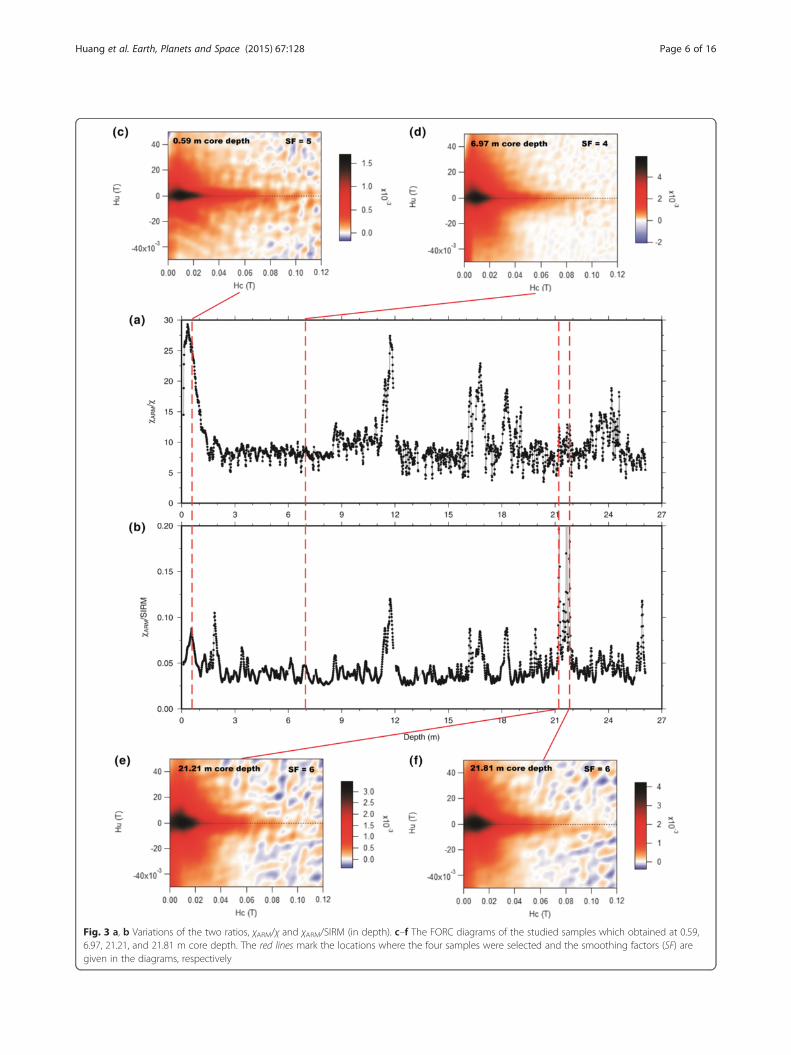
Fig. 3 a, b Variations of the two ratios, χARM/χ and χARM/SIRM (in depth). c–f The FORC diagrams of the studied samples which obtained at 0.59,6.97, 21.21, and 21.81 m core depth. The red lines mark the locations where the four samples were selected and the smoothing factors (SF) aregiven in the diagrams, respectively
Huang et al. Earth, Planets and Space (2015) 67:128 Page 6 of 16

Huang et al. Earth, Planets and Space (2015) 67:128 Page 7 of 16
local interaction field (Hu) between −50 and 50 mT. TheFORCinel software (Harrison and Feinberg, 2008) wasused for data processing, and smoothing factors (Robertset al. 2000) of 4–6 were used.As a result, instead of showing a narrow ridge shape,
all the FORC diagrams present the feature with a stron-ger signal of a teardrop shape and a weaker signal ofspread along the Hu axis in the study (Fig. 3c–f ). Thisfeature indicates that the magnetic minerals of the coreshould be consisted of dominance SD and minor PSDmagnetite. Because no feature of magnetosomes (a nar-row ridge shape) is found in the FORC diagrams, noclear evidence reveals the presence of magnetosomes inthe core. The effect of magnetosomes therefore wouldbe ignored in further discussions.
Relative paleointensityThe use of evaluating relative paleointensity (RPI) relieson the reliability criteria established by King et al. (1983)and refined by Tauxe (1993). For a better RPI evaluation,Tauxe (1993) suggested that sediment magnetizationshould be carried by SD and PSD magnetite. In general,ARM, SIRM, and χ were adopted to normalize NRM toverify a best way in removing the effects from magneticlithology. Tric et al. (1992) suggested that identicaldemagnetization treatment on NRM and ARM wouldoffer the best information about magnetization carriedby similar RM carriers. Based on the RPI evaluation, sev-eral stacks describing virtual axial dipole moment (VADM)have been reported (e.g., Guyodo and Valet 1999; Yamazakiand Oda 2005; Valet et al. 2005; Channell et al. 2009).The RM carriers of the core are dominated by SD and
PSD magnetite, suggesting a suitable material for RPIevaluation. For evaluating the RPI of the study, we firstnormalized the NRM by using the χ, ARM, and SIRM.Both NRM and ARM were demagnetized after 20 mTAF field, and the consistent in RM acquisitions for thestudied demagnetization sequence was presented in thestudy. As a result, the three ratios, NRM20mT/ARM20mT,NRM20mT/χ, and NRM20mT/SIRM, all present a similarvariation pattern (Fig. 4), and cross-correlation amongthe ratios also shows good correlation (coherence above0.8). These properties indicate that all these ratios couldoffer similar information for the RPI evaluation. Follow-ing the suggestion of Tric et al. (1992), we adopted theratio NRM20mT/ARM20mT as the RPI proxy and thencompared our RPI curve with the PISO-1500 stack(Channell et al. 2009) to get the RPI age control.
Age control and age modelThe age model of the core was built by using the con-trolling points from the oxygen isotopic analysis, acceler-ator mass spectrometry (AMS) 14C dating, and RPIdating. The RPI age control was obtained by correlating
our RPI record to the PISO-1500 stack (Channell et al.2009; Fig. 4). The δ18O record was analyzed by using theforaminiferal planktonic of Uvigerina spp. and Globigeri-noides ruber. Then, the oxygen isotope curve was corre-lated to the LR04 stack (Lisiecki and Raymo 2005) to getthe δ18O age control. The 14C record, sampled from theupper part of the core, was obtained by using the plankticforaminifers Globigerinoides ruber and Globigerinoidessaculifer and then sent to Tokyo University, Japan forAMS 14C dating. Detailed information about the δ18Oanalysis and AMS 14C dating was reported in the studiesof Shiau et al. (2011) and Shiau et al. (2012).In total, 29 controlling points were determined and
used to build the age model in the study, including sevenpoints of the RPI dating, 12 points of the δ18O analysis,and 10 points of the AMS 14C dating (Table 1; Fig. 5).Based on the age model, the core MD05-2928, with26.1 m in length, covers an age period about the last400 ka, revealing an average sedimentation rate of~6.53 cm ka−1.
ResultsCharacteristics of the magnetic parametersAfter determining the age model, time series data ofthe study could be obtained (Fig. 6). Nine marineisotope stages (MIS) were first identified based onthe δ18O record (Fig. 6a). Comparing the magneticparameters with the δ18O record, variations of themagnetic parameters appear to be linked to the MISchange except the S-ratio record (Fig. 6). This propertyimplies that the magnetic parameters could be roughlyconsidered as proxies describing the environmentalvariation in the study.Three magnetic proxies related to the concentration of
magnetic minerals (χ, SIRM, and ARM) show a similarvariation pattern: Relatively higher values (i.e., moremagnetic minerals) and lower values (i.e., fewer mag-netic minerals) are observed in glacial and interglacialperiods, respectively (Fig. 6b–d). Many spikes are foundin these proxies, especially in colder periods. Thesespikes could be roughly attributed to the increment ofvolcanic materials during glacial periods though there isno visible ash layer. Unlike typical cases of marine sedi-ment cores, the magnetic susceptibility present highervalues with an average about 150 × 10−5 SI unit (Fig. 6b),which may also reveal the abundance of volcanic mate-rials in the core. In contrast to the χ and SIRM, theARM shows relatively constant variation over the en-tire period of time (Fig. 6d), implying the relativelyconstant input of finer magnetic particles over thepast 400 ka in the area.For the proxies related to the magnetic grain size, the
most notable feature is the sharp peaks recorded in MIS7, MIS 5, and MIS 1 in the χARM/χ ratio (Fig. 6e). These

Fig. 4 a Three RPI estimation of the core (in depth): NRM20mT/SIRM in green, NRM20mT/χ in red, and NRM20mT/ARM20mT in blue. b The PISO-1500stack (blue) and Sint-2000 stack (red) for the last 750 ka (Channell et al. 2009). The black dashed line represents the threshold that appears totrigger excursions and reversals. Red dashed lines between up and down patterns correlate our RPI to the PISO-1500 stack
Huang et al. Earth, Planets and Space (2015) 67:128 Page 8 of 16
peaks rise over a constant value of ~8 Am−1 and occursystematically during the periods when the χ and SIRMare low (Figs. 6b, c). However, similar feature is notfound in another grain size proxy, SIRM/χ (Fig. 6f ).These peaks therefore should be more related to thevariation of χ and SIRM (magnetic mineralogy) ratherthan the change of the magnetic grain size. Except thepeaks, both grain size proxies show simultaneous vari-ation with the MIS change. Relatively lower values (i.e.,coarser magnetic grains) are found in glacial periods andhigher values (i.e., finer magnetic grains) are observed ininterglacial periods (Fig. 6e, f ).As for the magnetic mineralogy proxy, the S-ratio
values are almost greater than 0.9 (Fig. 6g), revealing thedominance of magnetic minerals with lower coercivity(e.g., magnetite) in the core. The notable peaks recordedin the χARM/χ also synchronously show lower values inthe S-ratio (Fig. 6e, g). This systematic variation couldalso give evidence that the peaks were induced by the
change of magnetic mineralogy rather than the changeof magnetic grain size. In addition, many low-valueevents appear to be recorded in cold periods and at MISboundaries, but no clear correlation between the S-ratiovariation and MIS change is observed.
Period analysesTo study the periodicities embedded in the environmen-tal proxies of the core, we performed two period ana-lyses: eccentricity, tilt, and precession (ETP) curves andwavelet spectra. Four proxies were selected for the periodanalyses, including the δ18O, χ, χARM/χ, and S-ratio. Forthe ETP analysis, we first filtered out the Milankovitchperiods—eccentricity (100-ka period), tilt or obliquity(41-ka period), and precession (23-ka period)—fromeach of the proxies, respectively. Then, the ETP curveswere composed of the three Milankovitch periods(Figs. 7a, 8a, 9a, and 10a). Further, considering the otherperiods out of the Milankovitch periods, the wavelet

Table 1 Age model of the core MD05-2928
Depth (m) Age (ka) Method
0.17 1.3 AMS 14C dating
0.72 5.0
1.12 8.4
1.62 12.5
1.87 15.3
2.12 16.8
2.37 18.8
2.72 20.7
3.47 24.2
3.67 26.0
7.37 62 δ18O dating, correlated to the LR04 stack
9.02 82
9.52 87
10.12 96
11.02 109
11.92 128
12.72 140
15.17 185
17.42 223
18.87 252
19.97 269
21.17 286
5.09 41 RPI dating, correlated to the PISO-1500 stack
11.45 120
15.98 194
17.02 211
21.86 295
24.30 325
25.86 385
Huang et al. Earth, Planets and Space (2015) 67:128 Page 9 of 16
spectrum was applied to the proxies (in real data) to get amore detailed period analysis (Figs. 7b, 8b, 9b, and 10b).As a result, variations of the δ18O record and its ETP
curve show good correlation (Fig. 7a), revealing thedominance of the orbital forcing in environmental set-ting around PNG. As expected, the wavelet spectrum ofthe δ18O presents the Milankovitch periods (Fig. 7b).Also for the magnetic proxies (χ and χARM/χ), the ETPcurves compare well to the original records and thewavelet spectra clearly present the Milankovitch periodsover the entire period of time (Figs. 8 and 9). In fact,the spectra of the other magnetic parameters (SIRM,ARM, and SIRM/χ) also show the dominance of theMilankovitch periods though the results are not pre-sented in the paper.Only the ETP curve of the S-ratio, in contrast, appears
to show worse correlation to the original record; also,
the spectrum presents an unusual pattern instead ofshowing the orbital periods (Fig. 10). The stronger signalof the S-ratio spectrum roughly centers between ~40-and ~60-ka periods before 240 ka and shifts to ~20-kaperiod between 240 and 190 ka. After 190 ka, the periodshifts back and centers between ~40-ka and ~60-ka pe-riods again. Moreover, instead of showing a 100-kaperiod, a doubtful eccentricity period is found at~130 ka, but the signal of this longer period is relativelyweaker (Fig. 10b).Except the orbital periods, we observe another feature
that the spectrum signals appear to concentrate on sometime periods, e.g., in MIS 7, MIS 5, and MIS 1 in theχARM/χ record (Fig. 9b). This feature is considered to beinduced by the larger changes in the original data.Huang (2010) has tested and discussed this feature andproposed that larger peaks or troughs in time serieswould bring significant influences to the waveletspectrum. The amplitude would concentrate on the agewhen the abrupt change happened. Therefore, this fea-ture is unrelated to the orbital forcing and is also insig-nificant for further environmental discussions.Overall, the Milankovitch periods were obviously re-
corded in the environmental magnetic proxies exceptthe S-ratio in the study (Figs. 7–10). Though someevents with shorter periods might be unrelated to the or-bital forcing, the orbital forcing undoubtedly played thekey role dominating the long-term variation of the mag-netic particles around PNG.
DiscussionMagnetic properties related to environmental settingThe core site of MD05-2928 is located at the southernoffshore of the Papuan Peninsula (Fig. 1). At the presentday, most sediments coming from central New Guineawould be stored on the inner shelf (Brunskill et al. 1995;Wolanski et al. 1995; Harris et al. 1996; Walsh et al.2004; Keen et al. 2006). Only finer terrestrial detritusmight be brought to the core site location by ocean cur-rents. Moreover, Shiau et al. (2012) proposed that thedetritus fluxes would be influenced by regional precipita-tion in addition to sea level or ice volume change in thearea, and also, they suggested that the terrestrial detrituscoming from the Papuan Peninsula would contribute alot to the core site in colder periods based on the 230Th-nomalized analysis.In the study, we provide a viewpoint from environ-
mental magnetism. Magnetic proxies related to magneticconcentration (χ, SIRM, and ARM) show that magneticminerals were more in glacial periods and were fewer ininterglacial periods (Fig. 6b–d). This property is inagreement with the general concept in passive continen-tal margins (Nelson, 1990; Handford and Loucks, 1993;Schlager et al. 1994) and also in agreement with the

Fig. 5 Age model of the core MD05-2928. The controlling points include the AMS 14C dating, δ18O analysis, and RPI dating
Huang et al. Earth, Planets and Space (2015) 67:128 Page 10 of 16
studies of siliciclastic fluxes in the Pandora Troughnearby the GoP (Febo et al. 2008; Jorry et al. 2008). Inaddition, numerous spikes recorded in MIS 8, MIS 7.4,and MIS 6 in the χ record imply the increased input ofvolcanic materials in colder periods (Fig. 6b). In contrastto the χ and SIRM, the ARM showed relatively constantvariation over the entire time period (Fig. 6d), revealinga continuous supply of finer magnetite particles for thelast 400 ka. For the proxies related to the magnetic grainsize (χARM/χ and SIRM/χ), coarser and finer grains ofmagnetic minerals were recorded in glacial and intergla-cial periods, respectively (Figs. 6e, f ). The notable peaksobserved in the χARM/χ were not recorded in the SIRM/χ, but they occurred systematically during the periodswhen the χ, SIRM, and S-ratio were low (Fig. 6). Thesepeaks were therefore more possible to be induced by thechange of the magnetic mineralogy rather than thechange of the magnetic grain size.Based on the magnetic results, possible mechanism
describing the environmental setting around PNG couldbe interpreted: In interglacial periods, like the presentday, sediments coming from the GoP would be trans-ported by the coastal currents in the northern Coral Sea.Because coarser grain sediments were mostly stored onthe shelf, only fewer and finer grain sediments would becontributed to the core site by the currents. As a result,the magnetic minerals of the core were relatively fewer
and finer in interglacial periods. In glacial periods, theocean currents might be significantly modified due tolower sea level around the area (Kuhnt et al. 2004;Holbourn et al. 2005; Huang et al. 2011). The routes ofthe currents regressed seaward with reduced current in-tensity, and therefore, the amount of sediments comingfrom the GoP decreased. Because sediments from thePapuan Peninsula would contribute a lot to the core sitein colder periods (Shiau et al. 2012), the main source ofmagnetic minerals was considered to shift to the PapuanPeninsula (nearby the core site). Because the source wasrelatively close to the core site, the input to the core sitewould become more and coarser during glacial periods.In addition, the finer magnetic particles from the GoP(by the currents) should continuously contribute to thecore site over the entire time period due to the evidenceof the constant ARM though the amount should be rela-tively minor.Because the evidence of past glaciations were also
found in southeastern PNG (Hastenrath 2009), morevolcanic materials from the volcanic arc (Papuan Penin-sula) should be brought into the sea by glaciations inglacial periods. The signal related to the increasedvolcanic materials, i.e., the peaks in the χ record (Fig. 5b),is therefore thought to be the effect caused by strongerglaciations in colder glacial periods (MIS 8, MIS 7.4,and MIS 6). Also the result from the 230Th-nomalized

Fig. 6 Time-series data studied in the study, including (a) δ18O, (b) magnetic susceptibility, (c) SIRM, (d) ARM, (e) χARM/χ, (f) SIRM/χ, and (g) S-ratio.Yellow and white areas mark the identified glacial and interglacial periods, respectively, and the numbers give the glacial stages
Huang et al. Earth, Planets and Space (2015) 67:128 Page 11 of 16
analysis of the core shows that the terrestrial input causedby rainfall and river runoff from the Papuan Peninsulawould increase during cold periods (Shiau et al.2012). We could therefore roughly deduce that thevolcanic materials, eroded by stronger glaciations fromthe Papuan Peninsula, would increase and importedto the sea by rainfall and glacial meltwaters in colderglacial periods, MIS 8, MIS 7.4, and MIS 6.As for the S-ratio of the study, the variation appears to
be unrelated to the MIS change, but several low-valueevents are observed in glacial periods and at MIS bound-aries (Fig. 6g). These events imply that stronger changesof the magnetic mineralogy, possibly related to stronger
climate variation (e.g., heavy rainfall), might happen dur-ing glacial-interglacial transition. Moreover, by comparingthe S-ratio with the magnetic susceptibility (Figs. 6b, g),the low-value events recorded between MIS 8 andMIS 6 could be attributed to the input of volcanic ma-terials, which might also be influenced by the rainfallvariation. Because no clear correlation between the S-ratio and MIS change is observed, we think that theS-ratio should be more sensitive to the climate vari-ation with shorter periods in the study. These low-value events are preliminary attributed to the rainfallvariation in PNG but more evidence is needed to im-prove this viewpoint.

Fig. 8 a The magnetic concentration proxy (magnetic susceptibility) of the core MD05-2928. b Wavelet spectrum of the proxy
Fig. 7 a The δ18O data of the core MD05-2928. Red dashed line is the ETP signal of this parameter. b Wavelet spectrum of the δ18O. White dashedlines show the Milankovitch periods (100, 40, and 20 ka)
Huang et al. Earth, Planets and Space (2015) 67:128 Page 12 of 16

Fig. 10 a The magnetic mineralogy proxy (S-ratio) of the core MD05-2928. b Wavelet spectrum of the proxy
Fig. 9 a The magnetic grain size proxy (χARM/χ) of the core MD05-2928. b Wavelet spectrum of the proxy
Huang et al. Earth, Planets and Space (2015) 67:128 Page 13 of 16

Huang et al. Earth, Planets and Space (2015) 67:128 Page 14 of 16
Dominance of the orbital forcingOrbital forcing has been widely demonstrated to be one ofthe main drivers of environmental variation. With the in-crease in length of sedimentary and paleoclimatic records,time scales recording the influences of orbital forcing mayextend from the Quaternary to Triassic periods (e.g., Ikedaet al. 2010; Huang et al. 2011; Ikeda and Tada 2013). Ingeneral, the Milankovitch theory is conveniently used tointerpret the variation of glacial and interglacial periodsrelated to the orbital forcing. Three orbital parameters ofthe Milankovitch cycles are critical in describing the solarinsolation change. They are eccentricity, obliquity, andprecession with dominant periods centered at 100, 41, and23 ka, respectively. The 100-ka period, also thought to bemain MIS cycle (Broecker and van Donk 1970), is usuallyrelated to global ice volume accumulation and/or sea levelchange. The 41 and 23 ka periods, possibly linked more tothe solar insolation change (Muller and MacDonald 2000),might control the amount of regional precipitation.Based on the results of the magnetic properties, sea
level change is suggested to be an important factor af-fecting the long-term environmental variation aroundPNG. In the periodicity study, both analyses of ETPcurves and wavelet spectra of the parameters show thedominance of orbital forcing except the S-ratio (Figs. 7–10). The presence of the strongest 100-ka signal may alsogive the evidence to our suggestion: Long-term variationsof the magnetic concentration (the proxy χ) and magneticgrain size (the proxy χARM/χ) were dominated by the chan-ged route and intensity of the costal currents due to sealevel change. Sea level change should certainly be the keyrole controlling the environmental setting around PNG.In addition, both 40- and 20-ka periods are also sig-
nificant in the spectra (Figs. 7b–9b), indicating the im-portance of the effects from obliquity and precessionthough the 20-ka signal appears to be relatively weaker.Obliquity and precession are generally considered to bemore related to the solar insolation. Increased/decreasedsolar insolation would raise/reduce the temperature andthen supplied more/fewer water vapors to the atmos-phere; as a result, more/less rainfall would be received inPNG. The study of the detritus flux proxies of this corealso suggested that the 20-ka components should be at-tributed to regional precipitation (Shiau et al. 2012).Therefore, in addition to global sea level change, theprecipitation variation should be the second factor af-fecting the environmental setting around PNG.Instead of showing the typical Milankovitch periods,
the spectrum of the S-ratio, generally thought to be re-lated to the change of magnetic mineralogy, presents anunusual pattern. Dominant signal appears to vary be-tween ~60- and ~20-ka periods (Fig. 10b), probablyresulting from the interaction between obliquity andprecession. We might therefore suggest that the S-ratio
should be a proxy more sensitive to obliquity and pre-cession in the study. However, the mechanism betweenthe change of magnetic mineralogy and the change ofregional precipitation, which might be linked to the solarinsolation variation, is still unknown at this step. Morerecords and evidences are needed to improve theviewpoint.
ConclusionsThe core MD05-2928, with 26.1 m in length, covers an ageperiod over the past ~400 ka. From the magnetic results ofthe core, we can observe that variations of magnetic pa-rameters (χ, SIRM, ARM, χARM/χ, and SIRM/χ) are clearlyrelated to the MIS change. This feature denotes that thesemagnetic parameters could be considered as proxies de-scribing the paleoenvironmental variation around PNG. Ininterglacial periods, sediments coming from New Guineaand the GoP would be imported to the sea and then trans-ported by the coastal currents in northern Coral Sea.Coarser sediments would be stored on the shelf, and onlyfewer and finer sediments were contributed to the coresite by the currents. As a result, magnetic minerals ofthe core were fewer and finer in interglacial periods. Inglacial periods, the routes of the coastal currents pos-sibly regressed seaward with reduced current intensitydue to the lower sea level. Sediments coming from theGoP should decrease, and main source might shift tothe Papuan Peninsula. Because the sediment sourcefrom the Papuan Peninsula was relatively near the coresite, magnetic minerals became more and coarser inglacial periods. Moreover, the ETP curves and waveletspectra clearly show the dominance of the Milankovitchperiods. The strongest signal of 100-ka period reveals thatsea level change dominates the long-term environmentalsetting around PNG. However, effects from the orbitalforcing of 40- and 20-ka periods, possibly related moreto the solar insolation variation, should also be consideredeven though they might be second factors affecting theenvironmental setting around PNG.
Competing interestsThe authors declare that they have no competing interests.
Authors’ contributionsYSH did the magnetic measurements, ran the data analyses, and drafted themanuscript. TQL collected and provided the core sample. TQL and SKHfunded the plan, and also they raised critical issues in the first draft. Allauthors read and approved the final manuscript.
AcknowledgementsWe would like to express our appreciation to all the researchers and staffson the R.V. Marion Dufresne operated by the French Polar Institute (IPEV)during the IMAGES Cruise VII to collect such a high quality core from theCoral Sea. We particularly thank Dr. Yu-Min Chou, National Taiwan University(NTU) for his great help in FORC measurements and giving us lots ofvaluable comments. Also we would like to thank the group of the nationalcore laboratory located at the National Taiwan Ocean University (NTOU) forthe help of the core sampling; members in the paleomagnetic laboratory,institute of Earth Sciences (IES), Academia Sinica for the help on the

Huang et al. Earth, Planets and Space (2015) 67:128 Page 15 of 16
magnetic experiments; and crew of marine geophysical research, NationalCentral University (NCU) for valuable discussions. The financial supportcame from National Science Council (NSC) of Taiwan under the grantNSC 95-2116-M-001-011. The figures were mainly plotted by using GMTsoftware (Wessel and Smith 1998), and the calculation was done byusing MATLAB software.
Received: 30 January 2015 Accepted: 3 August 2015
ReferencesBassett SE, Milne GA, Mitrovica JX, Clark PU (2005) Ice sheet and solid earth
influences on far-field sea-level histories. Science 309:925–928Beaufort L, Chen MT, Droxler AW, Yokoyama Y, Balut Y, Rothe S (2005)
MD148-PECTEN IMAGES XIII cruise report. Inst. Pol. Fr, Plouzane, FranceBroecker WS, van Donk J (1970) Insolation changes, ice volumes, and the δ18O
record in deep-sea cores. Rev Geophys Space Phys 8:169–197Brunskill GJ, Woolfe KJ, Zagorskis I (1995) Distribution of riverine sediment
chemistry on the shelf, slope and rise of the Gulf of Papua. Geo Mar Lett15:160–165
Brunskill GJ (2004) New Guinea and its coastal seas, a testable model of wettropical coastal processes: an introduction to Project TROPICS. Cont Shelf Res24:2273–2295
Carson BE, Francis JM, Leckie RM, Droxler AW, Dickens GR, Jorry SJ, Bentley SJ,Peterson LC, Opdyke BN (2008) Benthic Foraminiferal response to sea levelchange in the mixed siliciclastic-carbonate system of southern AshmoreTrough (Gulf of Papua). J Geophy Res 113:F01S20. doi:10.1029/2006JF000629
Channell JET, Xuan C, Hodell DA (2009) Stacking paleointensity and oxygenisotope data for the last 1.5 Myr (PISO-1500). Earth Planet. Sci Lett 283:14–23
Chao BF, Naito I (1995) Wavelet analysis provides a new tool for studying earth’srotation. Eos, Trans. AGU 76:161–165
Clark PU, Marshall A, McCabe A, Mix AC, Weaver J (2004) Rapid rise of sea level19000 years ago and its global implications. Science 304:1141–1144
Dunbar GB, Dickens GR, Carter RM (2000) Sediment flux across the Great BarrierReef Shelf to the Queensland Trough over the last 300 ky. Sediment Geol133:49–92
Egli R (2006) Theoretical aspects of dipolar interactions and their appearance infirst-order reversal curves of thermally activated single-domain particles.J Geophys Res 111:B12S17. doi:10.1029/2006JB004567
Egli R, Chen AP, Winklhofer M, Kodama KP, Horng CS (2010) Detection ofnoninteracting single domain particles using first-order reversalcurve diagrams. Geochem Geophys Geosyst 11:Q01Z11.doi:10.1029/2009GC002916
Febo LA, Bentley SJ, Wrenn JH, Droxler AW, Dickens GR, Peterson LC, Opdyke BN(2008) Late Pleistocene and Holocene sedimentation, organic-carbondelivery, and paleoclimatic inferences on the continental slope of thenorthern Pandora Trough, Gulf of Papua. J Geophy Res 113:F01S18
Guyodo Y, Valet JP (1999) Global changes in intensity of the Earth's magneticfield during the pass 800 kyr. Nature 399:249–252
Handford CR, Loucks RG (1993) Carbonate depositional sequences and systemtracts-Responses of carbonate platforms to relative sea-level changes. InCarbonate Sequence Stratigraphy: Recent Developments and Application.Loucks RG, Sarg JF (eds). AAPG Mem 57:3–41
Harris PT, Pattiaratchi CB, Keene JB, Dalrymple RW, Gardner JV, Baker EK, Cole AR,Mitchell D, Gibbs P, Schroeder WW (1996) Late Quaternary deltaic andcarbonate sedimentation in the Gulf of Papua foreland basin: response tosea-level change. J Sediment Res 66:801-819
Harrison RJ, Feinberg JM (2008) FORCinel: an improved algorithm for calculatingfirst-order reversal curve distributions using locally weighted regressionsmoothing. Geochem Geophys Geosyst 9, Q05016
Hastenrath S (2009) Past glaciation in the tropics. Quat Sci Rev 28(9–10):790–798Heslop D, Roberts AP, Chang L, Davies M, Abrajevitch A, De Deckker P (2013)
Quantifying magnetite magnetofossil contributions to sedimentarymagnetizations. Earth Planet Sci Lett 382:58–65
Hobbs JE, Lindesay JA, Bridgman HA (1998) Climates of the southern continents:present, past and future. West Sussex, England, John Wiley & Sons Ltd
Holbourn A, Kuhnt W, Kawamura H, Jian Z, Grootes P, Erlenkeuser H, Xu J(2005) Orbitally paced paleoproductively variations in the Timor Sea andIndonesian Throughflow variability during the last 460 kry.Paleoceanography 20, PA3002
Huang YS (2010) Late Quaternary Milankovitch-scale environmental variation inthe western Pacific: time-series analysis of magnetic data, PhD thesis.National Central University, Chung-Li, Taiwan
Huang YS, Lee TQ, Hsu SK (2011) Milankovitch-scale environmental variation inthe Banda Sea over the past 820 ka: fluctuation of the Indonesian throughflow intensity. J Asian Earth Sci 40:1180–1188
Ikeda M, Tada R, Sakuma H (2010) Astronomical cycle origin of bedded chert: amiddle Triassic bedded chert sequence, Inuyama, Japan. Earth Planet Sci Lett297:369–378
Ikeda M, Tada R (2013) Long period astronomical cycles from the Triassic toJurassic bedded chert sequence (Inuyama, Japan); geologic evidences for thechaotic behavior of solar planets. Earth Planet Space 65:351–360
Jorry SJ, Droxler AW, Mallarino G, Dickens GR, Bentley SJ, Beaufort L, Peterson LC,Opdyke BN (2008) Bundled turbidite deposition in the central PandoraTrough (Gulf of Papua) since Last Glacial Maximum: linking sediment natureand accumulation to sea level fluctuations at millennial timescale. J GeophyRes 113:F01S19. doi:10.1029/2006JF000649
King J, Banerjee SK, Marvin J, Ozdemir O (1982) A comparison of different magneticmethods for determining the relative grain size of magnetite in naturematerials: some results from lake sediments. Earth Planet Sci Lett 59:404–419
King JW, Banerjee SK, Marvin J (1983) A new rockmagnetic approach to selectingsediments for geomagnetic paleointensity studies: application topaleointensity for the last 4000 years. J Geophy Res 88:5911–5921
Keen TR, Ko DS, Slingerland RL, Riedlinger S, Flynn P (2006) Potential transportpathways of terrigenous material in the Gulf of Papua. Geophys Res Lett33:L04608
Kuhnt W, Holbourn AE, Hall R, Zuleva M, Kase R (2004) New history of theIndonesia Throughflow. In Continent-Ocean Interations Within East AsiaMarginal Seas. Geophys Monogr Ser 149:287–308, AGU, Washington D. C
Lisiecki LE, Raymo ME (2005) A Pliocene-Pleistocene stack of 57 globallydistributed benthic δ18O records. Paleoceanography 20, PA1003
Liu HS, Chao BF (1998) Wavelet spectral of the earth’s orbital variation anpaleoclimate cycles. J Atmos Sci 55:227–236
McAlpine JR, Keig G, Falls R (1983) Climate of Papua New Guinea. CSIRO andAustralian National University Press, Canberra, Australia
Milliman JD (1995) Sediment discharge to the ocean from small mountainousrivers: the New Guinea example. Geo Mar Lett 15(3–4):127–133
Morlet J, Arehs I, Fourgeau I, Giard D (1982) Wave propagation and samplingtheory. Geophysics 47:203–236
Moskowitz BM, Frankel RB, Bazylinski DA (1993) Rock magnetic criteria for thedetection of biogenic magnetite. Earth Planet Sci Lett 120:283–300
Muhammad Z, Bentley SJ, Febo LA, Droxler AW, Dickens GR, Peterson LC,Opdyke BN (2008) Excess 210Pb inventories and fluxes along the continetalslope and bassins of the Gulf of Papua. J Geophy Res 113:F01S17
Muller RA, MacDonald GJ (2000) Ice ages and astronomical causes: data, spectralanalysis and mechanisms. Chichester, UK, Springer-PRAXIS
Nelson CH (1990) Estimated post-Messinian sediment supply and sedimentationrates on Ebro continental margin, Spain. Marine Geology 95:395–418
Opdyke ND, Channell JET (1996) Magnetic parameters sensitive to concentration,grain size and mineralogy. In: Magnetic stratigraphy. Academic, USA,pp 251–253
Page MC, Dickens GR, Dunber GB (2003) Tropical view of quaternary sequencestratigraphy: siliciclastic accumulation on slopes east of the Great Barrier Reefsince the Last Glacial Maximum. Geology 31:1013–1016
Pike CR, Roberts AP, Verosub KL (1999) Characterizing interactions in finemagnetic particle systems using first order reversal curves. J Appl Phys85:6660–6667
Qu T, Lindstrom EJ (2002) A climatological interpretation of the circulation in thewestern south Pacific. J Phys Oceanogr 32:2492–2508
Roberts AP, Pike CR, Verosub KL (2000) First-order reversal curve diagrams: a newtool for characterizing the magnetic properties of natural samples. J GeophysRes 105:28,461–28,475
Shiau LJ, Chen MT, Clemens SC, Huh CA, Yamamoto M, Yokoyama Y (2011)Warm pool hydrological and terrestrial variability near southern Papua NewGuinea over the past 50k. Geophys Res Lett 38:L00F01
Shiau LJ, Chen MT, Huh CA, Yamamoto M, Yokoyama Y (2012) Insolation andcross-hemispheric controls on Australian monsoon variability over the past180 ka: new evidence from offshore southeastern Papua New Guinea.J Quarter Sci 27:911–920
Schlager W, Reijmer JJG, Droxler AW (1994) Highstand shedding of carbonateplatforms. J Sediment Res 64:270–281

Huang et al. Earth, Planets and Space (2015) 67:128 Page 16 of 16
Sugiura N (1979) ARM, TRM, and magnetic interactions: concentrationdependence. Earth Planet Sci Lett 42:451–455
Tauxe L (1993) Sedimentary records of relative paleointensity of thegeomagnetic field: theory and practice. Rev Geophys 31(3):319–354
Tric E, Valet JP, Tucholka P, Paterne M, Labeyrie L, Guichard F, Tauxe L,Fontugne M (1992) Paleointensity of the geomagnetic field during thelast 80,000 years. J Geophys Res 97(B6):9337–9351
Valet JP, Maynadier L, Guyodo Y (2005) Geomagnetic dipole strength andreversal rate over the past two million years. Nature 435:802–805
Walsh JP, Nittrouer CA (2003) Contrasting styles of off-shore sedimentaccumulation in New Guinea. Mar Geol 196:105–125
Walsh JP, Nittrouer CA, Palinkas CM, Ogston AS, Sternberg RW, Brunskill GJ (2004)Clinoform mechanics in the Gulf of Papua, New Guinea. Cont Shelf Res24:2487–2510
Wang PS (2009) Global monsoon in a geological perspective. Chinese Sci Bull54(7):1113–1136
Wessel P, Smith WHF (1998) New improved version of Generic Mapping Toolsreleased, EOS Trans. AGU 79:579
Wolanski E, Norro A, King B (1995) Water circulation in the Gulf of Papua. ContShelf Res 15:185–212
Yamazaki T, Oda H (2005) A geomagnetic paleointensity stack between 0.8 and3.0 Ma from equatorial Pacific sediment cores. Geochem Geophys Geosyst6:Q11H20
Yan XH, Ho CR, Zheng Q, Klemas V (1992) Temperature and size variabilities ofthe western Pacific warm pool. Science 258:1643–1645
Yokoyama Y, Lambeck K, De Deckker P, Johnson P, Fifield K (2000) Timing of theLast Glacial Maximum from observed sea-level minima. Nature 406:713–716
Submit your manuscript to a journal and benefi t from:
7 Convenient online submission
7 Rigorous peer review
7 Immediate publication on acceptance
7 Open access: articles freely available online
7 High visibility within the fi eld
7 Retaining the copyright to your article
Submit your next manuscript at 7 springeropen.com