orange county water and presentation title beyond! · reservoirs, with a total storage capacity of...
TRANSCRIPT

PRESENTATION TITLEKarl W. Seckel, P.E.
Assistant General ManagerMunicipal Water District of Orange County
April 3, 2018
Orange County Water and Beyond!
2
Topics for Presentation
Water Basics
Water Conservation
Climate Change
Colorado River Over Allocation
The Drought and how we survived
Bay-Delta, California WaterFix – History Being Made!
Carson Regional Indirect Potable Supply (Carson IPR)
OC Water Reliability Study
Parting Thoughts

3
Drinking Water Cognition
24/7 + 365

Who we are and where our supplies originate
4
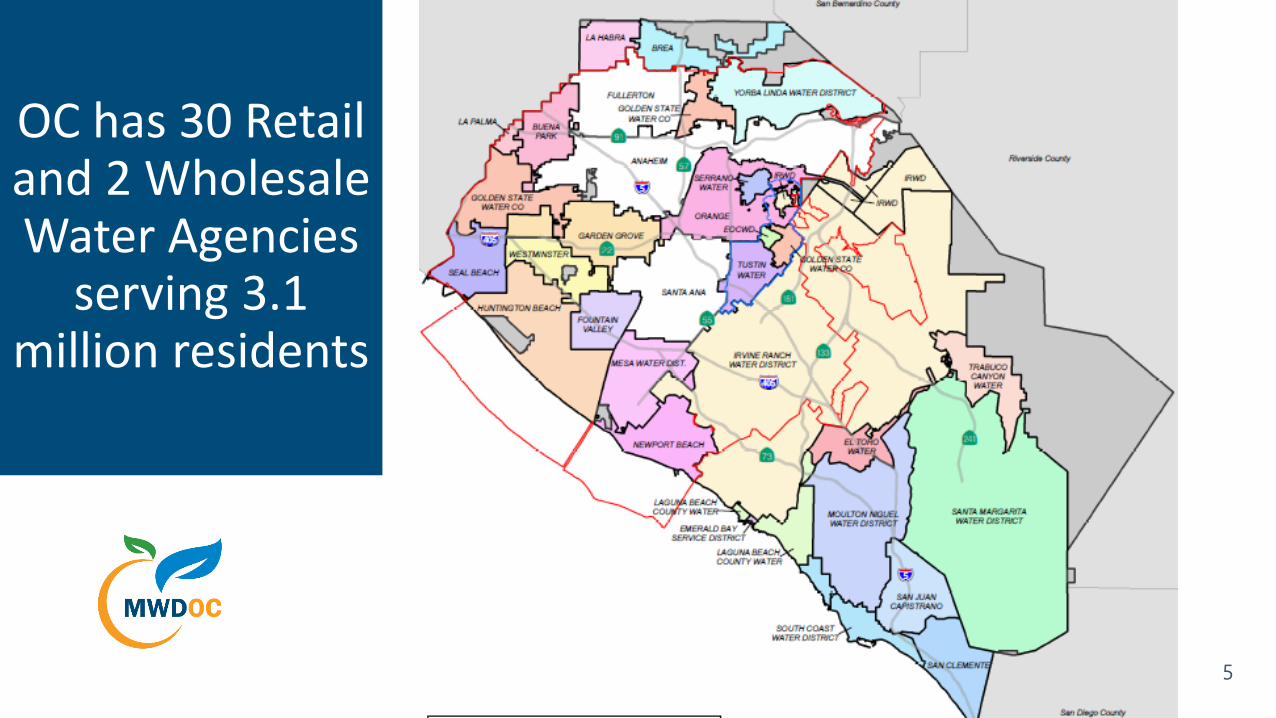
OC has 30 Retail and 2 Wholesale Water Agencies
serving 3.1 million residents
5

Local Supplies Groundwater & Recycling
Ocean Desalination (future)
Conservation(Water Use Efficiency)
Colorado River Aqueduct (1941)State
Water Project Entitlement (1972)
Transfers & Storage
Bay Delta Area
25%
25%
50%
Where OC Gets Its Water~50% Import~50% Local
6

How Much Water Do We Use?
• Southern California = 3.6 Million Acre Feet (MAF)
• Southern California Imported = 1.8 MAF
• Orange County Total = 0.5 MAF
• Indoor usage = 50 gallons per person per day
• Outdoor usage = depends on size of yard, type of
planting, type of irrigation, # of residents, but
somewhere around 100 gallons per person per day
average
1 Acre-Foot = 1 Football Field 1 foot deep (also 326,000
Gallons)
7
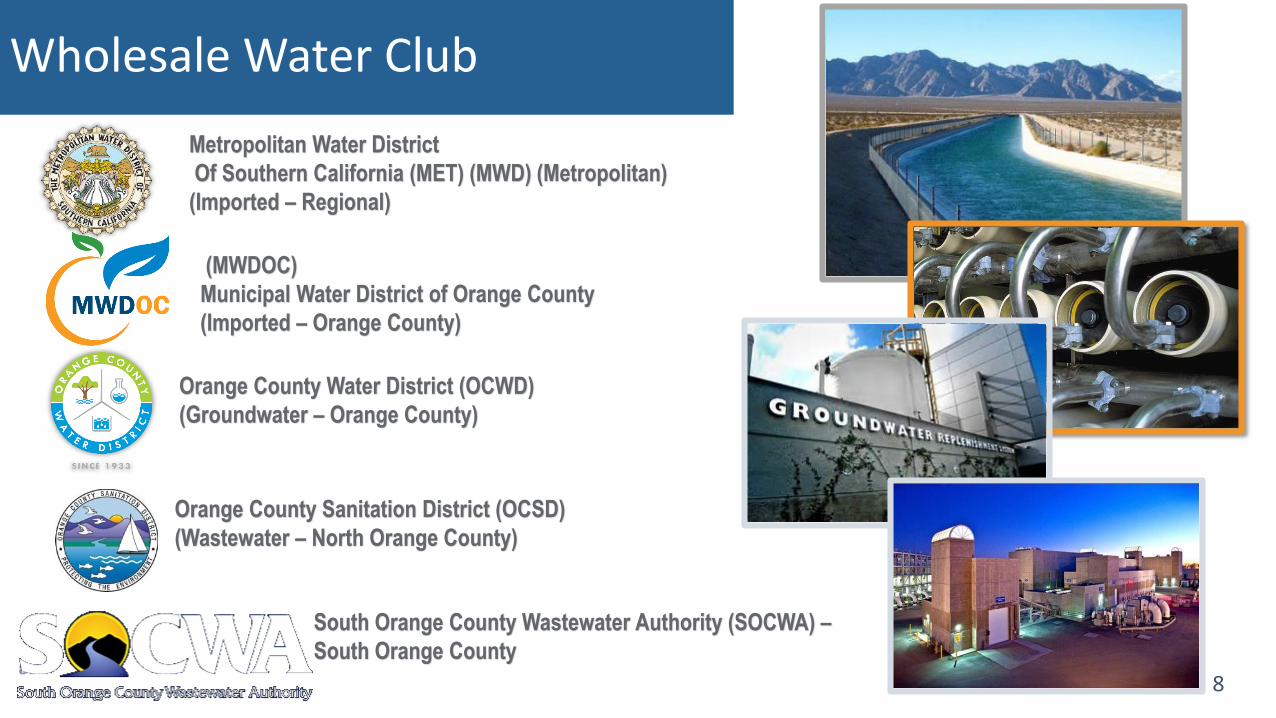
Wholesale Water Club
8
Metropolitan Water District
Of Southern California (MET) (MWD) (Metropolitan)
(Imported – Regional)
(MWDOC)
Municipal Water District of Orange County
(Imported – Orange County)
Orange County Water District (OCWD)
(Groundwater – Orange County)
Orange County Sanitation District (OCSD)
(Wastewater – North Orange County)
South Orange County Wastewater Authority (SOCWA) –
South Orange County
8

1. Brea/La Habra2. OCWD3. Non-OCWD
South County
1+2+3 =Total OC
75% Local Water
90% Local Water
5-10% Local Water
OC Study Areas based on Local Resources
9

10
MWDOC has 7 Directors elected by divisions
10

11
MWDOC – what we do
MUNICIPAL WATER
DISTRICT OF ORANGE
COUNTY (MWDOC)
We are part of
Metropolitan Water District
of Southern California
(MET) - we appoint 4 of 37
directors to the MET
Board 19 million residents within 26 MET Member
Agencies

12
MWDOC – what we do
Imported Water Supply
Water Supply Development
Water Reliability
Emergency Response
Water Use Efficiency
School Program
Public Information and Water Education
Legislative Advocacy
PRIMARY RESPONSIBILITIES

Water Conservation
13

Subject Introduction
14
O.C. Water Conservation Mandates – how have we done?

25.12%
28.45%
23.47%
15.58%
17.67% 18.00%
9.11%
22.56% 22.55%22.31% 22.90%
18.59%
Orange County Voluntary Savings Goal 10%
0%
5%
10%
15%
20%
25%
30%
Aug-15 Sep-15 Oct-15 Nov-15 Dec-15 Jan-16 Feb-16 Mar-16 Apr-16 May-16 Jun-16 Jul-16
Perc
en
t o
f A
F Sa
vin
gs
Average Monthly Water Savings for Orange County Compared to CY 2013
Cumulative Savings for O.C. 22.05%
O.C. Water Savings Reported to SWRCB
15

Too much water applied!
System inefficiencies!
Too much runoff!
Lack of maintenance!
Lack of management!
Lack of communication!
Water Conservation – Reduce Over-Watering
16

Water Conservation – The Solution
17
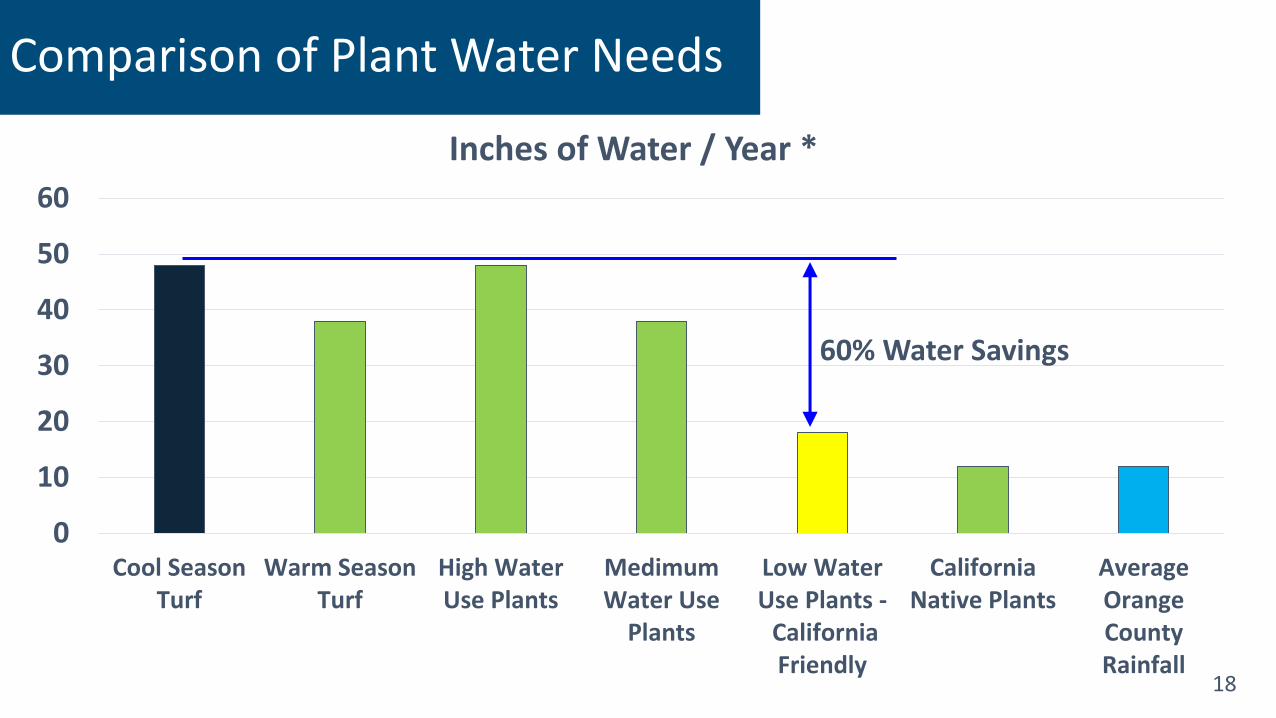
Comparison of Plant Water Needs
0
10
20
30
40
50
60
Cool SeasonTurf
Warm SeasonTurf
High WaterUse Plants
MedimumWater Use
Plants
Low WaterUse Plants - CaliforniaFriendly
CaliforniaNative Plants
AverageOrangeCountyRainfall
Inches of Water / Year *
60% Water Savings
18

1. Understand how much water is being applied and adjust appropriately (typically, we over-water)
2. Modify the irrigation system to use MP rotator nozzles or drip irrigation & separate out plant hydrozones
3. Reduce turf areas and add California Friendly plantings. Provide the appropriate type of irrigation system for the California Friendly plants
4. You may need to hire an irrigation/landscape specialist
Conservation Tips
19

WWW.ocfriendlylandscapes.com/
WWW.OCWATERSMART.COM
WWW.MWDOC.COM
Key Websites for WUE
20

Climate Change
22

23
• Climate change occurs when the factors that influence it changes.
• Changing climate on a global scale can only occur when the amount of heat in
the Earth’s system changes by either being added or released.
• Climate change is happening and has always happened. Currently, our Earth is
warming. Earth's average temperature has risen by 1.5°F over the past century,
and is projected to rise another 0.5 to 8.6°F over the next hundred years.
• Small changes in the average temperature of the planet can translate to large
shifts in climate and weather.
• To some extent, global warming is a natural event. On the scale of thousands,
hundreds of thousands of years, or millions of years the climate has gone
through many changes.
• What makes this so complex is that everything is connected in some way.
Climate Change Basics

24
• Following are a series of graphics indicating the variation of temperature over
many periods of time:
Earth’s Temperature Changes

25
1o C

26
1o C

27
1o C

28
1o C

29
1o C
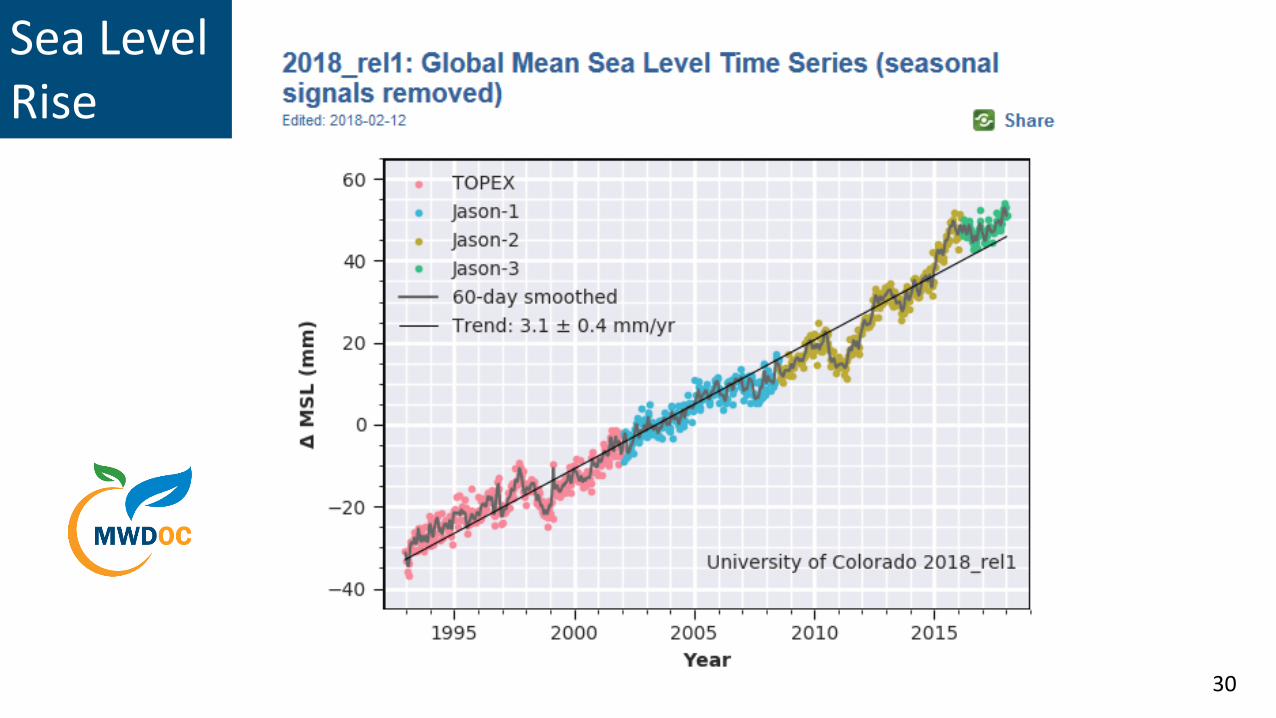
Sea Level Rise
30

Global Temperature Increases
31

32
• Weather = state of the atmosphere at a given time and place
• Climate = patterns of weather over a decade or more
Climate vs Weather
Which is more difficult to predict?
Typically, climate change is not an absolute prediction of the future, but a plausible implication or trend of what might occur.

• Sun & radiative output
• Earth’s orbit, tilt & wobble
• Surface reflectivity (albedo)
• Human induced changes in greenhouse gases
• Atmospheric aerosols (volcanic sulfates, industrial output)
• Oceans, sea level & currents
• Ice caps growing and melting
• Various Cycles – 100k, 41k, 23k, 11k, etc.
• Which influences come first and which follow?
Climate Influences vs Range of Outcomes
33

34
• We face risks we can’t easily analyze• We have to decide what to believe
o We have built in naïve beliefs, personal experience and anecdotes
o Confirmation bias – look for what we believeo Never left High School; we belong to a tribe and our
beliefs come from the tribe, made up of the believers we trust
o Some believe because they fear the outcome –government interference, taxes, fees
o Science is rational but our beliefs are emotional• Science (and truth) will prevail in the end
Why Do So Many Reasonable People Doubt Science
• Genetically modified organisms
• Fluoridation• Vaccines• Evolution• Diet claims• Fake News• ETC

Gallup Polling – Is it happening and is it important?

36
Cape Town Reservoir1 in 400 year drought

37
Climate or Weather or Both?
Atmospheric Rivers Hit California• Mega storms about every 200
years• Smaller storms can bring 30 to
50% of California’s water supply in 8 to 10 storms• >8” over 3 days = Cat 1 • >12” over 3 days = Cat 2• Etc.
• Prediction capabilities are improving

38
1. Where will the water be?
2. When are we going to get it?
3. How much are we going to get?
4. How much do we need?
5. Where do we need it?
6. What is the quality?
7. What will it cost?
Fundamental Questions:
Water Planning & Climate Change
Key is estimating the inputs & outputs
Rainfall/runoff
Water demand
Desired water quality

39
Water Demands
Utilities faced w/ large range of future climate
projections & how to address uncertainties in planning.
Traditional water planning methods fail to treat
uncertainties, emerging methods being developed

Source: USEPA, http://www.epa.gov/climatechange/science/futureslc_fig1.html
Basis of Projections into the Future
Un
its
Inte
nti
on
ally
Elim
inat
ed
40

Climate Implications for Water in California
Warmer – more evaporation, sublimation and higher demands
Runoff occurs earlier – California loses the effective storage of “snow in the mountains” of somewhere between 10 and 20 million acre-feet (maf)
California now has approximately 1,400 regulated reservoirs, with a total storage capacity of about 42 maf
The largest 10% of these reservoirs have 95% of this capacity; Oroville has a capacity of about 3.5 maf
Depending on the watershed, precipitation may be about the same, a little bit less or a little bit more
41

42
Water Demands
Plan for “contingency” demand (difficult for the environmental community & SWRCB)
Demand management strategies Implement indoor and outdoor conservation
measures Reduce unaccounted for water Reduce urban heat retaining surfaces
Modify/test modeling assumptions Conduct Scenario Planning Minimize impacts of uncertainties
Climate models do not provide absolute predictions –our take-away is what trends could occur and to what degree!

43
Water Supplies
Diversify supply mix = recycling, water transfers, undergroundstorage, desalination, storm water capture, groundwater cleanup
Build in supply buffers Build storage to manage lean years Educate/communicate w/ the public – they are the ones funding
the investments! Synergize efforts w/ others (wastewater is our new supply) Consider & mitigate effects on rates (rates will continue increasing) Monitor trends Expand groundwater spreading capability to capture higher flows Minimize impacts of uncertainties

The Colorado River as an Example
44

Colorado River Supplies
45

Colorado River Supplies
The period 1905-1922, which was used to estimate water production allocated under the Colorado River Compact, had the highest long-term annual flow volume in the 20th century, averaging 16.1 MAF at Lee’s Ferry.
The time series of flow indicates the average annual volume was 12.4 million acre-feet (MAF) from 1895 through 2003
46

Colorado River Supplies for 1255 Years
• 9 droughts lasting 15-20 years• 4 droughts lasting >20 years
Year762
Today
47

48
Colorado River Supplies
Over allocated basic apportionment system - 20th Century was very wet
Tree Ring studies show long periods of droughts Temperature studies indicate that Colorado River
snowpack will be heavily influenced as temperatures increase – water flow yield will be reduced!
7 States depend on the water from the Colorado Heavy Duty Negotiations!

Colorado River Apportionments (Million acre-feet)
Apportionments
Mexico
Upper Basin States
Lower Basin States
1.71
2.8
.3
1.04
3.86
4.4
.84
1.5
..05
49

1922 Colorado River Compact and1944 Treaty Allocations
Upper BasinLower BasinMexico
7.5 mafy7.5 mafy + 1.0 mafy1.5 mafy
Total 17.5 mafy
50

Lake Mead Normal Water BudgetLake Mead Imbalance
Upper Basin Compact Release 8.25 MAF
Tributary Flows 2.75 MAF
Total Inflow 11.0 MAF
Lower Basin Water Use -9.5 MAF
Mexico Delivery -1.5 MAF
Lake Mead Evap/River Losses -1.2 MAF
Total Outflow -12.2 MAF
Imbalance -1.2 MAF
51

8,000
9,000
10,000
11,000
12,000
13,000
14,000
15,000
16,000
17,000
18,000
19,000
20,000
21,000
22,000
23,000
x 1
00
0 a
cre
-fe
et
Lake Mead Storage2000 – 2016, Actual and Projected
Surplus
ShortageElevation 1075
Elevation 1145
52
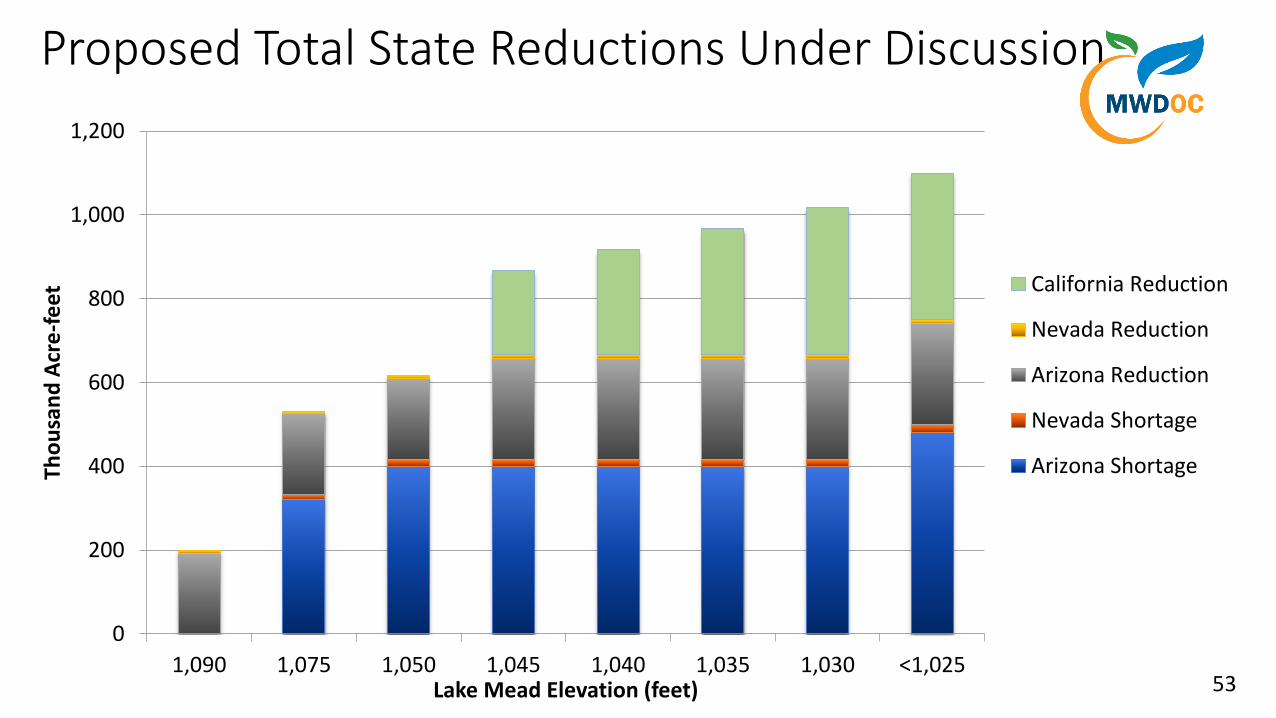
Proposed Total State Reductions Under Discussion
0
200
400
600
800
1,000
1,200
1,090 1,075 1,050 1,045 1,040 1,035 1,030 <1,025
Tho
usa
nd
Acr
e-f
eet
Lake Mead Elevation (feet)
California Reduction
Nevada Reduction
Arizona Reduction
Nevada Shortage
Arizona Shortage
53

Colorado River – Look for Multi-State Settlement for a Drought Contingency Plan
An era of hope -communication, cooperation, and
collaboration
54

The Great Drought and How We Survived
2012 - 2016
55

56
• 5 years?
•11 years?
•17 years?
• The New Normal?
The Great (?) Drought
Lake Mead has dropped over 120 feet

Santa Ana PrecipitationSanta Ana Precipitation
8.06
14.87
3.82
14.57
8.41
29.06
8.51
2.19
9.46 9.88
16.82
21.39
8.27
6.36
4.37
8.838.15
20.66
3.62
Average Rainfall
0
5
10
15
20
25
30
Rai
nfa
ll (I
nch
es)
5 years, 28” of deficit - largest deficit in Localprecipitation since records began in 1908
13 of last 19 years below
average

Santa Ana PrecipitationUpper Colorado River Runoff
6.77 6.69
2.80
6.21 6.42
12.79
9.53
7.61
11.90
10.08
8.77
16.17
4.15
5.80
10.619.85 9.62
11.90
6.36
10.71 MAF
0
2
4
6
8
10
12
14
16
18
2000 2001 2002 2003 2004 2005 2006 2007 2008 2009 2010 2011 2012 2013 2014 2015 2016 2017 2018
Ru
no
ff (
MA
F)
Lake Powell Unregulated Historical Inflow
Runoff MAF Average
14 of last 19 years below
average

Santa Ana PrecipitationNorthern California Runoff
18.9
9.81
14.6
19.31
16.04
18.55
32.09
10.28 10.28
13.02
15.94
25.13
11.8 12.2
7.59.3
17.4
38
9.5
18.3 MAF
0
5
10
15
20
25
30
35
40
2000 2001 2002 2003 2004 2005 2006 2007 2008 2009 2010 2011 2012 2013 2014 2015 2016 2017 2018
Ru
no
ff (
MA
F)
4 River Index Historical Runoff
Runoff MAF Average
13 of last 19 years below
average

MWD 2018 Estimated Water Storage
1.1
1.41.5
1.4
1.8
2.2
1.8
1.1 1.0
1.7
2.4
2.7
2.3
1.2
0.9
1.3
2.5
2.2
0.0
0.5
1.0
1.5
2.0
2.5
3.0
2001 2002 2003 2004 2005 2006 2007 2008 2009 2010 2011 2012 2013 2014 2015 2016 2017 2018
Mill
ion
Acr
e Fe
et
MWD Historical Demand VS Supplies
Total MWD EOY Storage Total MWD Supplies Total MWD Sales
Preliminary Estimate
Almost 2 million acre-feet of storage used in
recent drought

61
How did Southern California withstand the Drought?
1. Prior Investments2. Demand Management
(Conservation)3. Supply Management
(Projects)
The Great California Drought

62
Supplies & Demands in OC
RecycledNon-OCWD GW
Surface Water
MET PurchasesMET or Future Projects
Population Growth
1990 to 2015 2015 to 2040
750,000 317,000
31% 10%
GWRS
Groundwater

63
Past Water Supply was an Essential Component

64
-
1.0
2.0
3.0
4.0
5.0
6.0
7.0
8.0
9.0
10.0
11.0
12.0
13.0
1860 1890 1920 1950 1980 2010
Pop
ula
tio
n (
Mill
ion
s)
LA-CityLA-County
Past Water Supply was an Essential Component
LA AQUEDUCT 1908-1913
$24.5 Million

65
-
1.0
2.0
3.0
4.0
5.0
6.0
7.0
8.0
9.0
10.0
11.0
12.0
13.0
1860 1890 1920 1950 1980 2010
Pop
ula
tio
n (
Mill
ion
s)
LA-CityLA-County
Past Water Supply was an Essential Component
COLORADO RIVER
AQUEDUCT
1928-1941 $220 Million

66
-
1.0
2.0
3.0
4.0
5.0
6.0
7.0
8.0
9.0
10.0
11.0
12.0
13.0
1860 1890 1920 1950 1980 2010
Pop
ula
tio
n (
Mill
ion
s)
LA-CityLA-County
Past Water Supply was an Essential Component
STATE WATER PROJECT
1960-1972 $1.75 Billion

67
-
1.0
2.0
3.0
4.0
5.0
6.0
7.0
8.0
9.0
10.0
11.0
12.0
13.0
1860 1890 1920 1950 1980 2010
Pop
ula
tio
n (
Mill
ion
s)
LA-CityLA-County
Past Water Supply was an Essential Component
DIAMOND VALLEY LAKE
1995-2003 $1.9 Billion

-
1.0
2.0
3.0
4.0
5.0
6.0
7.0
8.0
9.0
10.0
11.0
12.0
13.0
1860 1890 1920 1950 1980 2010
Pop
ula
tio
n (
Mill
ion
s)
LA-CityLA-County
Continuous Proactive Investment$15 Billion over 20 Years
• Water Use Efficiency• Local Projects• Treatment Upgrades• Colorado River
Supplies
68
69
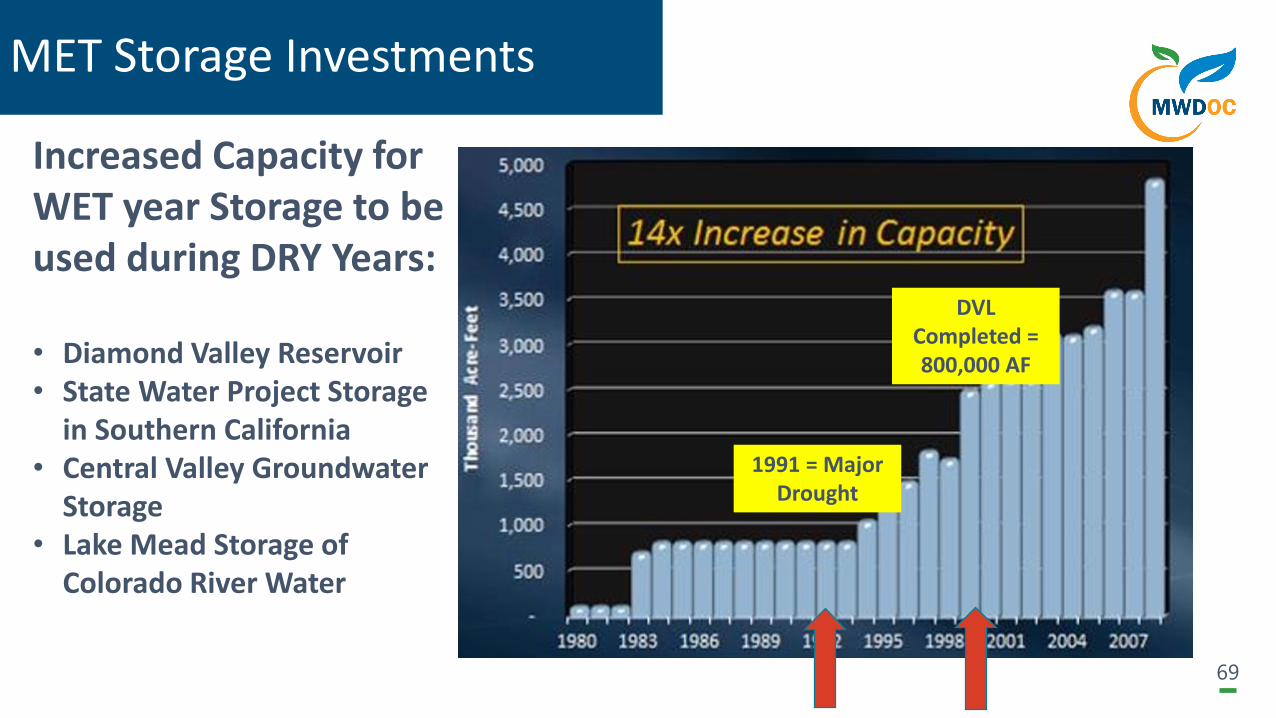
MET Storage Investments
Increased Capacity for WET year Storage to be used during DRY Years:
• Diamond Valley Reservoir• State Water Project Storage
in Southern California• Central Valley Groundwater
Storage• Lake Mead Storage of
Colorado River Water
1991 = Major Drought
DVL Completed = 800,000 AF

70
Local StorageDiamond Valley Lake MathewsLake SkinnerConjunctive Use ProgramsDWR State Project Reservoirs
Central Valley/SWP StorageSan Luis CarryoverSemitropic Arvin-EdisonKern DeltaMojave
CRA StorageDWCV Advance Delivery Lake Mead ICS
MET’s Storage Programs

Use of MET Storage(Living Off Past Investments)
More storage than we had 20
years ago
Use of MET Storage(Living Off Past Investments) Almost 2 million acre-
feet of storage used in recent drought
71

California WaterFix –History Being Made!
72

Local Supplies Groundwater & Recycling
Ocean Desalination (future)
Conservation(Water Use Efficiency)
Colorado River Aqueduct (1941)State
Water Project Entitlement (1972)
Transfers & Storage
Bay Delta Area
25%
25%
50%
Many Related Names
• Peripheral Canal
• Calfed
• BDCP
• Bay Delta Conservation Plan
• WaterFix
• Twin Tunnels
• EcoRestore
• Habitat Conservation Plan
• Natural Communities Conservation Plan
• Co-Equal Goals 73

74
Supports long-termhealth of native fish and wildlife
Habitat restoration~ 30,000 acres in 5 years
Includes broader public funding
• Protects State’s water supplies through Delta system upgrades
• Mitigation
• Includes ~15,600 acres of habitat
• Water contractor funded
• Twin tunnel facilities and mitigation
State’s New ProposalAnnounced April 2015

75
Tunnels
SWP PumpsCVP Pumps
Additional Intakes
Bay Delta RELIABILITY -
$17 Billion
Sacramento River
San Joaquin River
San
Fra
nci
sco
Bay
Habitat Restoration

76

7777
Sustainable Delta
(PPIC)
48” of Sea Level Rise
EcoRestore

0
1
2
3
4
5
6
ExistingRegulations(No Action)
BDCPRegulations
without Tunnels
EarthquakeScenario
NEWBDCP/CA Water
Fix
SWP
-CV
P E
xpo
rts
(mill
ion
AF)
California WaterFix ImpactSoCal Loss of 440,000
Acre Feet without the project
1.5
4.7-5.3
1.2 MAF Less
3.5
4.7
78

Water History – How many Tunnels? How much MET participation?
Options under Discussion1 = MET share in Two Tunnels2 = MET larger share in 1 Tunnel3 = MET larger share in 2 Tunnel
1 2 3
Capital Cost (billions) $4.3 $5.3 $10.8
NEW Supply (thousands of AF) 337 410 840
Cost of NEW Supply (per AF treated in So. Calif.)
$840 $840 $840
Household Cost per month $1.90 $2.40 $4.80
4,500 to 6,000 cfs
each
79
40
’ d
iam
ete
r

Carson Regional Recycling Project by MET
80
Similar to Orange County Water District’s Groundwater Replenishment Project

15 MGD
0-4 MGD
15 MGD
0-11 MGD
18-58 MGD
62-77 MGD
Carson Regional Recycling Project by MET
81

82
Carson IPR ProjectThe Next Proactive Investment
NEW local supply to groundwater basins in Southern California – helps stretch other MET supplies
Source is treated wastewater from LA County
Initial phase = 100 mgd; ultimate up to 150 mgd of NEW drought proof-supplies
On-line 2025 to 2027
Estimated Cost ~$2 - 3 billion
Costs to be spread across the MET service area
Adds another component to MET’s Water Supply Program1. Colorado River2. State Water Project3. Transfers and Exchanges4. Support of Local Supplies by Others5. Local Supplies by MET

Orange County Water Reliability Study
83

84
STATE
END USERS• Homeowner• Business• Water Bills
ORANGE COUNTY
Local Agency
SOUTHERN CALIFORNIAMET/
84
Planning + Investment = Reliability
85
Iterative Collaboration & Exchange at Many Levels:• Information• Data• Analyses• Tools/Modeling• Results/Spin-offs• Funding opportunities• Project Implementation
85

Ingredients for the OC Water Reliability Study 2016
Demands - including population & job growth to 2040
93 historical hydrologies each for the State Water Project, Colorado River & Local
Influence of climate change
Local Projects all over Southern California
Future Projects by MET
Future Projects within OC
With and Without the California WaterFix
Competition for water
Regulatory Actions impacting supplies
Water Conservation/Water Use Efficiency
Consumer Expectations
Earthquakes
Adaptive management! 86

87
MET ProjectsCalifornia WaterFixMET Carson Recycled WaterTransfers & ExchangesDirect Potable ReuseWater Use Efficiency
OC Projects
OCWD basin storage/MET purchasesWater transfers and bankingAdditional RecyclingDirect Potable Reuse
Emergency NeedsSupply of Emergency Water
following Earthquakes
Potential Projects to Eliminate Shortages
Which of these are
part of our NEXT
investments and WHEN
are they needed?
Over versus Under
Investment

OC Water Reliability Study Goal
88
To develop common information regarding existing and future water demands, supplies, costs and potential risks to regional and Orange County water supply reliability under a wide range of possible scenarios and ultimately to improve OC’s reliability
Supply Reliability System Reliability (for emergencies)
88

Major Earthquake Faults in So. Cal.
San Andreas Fault
San Jacinto Fault
Santa Susana Fault
Whittier Fault
Sierra Madre –Cucamonga Fault
Elsinore Fault 89
West Branch
East BranchSWP

90
Balancing of Issues
Over Investing
Under Performing
90
91
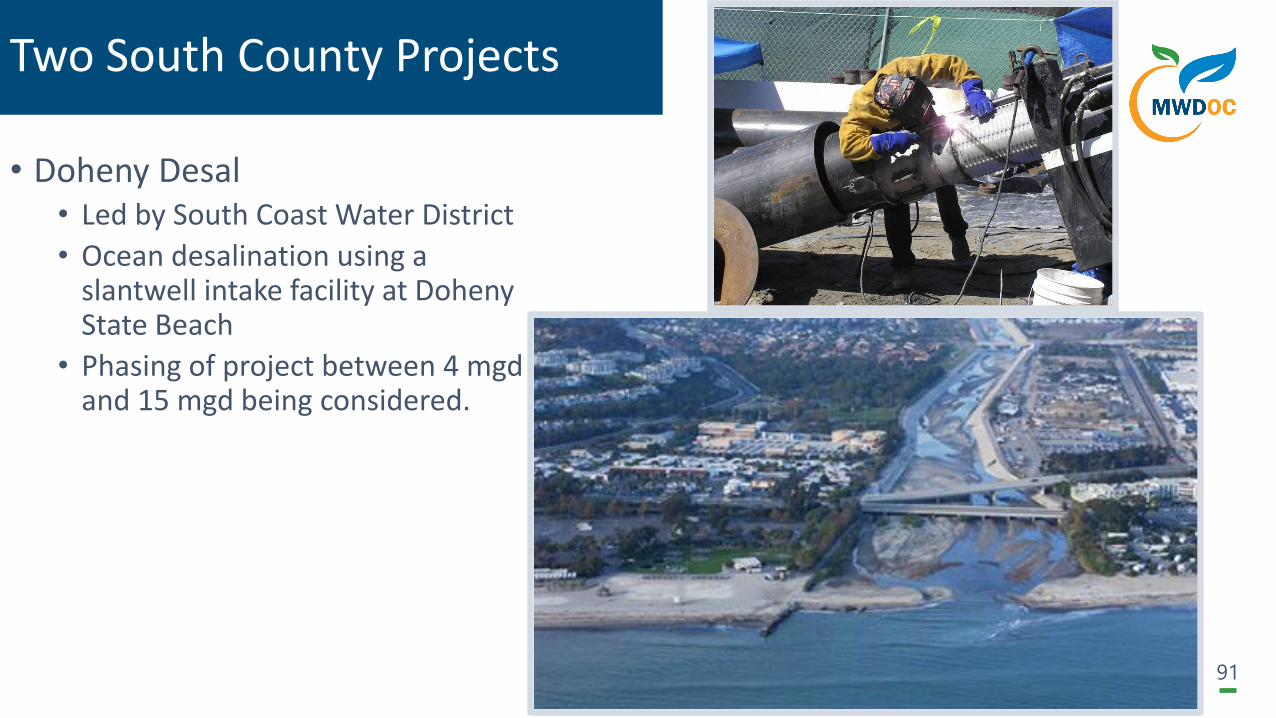
• Doheny Desal• Led by South Coast Water District
• Ocean desalination using a slantwell intake facility at Doheny State Beach
• Phasing of project between 4 mgd and 15 mgd being considered.
Two South County Projects

92
• Led by Santa Margarita Water District
• The initial project involves rubber dams to capture low flows
• Expansion projects will add recycled recharge at the dams to increase groundwater in storage
Two South County Projects
San Juan Watershed Project
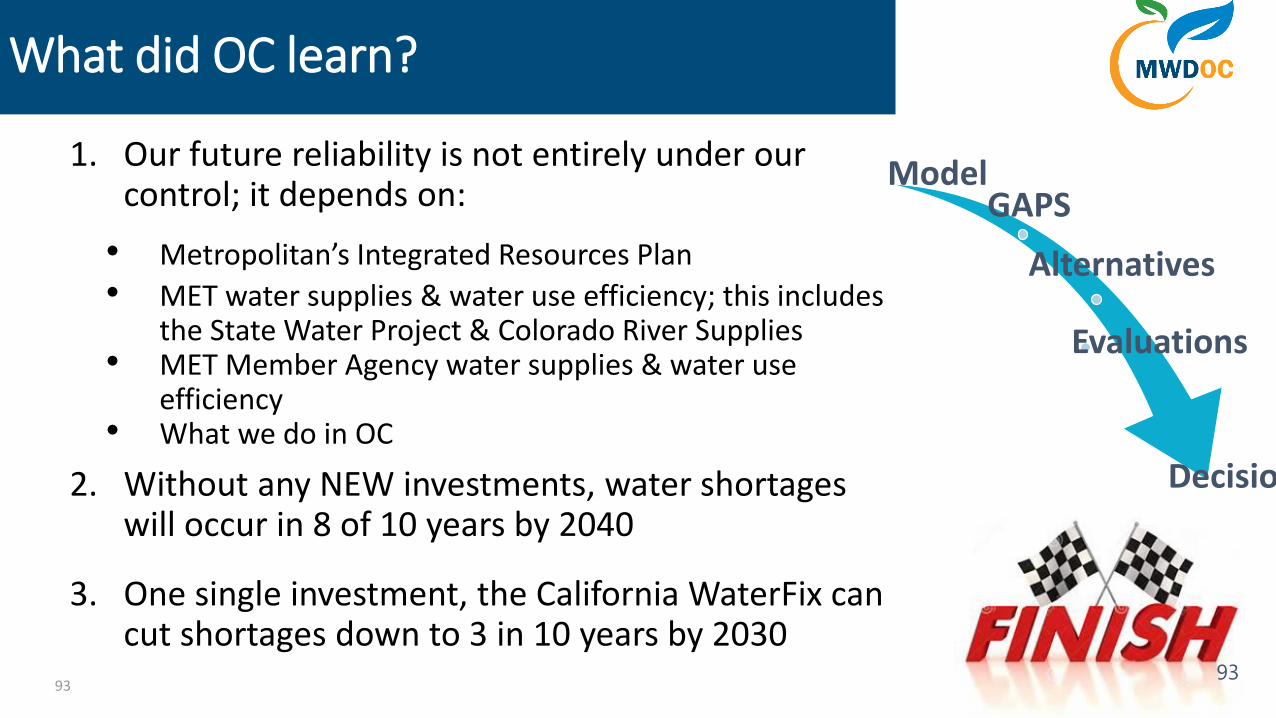
What did OC learn?
93
1. Our future reliability is not entirely under our control; it depends on:
• Metropolitan’s Integrated Resources Plan
• MET water supplies & water use efficiency; this includes the State Water Project & Colorado River Supplies
• MET Member Agency water supplies & water use efficiency
• What we do in OC
2. Without any NEW investments, water shortages will occur in 8 of 10 years by 2040
3. One single investment, the California WaterFix can cut shortages down to 3 in 10 years by 2030
ModelGAPS
Alternatives
Evaluations
Decisions
93

What did OC learn?
94
4. South Orange County needs to develop NEW supplies to improve supply (drought) and system (emergency) reliability
• NEW local projects will cost more than imported water, but overall melded costs to agencies remain competitive
5. Remaining water shortages in Brea/La Habra and OCWD Basin areas were manageable
6. Adaptive Management is key to ensure that OC maintains acceptable supply reliability without overinvesting at the local level
94

OC Water Reliability Study Process
95
Highly collaborative process
Plausible planning scenarios were analyzedGrowth
Climate/hydrologic conditions
Demands synthesized to drought decline plus “bounce back”
MET & MET Member Agency IRP projects consideredState Water Project supplies with and without the California WaterFix
Colorado River
Supplies & use of MET storage accounts
Decision-making left to local agencies
95

96
300,000 AF162,000 AF
100,000 AF 168,000 AFCarson IPR
Local Projects
Remaining Shortages Reliability Supplies

MET Reliability Under Different Portfolios – 2040
97
-
200,000
400,000
600,000
800,000
1,000,000
1,200,000
1,400,000
1,600,000
1,800,000
0% 10% 20% 30% 40% 50% 60% 70% 80% 90% 100%
Existing Port A Port B Port C
Port F Port E Port D
Portfolios D, E & F are Fully Reliable & are plotted on the bottom line
Probability of Shortage
Sho
rtag
e (A
FY)
Direction of MORE NEW Projects
Portfolio B Selected for OC
Modeling
Direction of Climate Impacts
97

2018 Update for Year 2040 for MET Service Area
98
DRAFTWithout
NEW Investments

1. California WaterFix & Governor Brown’s Remaining Term
2. MET’s Carson IPR Project, Go/No go
3. MET Member Agency Projects, Go/No go
4. What happens if/when we reach the Lake Mead Trigger
Elevation?
5. Policy issues at MET (water rates, LRP funding, groundwater
replenishment, avoid stranding assets)
6. Revised or updated biological opinions on various specifies of
fish could result in significant supply reductions, primarily on
the SWP.
Upcoming High Impact Issues to Reliability
99
HighImpactIssues
99

Adaptive Management is Recommended
100
Next several years are keyPrepare as if WaterFix will NOT happenMonitor the high impact issuesMay require a change in course or redirection depending on outcome
Adaptive Management is key
100

1. Currently monitoring “High Impact or Uncertainty Issues”
2. Key OC projects:
a. IRWD & four agencies - $100 M, 30 MGD Baker Treatment Plant
b. OCWD proposed expansion of the Groundwater Replenishment System from 100 to 130 MGD
c. Under Evaluation
• Doheny Ocean Desal Project
• Poseidon Ocean Desal Project
• San Juan Watershed Project
• Emergency supplies to South Orange County
Outcomes from the Study Effort
101101

Parting Water Observations
We survived very tough years due to investments made - but the drought will be back!
There are several paths to reliability
California Water Fix & other MET investments
Local Investments, including Direct Potable Reuse
Demand management – use less water for landscapes
All of the above (diversification)
Rates will increase to fund reliability investments
Need to understand and educate consumer EXPECTATIONS
Need support in the Governor’s office
Stay tuned and support the California WaterFix
• Reliability• Resilience• Sustainability
102
Observations for Southern Calif.
Update and strengthen the Integrated Resources Planning process – it provides a path to reliability
The need for investments will continue
No single silver bullet – diversify supplies and use water efficiently
Southern California has always done a good job at making the hard decisions – we expect to continue this track record.
103103

Observations for OC
OCWD has a well managed basin
Doheny Desal and the San Juan Watershed Projects are key local projects being considered in SOC; these provide both supply and system improvements.
Continuing WUE and recycling investments is also key.
An increase of the Emergency Services Program, which moves groundwater from the OCWD basin to SOC, is critical for SOC to deal with emergency outages of the MET system for up to 60 days
104104

105
Engage in water policy discussions
Support the Bay-Delta WaterFix
Support water use efficiency measures and new supply development efforts in your community
Stress the “value” of water, not the price!
Reliable water underpins our economy and way of life for you and future generations
What you can do!
address18700 Ward Street, Fountain Valley CA 92708
websitewww.mwdoc.com
main office(714) 963-3058
106
Contact Us or Your Local Water Provider
Karl W. SeckelAssistant Manager/District Engineer
714-593-5024