oracle diagnostics pack for oracle database · built into the core database engine and oracle...
TRANSCRIPT
ORACLE DIAGNOSTICS PACK FOR ORACLE DATABASE
ORACLE WHITEPAPER

ORACL E D AT A S H E E T
F E AT UR E S
• Automatic Performance Diagnostics
• Real-Time Performance Diagnostics
• Automatic Workload Repository (AWR)
• AWR Warehouse
• Comparing Performance Periods
• Active Session History (ASH)
• Exadata Management
• Comprehensive System Monitoring and Notification
K E Y B EN E F I T S
• Automatic performance diagnostics simplifies diagnosing performance issues for administrators and ensures quicker resolution of performance bottlenecks. Performance for all pages
Oracle Diagnostics Pack For Oracle Database
ORACLE DIAGNOSTICS PACK FOR ORACLE DATABASE
Oracle Enterprise Manager is Oracle’s integrated enterprise IT management
product line, and provides the industry’s first complete cloud
management solution. Oracle Diagnostics Pack offers a comprehensive set of
real time and automatic performance diagnostics and monitoring functionality
built into the core database engine and Oracle Enterprise Manager. Whether
you are managing one or many databases, Oracle Diagnostics Pack offers a
complete, cost effective, and easy to use solution for managing t
performance of your Oracle Database environment. When used with
Enterprise Manager, Oracle Diagnostics Pack additionally provides
enterprise-wide performance and availability reporting, a centralized
performance repository, and valuable cross-system per
significantly simplifying the task of managing large sets of databases
Automatic Performance Diagnostics
Diagnosing a slowly performing or a hung system is a time consuming task and often
the activity where database administrators (DBA) spend most of their time. A number of
third party tuning tools are available in the market but seldom do these tools provide an
accurate root cause analysis. Instead the DBA has to manually look through multiple
charts trying to guess the root cause of the problem. Oracle Diagnostics Pack takes the
guesswork out of performance diagnostics. It includes a performance
engine built right into the Oracle Database kernel, called the Automatic Database
Diagnostic Monitor (ADDM) that completely simplifies the complex and arduous task of
diagnosing performance problems for database and IT administrators.
ADDM starts its analysis by focusing on the activities that the database is spending
most time on and then drills down through a sophisticated problem classification tree to
determine the root causes of problems. ADDM’s ability to discover the actual cause
behind performance problems, rather than just reporting symptoms, is just one of the
several factors that make it much superior to any other Oracle Database performance
management tool or utility. Each ADDM finding has an associated impact and benefit
measure to enable prioritized handling of the most critical issues. To better understand
the impact of the findings over time, each finding has a descriptive name that allows the
application of filters and easy searching, and a link to the previous occurrences of the
finding in the last 24 hours. To enable performance diagnostics for pluggable databases
(PDB) in Oracle Database 12c, ADDM lists the affected PDB along with the details of
the finding for quick and easy diagnosis.
Diagnostics Pack For Oracle
ORACLE DIAGNOSTICS PACK FOR ORACLE DATABASE
Oracle Enterprise Manager is Oracle’s integrated enterprise IT management
product line, and provides the industry’s first complete cloud lifecycle
Oracle Diagnostics Pack offers a comprehensive set of
e diagnostics and monitoring functionality
built into the core database engine and Oracle Enterprise Manager. Whether
you are managing one or many databases, Oracle Diagnostics Pack offers a
complete, cost effective, and easy to use solution for managing the
performance of your Oracle Database environment. When used with
Enterprise Manager, Oracle Diagnostics Pack additionally provides
wide performance and availability reporting, a centralized
system performance aggregation,
significantly simplifying the task of managing large sets of databases
Diagnosing a slowly performing or a hung system is a time consuming task and often
the activity where database administrators (DBA) spend most of their time. A number of
party tuning tools are available in the market but seldom do these tools provide an
accurate root cause analysis. Instead the DBA has to manually look through multiple
charts trying to guess the root cause of the problem. Oracle Diagnostics Pack takes the
guesswork out of performance diagnostics. It includes a performance-diagnostics
engine built right into the Oracle Database kernel, called the Automatic Database
Diagnostic Monitor (ADDM) that completely simplifies the complex and arduous task of
g performance problems for database and IT administrators.
ADDM starts its analysis by focusing on the activities that the database is spending
most time on and then drills down through a sophisticated problem classification tree to
es of problems. ADDM’s ability to discover the actual cause
behind performance problems, rather than just reporting symptoms, is just one of the
several factors that make it much superior to any other Oracle Database performance
Each ADDM finding has an associated impact and benefit
measure to enable prioritized handling of the most critical issues. To better understand
the impact of the findings over time, each finding has a descriptive name that allows the
rs and easy searching, and a link to the previous occurrences of the
finding in the last 24 hours. To enable performance diagnostics for pluggable databases
(PDB) in Oracle Database 12c, ADDM lists the affected PDB along with the details of
2 | ORACLE DIAGNOSTICS PACK FOR ORACLE DATABASE
K E Y B EN E F I T S
• Ability to perform real time performance analysis
K E Y B EN E F I T S
• Automatically maintained workload history facilitates historical performance analysis.
For Oracle Real Application Cluster (RAC) environments, ADDM has a special mode for
cluster-wide performance analysis. It performs database-wide analysis of global
resources, such as high-load SQL, global cache interconnect traf
issues, skew in instance response times, I/O capacity, etc.
Real-Time Performance Diagnostics
Diagnosing extremely slow databases or hung databases have
most database administrators. With no way to connect to the hung database the
administrator is often left with no option but to bounce the entire system. This restart of
the database not only causes an unplanned outage but also gets rid of diagnostic
information collected before the hung state. Without a proper
cause of the hang, the database application incurs the risk that the problem may recur in
the near future.
Real-Time ADDM provides an innovative way to analyze problems in unresponsive or
hung databases. Using a normal and a diagnostic mode connection Real
runs through a set of predefined criteria to analyze the current performance and helps
the DBA to resolve deadlocks, hangs, shared pool contentions and many other
exception situations that today forces the administrator to bounce their databases,
causing significant loss of revenue. Real-Time ADDM is the only tool available in the
market today that can log into a hung database, analyze the problem and recommend a
resolution.
Oracle Database 12c provides an enhanced version of the Real
This enhanced Real Time ADDM proactively detects transient performance issues by
running in the database automatically every 3 seconds. It uses in
data to diagnose any performance spikes in CPU, memory, I/O etc. utilization. With this
feature, Oracle Database 12c can proactively inform an administrator a performance
issue and its associated root cause even when the system is not actively monitored.
Automatic Workload Repository (AWR)
Oracle Diagnostics Pack includes a built in repository within Oracle Database, called
Automatic Workload Repository (AWR), which contains operational statistics captured
into snapshots at regular intervals about that particular database and other relevant
information. AWR is designed to be lightweight and to automatically manage its use of
storage space, ensuring that it does not put additional management burden on
administrators.
AWR forms the foundation for all the self-management functionality of Oracle Databas
It is the source of information that gives the database a historical perspective on how it
is being used and enables it to make decisions that are accurate and specifically tailored
for the environment that system is operating in. AWR also supports the
performance baselines. A moving window baseline of 8 days is available out
for helping compare performance to the previous week and can be customized if
needed. These AWR Baselines can then be used for subsequent comparisons of
current system performance to the baseline period to identify performance divergences
and their root-causes. The AWR report generated to analyze a period of poor
performance is really useful to look at the overall performance of the database and is
the go-to tool for most database administrators.
O R AC L E D AT A S H E E T
For Oracle Real Application Cluster (RAC) environments, ADDM has a special mode for
wide analysis of global
load SQL, global cache interconnect traffic, network latency
hung databases have been a big challenge for
the hung database the
administrator is often left with no option but to bounce the entire system. This restart of
the database not only causes an unplanned outage but also gets rid of diagnostic
information collected before the hung state. Without a proper mechanism to find the root
cause of the hang, the database application incurs the risk that the problem may recur in
Time ADDM provides an innovative way to analyze problems in unresponsive or
agnostic mode connection Real-Time ADDM
runs through a set of predefined criteria to analyze the current performance and helps
the DBA to resolve deadlocks, hangs, shared pool contentions and many other
tor to bounce their databases,
Time ADDM is the only tool available in the
market today that can log into a hung database, analyze the problem and recommend a
rsion of the Real-Time ADDM capability.
This enhanced Real Time ADDM proactively detects transient performance issues by
running in the database automatically every 3 seconds. It uses in-memory performance
mory, I/O etc. utilization. With this
feature, Oracle Database 12c can proactively inform an administrator a performance
issue and its associated root cause even when the system is not actively monitored.
Diagnostics Pack includes a built in repository within Oracle Database, called
Automatic Workload Repository (AWR), which contains operational statistics captured
into snapshots at regular intervals about that particular database and other relevant
tion. AWR is designed to be lightweight and to automatically manage its use of
storage space, ensuring that it does not put additional management burden on
management functionality of Oracle Database.
It is the source of information that gives the database a historical perspective on how it
is being used and enables it to make decisions that are accurate and specifically tailored
for the environment that system is operating in. AWR also supports the creation of
performance baselines. A moving window baseline of 8 days is available out-of-the-box
for helping compare performance to the previous week and can be customized if
needed. These AWR Baselines can then be used for subsequent comparisons of
rrent system performance to the baseline period to identify performance divergences
causes. The AWR report generated to analyze a period of poor
performance is really useful to look at the overall performance of the database and is

3 | ORACLE DIAGNOSTICS PACK FOR ORACLE DATABASE
K E Y B EN E F I T S
• Enhanced ability to proactively detect and identify the root cause of performance issues
Starting with Oracle Database 12.2, Automatic Workload Repository (AWR)
PDB-level snapshots in a Multitenant environment. This feature enables
performance diagnosis and tuning in a Multitenant environment. The AWR data
provides container-specific data that represents individual PDB’s contribution to the
whole database instance; therefore this data is useful for both the CDB and the PDB
administrators. AWR Multitenant support allows reporting the top SQ
helps a PDB administrator tune his specific container.
AWR in Oracle Database 12c also saves Real-Time SQL Monitoring, Database
Operations Monitoring and Real-Time ADDM reports inside the database, which allows
the administrator to go back in time and review a monitored execution of a query in the
past. This is very useful in determining performance inconsistencies across executions
of a particular SQL query.
AWR Warehouse
Beyond ongoing performance management, enterprises are also interes
their database performance data over a longer time periods for tasks such as capacity
planning or identifying trends or patterns affecting performance in their mission critical
databases. Oracle Enterprise Manager now provides the ability
performance data in from Automatic Workload Repository across all enterprise
databases into a central performance warehouse called AWR Warehouse.
AWR Warehouse allows DBAs and capacity planners to get answers to questions such
as what was the performance of the database this quarter compared the same quarter
last year or whether database servers in the next 6 months could support the growth in
resource utilization of the databases running on the servers. Enterprise Manager
completely automates the extraction, transfer and load of the performance data into the
AWR warehouse so that the critical source databases can keep operating at optimal
performance without incurring additional storage overhead. And, the DBAs now have all
the performance data they need for analysis at their fingertips for all their critical
databases for all time.
Active Session History (ASH)
A key component of AWR is Active Session History or ASH. ASH samples the current
state of all active sessions every second and stores it in memory. The data collected in
memory can be accessed by a V$ view. This sampled data is also pushed into AWR
every hour for the purposes of performance diagnostics. Like AWR, ASH is also RAC
aware and the information obtained on session activity in the cluster wait class gives
visibility into potential RAC-specific issues. ASH has also been extended to run on
standby databases to assist in analysis of Oracle Data Guard performance.
The in-memory ASH data can be used to understand the database worklo
proactively diagnose any transient performance issue that occurs for a very short
duration. To enable proactive diagnosis of database performance Oracle Enterprise
Manager includes ASH Analytics, a new tool to explore the ASH data that allow
administrator to rollup, drilldown, and slice or dice performance data across various
performance dimensions. With the ability to create filters on various dimensions,
O R AC L E D AT A S H E E T
Automatic Workload Repository (AWR) supports
ultitenant environment. This feature enables better
ment. The AWR data
specific data that represents individual PDB’s contribution to the
whole database instance; therefore this data is useful for both the CDB and the PDB
the top SQL per PDB which
Time SQL Monitoring, Database
Time ADDM reports inside the database, which allows
in time and review a monitored execution of a query in the
past. This is very useful in determining performance inconsistencies across executions
Beyond ongoing performance management, enterprises are also interested in analyzing
their database performance data over a longer time periods for tasks such as capacity
planning or identifying trends or patterns affecting performance in their mission critical
databases. Oracle Enterprise Manager now provides the ability to transfer the
performance data in from Automatic Workload Repository across all enterprise
databases into a central performance warehouse called AWR Warehouse.
AWR Warehouse allows DBAs and capacity planners to get answers to questions such
he performance of the database this quarter compared the same quarter
last year or whether database servers in the next 6 months could support the growth in
resource utilization of the databases running on the servers. Enterprise Manager
es the extraction, transfer and load of the performance data into the
AWR warehouse so that the critical source databases can keep operating at optimal
performance without incurring additional storage overhead. And, the DBAs now have all
ta they need for analysis at their fingertips for all their critical
A key component of AWR is Active Session History or ASH. ASH samples the current
it in memory. The data collected in
memory can be accessed by a V$ view. This sampled data is also pushed into AWR
every hour for the purposes of performance diagnostics. Like AWR, ASH is also RAC-
the cluster wait class gives
specific issues. ASH has also been extended to run on
standby databases to assist in analysis of Oracle Data Guard performance.
memory ASH data can be used to understand the database workload profile and
proactively diagnose any transient performance issue that occurs for a very short
duration. To enable proactive diagnosis of database performance Oracle Enterprise
Manager includes ASH Analytics, a new tool to explore the ASH data that allows the
administrator to rollup, drilldown, and slice or dice performance data across various
performance dimensions. With the ability to create filters on various dimensions,
4 | ORACLE DIAGNOSTICS PACK FOR ORACLE DATABASE
KE Y B EN E F I T S
• Enhanced Comprehensive system monitoring and event notification reduce management cost and deliver better quality of service.
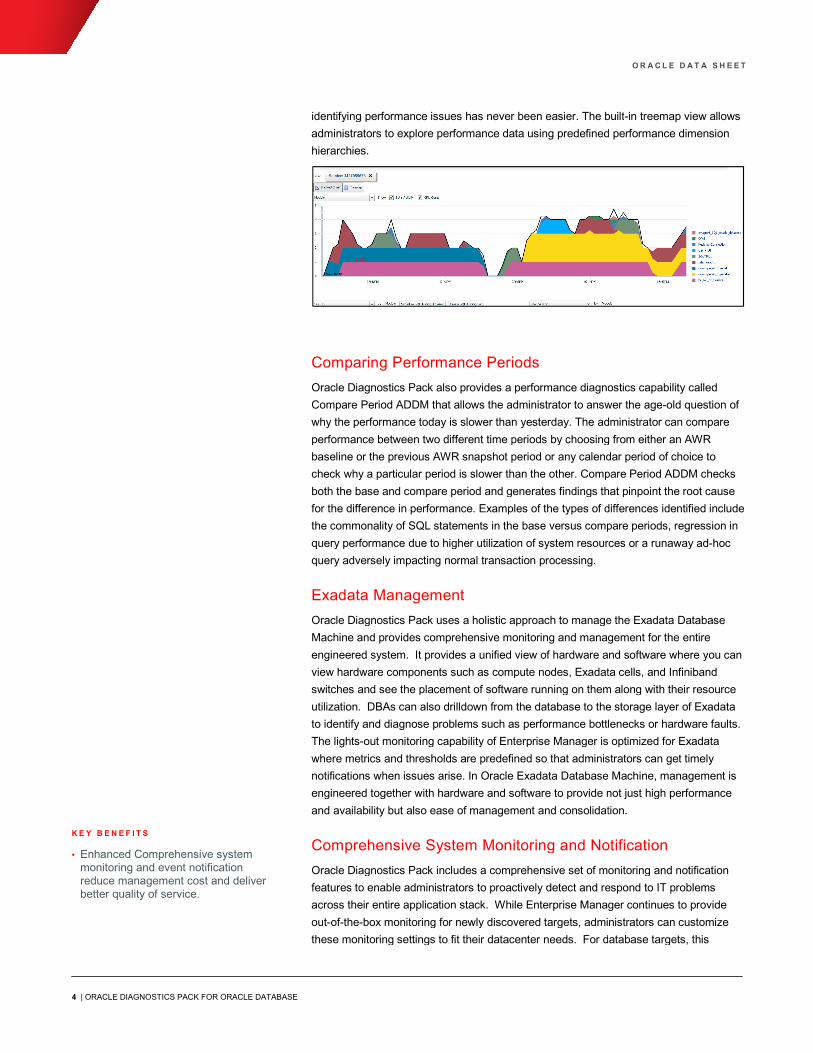
identifying performance issues has never been easier. The built
administrators to explore performance data using predefined performance dimension
hierarchies.
Comparing Performance Periods
Oracle Diagnostics Pack also provides a performance diagnostics capability called
Compare Period ADDM that allows the administrator to answer the age
why the performance today is slower than yesterday. The administrator can compare
performance between two different time periods by choosing from either an AWR
baseline or the previous AWR snapshot period or any calendar period of choice to
check why a particular period is slower than the other. Compare Period ADDM checks
both the base and compare period and generates findings that pinpoint the root cause
for the difference in performance. Examples of the types of differences identified include
the commonality of SQL statements in the base versus compare periods, regression in
query performance due to higher utilization of system resources or a runaway ad
query adversely impacting normal transaction processing.
Exadata Management
Oracle Diagnostics Pack uses a holistic approach to manage the Exadata Database
Machine and provides comprehensive monitoring and management for the entire
engineered system. It provides a unified view of hardware and software wher
view hardware components such as compute nodes, Exadata cells, and Infiniband
switches and see the placement of software running on them along with their resource
utilization. DBAs can also drilldown from the database to the storage layer of Exa
to identify and diagnose problems such as performance bottlenecks or hardware faults.
The lights-out monitoring capability of Enterprise Manager is optimized for Exadata
where metrics and thresholds are predefined so that administrators can get timel
notifications when issues arise. In Oracle Exadata Database Machine, management is
engineered together with hardware and software to provide not just high performance
and availability but also ease of management and consolidation.
Comprehensive System Monitoring and Notification
Oracle Diagnostics Pack includes a comprehensive set of monitoring and notification
features to enable administrators to proactively detect and respond to IT problems
across their entire application stack. While Enterprise Manager continues to provide
out-of-the-box monitoring for newly discovered targets, administrators can customize
these monitoring settings to fit their datacenter needs. For database targets, this
O R AC L E D AT A S H E E T
identifying performance issues has never been easier. The built-in treemap view allows
administrators to explore performance data using predefined performance dimension
Oracle Diagnostics Pack also provides a performance diagnostics capability called
administrator to answer the age-old question of
why the performance today is slower than yesterday. The administrator can compare
performance between two different time periods by choosing from either an AWR
any calendar period of choice to
check why a particular period is slower than the other. Compare Period ADDM checks
both the base and compare period and generates findings that pinpoint the root cause
s of differences identified include
the commonality of SQL statements in the base versus compare periods, regression in
query performance due to higher utilization of system resources or a runaway ad-hoc
Oracle Diagnostics Pack uses a holistic approach to manage the Exadata Database
Machine and provides comprehensive monitoring and management for the entire
engineered system. It provides a unified view of hardware and software where you can
view hardware components such as compute nodes, Exadata cells, and Infiniband
switches and see the placement of software running on them along with their resource
utilization. DBAs can also drilldown from the database to the storage layer of Exadata
to identify and diagnose problems such as performance bottlenecks or hardware faults.
out monitoring capability of Enterprise Manager is optimized for Exadata
where metrics and thresholds are predefined so that administrators can get timely
notifications when issues arise. In Oracle Exadata Database Machine, management is
engineered together with hardware and software to provide not just high performance
and availability but also ease of management and consolidation.
Monitoring and Notification
Oracle Diagnostics Pack includes a comprehensive set of monitoring and notification
features to enable administrators to proactively detect and respond to IT problems
ger continues to provide
box monitoring for newly discovered targets, administrators can customize
these monitoring settings to fit their datacenter needs. For database targets, this
5 | ORACLE DIAGNOSTICS PACK FOR ORACLE DATABASE
CONT A C T U S
For more information about [insert product name], visit oracle.com or call +1.800.ORACLE1 to speak to
an Oracle representative.
CON N EC T W I T H U S
blogs.oracle.com/oracle
facebook.com/oracle
twitter.com/oracle
oracle.com
Copyright © 201contents hereof are subject to change without notice. Thiswarranties or conditions, whether expressed orally or implied in law, including implied warranties and conditions of merchantfitness for a particular purpose. We specifically formed either directly or means, electronic or mechanical, for an Oracle and Java are registered trademarks of Oracle and/or its affiliates. Other names may be trademarks of their respective Intel and Intel Xeon are trademarks or registered trademarks of Intel Care trademarks or registered trademarks of SPARC International, Inc. AMD, Opteron, the AMD logo, and the AMD Opteron logo aretrademarks or registered trademarks of Advanced Micro Devices. UNIX is
includes the use of adaptive thresholds which can automatical
unusual values of performance metrics based on the database's own performance
history. For other target types, easy access to a target's metric history is provided,
enabling administrators to determine appropriate threshold value
of typical metric values. If there are conditions specific to the datacenter those needs to
be monitored, administrators can define new metrics for any monitored target using
metric extensions. If an alert has a well-known remediation solution, then administrators
can setup corrective action scripts that will automatically execute and resolve the alert
when it is detected, thereby minimizing the need for manual intervention. In addition,
alert history is also easily accessible to enable administrators to see what actions have
been taken in previous occurrences of the alert.
The desired monitoring settings for a target can be defined in a monitoring template, one
template per target type. When a set of monitoring templates for differe
are bundled together into a template collection and associated with an administration
group, then the deployment of monitoring settings across targets is fully automated by
Enterprise Manager. Specifically, when a target is added to an adm
monitoring settings associated with the group are automatically applied to the target,
thereby streamlining and simplifying the process of monitoring setup for targets.
Once monitoring is in place and events are detected and raised o
notifications for these events can be sent to the appropriate administrators. Notifications
include email / page notifications, the execution of custom scripts and PL/SQL
procedures, and the sending of SNMP traps. In addition, managem
also be used to open helpdesk tickets for incidents (based on important events) and/or
send event information to other third party management systems. Finally, to support
planned maintenance periods on targets, a blackout capability is p
administrators to temporarily suspend monitoring of targets and prevent false alerts from
being raised during the maintenance period.
CONT A C T U S
For more information about [insert product name], visit oracle.com or call +1.800.ORACLE1 to speak to
an Oracle representative.
Copyright © 2016, Oracle and/or its affiliates. All rights reserved. This document is provided for information purposes only, and the contents hereof are subject to change without notice. This document is not warranted to be errorwarranties or conditions, whether expressed orally or implied in law, including implied warranties and conditions of merchantfitness for a particular purpose. We specifically disclaim any liability with respect to this document, and no contractual obligations are formed either directly or indirectly by this document. This document may not be reproduced or transmitted in any form or by any means, electronic or mechanical, for any purpose, without our prior written permission.
Oracle and Java are registered trademarks of Oracle and/or its affiliates. Other names may be trademarks of their respective
Intel and Intel Xeon are trademarks or registered trademarks of Intel Corporation. All SPARC trademarks are used under license and are trademarks or registered trademarks of SPARC International, Inc. AMD, Opteron, the AMD logo, and the AMD Opteron logo aretrademarks or registered trademarks of Advanced Micro Devices. UNIX is a registered trademark of The Open Group.
O R AC L E D AT A S H E E T
includes the use of adaptive thresholds which can automatically alert on statistically
unusual values of performance metrics based on the database's own performance
history. For other target types, easy access to a target's metric history is provided,
enabling administrators to determine appropriate threshold values based on the range
of typical metric values. If there are conditions specific to the datacenter those needs to
be monitored, administrators can define new metrics for any monitored target using
solution, then administrators
can setup corrective action scripts that will automatically execute and resolve the alert
when it is detected, thereby minimizing the need for manual intervention. In addition,
le administrators to see what actions have
The desired monitoring settings for a target can be defined in a monitoring template, one
template per target type. When a set of monitoring templates for different target types
are bundled together into a template collection and associated with an administration
group, then the deployment of monitoring settings across targets is fully automated by
Enterprise Manager. Specifically, when a target is added to an administration group, the
monitoring settings associated with the group are automatically applied to the target,
thereby streamlining and simplifying the process of monitoring setup for targets.
Once monitoring is in place and events are detected and raised on monitored targets,
notifications for these events can be sent to the appropriate administrators. Notifications
include email / page notifications, the execution of custom scripts and PL/SQL
procedures, and the sending of SNMP traps. In addition, management connectors can
also be used to open helpdesk tickets for incidents (based on important events) and/or
send event information to other third party management systems. Finally, to support
planned maintenance periods on targets, a blackout capability is provided to enable
administrators to temporarily suspend monitoring of targets and prevent false alerts from
For more information about [insert product name], visit oracle.com or call +1.800.ORACLE1 to speak to
, Oracle and/or its affiliates. All rights reserved. This document is provided for information purposes only, and the document is not warranted to be error-free, nor subject to any other
warranties or conditions, whether expressed orally or implied in law, including implied warranties and conditions of merchantability or disclaim any liability with respect to this document, and no contractual obligations are
by this document. This document may not be reproduced or transmitted in any form or by any
Oracle and Java are registered trademarks of Oracle and/or its affiliates. Other names may be trademarks of their respective owners.
orporation. All SPARC trademarks are used under license and are trademarks or registered trademarks of SPARC International, Inc. AMD, Opteron, the AMD logo, and the AMD Opteron logo are
a registered trademark of The Open Group. 0115

Das Karlsruher Systemhaus HUNKLER wurde 1988 erster offizieller Part-
ner von Oracle in Deutschland. Ein Team von rund 20 Mitarbeitern unter-
stützt Kunden aus Industrie, öffentlicher Verwaltung, Gesundheits- und
Finanzwesen mit Beratung, Lösungsentwicklung und Managed Services.
Im Fokus von HUNKLER stehen leistungsfähige, wirtschaftliche Infrastrukturen für
Oracle-datenbanken mit den Schwerpunkten Hochverfügbarkeit, Ausfallsicherheit
und Zero Downtime Migration. Die integrierten Komplettlösungen der Produktfa-
milie Oracle Engineered Systems sowie der Datenbank-/Anwendungsbetrieb in der
Oracle Cloud sind weitere Themenfelder, die das Unternehmen umfassend abdeckt.
ÜBER HUNKLER
Hauptsitz Karlsruhe
Bannwaldallee 32, 76185 Karlsruhe
Tel. 0721-490 16-0, Fax 0721-490 16-29
Geschäftsstelle Bodensee
Fritz-Reichle-Ring 6a
78315 Radolfzell
Tel. 07732-939 14-00, Fax 07732-939 14-04
[email protected], www.hunkler.de