oracle bi applications: getting more out … practices using data ... 1. follow the bi apps...
TRANSCRIPT

Thursday, May 9th, 2013
Jamie AdamsAST Corporation
Senior ConsultantBusiness Intelligence
ORACLE BI APPLICATIONS: GETTINGMORE OUT OF YOUR APPLICATIONS

Agenda
• Today’s Environment• Leveraging Business Intelligence with ERPs • What’s Available?• Tips on Implementing• Having a Look at BI Apps• Wrap-Up
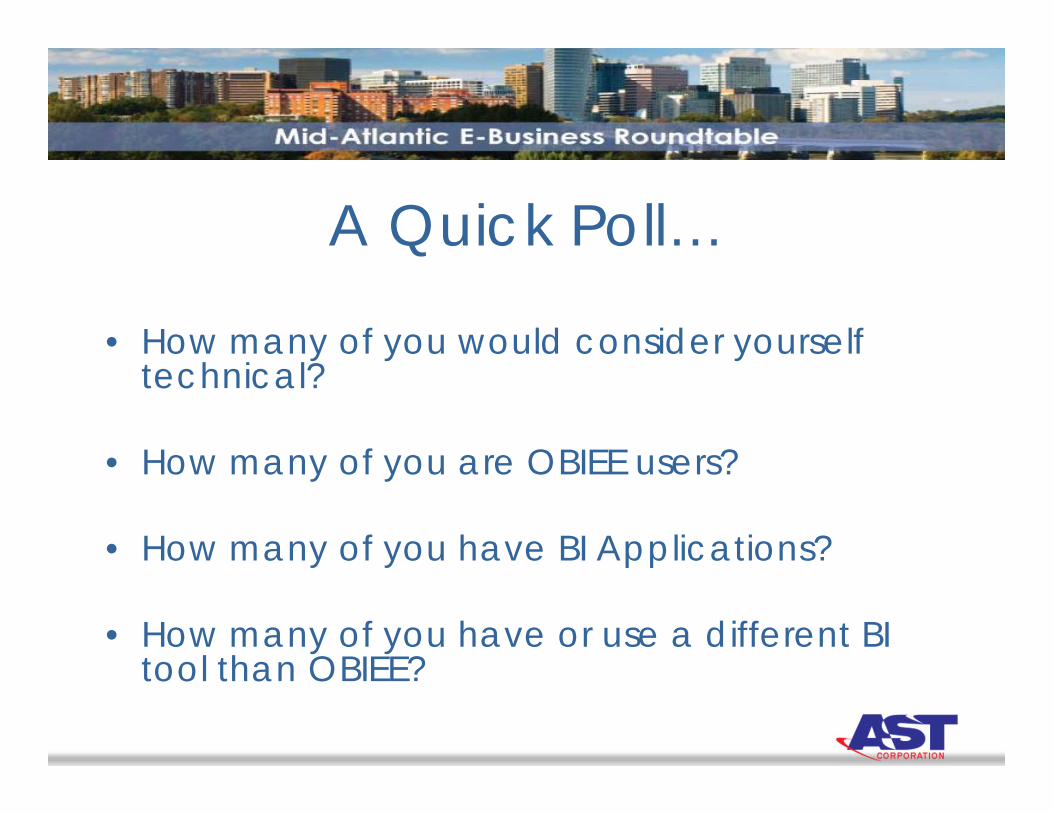
A Quick Poll…
• How many of you would consider yourself technical?
• How many of you are OBIEE users?
• How many of you have BI Applications?
• How many of you have or use a different BI tool than OBIEE?

TODAY’S ENVIRONMENT
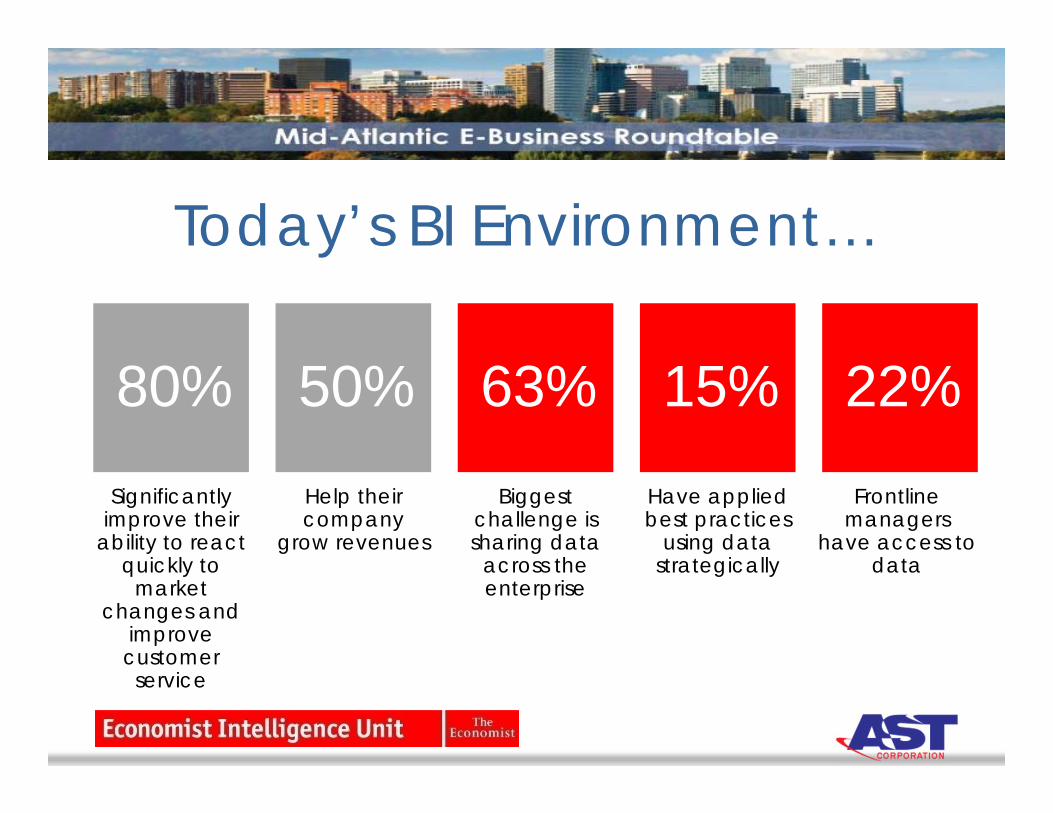
80%Significantly
improve their ability to react
quickly to market
changes and improve customer
service
50%Help their company
grow revenues
63%Biggest
challenge is sharing data
across the enterprise
15%Have applied best practices
using data strategically
22%Frontline
managers have access to
data
Today’s BI Environment…
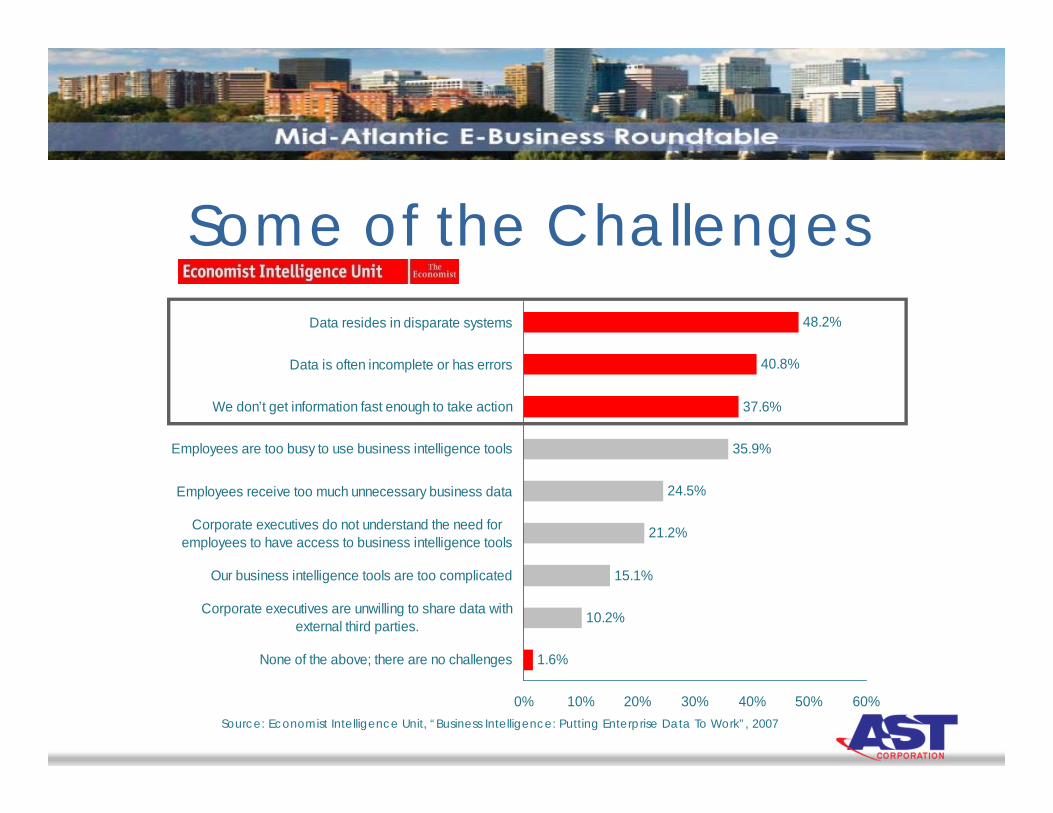
Some of the Challenges48.2%
40.8%
37.6%
35.9%
24.5%
21.2%
15.1%
10.2%
1.6%
0% 10% 20% 30% 40% 50% 60%
Data resides in disparate systems
Data is often incomplete or has errors
We don’t get information fast enough to take action
Employees are too busy to use business intelligence tools
Employees receive too much unnecessary business data
Corporate executives do not understand the need foremployees to have access to business intelligence tools
Our business intelligence tools are too complicated
Corporate executives are unwilling to share data withexternal third parties.
None of the above; there are no challenges
Source: Economist Intelligence Unit, “Business Intelligence: Putting Enterprise Data To Work”, 2007
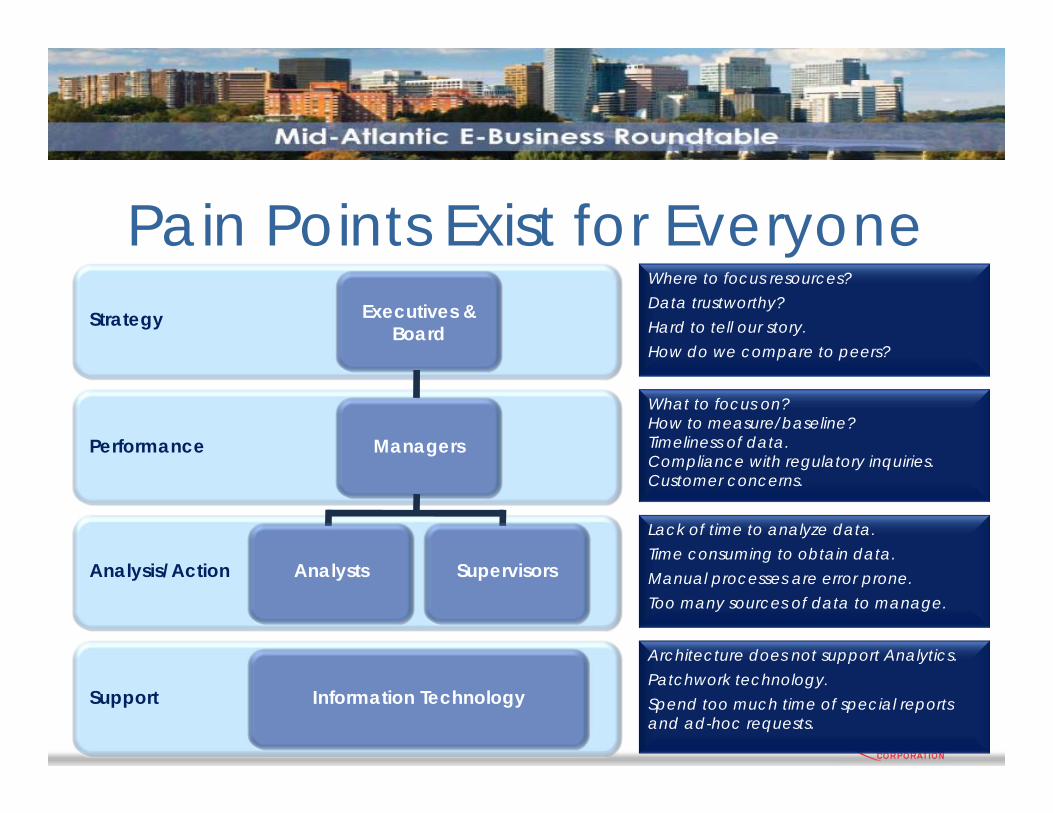
Strategy
Performance
Analysis/Action
Support
Executives & Board
Information Technology
Where to focus resources?Data trustworthy?Hard to tell our story.How do we compare to peers?
What to focus on?How to measure/baseline?Timeliness of data.Compliance with regulatory inquiries.Customer concerns.
Lack of time to analyze data.Time consuming to obtain data.Manual processes are error prone.Too many sources of data to manage.
Architecture does not support Analytics.Patchwork technology.Spend too much time of special reports and ad-hoc requests.
Managers
Analysts Supervisors
Pain Points Exist for Everyone

Findings from Our Customers
8
“Its scary how many of our ‘business rules’ are embedded in spreadsheets”
“To do my job, I need to ask 15 different people for 30 different reports”
“When it comes to data and reporting, its always ‘I’, but ‘we’, as an organization need to know, share and collaborate”
“Exception reporting and alerts would certainly help me”
“We have invested millions in key systems. Investing in a modern reporting/BI strategy will enable us to get value from those systems”
“I spend half my day collecting and reporting on data in spreadsheets…I could use that time to analyze business opportunities”
LEVERAGING BUSINESS INTELLIGENCEWITH ERPS
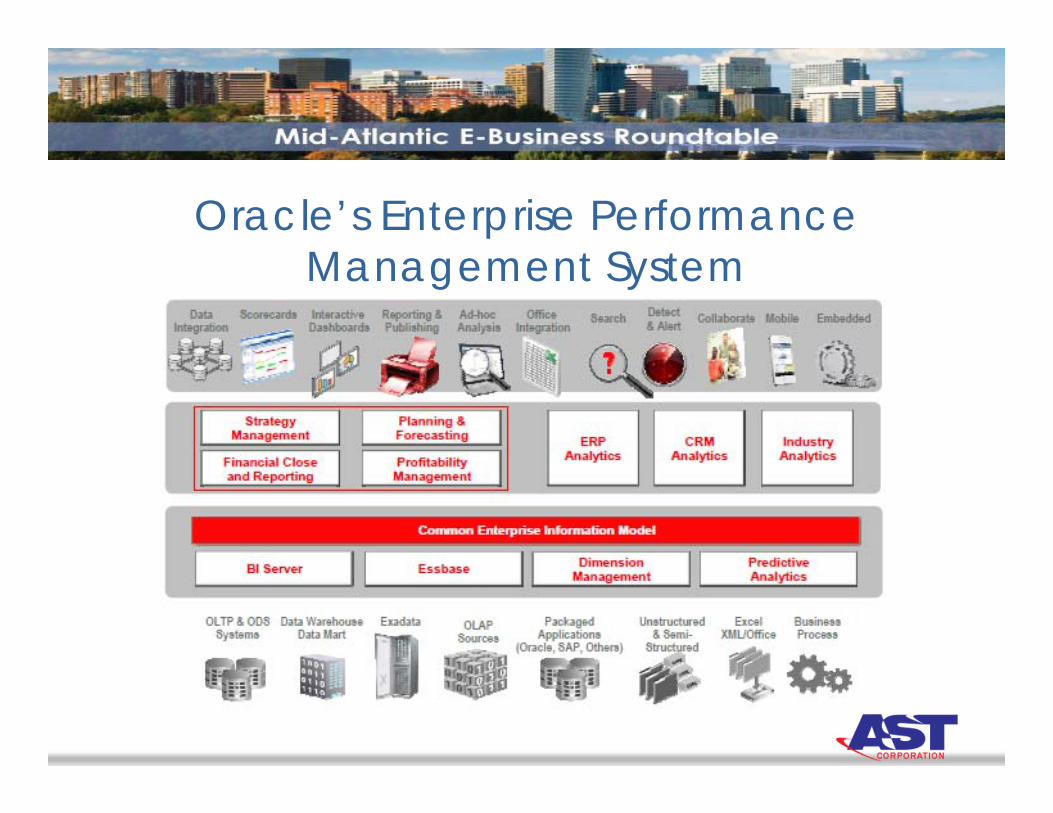
Oracle’s Enterprise Performance Management System
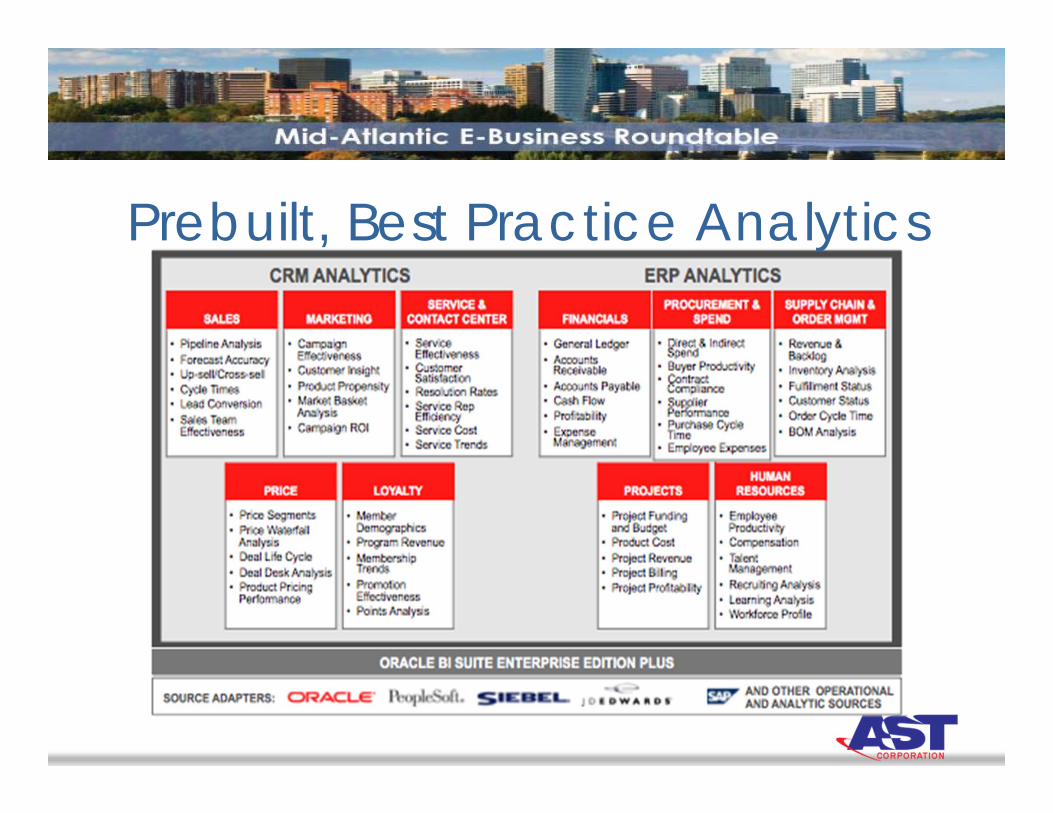
Prebuilt, Best Practice Analytics

Oracle BI Applications Provide a Single, Integrated View of the EnterpriseINTEGRATED DATA WAREHOUSE• Integrated enterprise-wide intelligence• Summary level to lowest level of detail• Data warehousing best practices –
conformed dimensions, lowest level of granularity, full change histories for time comparisons, built for speed, extensible
DATA INTEGRATION FROM MULTIPLE SOURCES
• Call center telephony (IVR, ACD, CTI)• Syndicated data• Universal Adapters
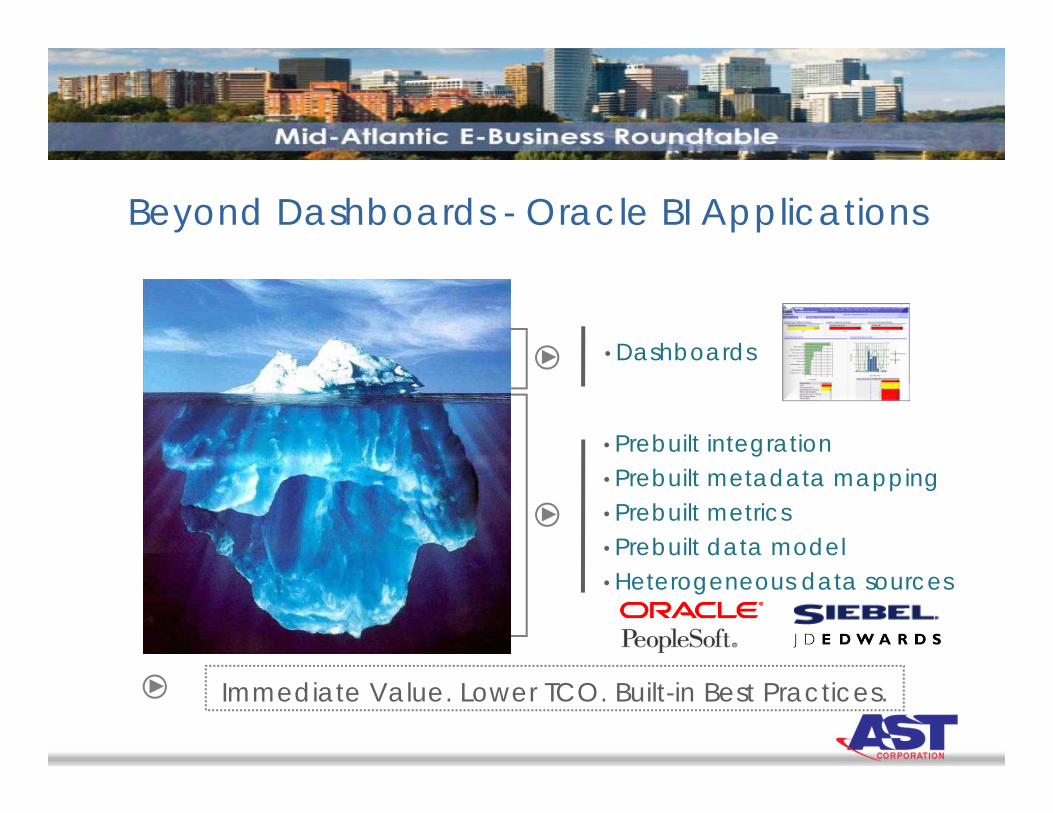
Beyond Dashboards - Oracle BI Applications
• Dashboards
• Prebuilt integration• Prebuilt metadata mapping• Prebuilt metrics• Prebuilt data model• Heterogeneous data sources
Immediate Value. Lower TCO. Built-in Best Practices.
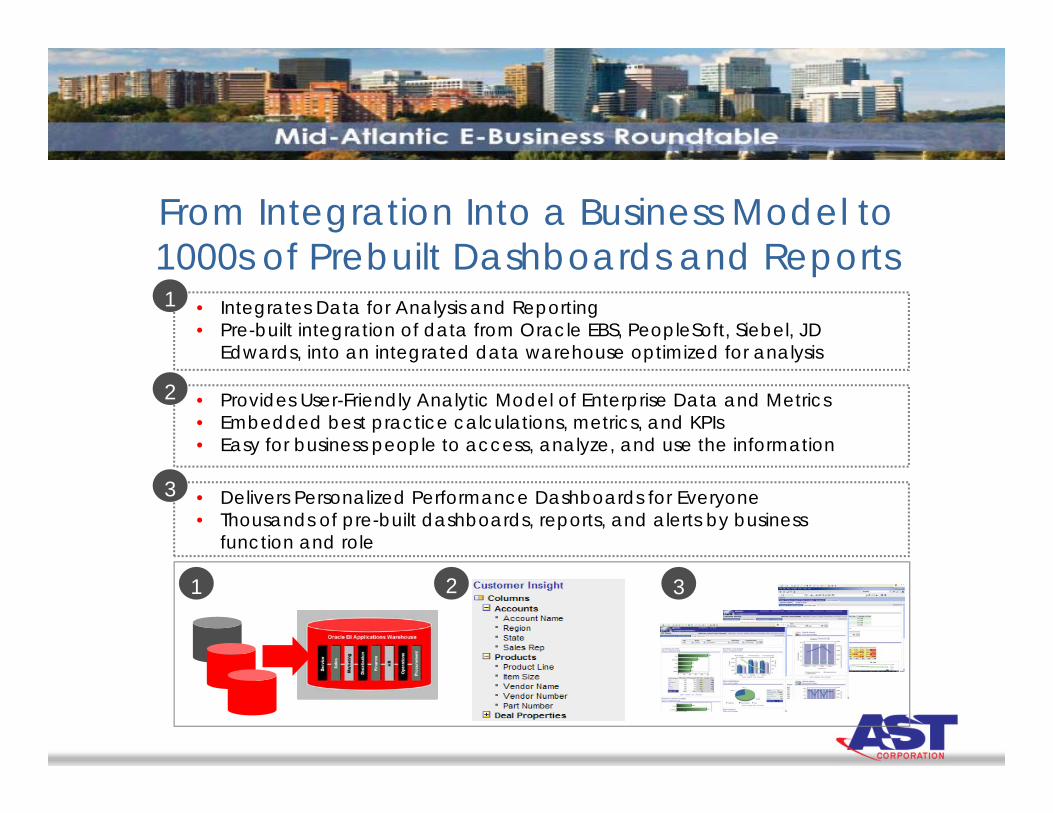
From Integration Into a Business Model to 1000s of Prebuilt Dashboards and Reports
• Integrates Data for Analysis and Reporting• Pre-built integration of data from Oracle EBS, PeopleSoft, Siebel, JD
Edwards, into an integrated data warehouse optimized for analysis
• Provides User-Friendly Analytic Model of Enterprise Data and Metrics• Embedded best practice calculations, metrics, and KPIs• Easy for business people to access, analyze, and use the information
• Delivers Personalized Performance Dashboards for Everyone• Thousands of pre-built dashboards, reports, and alerts by business
function and role
1
2
3
1 2 3

Business Objectives /
Issues
GainInsights
Take Action
Proactively Manage Top Performers with
Retention Risk
Why are Employees Leaving?
Where are the Retention Hotspots?
Is Voluntary Turnover increasing?
Is Turnover within manageable limits?
Ensure Workforce Readiness
Analytics Workflows Lead to Actionable Insight

WHAT IS AVAILABLE?

Understanding BI Apps Content
• Reference the BI Apps Content Guide (Doc ID 832690.1)– Tab 6 – Dashboards & Reports– Tab 7 – All Reports– Tab 8 – Subject Areas

Foundation Intelligence Libraries
TIPS ON IMPLEMENTING
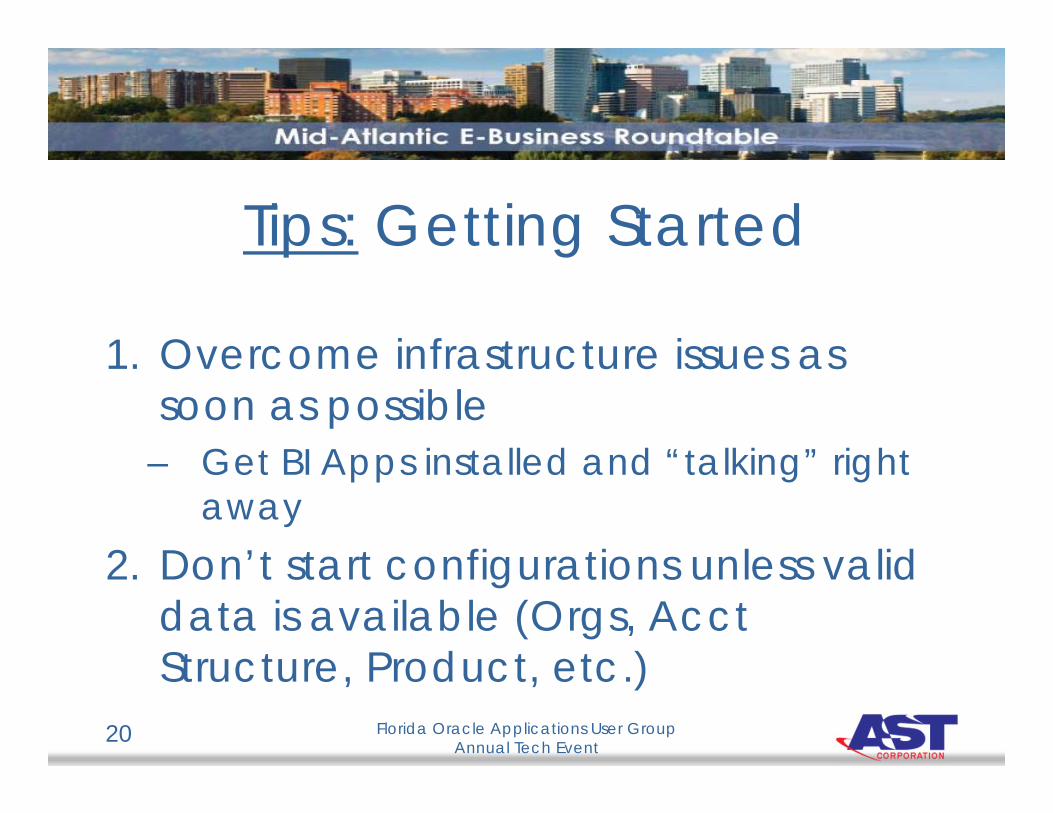
Tips: Getting Started
1. Overcome infrastructure issues as soon as possible
– Get BI Apps installed and “talking” right away
2. Don’t start configurations unless valid data is available (Orgs, Acct Structure, Product, etc.)
Florida Oracle Applications User GroupAnnual Tech Event
20

Tips: Map and Gap / Assessment
1. Gather reporting/analytics requirements
2. Perform and “map and gap” against the pre-built BI Apps content
3. Assess needs for extensions and customizations
– Interrogate flex fields (DFFs/SITs/EITs)
Florida Oracle Applications User GroupAnnual Tech Event
21
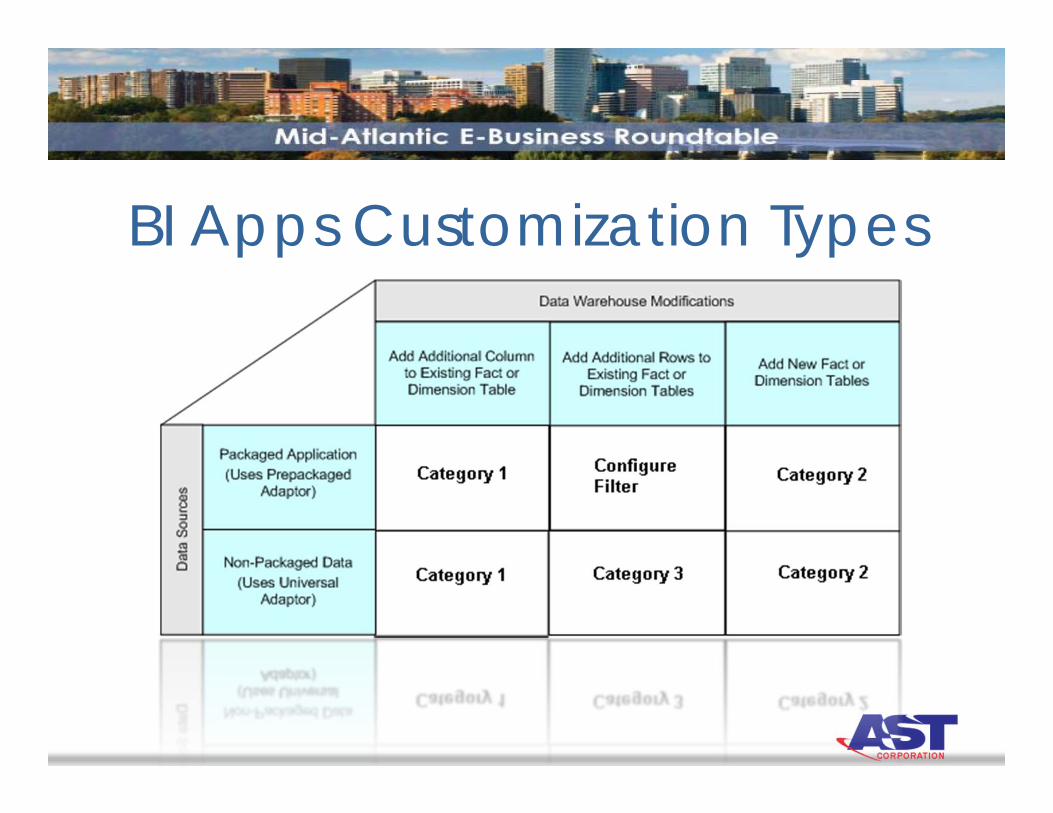
BI Apps Customization Types

Category 1: Adding Columns to Existing BI Apps Tables
• Involves extracting additional columns from source systems for which pre-packaged adapters are included– BI Apps recognize 2 types of customizations:
Extensions and Modifications• Extensions are used to add new columns to existing
tables• Modifications are changes to existing delivered logic
(not recommended)
• Complexity: Easy

Category 2: Adding New Fact or Dimension Tables
• Involves creating new data warehouse tables• Involves relating these new tables to existing
star schemas or creating new ones (modeling)
• May be sourcing data from packaged source system (i.e., Oracle EBS) or non-packaged source system
• Complexity: Medium-to-Hard

Tips: Configuration and Design
1. Complete “core” configurations and either Financials or HR Analytics first
– Initial Goal: a “clean” initial load– Then, expand to additional modules
2. Capture all configurations (spreadsheet)3. Be consistent and pragmatic with
designs – follow BI Apps StandardsFlorida Oracle Applications User Group
Annual Tech Event25

Maintain Modeling Standards
Reference the Oracle Business Analytics Warehouse Data Model Reference (Version 7.9.6.x)

Tips: Be Prepared to Extend Effectively
1. Follow the BI Apps standards2. OBIEE and ETL (Informatica) skills are
needed3. Ensure all extensions/customizations
are documented
Florida Oracle Applications User GroupAnnual Tech Event
27
Tips: Report and Dashboard Development
1. Let the pre-built reports and dashboards sink in for users
– Rebuilding legacy reports can often be avoided
2. End users, especially super users, can build reports
Florida Oracle Applications User GroupAnnual Tech Event
28

Tips: Adoption and Monitoring
1. Generate Metadata Dictionary– RPD utility; configure for online access
2. Set Up “Usage Tracking”– Much documentation online; invaluable in
understanding what reports and dashboards are actually being used
3. Have a look at how it’s performing– Weblogic has great information
Florida Oracle Applications User GroupAnnual Tech Event
29
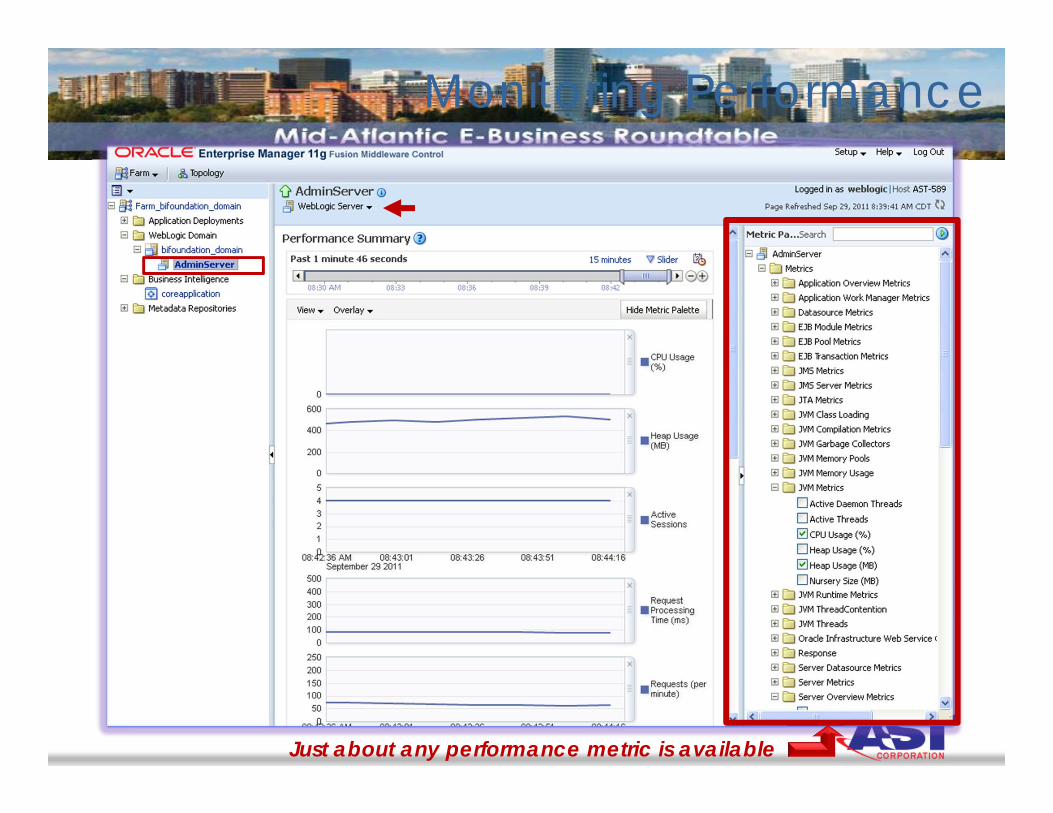
Monitoring Performance
Just about any performance metric is available

Who Does What?Functional activities• Turning things on & off• Reordering, renaming
dashboards & reports• Dashboard-level security• Adjusting terminology• Creating new versions of
reports• Report development
Technical activities• Changing business rules
(joins, calculations, etc.)• Adding DFFs/SITs/EITs• Loading/refreshing data• Adding users and/or Single
Sign-On (SSO)• Object-level security• “Repository” changes• DW Admin Console (DAC)• Report development
TAKE ADVANTAGE OF OBIEE 11GENHANCEMENTS

Oracle Business IntelligenceMost Powerful End User ExperienceComplete. Consistent. Accurate.
InteractiveDashboards
Geospatial Visualization
Office Integration
ReportsMobile
Applications & Portals
SearchAd-hocQueries
Collaboration
Scorecards
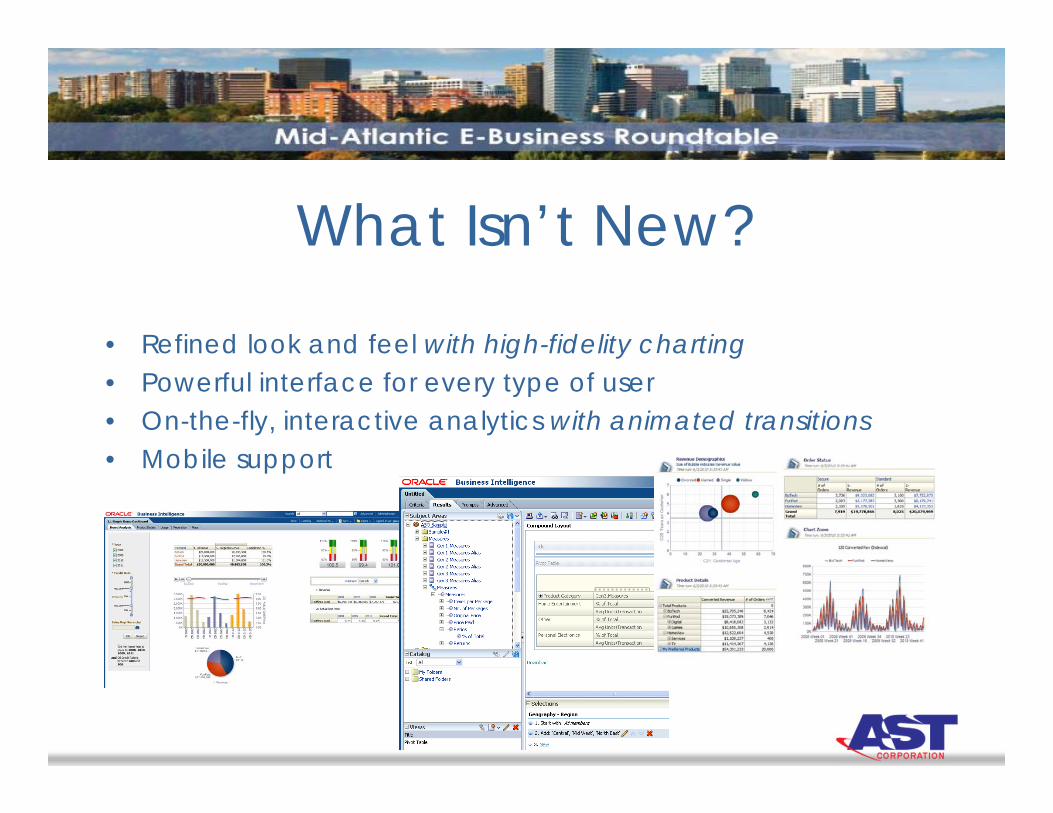
What Isn’t New?
• Refined look and feel with high-fidelity charting• Powerful interface for every type of user• On-the-fly, interactive analytics with animated transitions• Mobile support
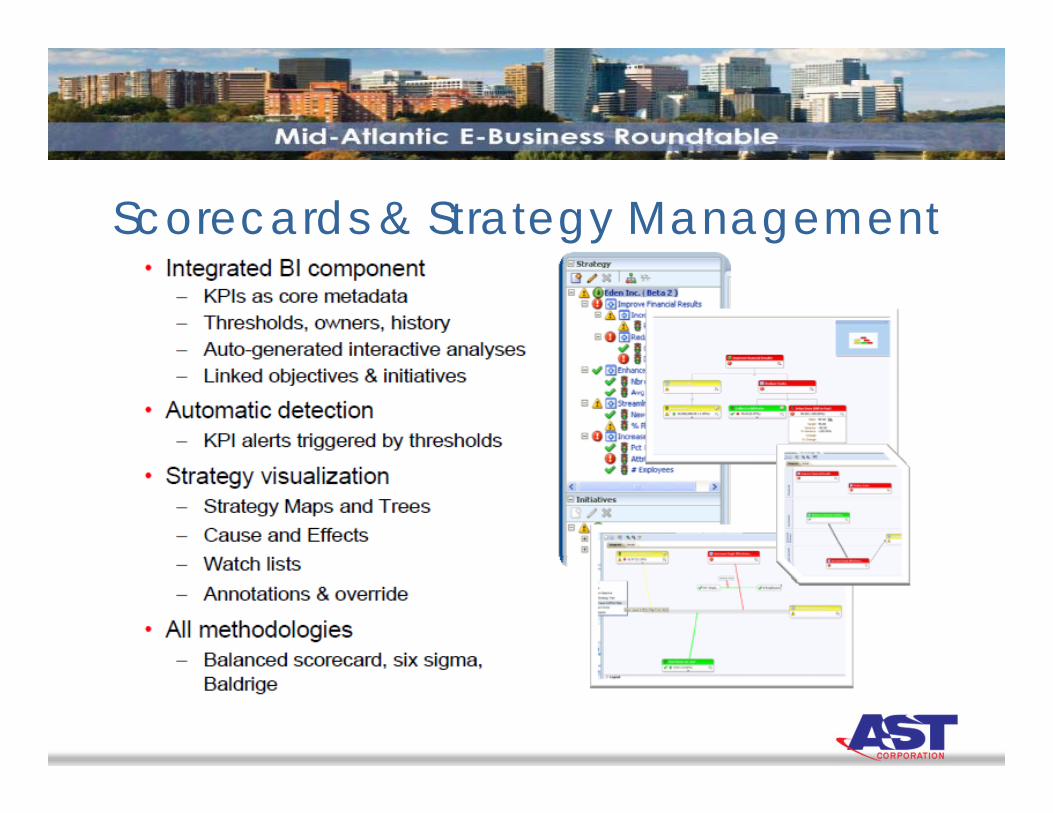
Scorecards & Strategy Management

Simple Sliders, instead of Prompts

Chart Zooming• Edit the properties of a chart using the
Answers Analysis Editor and check the 'Zoom and Scroll' property in the Canvas tab
• Then, the Zoom option is available along the lower left side of the chart (see below)

Master-Detail Linking• Enable interaction between separate analyses
– When a value is selected, the “listening” analyses will synchronize
• First, pick a driving column (report element) on the “Master” to initiate the event, also specifying a channel name
• Second, have the “Detail” analyses listening
– It’s possible to list multiple even channels here, too

Master-Detail Events

Master-Detail Maps• Maps are useful with master-detail
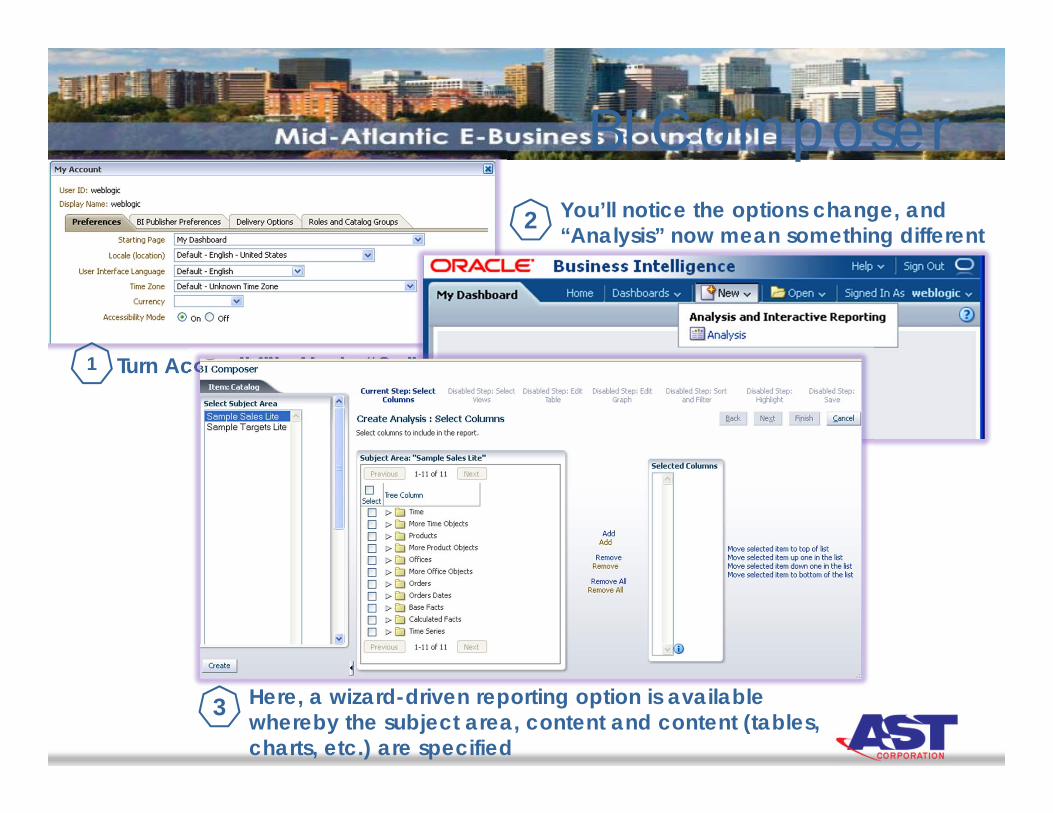
BI Composer
1 Turn Accessibility Mode “On”
2 You’ll notice the options change, and “Analysis” now mean something different
3 Here, a wizard-driven reporting option is available whereby the subject area, content and content (tables, charts, etc.) are specified

LET’S HAVE A LOOK
43 Florida Oracle Applications User GroupAnnual Tech Event

44 Florida Oracle Applications User GroupAnnual Tech Event

45 Florida Oracle Applications User GroupAnnual Tech Event
46 Florida Oracle Applications User GroupAnnual Tech Event

47 Florida Oracle Applications User GroupAnnual Tech Event
48 Florida Oracle Applications User GroupAnnual Tech Event

49 Florida Oracle Applications User GroupAnnual Tech Event

50 Florida Oracle Applications User GroupAnnual Tech Event

WRAP-UP

Speeds Time to Value & Lowers TCO
Source: Patricia Seybold Research, Gartner, Merrill Lynch, Oracle Analysis
Build from Scratchwith Traditional BI Tools Oracle BI Applications
Weeks or Months
Back-end ETL and
Mapping
DW Design
Define Metrics& Dashboards
Back-end ETL and
Mapping
DW Design
Define Metrics& Dashboards
Training/Roll-out
Training/Rollout
Quarters or Years
Prebuilt business adapters for Oracle, PeopleSoft, Siebel, SAP, others
Prebuilt DW design, adapts to your EDW
Role-based dashboards and thousands of pre-defined metrics
Easy to use, easy to adapt
Faster deploymentLower TCOAssured business value

Oracle BI is Positioned Well
Source: Gartner (March 2011)
Oracle has lower cost than every other
enterprise-class vendor

Leveraging BI With Oracle ERP
– Consider Oracle’s pre-built BI Applications• The “time-to-impact” is stream-lined• Your business users will be thanking you
– Oracle EBS data is an asset…don’t let it go to waste
– Be proactive > be alerted, target issues and highlight opportunities
– Finally have timely analytics with best practice analytics workflows
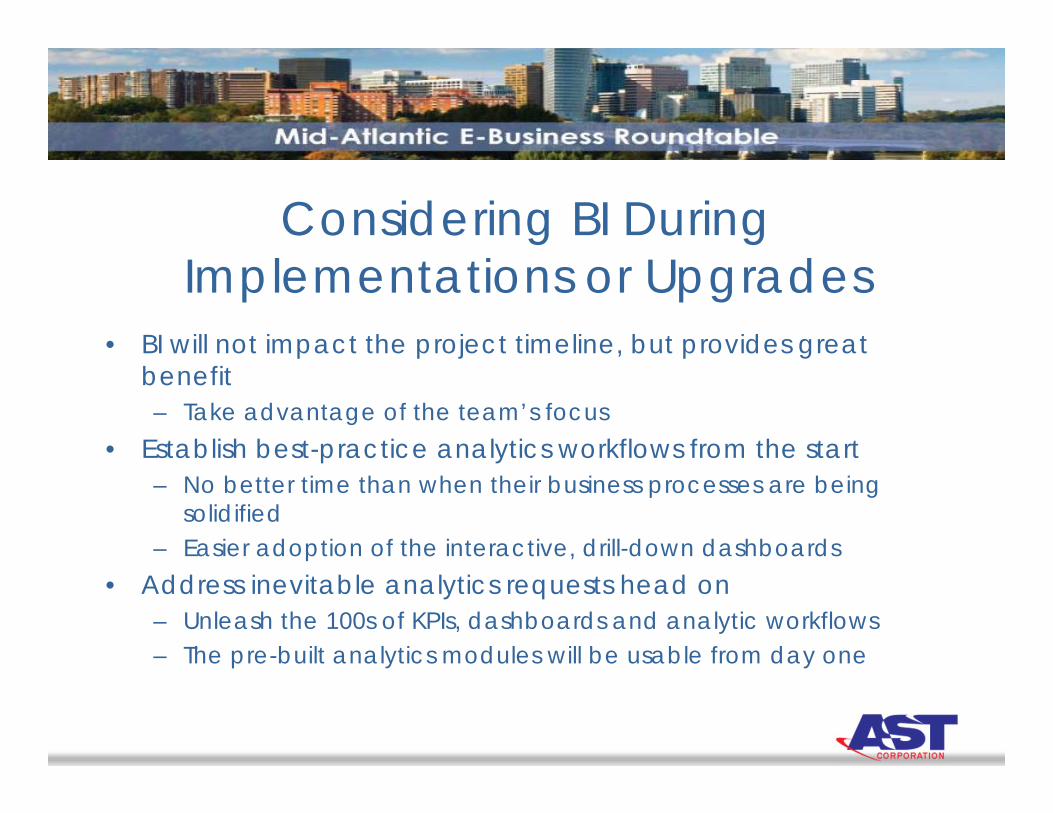
Considering BI During Implementations or Upgrades
• BI will not impact the project timeline, but provides great benefit– Take advantage of the team’s focus
• Establish best-practice analytics workflows from the start– No better time than when their business processes are being
solidified– Easier adoption of the interactive, drill-down dashboards
• Address inevitable analytics requests head on– Unleash the 100s of KPIs, dashboards and analytic workflows– The pre-built analytics modules will be usable from day one

Considering BI With Existing Oracle ERPs
• Get Oracle BI Applications up and running fast• Transform analysis with best-practice analytics workflows
– Utilize interactive, drill-down dashboards and alerts• Replace lengthy reports with targeted, exception-based
dashboards– Offer rich set of KPIs, dashboards and analytic workflows
• Deliver deep insights directly to your business users now– Improve cash flow and control expenses– Better manage headcount and employee performance– Stream-line spend and supply chain operations– Effectively track financial performance of major projects

Lessons Learned
• Organization Often Needs Education on “BI”– Reinforce their opportunity to become “smarter”
• Not All Users Are the Same– Users across the organization have different requirements, though the KPIs ought not
to change much
• Business Rules Will Differ Across Organization– Agreeing on the business rules and calculations will take time– Centralizing the rules is key
• Data Quality is Key– Specialized routines for data cleansing may be required
• Data Validation & Acceptance Is Crucial– Especially when manual or “estimated” numbers are being replaced with real
numbers

Recommendations
Ensure Sponsorship is Clear– Possible mandates to use/accept of new data and reports
Utilize Best Practices and Industry Standards– There are many great sources and pre-built solutions help
Focus on Organizational Change Management– Consider initiatives to improve adoption
Provide Capabilities for Different Users– Ad-Hoc capabilities for “super users”– KPI dashboards for senior management and executives– Interactive dashboards and pro-active alerts for management (detailed data must
be made available)
Derive the “Right” Scope and Rollout Plan– Consider a multi-phase roadmap and piloted rollout
