or, wisconsin demography: on collision course with destiny? · pdf fileuw board of regents...
TRANSCRIPT

Governor’s Cabinet ▪ 03.10.2014 UW Board of Regents ▪ 11.06.2014
The 800 lb. elephant* in the room *that no one sees
Or, Wisconsin demography: On collision course with destiny?
UW Board of Regents ▪ 11.06.2014

Governor’s Cabinet ▪ 03.10.2014 UW Board of Regents ▪ 11.06.2014
Motivation Brief economic backdrop Demography: What? Why? Looking back. Recent state population forecasts (2010-40) Implications? Possible actions?
A few brief words about WISTAX
Overview

Governor’s Cabinet ▪ 03.10.2014 UW Board of Regents ▪ 11.06.2014
Backdrop: Econ. news not new

Governor’s Cabinet ▪ 03.10.2014 UW Board of Regents ▪ 11.06.2014
99.0
92.4
94.3
96.7
101.398.9
103.8101.3
102.3
96.9
99.2
104.4
98.6
101.6
90
95
100
105
01 02 03 04 05 06 07 08 09 10 11 12
US
WI
MKE
WI rem
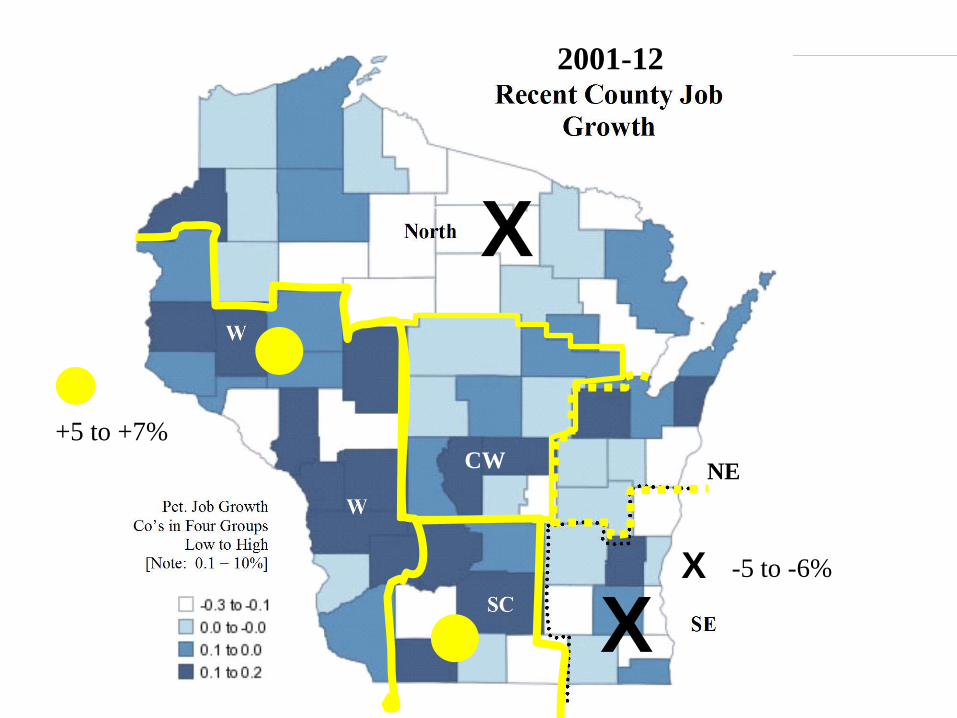
More than one Wisconsin
Governor’s Cabinet ▪ 03.10.2014 UW Board of Regents ▪ 11.06.2014
Quick review:
NE
X
X
CW
2001-12
X
+5 to +7%
-5 to -6%
Governor’s Cabinet ▪ 03.10.2014 UW Board of Regents ▪ 11.06.2014
5 de·mog·ra·phy (n.) \di-mä-grə-fē\
1. The study of population changes
2. Economic destiny
. 2. Economic destiny

Governor’s Cabinet ▪ 03.10.2014 UW Board of Regents ▪ 11.06.2014
Preview (for visually inclined)

Governor’s Cabinet ▪ 03.10.2014 UW Board of Regents ▪ 11.06.2014
People. People, we’ll need
People.
Mnemonic

Governor’s Cabinet ▪ 03.10.2014 UW Board of Regents ▪ 11.06.2014
Demography: This is not a surprise

Governor’s Cabinet ▪ 03.10.2014 UW Board of Regents ▪ 11.06.2014
“Wisconsin in on the cusp of an unprecedented period of workforce change. The situation is inevitable and the outcome poses enormous challenges for the state economy. The shifting demographics and the effects on Wisconsin’s workforce and economy cannot be overstated.”
― Office of Economic Advisors, DWD 12.2009

Governor’s Cabinet ▪ 03.10.2014 UW Board of Regents ▪ 11.06.2014
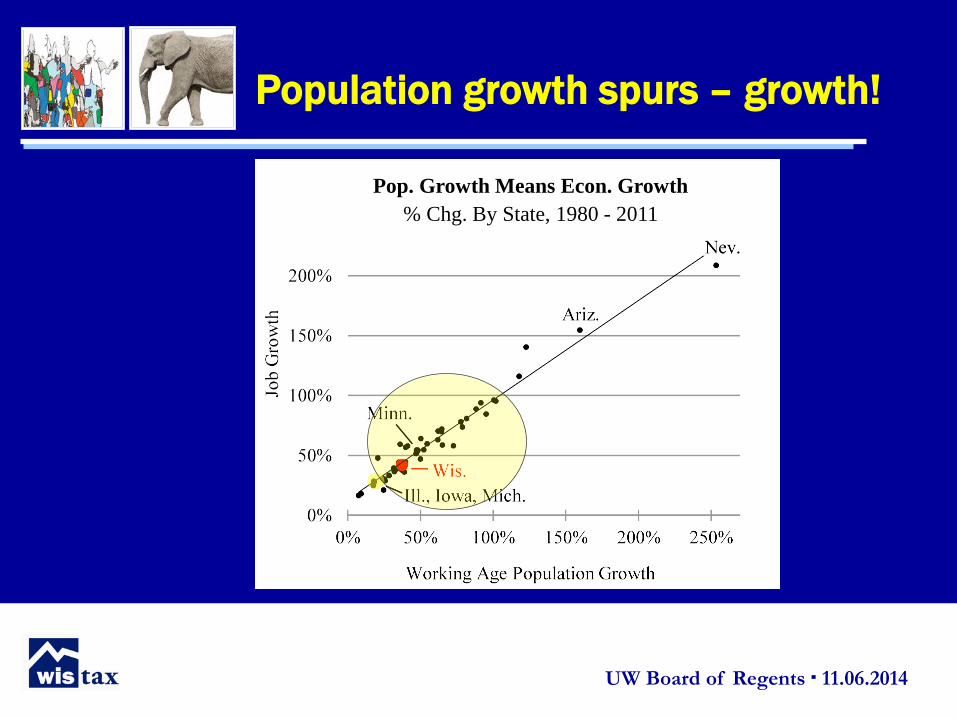
The economic impact of people
Economy grows as population grows
New workers form households and . . .
Consumer demand grows, multiplies
Kids “fuel” schools, universities
Educated young minds create, innovate
Transfer tech; create new firms (= jobs!)
Governor’s Cabinet ▪ 03.10.2014 UW Board of Regents ▪ 11.06.2014
Population growth spurs – growth!
Pop. Growth Means Econ. Growth % Chg. By State, 1980 - 2011

Governor’s Cabinet ▪ 03.10.2014 UW Board of Regents ▪ 11.06.2014
Past pop. growth: US vs. Wis.
US Wisconsin Population Growth Slow
Cumulative % Change Since 1950
56.3
28.737.1 42.7
66.134.2
49.664.4
85.8
105.2
0
25
50
75
100
50 55 60 65 70 75 80 85 90 95 00 05 10
U.S.
Wis.
WI

Governor’s Cabinet ▪ 03.10.2014 UW Board of Regents ▪ 11.06.2014
Wisconsin’s past – age by group Age Group Sizes (Millions) Change
1960 - 2010

Governor’s Cabinet ▪ 03.10.2014 UW Board of Regents ▪ 11.06.2014
854,363871,091
860,142
734,710747,667
650,000
700,000
750,000
800,000
850,000
900,000
85 89 93 97 01 05 09 13
NB: With new 4K
5 + 17 =22
Wis. K-12 Public School Enrollment
Long time coming! (Did we notice?)

Governor’s Cabinet ▪ 03.10.2014 UW Board of Regents ▪ 11.06.2014
What’s ahead? (State Pop. Proj. to 2040)
Wis. Pop. Growth Slows, 1950 - 2040 Millions (line), Avg. Ann. % Chg. (Bars)

Governor’s Cabinet ▪ 03.10.2014 UW Board of Regents ▪ 11.06.2014
Faucet dripping, drain rushing
1.75
1.16
Births Stagnate, Deaths Grow! (1980s-2030s)

Governor’s Cabinet ▪ 03.10.2014 UW Board of Regents ▪ 11.06.2014
Less natural growth, more migration?
Migration Becomes More Important, But . . .
Implications?

Governor’s Cabinet ▪ 03.10.2014 UW Board of Regents ▪ 11.06.2014
Digging deeper: Labor force freeze
2010 2020 2030 2040 % Chg.
0-24 1.89 1.88 1.95 1.95 3.0%
25-64 3.02 3.06 3.00 3.01 -0.3%
65 & over 0.78 1.06 1.42 1.54 97.5%
Total 5.69 6.01 6.38 6.49 14.1%
Working/ 1.13 1.04 0.89 0.87Dependent
*Workers (mill.)
*
Governor’s Cabinet ▪ 03.10.2014 UW Board of Regents ▪ 11.06.2014
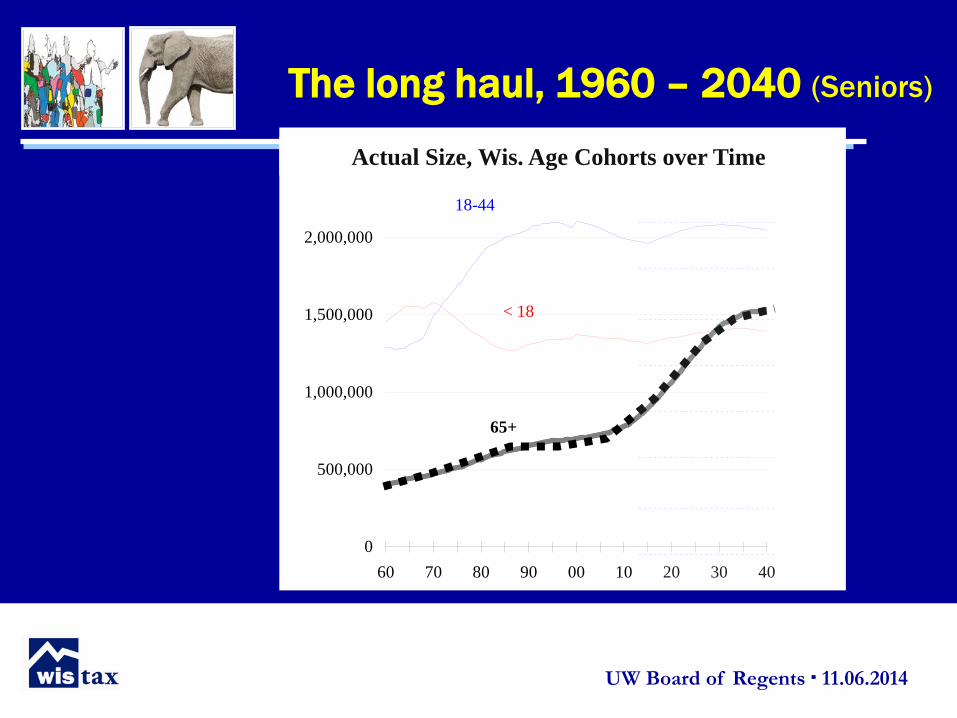
The long haul, 1960 – 2040 (Seniors)
0
500,000
1,000,000
1,500,000
2,000,000
60 70 80 90 00 10 20 30 40
18-44
< 18
65+
Actual Size, Wis. Age Cohorts over Time

Governor’s Cabinet ▪ 03.10.2014 UW Board of Regents ▪ 11.06.2014
The past & future workforce
0
500,000
1,000,000
1,500,000
2,000,000
60 70 80 90 00 10 20 30 40
< 18
65+
Actual Size, Wis. Age Cohorts over Time
Governor’s Cabinet ▪ 03.10.2014 UW Board of Regents ▪ 11.06.2014
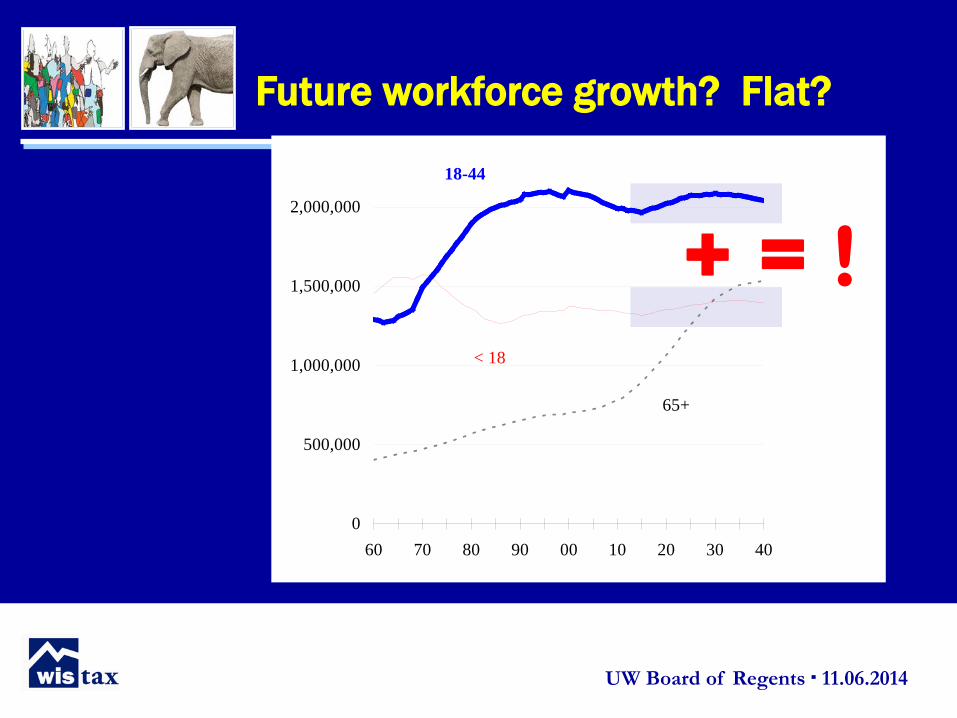
Future workforce growth? Flat?
+ = !
0
500,000
1,000,000
1,500,000
2,000,000
60 70 80 90 00 10 20 30 40
18-44
< 18
65+

Governor’s Cabinet ▪ 03.10.2014 UW Board of Regents ▪ 11.06.2014
. No job creation, without bodies?
Job Number (Blue) Track Working-Age Pop (Red)

Governor’s Cabinet ▪ 03.10.2014 UW Board of Regents ▪ 11.06.2014
Local trends? Growth or Decline 2015-40 Labor Force Cohort 25-64
dn > 10
up <10
Dn <10
up >10

Governor’s Cabinet ▪ 03.10.2014 UW Board of Regents ▪ 11.06.2014
Implications? For the economy
▪ Less household formation: consumer durables, housing market
▪ No-growth workforce: wages/personal income, savings/investment
▪ Firm location based on trained labor availability
▪ Shifting consumer behavior to reflect older pop.
▪ Labor demand: Wages bid up; tech. replaces labor

Governor’s Cabinet ▪ 03.10.2014 UW Board of Regents ▪ 11.06.2014
Implications for government
▪ Greater demand for geriatric social services, nursing care vs. child care, education
▪ Slower sales tax growth: Diff. consumer profile, and exemption structure ▪ Income tax, too: Flat labor force (vs. incr. wages?) more tax base exempt, exit of retirem’t income ▪ More resistance to property tax load/increases
▪ People shortage in labor-intensive sector, greater wage competition

Governor’s Cabinet ▪ 03.10.2014 UW Board of Regents ▪ 11.06.2014
Implications for education
Staff/admin. shortages, salary competition Declining enrollm’ts = revenue, turf pressures
Ditto higher ed. shift to tuition and incr. debt loads Increased neg. impact of HS, post-sec. dropouts
Increased competition, discounting Campus, UWS $ allocation—outdated, unrealistic?
Increased societal/indiv. costs of poor decisions

Governor’s Cabinet ▪ 03.10.2014 UW Board of Regents ▪ 11.06.2014
Max. HS grad. rates; no schools underperform Be honest, realistic about need for BA/S degree Rethink admisssions req’s & standards, retention, remediation; can’t afford leakage, delusion Max. resource allocation in higher ed: see above; strategically prune; focus campus/dept. missions Accelerate time to degree (better prep., advising; rethink major requirem’ts, even majors; calendars)
Possible actions?

Governor’s Cabinet ▪ 03.10.2014 UW Board of Regents ▪ 11.06.2014
Reenergize/direct tech. policies/max. bandwidth Focus on societal and student needs; not preserving turf, institutions Flexible work policies for senior employees Accelerate paths to teaching and admin. employment Be realistic about tenure reqm’ts (10yr cont.?) Recruit the best, brightest; immigrat’n policy?
Possible actions? (cont.)

Governor’s Cabinet ▪ 03.10.2014 UW Board of Regents ▪ 11.06.2014
Closing thoughts: More elephants
Wisconsin funding model? Campus, System governance?
State educational policymaking; ditto higher education?

Governor’s Cabinet ▪ 03.10.2014 UW Board of Regents ▪ 11.06.2014
www.wistax.org
Wisconsin Taxpayers Alliance 82 years of nonpartisan policy research and citizen education
Thank you! Questions? Critique?