or 99 corridor plan draft technical memorandum #4...
TRANSCRIPT

OR 99 Corridor Plan
DRAFT Technical Memorandum #4
Future Baseline Conditions Analysis
Prepared for
Oregon Department of Transportation, Region 3
3500 NW Stewart Parkway
Roseburg, Oregon 97470
Prepared by
David Evans and Associates, Inc.
2100 SW River Parkway
Portland, Oregon
October 2011
DRAFT Technical Memorandum #4: Future Baseline Conditions Analysis October 2011
OR 99 Corridor Plan 1
4 FUTURE BASELINE CONDITIONS ANALYSIS
This technical memorandum provides a summary of the 2034 Future Baseline (no-build)
transportation conditions through the OR 99 corridor. The analysis examines conditions where
the transportation system has been improved by projects with likely funding sources and
population and employment in the region surrounding the corridor and traffic volumes
continue to grow. The long-range regional growth forecasts are consistent with current land
use zoning. The analysis identifies anticipated operational deficiencies and serves as the basis
for later evaluation to compare concepts that address deficiencies.
4.1 Future Traffic Volume Development
Future Baseline traffic volume forecasts were developed using the regional travel demand
forecasting model, which is based on long-range land use assumptions. These forecasts are
consistent with the Rogue Valley Metropolitan Planning Organization (RVMPO) Regional
Transportation Plan (RTP) through the year 2034. The travel demand forecasting process is
briefly described below.
4.1.1 Travel Demand Forecasting Models
The future traffic volumes are developed from travel demand forecasting models. Travel
demand models have been in use since the 1950s and employ a market-based approach by
considering both transportation supply and travel demand for producing traffic forecasts. The
model relies on socioeconomic data (e.g., households and employment) to determine travel
demand and system attributes (e.g., roadway capacity, speeds, and distances) to represent the
transportation supply. The RVMPO currently uses the EMME computer program for estimating
travel demand.
Regional Transportation Plan Model
The travel demand model (named RVMPO v1) for the RTP was developed for a base year of
2002 and a forecast year of 2030. While there are currently newer versions of the travel
demand model (RVMPO v2 and RVMPO v3), the v1 model provides the most consistent results
for the OR 99 study area.
Traffic forecasts for the study area intersections were developed from the 2002 and 2030
RVMPO v1 forecasting models and the 2010 existing traffic data for the future baseline
scenario. The process followed the procedures from ODOT’s Analysis Procedures Manual
(APM)1. The forecast year for this corridor study is 2034, which coincides with the RVMPO’s
2009-2034 Regional Transportation Plan (RTP); thus, model volumes were extrapolated to
2034.
1 Analysis Procedures Manual, Oregon Department of Transportation, Transportation Development Division Planning Section,
Transportation Planning and Analysis Unit, Salem, Oregon, April, 2006, Section 4.3.
DRAFT Technical Memorandum #4: Future Baseline Conditions Analysis October 2011
OR 99 Corridor Plan 2
Future Baseline -15% Sensitivity Scenario
As a result of recent fluctuations in the economy, traffic volumes have seen a decline over the
past several years, with only a small recovery. Because of this trend, developing traffic volume
forecasts based on the existing year counts and the travel demand model forecasts may result
in lower volumes than would have been estimated just a few years ago. As such, a second
future baseline scenario was evaluated that applies a fifteen percent upward adjustment to the
baseline scenario volumes to allow for a sensitivity analysis. This allows for an analysis of
operations under the assumption that we experience an economic rebound that results in an
increase in traffic volumes, to examine the possibility of other system deficiencies.
4.2 Future Transportation Network
The network used in the forecasts for the OR 99 corridor is a future network that includes
projects from the financially-constrained Tier 1 project lists in the RTP, which was approved in
March 2009 (amended April 2009). These projects have known funding sources or are likely to
be funded in the next 20 years. Table 4-1 summarizes the projects assumed in the baseline
scenario analysis. Some of these improvements may not be reflected in the travel demand
model because travel mode choices are assumed outside of the traffic volume assignment
process. However, this corridor plan examines all modes of travel; thus they are appropriate
assumptions that should be included for analysis purposes.
In addition to the Tier 1 RTP project list, a planned project in north Ashland was assumed in the
baseline scenario. This project is titled Lithia Springs, and includes development to the
southwest of South Valley View Road at OR 99, which would incorporate a south leg to the
study intersection.

DRAFT Technical Memorandum #4: Future Baseline Conditions Analysis October 2011
OR 99 Corridor Plan 3
Table 4-1. RTP Tier 1 Project List for OR 99 Corridor Study area
RTP Project
Number Location Description
Phoenix
600 4th St., OR 99 (SB) to OR 99 (NB) Widen to provide bike lanes
601 4th St., Rose St. to Colver Rd. Widen to provide bike lanes and sidewalks
603 Rose St., First St. to Fifth St. Widen to provide bike lanes
605 Bolz Rd., OR 99 to Fern Valley Rd. Widen to provide bike lanes and sidewalks
611 Colver Rd., First St. to southern UGB limits Widen to provide bike lanes and sidewalks
614 3rd St., existing terminus to OR 99 (NB) Construct new street with bike lanes and sidewalks
615 Parking St., OR 99 (NB) to Third St. Construct new street with bike lanes and sidewalks
Talent
717 Rapp Rd., R/R X-ing to Wagner Creek Rd. Rebuild and upgrade to urban major collector standard
722 Rogue River Parkway, OR 99 to Talent Ave. Construct new street or upgrade existing street to
major collector
Jackson County
857 Bear Creek Greenway Reconstruction Reconstruct damaged trail segments: Ashland, Talent,
Medford
ODOT
902 I-5: Fern Valley Interchange, Phase 2 Reconstruct interchange; realign, widen connecting
roads: replace Bear Creek Bridge
932 OR 99: Rapp Rd to Valley View Paving Grind/Inlay and Overlay pavement
Source: Amended 2009 RTP Project List (2034)
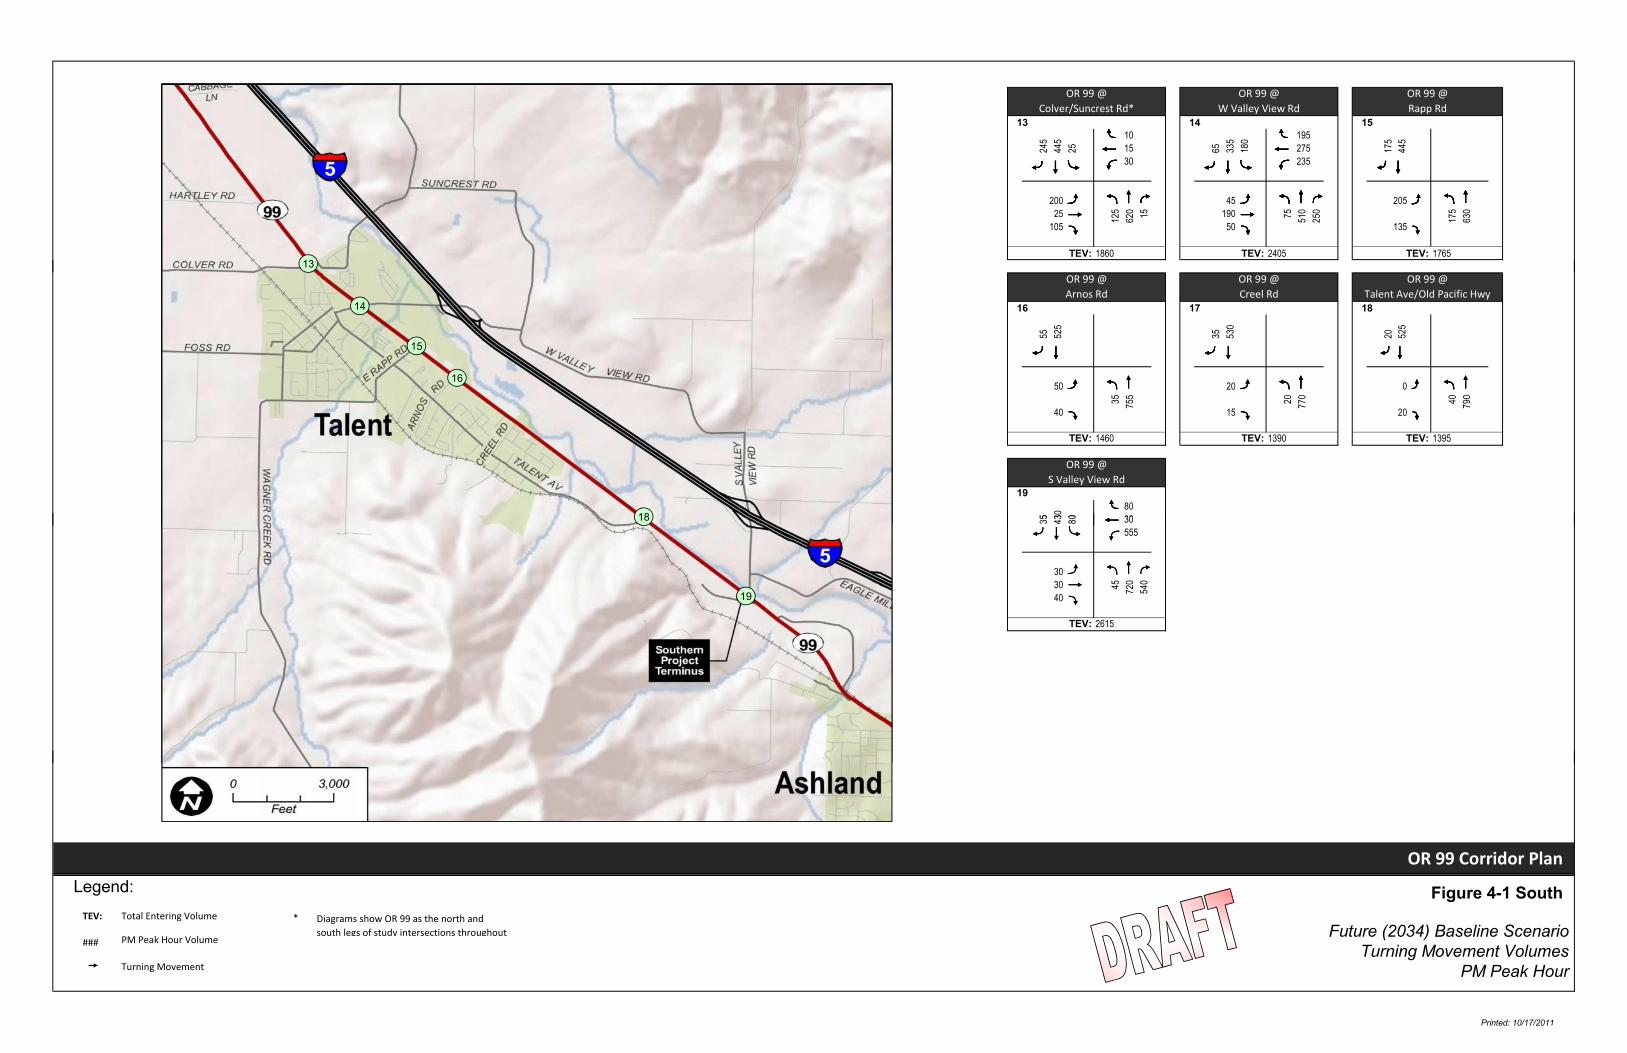
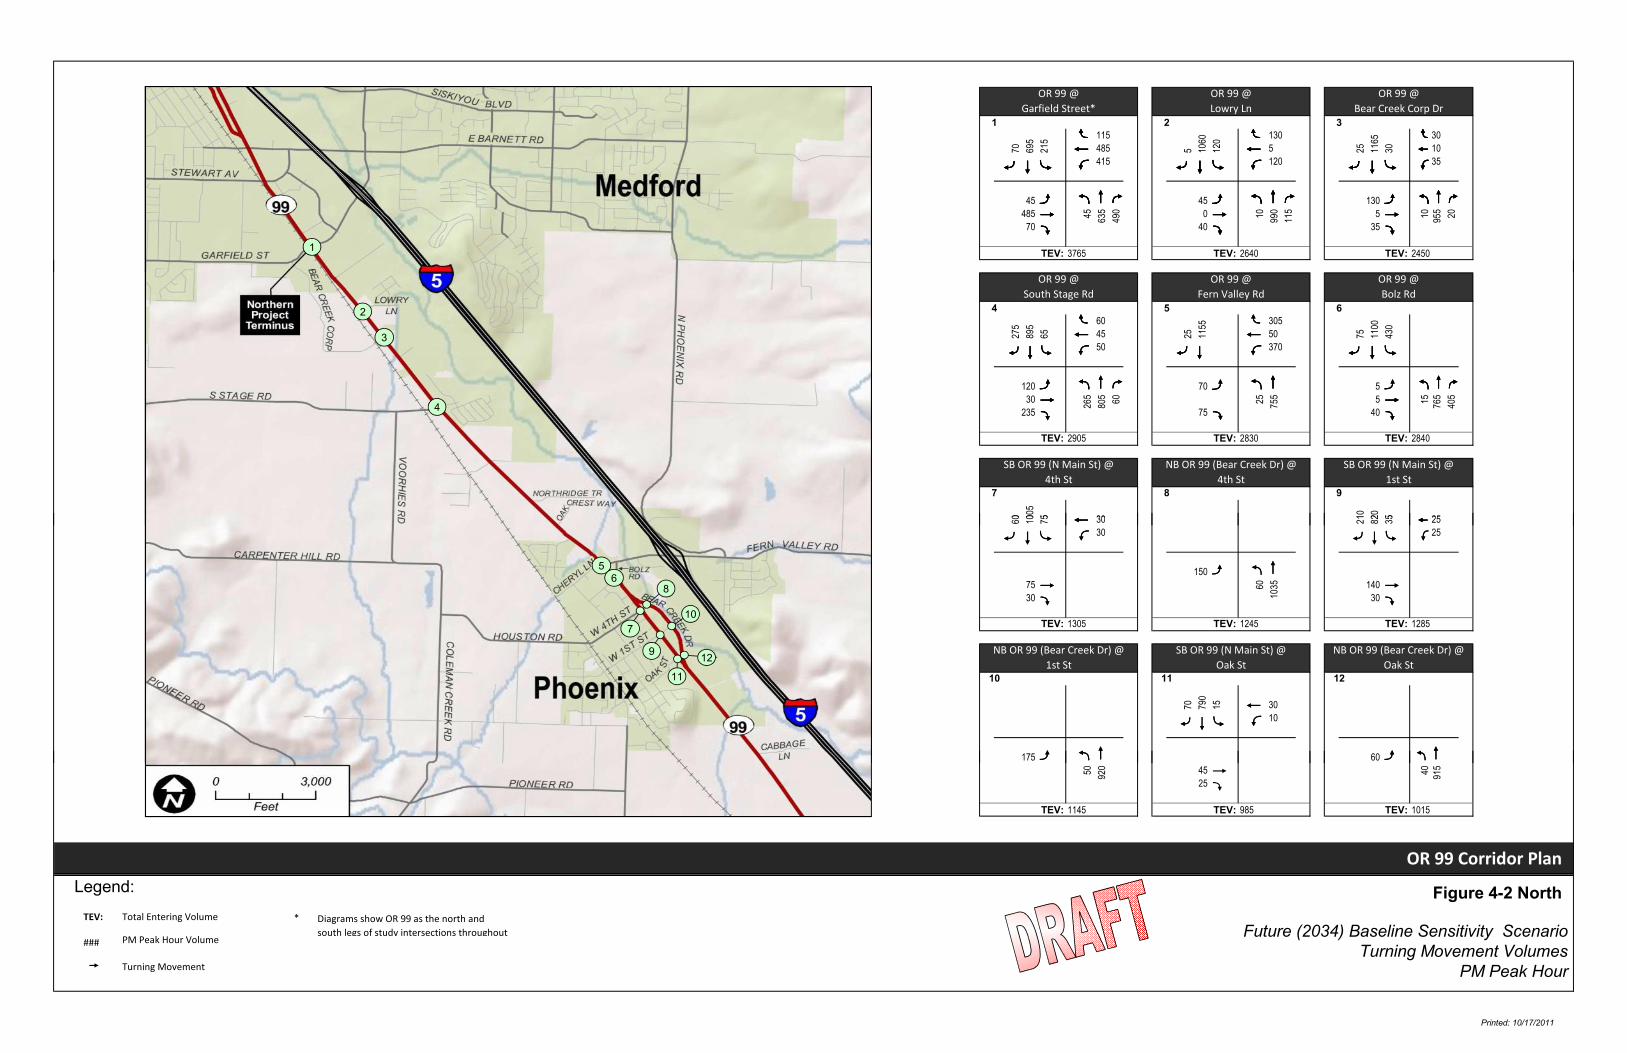
4.2.1 Turning Movement Volumes
Traffic volumes for the future baseline scenario and the future baseline sensitivity scenario are
presented in Figure 4-1 and Figure 4-2, respectively. The detailed volume development
worksheets are presented in Appendix A.
4.3 Intersection Operational Results
Traffic operations were evaluated at the 19 corridor intersections. Operations are described in
the following sections for the two future baseline scenarios and the detailed analysis
worksheets are presented in Appendix B. These findings reflect optimized signal timing plans at
all signalized corridor intersections.
4.3.1 Future Baseline
The future baseline analysis intersection results are summarized below in tabular form and
compared to the Oregon Highway Plan (OHP) mobility standards. Table 4-2 presents the results
of the future baseline traffic operations and Figure 4-3 illustrates the results for all study area
movements.

DRAFT Technical Memorandum #4: Future Baseline Conditions Analysis October 2011
OR 99 Corridor Plan 4
Table 4-2. Future (2034) Baseline Scenario - Design Hour Intersection Operations
Intersection
Critical1
Movement
2034 PM Peak Hour Operational
Standards3 V/C
Ratio2 LOS
2
Delay2
(sec.) OHP City
Medford Segment
1. OR 99 @ Garfield Street (Signalized) Overall 0.65 C 25 0.90 D
2. OR 99 @ Lowry Lane (Signalized) Overall 0.58 B 15 0.90 D
3. OR 99 @ Bear Creek Corp Drive (Signalized) Overall 0.46 A 43 0.90 D
4. OR 99 @ South Stage Road (Signalized) Overall 0.75 C 21 0.90 D
Phoenix Segment
5. OR 99 @ Fern Valley Road (Signalized) Overall 0.61 B 22 0.90 0.90
6. OR 99 @ Bolz Road (Signalized) Overall 0.43 B 12 0.90 0.90
7. SB OR 99 (N Main Street) @ 4th Street EB T/R 0.59 E 14 0.95 0.95
8. NB OR 99 (Bear Creek Drive) @ 4th Street EB L 0.31 C 9 0.95 0.95
9. SB OR 99 (N Main Street) @ 1st Street EB T/R 0.59 E 12 0.95 0.95
10. NB OR 99 (Bear Creek Drive) @ 1st Street EB L 0.33 A 9 0.95 0.95
11. SB OR 99 (N Main Street) @ Oak Street EB T/R 0.16 C 9 0.95 0.95
12. NB OR 99 (Bear Creek Drive) @ Oak Street NB L/T 0.33 A 3 0.95 0.95
Talent Segment
13. OR 99 @ Colver/Suncrest Road (Signalized) Overall 0.57 B 12 0.90 N.A.
14. OR 99 @ W Valley View Road (Signalized) Overall 0.83 D 54 0.90 N.A.
15. OR 99 @ Rapp Road (Signalized) Overall 0.67 B 17 0.90 N.A.
16. OR 99 @ Arnos Road EB L/R 0.29 C 13 0.90 N.A.
17. OR 99 @ Creel Road EB L/R 0.11 C 11 0.90 N.A.
Talent to Ashland Transition
18. OR 99 @ Talent Avenue/Old Pacific Hwy EB L/R 0.04 B 7 0.90 N.A.
19. OR 99 @ S Valley View Road (Signalized) Overall 0.87 D 75 0.80 N.A.
Acronyms: For intersection approaches NB = northbound, SB = southbound, EB = eastbound, and WB = westbound. At the intersection
approach L = left-turn movement, T = through movement, and R right-turn movement. Some approaches have shared lanes where two or
more travel movements may be permitted as indicated with a slash.
Notes:
1. The critical movement at a signalized intersection is the overall operation of the intersection. The critical movement at an unsignalized
intersection is the stopped (or yield) movement with the worst v/c ratio.
2. The v/c ratio and LOS are provided from Synchro HCM Intersection Analysis Reports, while delay and queuing values are from SimTraffic.
3. Mobility standards are drawn from Table 6 of the 1999 OHP and corresponding TSPs. All study area intersections are within the UGB and
MPO.
Shaded results indicate where mobility standards are not met
Traffic operations would be acceptable under future baseline conditions throughout the
corridor, with one exception. The signalized intersection of OR 99 at S Valley View Road would
exceed OHP operational standards with a v/c ratio of 0.87 and an LOS of D. None of the other
intersections would fail to meet v/c ratio standards. The worst LOS in the corridor would be E
for the stopped side-street movement at two unsignalized intersections.
DRAFT Technical Memorandum #4: Future Baseline Conditions Analysis October 2011
OR 99 Corridor Plan 5
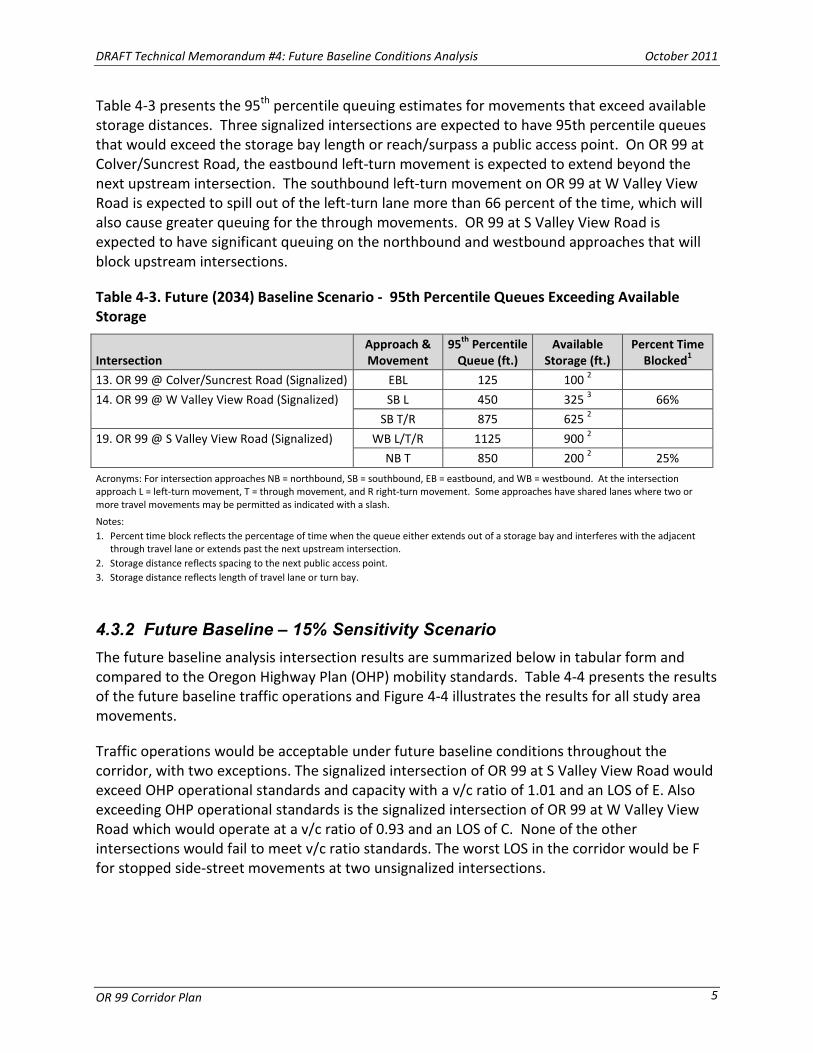
Table 4-3 presents the 95th
percentile queuing estimates for movements that exceed available
storage distances. Three signalized intersections are expected to have 95th percentile queues
that would exceed the storage bay length or reach/surpass a public access point. On OR 99 at
Colver/Suncrest Road, the eastbound left-turn movement is expected to extend beyond the
next upstream intersection. The southbound left-turn movement on OR 99 at W Valley View
Road is expected to spill out of the left-turn lane more than 66 percent of the time, which will
also cause greater queuing for the through movements. OR 99 at S Valley View Road is
expected to have significant queuing on the northbound and westbound approaches that will
block upstream intersections.
Table 4-3. Future (2034) Baseline Scenario - 95th Percentile Queues Exceeding Available
Storage
Intersection
Approach &
Movement
95th
Percentile
Queue (ft.)
Available
Storage (ft.)
Percent Time
Blocked1
13. OR 99 @ Colver/Suncrest Road (Signalized) EBL 125 100 2
14. OR 99 @ W Valley View Road (Signalized) SB L 450
325 3
66%
SB T/R 875 625 2
19. OR 99 @ S Valley View Road (Signalized) WB L/T/R 1125 900 2
NB T 850 200 2
25%
Acronyms: For intersection approaches NB = northbound, SB = southbound, EB = eastbound, and WB = westbound. At the intersection
approach L = left-turn movement, T = through movement, and R right-turn movement. Some approaches have shared lanes where two or
more travel movements may be permitted as indicated with a slash.
Notes:
1. Percent time block reflects the percentage of time when the queue either extends out of a storage bay and interferes with the adjacent
through travel lane or extends past the next upstream intersection.
2. Storage distance reflects spacing to the next public access point.
3. Storage distance reflects length of travel lane or turn bay.
4.3.2 Future Baseline – 15% Sensitivity Scenario
The future baseline analysis intersection results are summarized below in tabular form and
compared to the Oregon Highway Plan (OHP) mobility standards. Table 4-4 presents the results
of the future baseline traffic operations and Figure 4-4 illustrates the results for all study area
movements.
Traffic operations would be acceptable under future baseline conditions throughout the
corridor, with two exceptions. The signalized intersection of OR 99 at S Valley View Road would
exceed OHP operational standards and capacity with a v/c ratio of 1.01 and an LOS of E. Also
exceeding OHP operational standards is the signalized intersection of OR 99 at W Valley View
Road which would operate at a v/c ratio of 0.93 and an LOS of C. None of the other
intersections would fail to meet v/c ratio standards. The worst LOS in the corridor would be F
for stopped side-street movements at two unsignalized intersections.

DRAFT Technical Memorandum #4: Future Baseline Conditions Analysis October 2011
OR 99 Corridor Plan 6
Table 4-4. Future (2034) Baseline Sensitivity Scenario - Design Hour Intersection Operations
Intersection
Critical1
Movement
2034 PM Peak Hour Operational
Standards3 V/C
Ratio2 LOS
2
Delay2
(sec.) OHP City
Medford Segment
1. OR 99 @ Garfield Street (Signalized) Overall 0.75 D 32 0.90 D
2. OR 99 @ Lowry Lane (Signalized) Overall 0.66 C 18 0.90 D
3. OR 99 @ Bear Creek Corp Drive (Signalized) Overall 0.55 A 37 0.90 D
4. OR 99 @ South Stage Road (Signalized) Overall 0.78 C 25 0.90 D
Phoenix Segment
5. OR 99 @ Fern Valley Road (Signalized) Overall 0.62 B 14 0.90 0.90
6. OR 99 @ Bolz Road (Signalized) Overall 0.51 B 12 0.90 0.90
7. SB OR 99 (N Main Street) @ 4th Street EB T/R 0.73 F 17 0.95 0.95
8. NB OR 99 (Bear Creek Drive) @ 4th Street EB L 0.42 C 10 0.95 0.95
9. SB OR 99 (N Main Street) @ 1st Street EB T/R 0.83 F 14 0.95 0.95
10. NB OR 99 (Bear Creek Drive) @ 1st Street EB L 0.43 C 11 0.95 0.95
11. SB OR 99 (N Main Street) @ Oak Street EB T/R 0.24 C 10 0.95 0.95
12. NB OR 99 (Bear Creek Drive) @ Oak Street EB L 0.14 B 8 0.95 0.95
Talent Segment
13. OR 99 @ Colver/Suncrest Road (Signalized) Overall 0.63 B 13 0.90 N.A.
14. OR 99 @ W Valley View Road (Signalized) Overall 0.93 C 26 0.90 N.A.
15. OR 99 @ Rapp Road (Signalized) Overall 0.76 C 21 0.90 N.A.
16. OR 99 @ Arnos Road EB L/R 0.39 D 15 0.90 N.A.
17. OR 99 @ Creel Road EB L/R 0.18 C 12 0.90 N.A.
Talent to Ashland Transition
18. OR 99 @ Talent Avenue/Old Pacific Hwy EB L/R 0.03 B 12 0.90 N.A.
19. OR 99 @ S Valley View Road (Signalized) Overall 1.01 E 258 0.80 N.A.
Acronyms: For intersection approaches NB = northbound, SB = southbound, EB = eastbound, and WB = westbound. At the intersection
approach L = left-turn movement, T = through movement, and R right-turn movement. Some approaches have shared lanes where two or
more travel movements may be permitted as indicated with a slash.
Notes:
1. The critical movement at a signalized intersection is the overall operation of the intersection. The critical movement at an unsignalized
intersection is the stopped (or yield) movement with the worst v/c ratio.
2. The v/c ratio and LOS are provided from Synchro HCM Intersection Analysis Reports, while delay and queuing values are from SimTraffic.
3. Mobility standards are drawn from Table 6 of the 1999 OHP and corresponding TSPs. All study area intersections are within the UGB and
MPO.
Shaded results indicate where mobility standards are not met
Table 4-5 summarizes the intersection movements with queues exceeding available storage
distances. Five signalized intersections and one unsignalized intersection are expected to have
95th
percentile queues that would exceed the storage bay length or reach/surpass a public
access point. In addition to the three locations described for the future baseline scenario, three
other intersections would have 95th
percentile queues that exceed available storage or block
upstream intersections. The signalized intersections of OR 99 at Garfield Street, OR 99 at South
Stage Road, OR 99 at Colver/Suncrest Road, OR 99 at W Valley View Road, and OR 99 at S Valley

DRAFT Technical Memorandum #4: Future Baseline Conditions Analysis October 2011
OR 99 Corridor Plan 7
View Road would all have side streets with excess queuing. OR 99 at S Valley View Road would
also experience queuing on the mainline in the northbound direction. At the unsignalized
intersection of NB OR 99 (Bear Creek Drive) at Oak Street, the eastbound left-turn movement
could occasionally extend beyond the limited storage area between the segments of the
downtown Phoenix couplet, which could interfere with the southbound through traffic..
Table 4-5. Future (2034) Baseline Sensitivity Scenario - 95th Percentile Queues Exceeding
Available Storage
Intersection
Approach &
Movement
95th
Percentile
Queue (ft.)
Available
Storage (ft.)
Percent Time
Blocked1
1. OR 99 @ Garfield Street (Signalized) WB L 350 300 3
WB T 850 800 2
15%
4. OR 99 @ South Stage Road (Signalized) EB L 150 125 3
1%
12. NB OR 99 (Bear Creek Drive) @ Oak Street EB L 75 50 2
13. OR 99 @ Colver/Suncrest Road (Signalized) EBL 125 100 2
EB T/R 125 100 2
14. OR 99 @ W Valley View Road (Signalized) WB L 250 200 3
6%
19. OR 99 @ S Valley View Road (Signalized) WB L/T/R 925 900 2
NB T 2450 200 2
54%
NB R 225 150 3
29%
Acronyms: For intersection approaches NB = northbound, SB = southbound, EB = eastbound, and WB = westbound. At the intersection
approach L = left-turn movement, T = through movement, and R right-turn movement. Some approaches have shared lanes where two or
more travel movements may be permitted as indicated with a slash.
Notes:
1. Percent time block reflects the percentage of time when the queue either extends out of a storage bay and interferes with the adjacent
through travel lane or extends past the next upstream intersection.
2. Storage distance reflects spacing to the next public access point.
3. Storage distance reflects length of travel lane or turn bay.
4.3.3 Future Traffic Safety Considerations
The future baseline analysis reveals several long-term traffic safety issues that need
consideration. In general, long delays and extensive queues may cause drivers to engage in
riskier actions, such as running lights or traveling longer distances in the TWLTL to go around
queues, which could result in more turning, angle, and sideswipe collisions. On unsignalized
side streets, longer delays may increase the likelihood that drivers would accept shorter gaps in
the mainline traffic putting them at risk for turning or angle collisions. Where congestion is
expected to worsen, it is safe to assume that current safety concerns would be exacerbated.
The existing conditions analysis identified frequency, severity, rate, and type of reported
crashes along the study corridor and at each study intersection for a five-year analysis period
(January 1, 2005, and December 31, 2009). The data is summarized in Table 3-6 of the Existing
Conditions Memo. There are no segments along the OR 99 study corridor identified in the top
10% of the most recent (2010) Safety Priority Index System (SPIS) rankings within the study
area. However, this analysis revealed several mainline intersections and segments with specific
crash trends. The areas of concern are primarily focused at:

DRAFT Technical Memorandum #4: Future Baseline Conditions Analysis October 2011
OR 99 Corridor Plan 8
• Fern Valley Road
• Between Fern Valley Road and South Stage Road
• Between Garfield Avenue and Lowry Lane
• Between Talent Avenue and South Valley View Road
• Garfield Street
• Creel Road
Pedestrian collisions occurred at four locations, two were midblock (between S Stage Road and
Fern Valley Road and between Talent Avenue and S Valley View Road) and two were at
intersections (Bear Creek Road - NB OR 99 at 4th
Street and at Oak Street)
The improvements assumed in the future conditions would not mitigate the frequency or
severity of crashes at these locations, except at Fern Valley Road (although not in the segment
to the north). Moreover, the crash rates might increase in the future as drivers are provided
smaller gaps due to increased traffic volumes.
4.4 Conclusions
Only one intersection, OR 99 and South Valley View Road, is expected to exceed mobility
standards by year 2034 within the study area with a v/c ratio of 0.87 for the Future Baseline
scenario. This intersection already has a planned RTP project on the Tier 2 list (currently
unfunded). Only three Future Baseline scenario intersections are expected to experience
queuing in excess of available storage distances and block adjacent lanes or public access
points.
With a 15 percent increase in study area traffic, the Future Baseline Sensitivity scenario is
expected to have two intersections which exceed mobility standards by year 2034, OR 99 and
South Valley View Road and OR 99 at West Valley View Road. The intersection of OR 99 and
South Valley View Road would also exceed capacity with a v/c ratio of 1.01, while the
intersection of OR 99 at West Valley View Road would operate at a v/c ratio of 0.93. For the
Future Baseline Sensitivity scenario six total intersections would experience queuing in excess
of available storage distance and block adjacent lanes or public access points, five signalized
intersections and one unsignalized intersection.
The Future Baseline scenario would not provide improvements to mitigate the frequency or
severity of crashes at several problematic locations, and may generally result in an increased
crash rate as drivers are provided smaller gaps due to increased traffic volumes.
Attachments:
Figure 4-1.Future (2034) Baseline Scenario – Design Hour Traffic Volumes
Figure 4-2.Future (2034) Baseline Sensitivity Scenario – Design Hour Traffic Volumes
Figure 4-3.Future (2034) Baseline Scenario – Lane Configurations & Traffic Operations
Figure 4-4.Future (2034) Baseline Sensitivity Scenario – Lane Configurations & Traffic Operations
Appendix A. Future Baseline Traffic Volume Development Worksheets
Appendix B. Traffic Analysis Worksheets

WBR SWR wbr
WBT SWT wbt
SERSETSEL WBL SERSETSEL SWL SERSETSEL wbl
EBL NWLnwt nwr NEL NWLnwt nwr ebl NWLnwt nwr
WBT NET ebt
EBR NER ebr
OR 99 @
Garfield Street*
OR 99 @
Lowry Ln
OR 99 @
Bear Creek Corp Dr
1
60
60
5
18
5
2
5 92
0
10
15
25
10 100 20 115 30 25
420 5 10
360 105 30
10
5
3
20
40 40 115
420 40
55
0
42
5 0 10
86
0
10
0 5 10
83
0
15
60 35 30
TEV: 3265 TEV: 2300 TEV: 21301
SWR WBR SBR
SWT WBT SBT
SERSETSEL SWL SERSETSEL WBL SERSETSEL SBL
NEL NWLnwt nwr EBL NWLnwt nwr NEL NWLnwt nwr
NET EBT NET
NER EBR NER
swr SWR SWR
swt wbt SWT
OR 99 @
South Stage Rd
OR 99 @
Fern Valley Rd
OR 99 @
Bolz Rd
4
24
0
78
0
55
5
20
10
20
95
5
37
5
40 50 50 265 60
40 45
45 320
6
65
105 60 5
25
23
0
70
0
50
20
65
5 5 15
67
0
34
5
205 65 35
TEV: 2525 TEV: 2470 TEV: 2470
SB OR 99 (N Main St) @
4th St
NB OR 99 (Bear Creek Dr) @
4th St
SB OR 99 (N Main St) @
1st St
7
50
87
5
60
8
30
70 80 90
25 25
9
18
0
71
5
1
4
2
3
swt wbt SWT
SERSETSEL swl SERSETsel wbl SERSETSEL SWL
ebl NWLnwt nwr nel wbl wbt wbr NEL NWLnwt nwr
net nwt NET
ner nwr NER
SWR SWR SWR
SWT WBT SWT
SERSETSEL SWL SERSETSEL WBL SERSETSEL SWL
NEL NWLnwt nwr NEL NWLnwt nwr EBL NBLNBTNBR
50
87
5
60
3025 2518
0
71
5
25 20
130
65 50
90
0 120
25 25
TEV: 1125 TEV: 1080 TEV: 1115
NB OR 99 (Bear Creek Dr) @
1st St
SB OR 99 (N Main St) @
Oak St
NB OR 99 (Bear Creek Dr) @
Oak St
10 11
60
68
5
15
12
10
100 110 120
25
150 50
N
1
4
2
3
5
6
7
8
10
129
11
NEL NWLnwt nwr NEL NWLnwt nwr EBL NBLNBTNBR
NET EBT NET
NER EBR NER
TEV: Total Entering Volume *
### PM Peak Hour Volume
Turning Movement
80
0 35 35
79
5
150 50
45
20
TEV: 995 TEV: 850 TEV: 880
OR 99 Corridor Plan
Legend: Figure 4-1 North
Diagrams show OR 99 as the north and
south legs of study intersections throughout Future (2034) Baseline Scenario
Turning Movement Volumes
PM Peak Hour
N
1
4
2
3
5
6
7
8
10
129
11
Printed: 10/17/2011
O
R
wbr wbr SWR
wbt wbt SWT
SERSETSEL wbl SERSETSEL wbl SERSETSEL SWL
ebl NWLnwt nwr ebl NWLnwt nwr NEL NWLnwt nwr
ebt ebt NET
ebr ebr NER
130 10 140
OR 99 @
Colver/Suncrest Rd*
OR 99 @
W Valley View Rd
OR 99 @
Rapp Rd
13
24
5
44
5
25
14
65
33
5
18
0
15
17
5
44
5
195 150
62
0
15 190 75
15 275
30 235
17
5
63
0
200 45 205
25
12
5
105 50 135
TEV: 1860 TEV: 2405 TEV:
51
0
25
0
1765
13
O
R
SWR SWR SWR
SWT SWT SWT
SERSETSEL SWL SERSETSEL SWL SERSETSEL SWL
NEL NWLnwt nwr NEL NWLnwt nwr NEL NWLnwt nwr
NET NET NET
NER NER NER
S
B
S
B
sbr
sbt
OR 99 @
Arnos Rd
OR 99 @
Creel Rd
OR 99 @
Talent Ave/Old Pacific Hwy
16
55
52
5
17
20
35
160 170 180
52
5
53
0
18
50 20 0
40
79
0
35
75
5
20
77
0
40 15 20
TEV: 1460 TEV: 1390 TEV: 1395
OR 99 @
S Valley View Rd
19
35
43
0
80
190 80
30
13
14
15
16
18 sbt
SERSETSEL sbl
ebl NWLnwt nwr
ebt
ebr
N
B
S
B NB OR 99 (Bear Creek Dr) @ Oak St
35
43
0
80 30
555
30
30 45
72
0
54
0
40
TEV: 2615
13
14
15
16
18
19
TEV: Total Entering Volume *
### PM Peak Hour Volume
Turning Movement
OR 99 Corridor Plan
Legend: Figure 4-1 South
Diagrams show OR 99 as the north and
south legs of study intersections throughout Future (2034) Baseline Scenario
Turning Movement Volumes
PM Peak Hour
13
14
15
16
18
19
Printed: 10/17/2011
WBR SWR wbr
WBT SWT wbt
SERSETSEL WBL SERSETSEL SWL SERSETSEL wbl
EBL NWLnwt nwr NEL NWLnwt nwr ebl NWLnwt nwr
WBT NET ebt
EBR NER ebr
OR 99 @
Garfield Street*
OR 99 @
Lowry Ln
OR 99 @
Bear Creek Corp Dr
1
70
69
5
21
5
2
5 10
60
11
65
30
10 115 20 130 30 30
485 5 10
415 120 35
12
0
3
25
45 45 130
485 45
63
5
49
0 0 10
99
0
11
5 5 10
95
5
20
70 40 35
TEV: 3765 TEV: 2640 TEV: 24501
SWR WBR SBR
SWT WBT SBT
SERSETSEL SWL SERSETSEL WBL SERSETSEL SBL
NEL NWLnwt nwr EBL NWLnwt nwr NEL NWLnwt nwr
NET EBT NET
NER EBR NER
swr SWR SWR
swt wbt SWT
OR 99 @
South Stage Rd
OR 99 @
Fern Valley Rd
OR 99 @
Bolz Rd
4
27
5
89
5
65
5
25
11
55
11
00
43
0
40 60 50 305 60
45 50
50 370
6
75
120 70 5
30
26
5
80
5
60
25
75
5 5 15
76
5
40
5
235 75 40
TEV: 2905 TEV: 2830 TEV: 2840
SB OR 99 (N Main St) @
4th St
NB OR 99 (Bear Creek Dr) @
4th St
SB OR 99 (N Main St) @
1st St
7
60
10
05
75
8
35
70 80 90
30 25
9
21
0
82
0
1
4
2
3
swt wbt SWT
SERSETSEL swl SERSETsel wbl SERSETSEL SWL
ebl NWLnwt nwr nel wbl wbt wbr NEL NWLnwt nwr
net nwt NET
ner nwr NER
SWR SWR SWR
SWT WBT SWT
SERSETSEL SWL SERSETSEL WBL SERSETSEL SWL
NEL NWLnwt nwr NEL NWLnwt nwr EBL NBLNBTNBR
60
10
05
75
3530 2521
0
82
0
30 25
150
75 60
10
35 140
30 30
TEV: 1305 TEV: 1245 TEV: 1285
NB OR 99 (Bear Creek Dr) @
1st St
SB OR 99 (N Main St) @
Oak St
NB OR 99 (Bear Creek Dr) @
Oak St
10 11
70
79
0
15
12
10
100 110 120
30
175 60
N
1
4
2
3
5
6
7
8
10
129
11
NEL NWLnwt nwr NEL NWLnwt nwr EBL NBLNBTNBR
NET EBT NET
NER EBR NER
TEV: Total Entering Volume *
### PM Peak Hour Volume
Turning Movement
92
0 45 40
91
5
175 60
50
25
TEV: 1145 TEV: 985 TEV: 1015
OR 99 Corridor Plan
Legend: Figure 4-2 North
Diagrams show OR 99 as the north and
south legs of study intersections throughout Future (2034) Baseline Sensitivity Scenario
Turning Movement Volumes
PM Peak Hour
N
1
4
2
3
5
6
7
8
10
129
11
Printed: 10/17/2011

O
R
wbr wbr SWR
wbt wbt SWT
SERSETSEL wbl SERSETSEL wbl SERSETSEL SWL
ebl NWLnwt nwr ebl NWLnwt nwr NEL NWLnwt nwr
ebt ebt NET
ebr ebr NER
51
0
30
14
75
38
5
130 10 140 225 150
OR 99 @
Colver/Suncrest Rd*
OR 99 @
W Valley View Rd
OR 99 @
Rapp Rd
13
28
5
20
5
15
20
0
51
5
72
0
15 220 85
15 315
35 270
20
5
72
5
230 50 235
30
14
0
120 60 155
TEV: 2140 TEV: 2765 TEV:
58
5
29
0
2035
13
O
R
SWR SWR SWR
SWT SWT SWT
SERSETSEL SWL SERSETSEL SWL SERSETSEL SWL
NEL NWLnwt nwr NEL NWLnwt nwr NEL NWLnwt nwr
NET NET NET
NER NER NER
S
B
S
B
sbr
sbt
OR 99 @
Arnos Rd
OR 99 @
Creel Rd
OR 99 @
Talent Ave/Old Pacific Hwy
16
65
60
5
17
40
160 170 180
61
0
18
30
60
5
60 25 0
40
87
0
25
88
5
40
91
0
45 15 25
TEV: 1685 TEV: 1600 TEV: 1610
OR 99 @
S Valley View Rd
19
40
49
5
90
190 85
35
13
14
15
16
18 sbt
SERSETSEL sbl
ebl NWLnwt nwr
ebt
ebr
N
B
S
B NB OR 99 (Bear Creek Dr) @ Oak St
40
49
5
90 35
640
35
35 50
83
0
62
0
45
TEV: 3000
13
14
15
16
18
19
TEV: Total Entering Volume *
### PM Peak Hour Volume
Turning Movement
Future (2034) Baseline Sensitivity Scenario
Turning Movement Volumes
PM Peak Hour
OR 99 Corridor Plan
Legend: Figure 4-2 South
Diagrams show OR 99 as the north and
south legs of study intersections throughout
13
14
15
16
18
19
Printed: 10/17/2011

WBR SWR SWR
WBT SWR SWTR
SERSETSEL WBL SERSETRSEL SWLT SERSETRSEL SWL
EBL NWLnwTnwr NELT NWLNWTRnwr NEL NWLNWTRnwr
EBTR NER NELT
EBR NER NER
OR 99 @
Garfield Street*
OR 99 @
Lowry Ln
OR 99 @
Bear Creek Corp Dr
1
0.0
4 /
B
0.5
/ C
0.5
4 /
D 2
0.4
5 /
A
0.76 / C 0.08 / C 0.09 / D
0.77 / D 0.68 / D 0.27 / D
0.6
7 /
D 3
0.4
4 /
A
0.0
6 /
A
0.81 / F 0.27 / D 0.55 / D
10 0.07 / B 20 30
V/C = 0.46 LOS = A
0.57 / D
0.0
4 /
A
0.3
8 /
A
0.02 / D
0.34 / C
1.1
1 /
F
0.5
9 /
C
0.3
/ C 0.03 / C
0.6
5 /
F
0.5
4 /
A
V/C = 0.65 LOS = C V/C = 0.58 LOS = B
1
SWR WBR SBR
SWTR WBTR SBT
SERSETRSEL SWL SERSETRSEL WBL SERSETRSEL SBL
NEL NWLNWTRNWR EBL NWLNWTRNWR NEL NWLNWTNWR
NETR EBTR NEL
NER EBR NER
sWR SWR SWR
sWt Wbt SWT
OR 99 @
South Stage Rd
OR 99 @
Fern Valley Rd
OR 99 @
Bolz Rd4
0.7
3 /
B
0.1
4 /
B 5
0.5
8 /
A
0.53 / C 0.07 / C 0.19 / C
0.19 / C 0.11 / B
0.41 / C 0.58 / C
6
0.4
9 /
A
0.5
6 /
B
40 50 60
0.6
4 /
B 0.01 / B
0.7
8 /
F
LOS = B
SB OR 99 (N Main St) @
4th St
NB OR 99 (Bear Creek Dr) @
4th St
SB OR 99 (N Main St) @
1st St
0.02 / D
V/C = 0.75 LOS = C V/C = 0.55 LOS = B V/C = 0.56
0.3
2 /
A
1.4
5 /
F
0.4
7 /
A
0.2
4 /
A0.26 / C
0.8
6 /
D
70 80 90
7
0.3
4 /
A
0.0
5 /
A 8 9
0.3
5 /
A
0.0
2 /
A
1
4
2
3
sWt Wbt SWT
SERSETRSELT SWLT SERSETsEL WbL SERSETRSELT SWLT
EbL NWLNWtNWR NEL WBLTWbtWbR NEL NWLNWtNWR
NETR NWt NETR
NER NWR NER
SWR SWR SWR
SWT WBT SWT
SERSETSEL SWL SERSETRSELT WBLT SERSETSEL SWL
NEL NWLTNWtNWR NEL NWLNWtNWR EBL NBLTNBTNBR
NET EBTR NET
0.3
4 /
A
0.0
5 /
A
0.3
5 /
A
0.0
2 /
A
0.35 / E 0.23 / D
0.31 / C
0.5 / E
0.0
3 /
A
V/C = 0.5
0.59 / E
LOS = E V/C = 0.31 LOS = C V/C = 0.59 LOS = E
NB OR 99 (Bear Creek Dr) @
1st St
SB OR 99 (N Main St) @
Oak St
NB OR 99 (Bear Creek Dr) @
Oak St10 11
0.2
6 /
A
100 110 120
0.0
1 /
A 12
0.12 / C
0.3
3 /
A
0.33 / A 0.11 / B
0.0
3 /
A 0.16 / C
N
1
4
2
3
56
7
8
10
129
11
NET EBTR NET
NER EBR NER
Traffic Signal V/C: Volume to Capacity Ratio Existing Lane Configuration
Stop Sign LOS: Level of Service *
0.3
3 /
A
0.0
3 /
A 0.16 / C
V/C = 0.33 LOS = A V/C = 0.16 LOS = C V/C = 0.11 LOS = B
OR 99 Corridor Plan
Legend: Figure 4-3 North
Diagrams show OR 99 as the north and
south legs of study intersections
Future (2034) Baseline Scenario
Lane Configurations & Intersection Operations
PM Peak Hour
N
1
4
2
3
56
7
8
10
129
11
Printed: 10/17/2011

O
R
WBR WBR SWR
WBLTR WBT SWT
SERSETRSEL WBL SERSETRSEL WBL SERSETRSEL SWL
EBL NWLNWTRNWR EBL NWLNWTRNWR NEL NWLNWTNWR
EBTR EBTR NELR
EBR EBR NER
130 140 0.14 / B 150
OR 99 @
Colver/Suncrest Rd*
OR 99 @
W Valley View Rd
OR 99 @
Rapp Rd
13
0.5
9 / B
0.1
1 / B
14
0.5
/ B
0.14 / B 0.5 / B
0.78 / C
1.7
2 / F
15
0.6
2 / B
0.6
6 / C
0.3
7 / A
0.66 / C 0.16 / B
0.14 / B
0.3
/ A
0.4
4 / A 0.42 / B
0.3
2 / C
V/C = 0.57 LOS = B V/C = 0.83 LOS = D V/C = 0.67
0.7
/ B 0.74 / C
LOS = B13
O
R
SWR SWR SWR
SWT SWT SWT
SERSETRSEL SWL SERSETRSEL SWL SERSETRSEL SWL
NEL NWLNWLTNWR NEL NWLNWLTNWR NEL NWLNWLTNWR
NELR NELR NELR
NER NER NER
S
B
S
B
sBR
SBLTR
V/C = 0.57 LOS = B V/C = 0.83 LOS = D V/C = 0.67 LOS = B
OR 99 @
Arnos Rd
OR 99 @
Creel Rd
OR 99 @
Talent Ave/Old Pacific Hwy
16
0.2
1 / A
17
160 170 180
0.2
2 / A
18
0.1
2 / A
0.3
/ A 0.11 / C
LOS = B
OR 99 @
S Valley View Rd
V/C = 0.29 LOS = C V/C = 0.11 LOS = C V/C = 0.04
0.0
2 / A 0.04 / B
0.3
3 / A0.29 / C
19
0.5
4 / D
0.5
6 / C
190
0.98 / E
13
14
15
16
18SBLTR
SERSETSEL SBLR
NEL NWLNWTNWR
NBLT
NBR
N
B
S
B NB OR 99 (Bear Creek Dr) @ Oak St
0.5
4 / D
0.5
6 / C
0.98 / E
V/C = 0.87 LOS = D
0.5 / E
0.2
2 / C
0.8
7 / D
0.7
2 / D
0.03 / C
13
14
15
16
18
19
Traffic Signal V/C: Volume to Capacity Ratio Existing Lane Configuration
Stop Sign LOS: Level of Service *Future (2034) Baseline Scenario
Lane Configurations & Intersection Operations
PM Peak Hour
OR 99 Corridor Plan
Legend: Figure 4-3 South
Diagrams show OR 99 as the north and
south legs of study intersections
13
14
15
16
18
19
Printed: 10/17/2011

WBR SWR SWR
WBT SWR SWTR
SERSETSEL WBL SERSETRSEL SWLT SERSETRSEL SWL
EBL NWLnwTnwr NELT NWLNWTRnwr NEL NWLNWTRnwr
EBTR NER NELT
EBR NER NER
V/C = 0.55 LOS = A
0.6 / D
0.0
5 /
A
0.4
6 /
A
0.03 / D
0.37 / C
0.8
2 /
F
0.7
/ C
0.3
7 /
C 0.03 / C
5.5
/ F
0.6
8 /
B
V/C = 0.75 LOS = D V/C = 0.66 LOS = C
0.9 / E 0.69 / D 0.3 / D
0.5
7 /
D 3
0.5
2 /
A
0.0
8 /
A
0.78 / F 0.23 / C 0.59 / D
10 0.06 / C 20 30
OR 99 @
Garfield Street*
OR 99 @
Lowry Ln
OR 99 @
Bear Creek Corp Dr
1
0.0
5 /
B
0.6
/ C
0.6
1 /
D 2
0.5
2 /
A
0.85 / D 0.09 / C 0.09 / D
1
SWR WBR SBR
SWTR WBTR SBT
SERSETRSEL SWL SERSETRSEL WBL SERSETRSEL SBL
NEL NWLNWTRNWR EBL NWLNWTRNWR NEL NWLNWTNWR
NETR EBTR NER
NER EBR NER
sWR SWR SWR
sWt Wbt SWT0.4
1 /
A
0.0
2 /
A
70 80 90
7
0.3
9 /
A
0.0
5 /
A 8 9
LOS = B
SB OR 99 (N Main St) @
4th St
NB OR 99 (Bear Creek Dr) @
4th St
SB OR 99 (N Main St) @
1st St
V/C = 0.78 LOS = C V/C = 0.62 LOS = B V/C = 0.61
0.3
7 /
A 0.03 / C
1.4
5 /
F
0.5
5 /
B
0.2
9 /
A0.29 / C
0.7
4 /
D
0.5
2 /
C 0.01 / C
0.6
4 /
E
0.65 / D 0.09 / C 0.18 / C
0.22 / B 0.19 / C
0.59 / D 0.61 / C
6
0.5
6 /
A
0.6
1 /
B
40 50 60
OR 99 @
South Stage Rd
OR 99 @
Fern Valley Rd
OR 99 @
Bolz Rd4
0.8
5 /
C
0.3
1 /
C 5
0.6
6 /
B
1
4
2
3
sWt Wbt SWT
SERSETRSELT SWLT SERSETsEL WbL SERSETRSELT SWLT
EbL NWLNWtNWR NEL WBLTWbtWbR NEL NWLNWtNWR
NETR NWt NETR
NER NWR NER
SWR SWR SWR
SWT WBT SWT
SERSETSEL SWL SERSETRSELT WBLT SERSETSEL SWL
NEL NWLTNWtNWR NEL NWLNWtNWR EBL NBLTNBTNBR
NET EBTR NET
0.43 / C 0.14 / B
0.3
8 /
A 0.24 / C
0.17 / C
0.3
8 /
A
10 11
0.3
/ A100 110 120
0.0
1 /
A 12
LOS = F V/C = 0.42 LOS = C V/C = 0.83 LOS = F
NB OR 99 (Bear Creek Dr) @
1st St
SB OR 99 (N Main St) @
Oak St
NB OR 99 (Bear Creek Dr) @
Oak St
0.42 / C
0.73 / F
0.4
3 /
A
V/C = 0.73
0.83 / F
0.4
1 /
A
0.0
2 /
A
0.63 / F 0.39 / E
0.3
9 /
A
0.0
5 /
A
N
1
4
2
3
56
7
8
10
129
11
NET EBTR NET
NER EBR NER
Traffic Signal V/C: Volume to Capacity Ratio Existing Lane Configuration
Stop Sign LOS: Level of Service *
OR 99 Corridor Plan
Legend: Figure 4-4 North
Diagrams show OR 99 as the north and
south legs of study intersections
Future (2034) Baseline Sensitivity Scenario
Lane Configurations & Intersection Operations
PM Peak Hour
V/C = 0.43 LOS = C V/C = 0.24 LOS = C V/C = 0.14 LOS = B
0.3
8 /
A 0.24 / C
0.3
8 /
A
N
1
4
2
3
56
7
8
10
129
11
Printed: 10/17/2011

O
R
WBR WBR SWR
WBLTR WBT SWT
SERSETRSEL WBL SERSETRSEL WBL SERSETRSEL SWL
EBL NWLNWTRNWR EBL NWLNWTRNWR NEL NWLNWTNWR
EBTR EBTR NELR
EBR EBR NER
V/C = 0.63 LOS = B V/C = 0.93 LOS = C V/C = 0.76
0.8
9 / D 0.8 / C
LOS = C
0.7 / C 0.2 / B
0.16 / B
0.4
1 / B
0.5
1 / B 0.47 / C
0.6
4 / D
0.98 / E
0.9
/ E
15
0.7
/ C
0.8
2 / D
0.4
2 / A
130 140 0.16 / B 150
OR 99 @
Colver/Suncrest Rd*
OR 99 @
W Valley View Rd
OR 99 @
Rapp Rd
13
0.6
4 / B
0.1
3 / B
14
0.4
/ B
0.14 / B 0.53 / C
13
O
R
SWR SWR SWR
SWT SWT SWT
SERSETRSEL SWL SERSETRSEL SWL SERSETRSEL SWL
NEL NWLNWLTNWR NEL NWLNWLTNWR NEL NWLNWLTNWR
NELR NELR NELR
NER NER NER
S
B
S
B
sBR
sbltr
19
0.6
3 / D
0.6
1 / D
190
1.14 / F
LOS = B
OR 99 @
S Valley View Rd
V/C = 0.39 LOS = D V/C = 0.18 LOS = C V/C = 0.03
0.3
6 / A 0.03 / B
0.3
8 / A0.39 / D
0.3
5 / A 0.18 / C
OR 99 @
Arnos Rd
OR 99 @
Creel Rd
OR 99 @
Talent Ave/Old Pacific Hwy
16
0.2
4 / A
17
160 170 180
0.2
5 / A
18
0.1
4 / A
13
14
15
16
18sbltr
SERSETSEL SBLR
NEL NWLNWTNWR
NBLT
NBR
N
B
S
B NB OR 99 (Bear Creek Dr) @ Oak St
V/C = 1.01 LOS = E
0.55 / E
0.2
7 / C
1.0
1 / E
0.9
2 / E
0.03 / C
0.6
3 / D
0.6
1 / D
1.14 / F
13
14
15
16
18
19
Traffic Signal V/C: Volume to Capacity Ratio Existing Lane Configuration
Stop Sign LOS: Level of Service *Future (2034) Baseline Sensitivity Scenario
Lane Configurations & Intersection Operations
PM Peak Hour
OR 99 Corridor Plan
Legend: Figure 4-4 South
Diagrams show OR 99 as the north and
south legs of study intersections
13
14
15
16
18
19
Printed: 10/17/2011