options trade analyzer
TRANSCRIPT

quotemedia
Options Trade AnalyzerCompetitive Advantage in Options Trading
Our Trade A.I. platform allows traders to receive comprehensive probability analysis and make trade decisions based on calculated risk assessments

Options Trade Analyzer
Options Trade Analyzer comprise of several tools that will satisfy traders of all different stripes.
Build and Analyze a Trade
A trader has the ability to build and analyze any multi-leg trades by selecting Buy/Sell on the Option Matrix.
Trading Ideas
Scans the market in real-time and provides several lists of ideas to help traders with starting points in finding profitable trades.
Probability Matrix
For Covered Call / Put writers, who want to create cash flow out of an existing stock portfolio and simultaneously not be called out of their positions, comprehensive probability analysis for each individual strike, using the Probability Matrix, is imperative.

There are over 4000 optionable stocks that provide traders access to generate millions of options trades. With all of these opportunities, most options traders have a real challenge in finding the right trades.
The Trading Ideas analysis helps to solve this problem
Trading Ideas: Overview
The Starting Point in Building Your Options Trade
Probability Arbitrage
Probability Arbitrage is a method that takes into account discrepancies between the most commonly used probability type, Theoretical Probability (which is based on the assumption that the underlying asset has a Normal distribution) and our newly introduced… Historical and Stress Test Probabilities.
Scans through all optionable stocks that have approaching earnings announcements, and builds options trades that have a high probability of success, and a high expectation of profit.
Earnings Ideas
Trading Ideas : Overview
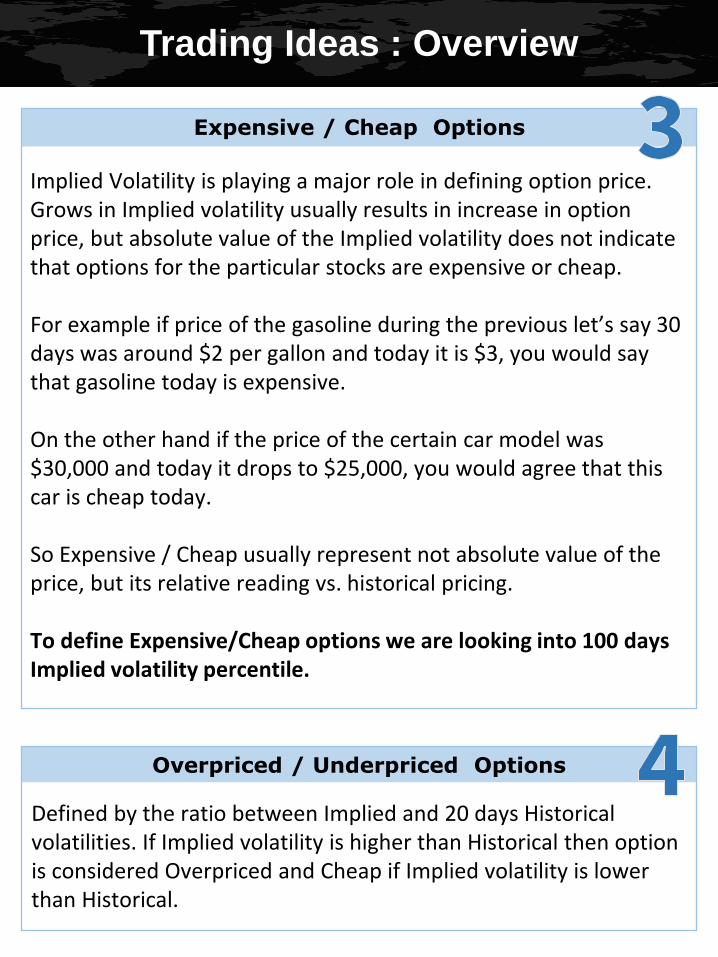
Expensive / Cheap Options
Implied Volatility is playing a major role in defining option price. Grows in Implied volatility usually results in increase in option price, but absolute value of the Implied volatility does not indicate that options for the particular stocks are expensive or cheap.
For example if price of the gasoline during the previous let’s say 30 days was around $2 per gallon and today it is $3, you would say that gasoline today is expensive.
On the other hand if the price of the certain car model was $30,000 and today it drops to $25,000, you would agree that this car is cheap today.
So Expensive / Cheap usually represent not absolute value of the price, but its relative reading vs. historical pricing.
To define Expensive/Cheap options we are looking into 100 days Implied volatility percentile.
Overpriced / Underpriced Options
Defined by the ratio between Implied and 20 days Historical volatilities. If Implied volatility is higher than Historical then option is considered Overpriced and Cheap if Implied volatility is lower than Historical.

Trading Ideas: Overview
Oversold / Overbought Stocks
This Trading Ideas are based on comparison of the price trend for the last three months and our prediction of the future price move based on the probabilistic analysis and options sentiment.
If past trend is indicating down move and our prediction of future stock behavior is indicating up move then we assuming that stock is oversold and poised to an up move.
If past trend is indicating up move and our prediction of future stock behavior is indicating down move then we assuming that stock is overbought and poised to a down move.
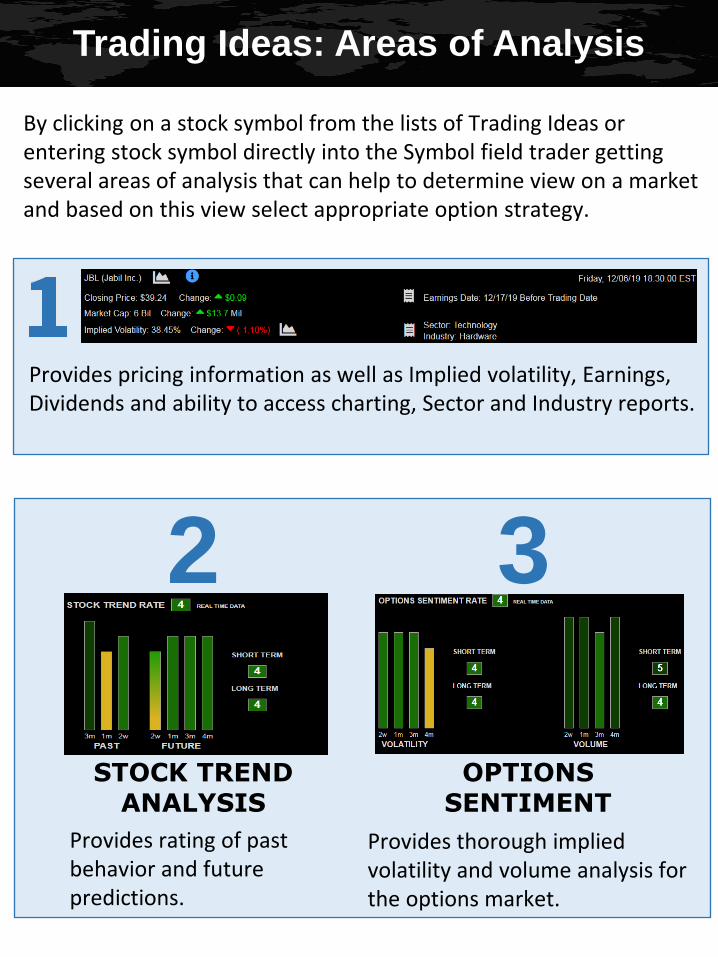
By clicking on a stock symbol from the lists of Trading Ideas or entering stock symbol directly into the Symbol field trader getting several areas of analysis that can help to determine view on a market and based on this view select appropriate option strategy.
Trading Ideas: Areas of Analysis
2 3
STOCK TREND ANALYSIS
OPTIONSSENTIMENT
Provides rating of past behavior and future predictions.
Provides thorough implied volatility and volume analysis for the options market.
Provides pricing information as well as Implied volatility, Earnings, Dividends and ability to access charting, Sector and Industry reports.

Trading Ideas: Option Strategies
Strategies to consider depending on what you anticipate:
Short Put or Put Credit Spread
Anticipate Stock in a Certain Price Range
Call Credit Spreads
Iron Condor
Anticipate a
Stock Going Up
Anticipate a Stock
Going Down
Option trades are built for the different perceptions of the future underlying asset behavior.

Trading Ideas: Success Rate
Success Rate that we are providing in options trade analysis depicts multi-prong approach in assessing probability and mitigating risk.
To drill in on its value hover mouse over to see all components of Success Rate value.
None of these probabilities are better than another. Yet, if they are all lined up, then it is giving you a competitive advantage through a more comprehensive view on your risk assessment.
You can visualize probability by clicking on its values.

Trading Ideas: Probability Visualization

Trading Ideas: Stock Fundamentals
With this application, traders are continuously analyzing individual stocks to understand behavior trends over time. The drill down analytic capability and charting offered is unparalleled to any other platform in the industry.
To get comprehensive Stock Fundamentals, hover over this icon
Hovering over certain fields allows also to get Help tips.
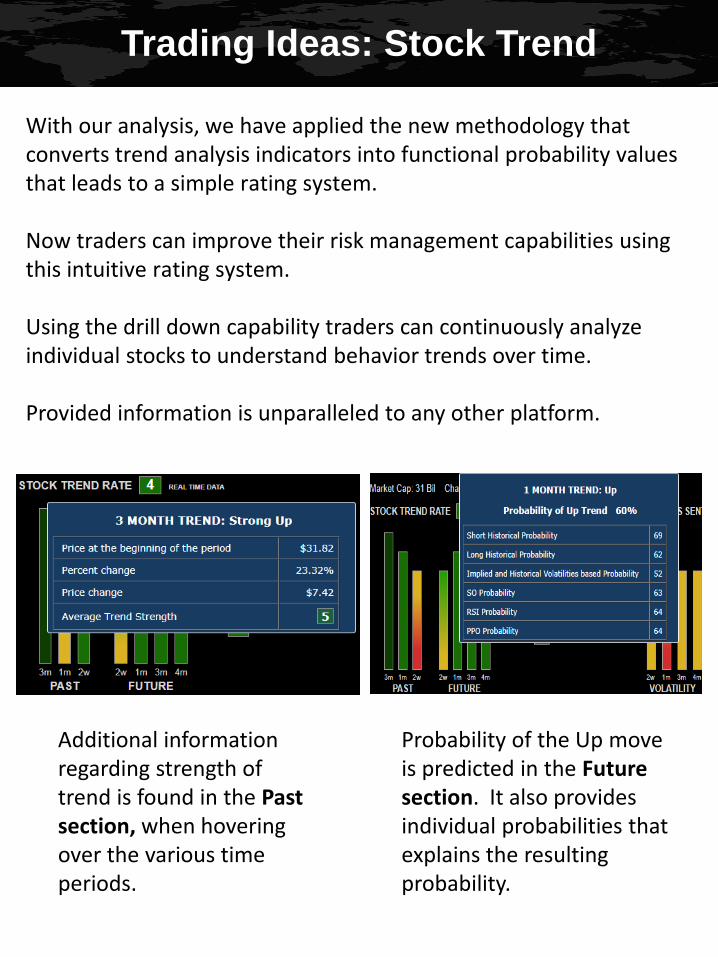
Trading Ideas: Stock Trend
With our analysis, we have applied the new methodology that converts trend analysis indicators into functional probability values that leads to a simple rating system.
Now traders can improve their risk management capabilities using this intuitive rating system.
Using the drill down capability traders can continuously analyze individual stocks to understand behavior trends over time.
Provided information is unparalleled to any other platform.
Additional information regarding strength of trend is found in the Past section, when hovering over the various time periods.
Probability of the Up move is predicted in the Future section. It also provides individual probabilities that explains the resulting probability.
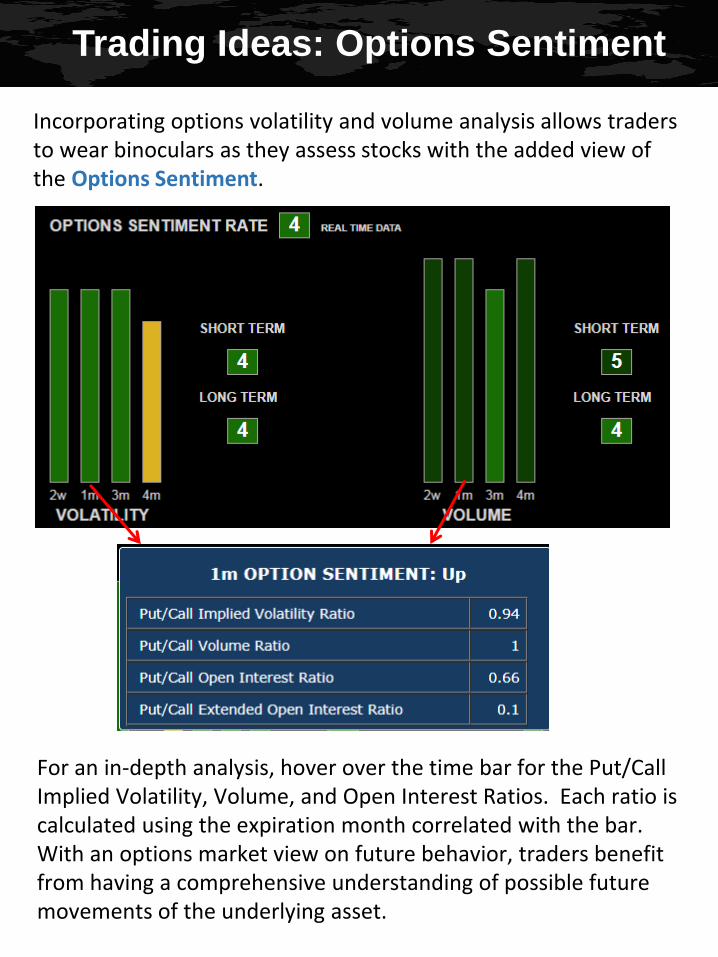
Trading Ideas: Options Sentiment
Incorporating options volatility and volume analysis allows traders to wear binoculars as they assess stocks with the added view of the Options Sentiment.
For an in-depth analysis, hover over the time bar for the Put/Call Implied Volatility, Volume, and Open Interest Ratios. Each ratio is calculated using the expiration month correlated with the bar. With an options market view on future behavior, traders benefit from having a comprehensive understanding of possible future movements of the underlying asset.

Trading Ideas: Sector and Industry
To get Sector and Industry analysis click on
By clicking on a single stock symbol in these tables, traders can access the full analysis of that particular stock.
To obtain Earnings Report click on

Trading Ideas: Charting
To access charts click on the chart icon:
Sector Comparison Chart
This depicts by default day-by-day 90% projections of the stock price not reaching the Upper or Bottom band.
This chart depicts the percent growth of an individual stock compared to its industry and sector.
Price Trajectory Chart
In the Price Trajectory Chart, a stock with its earnings date in the near future is based on earnings historical readings. While a stock with earning that are not in the near future, is based on ranges of historical readings.

Build Your Own
If a trader wants to customize the option trade presented in Trading Ideas section based on one’s own risk tolerance level and preferred timeframe, the Build Your Own tool can be used.
A trader has the ability to build and analyze any multi-leg trades by selecting Buy/Sell in the Option Matrix.
The results table facilities a trade analysis for the trader using multiple probabilities for better comprehension of the risk associated with the trade.

Build Your Own
The Build Your Own tool also has a very valuable educational feature called Time Machine. This feature allows a trader to select a date from the day-by-day historical options database (with 10 years of history) build a trade and then analyze it. This feature allows also to recreate real trade that was taken by changing options and stock prices that were at the time of the trade execution.
Back test analysis chart depicts your trade from inception till expiration. Trader can view day-by-day stock and options closing prices, daily profit and probability values. This provides invaluable opportunity to learn how to manage your trade.

Build Your Own
In Build Your Own and Probability Matrix tools, the trader can also click on the following area to get a comprehensive Options Overview Report.
Hovering over the title fields of the report table provides a more in-depth description of the information provided.
This report helps to get a better understanding of how very important options characteristics such as implied volatility, yield to strike price, theta and volumes are skewed through all expiration months. This helps traders to select an expiration month to build their trade.
Our proprietary indicators of “Open Interest Skew” allow one to immediately see how option traders view the market and where the most betting in options trading for each month is concentrated.

Build Your Own
To dive in and get more information out of the different fields in this table user can hover over them.

Build Your Own
Options Sentiment Overview Report provides unique information on how options market see future stock performance.

The Probability Matrix
Right Side
Represents the option chain comprised of:
• Expiration Month• Strike Price, Option Prices• Additional data of interest
for those selling calls against existing portfolios to improve their cash flow.
Represents comprehensive probability analysis for each individual strike.
Each color-coded probability value relates to its correlated chart. To view the chart, click on the probability value.
Left Side
Combining a familiar option chain display with a unique multi-pronged view on probability not available elsewhere.