options for monitoring forest degradation in …
TRANSCRIPT

i
OPTIONS FOR MONITORING FOREST DEGRADATION
IN NORTHERN VIET NAM:
AN ASSESSMENT IN SYSTEMS DESIGN AND
CAPACITY BUILDING NEEDS IN
CON CUONG DISTRICT, NGHE AN PROVINCE
June 20, 2013

Preamble
The Lowering Emissions in Asia’s Forests (LEAF) Program, a five‐year cooperative agreement, is funded by the United States Agency for International Development’s (USAID) Regional Development Mission for Asia (RDMA). LEAF is being implemented by Winrock International (Winrock), in partnership with SNV – Netherlands Development Organization, Climate Focus and The Center for People and Forests (RECOFTC). The LEAF program began in January 2011 and will continue until January 2016.
The US Forest Service International Programs (USFS/IP) collaborates with governmental and non‐governmental partners to share best practices and act as an advocate for US interests abroad. The USFS/IP draws on the expertise of the entire agency– National Forest Systems, Research and Development and State and Private Forestry – promoting sustainable forest management overseas and bringing important technologies and innovations back to the United States. The USFS/IP was requested by LEAF and USAID/RDMA to lead in the development of options for identifying and developing forest monitoring methodologies that can estimate greenhouse gas emissions from forest degradation. The key objectives and outcomes of the LEAF/USFS partnership include:
Assessing forest degradation drivers and monitoring options at the sub‐national level in Lao PDR, Vietnam, and Cambodia. The short, one‐month field assessments were completed in the first half of 2012;
Convening a regional forest monitoring experts’ workshop to discuss lessons learned from the sub‐national assessments and operational aspects of various forest degradation monitoring approaches, highlighting potentially successful approaches given existing drivers. This workshop was held in Bangkok in November 2012; and
Communicating results of these activities and regional lessons learned to develop forest degradation monitoring demonstration programs and strengthen capacity in partner countries and regional institutions. This report contributes to this objective.
All three country reports have received extensive reviews from a range of technical experts associated with the LEAF project (including Winrock International experts), USFS and subsidiary projects such as SilvaCarbon, USAID country missions (except in Lao PDR) and relevant USAID bilateral projects such as the Vietnam Forests and Deltas project. However any inadvertent errors or omissions remain the responsibility of the authors and do not reflect the views or comments of the reviewers. While every effort was made to collaborate with Government counterparts in the design, implementation and reporting of this work, this report does not constitute endorsement or a reflection of the host government’s perceptions or opinions on the technically and politically difficult task of monitoring forest degradation. The country reports were produced as part of LEAF’s early in‐country scoping efforts to help design LEAF’s field interventions as well as collectively contributing to the expanding regional knowledge base on forest degradation monitoring options.

ii
Contents
Authors .......................................................................................................................................................... ii
Acronyms ..................................................................................................................................................... iii
Executive Summary ................................................................................................................................... - 1 -
1. Introduction .............................................................................................................................................. 1
2. REDD+ Best Practices and Monitoring Requirements .............................................................................. 2
3. Con Cuong Environmental and Social Characteristics ............................................................................ 11
4. Con Cuong Forest Monitoring Activities and Field Assessment ............................................................. 15
5. Forest Degradation and Drivers in Con Cuong ........................................................................................ 18
6. Sampling Design Foundations for Forest Monitoring ............................................................................. 22
7. Monitoring Design Recommendations .................................................................................................. 27
8. Summary of Monitoring Recommendations .......................................................................................... 33
9. Capacity Building ..................................................................................................................................... 35
10. Next Steps ………………………………………………………………………………………………………………………………………37
11. Literature Cited ..................................................................................................................................... 39
Annexes…………………………………………………………………………………………………………………………………………………42
Authors
Patricia N. Manley, U.S. Forest Service, Pacific Southwest Research Station, 2480 Carson Road,
Placerville, CA 95667, [email protected]
Leif Mortenson, U.S. Forest Service, Pacific Northwest Research Station, 620 SW Main St. Suite 400,
Portland, OR 97205, [email protected]
James J. Halperin, Center for International Forestry Research, Lusaka, Zambia, [email protected],
Nguyen Hanh Quyen, SNV LEAF Team. Hanoi, Viet Nam, [email protected]

iii
Acronyms
AFOLU
ba
Agriculture and Other Land Use
basal area
CCC Carbon Carrying Capacity
CIFOR Center for International Forestry Research
CCSFC Con Cuong State Forest Company
LtHP Converting Low Productivity to High Productivity Forest
CCS Current Carbon Stock
DARD Department of Agriculture and Rural Development
dbh diameter at breast height
ERA Extended Rotation Age/Cutting Cycle
FAO Food and Agriculture Organization
FCPF/RPP Forest Carbon Partnership Fund / Readiness Preparation Proposal
FIPI Forest Inventory and Planning Institute
GIS Geographic Information Systems
GOFC GOLD Global Observation of Forest and Land Cover Dynamics
GPS Global Positioning System
ICS Improved Cookstove
IFM Improved Forest Management
IPCC Intergovernmental Panel on Climate Change
JAFTA Japan Forest Technology Association
JICA Japan International Cooperation Agency
JOFCA Japan Overseas Forestry Consultants Association
LiDAR Light Detection And Ranging
LtPF Logged to Protected Forest
LEAF Lowering Emissions in Asia's Forests
LMS Land Monitoring System
MAB Man and the Biosphere
MARD Ministry of Agriculture and Rural Development
MRV Monitoring, Reporting, and Verification
NFA National Forest Assessment (abbreviation of the Support to National Assessment and
Long Term Monitoring of the Forest and Tree Resources Project)
NFI National Forest Inventory
NORDECO Nordic Agency for Development and Ecology
SNV Netherlands Development Organisation
NTFP Non-Timber Forest Products
PFM Participatory Forest Monitoring
PFMB Protection Forest Management Board
RIL Reduced Impact Logging
REDD+ Reducing Emissions from Deforestation and forest Degradation
RCS Reference Carbon Stock
REL Reference Emission Level

iv
STI Space Technology Institute
SLFM Standardized Local Forest Measurements
TCG Terrestrial Carbon Group
UNREDD United Nations Collaborative Programme on Reduced Emissions from Deforestation
and Degradation in Developing Countries
UNESCO United Nations Educational, Scientific and Cultural Organization
UNFCCC United Nations Framework Convention on Climate Change
USAID/RDMA United States Agency for International Development / Regional Development Mission for Asia
USFS United States Forest Service
VCS Verified Carbon Standard
VNFOREST Viet Nam Administration of Forestry

- 1 -
Executive Summary
Introduction
Changes in forest carbon stocks can be detected through monitoring of deforestation (conversion of
forests to some other cover type), forest degradation (forests that remain forests), and/or reforestation
(restoration of forests). Techniques for monitoring deforestation and resultant changes to forest carbon
stocks are widespread and well published. However, techniques for monitoring degradation and
reforestation are relatively untested in developing countries despite their inclusion in current UNFCCC
REDD+ negotiations.
Globally, there are very few examples of operational monitoring systems designed to detect forest
degradation. In short, degradation is direct human-induced activity that leads to a long-term reduction
in forest carbon stocks in forests that remain forests through time (IPCC 2003).
Most globally established definitions of degradation reflect a negative change in the forest’s structure,
function and capacity to provide goods and services (Wertz-Kanounnikoff 2008). The lack of successfully
implemented monitoring systems is largely a function of the significant technical and financial capacity
required to design and implement such systems. Key elements of a successful monitoring system
include clearly established monitoring objectives and protocols, trained staff and funding to collect
reliable data, a baseline from which to assess change, analysis, and reporting.
The United States Agency for International Development/Regional Development Mission for Asia’s
(USAID/RDMA) program called Lowering Emissions in Asia’s Forests (LEAF) is addressing these issues by
requesting the United States Forest Service (USFS) to design and implement an options assessment that
may be used to guide development of monitoring strategies with its country partners in Southeast Asia.
The LEAF program is being managed by Winrock International in collaboration with Climate Focus and
SNV, and targets 6 countries in the Asia-Pacific region (Cambodia, Laos, Thailand, Viet Nam, Malaysia,
and Papua New Guinea). USFS carried out three short month- assessments in Lao PDR, Viet Nam, and
Cambodia in the first half of 2012. This document focuses on the assessment in Viet Nam, conducted in
March-April 2012 and outlines key findings, assesses various options to effectively monitor forest
degradation processes, and makes recommendations on ways LEAF and LEAF’s counterparts could move
forward collaboratively on monitoring forest degradation at demonstration sites in Viet Nam.
Specifically, this report describes accomplishments to develop options and LEAF partner capacity for
monitoring forest degradation in the Con Cuong District, Nghe An Province, in Viet Nam. The objectives
of the project were the following:
1. Assess current best practices consistent with global initiatives on monitoring forest degradation
and relevant to activities identified in Viet Nam REDD+ assessments;
2. Assess data sources and current on-the-ground activities at the pilot site level that contribute to
an expanded knowledge of above-ground forest carbon stocks;
3. Develop and evaluate options for field-based monitoring of forest degradation, with
considerations for complementarity with other monitoring methods and for cost-effectiveness,
precision, accuracy, and feasibility.

- 2 -
REDD+ Best Practices and Monitoring Requirements
Four types of monitoring are recognized as needed to implement REDD+: 1) monitoring carbon stocks,
2) monitoring REDD interventions and actions, 3) monitoring revenue disbursement, and 4) monitoring
financial transactions (UN REDD 2010). This report addresses monitoring carbon stocks and forest
quality. For the purposes of this assessment, we only focus on aboveground carbon, live tree biomass.
We recognize that other forest carbon pools (e.g., soil, litter, root masses, downed woody debris) can
also be degraded but we excluded them for this initial assessment. It was suggested by UN REDD in
their National REDD Program Strategy for Viet Nam (UN REDD 2011) to establish a “robust and
transparent national forest monitoring system, using a combination of remote sensing and ground-
based assessments for carbon inventory.” Cost-effectiveness, precision, accuracy, and feasibility were
all factors considered in the recommendations provided here. Given the short field time and the limited
monitoring already in place, this assessment is a first, rough approximation of an approach we believe
will effectively meet the needs of the Con Cuong District within the context of efforts to prepare
nationally for REDD+ implementation.
Field Assessment, Drivers, and Degradation Activities
The district of Con Cuong is in Nghe An Province of north-central Viet Nam. Con Cuong District has a land
area of approximately 175,000 ha. Land use classified as forest makes up 88.9 % of the total natural area
in Con Cuong, while 5.77% is considered agricultural land and the remainder is urban or rural
development, according to DARD. Despite the high forest cover, less than half of this area is classified as
‘rich’ or ‘medium’ forest according to Vietnamese mapping standards. Since 1995, the annual rate of
deforestation is estimated at 0.7%. Further, land cover classified as rich forest has steadily shrunk from
1995 to 2010 (going from 36% in 1995 to 16% in 2010), while low quality forest has increased (Nguyen
et al. 2012). The population of Con Cuong District is approximately 65,000 and the population density is
37 people per square kilometer (as a comparison, Nghe An Province’s population density is 177 people
per square kilometer). Official estimates (2010) are that the poverty rate in Con Cuong District is 30.7%.
In the Con Cuong District, we assessed degradation monitoring options in 4 different forested
conditions: Pu Mat National Park (special use area), Con Cuong State Forest Company (CCSFC)
Production Forest, and two Protection Forest areas (one adjacent to CCSFC lands and one adjacent to a
village).
The identification of drivers and activities associated with forest degradation was an important aspect of
the assessment, as these dictate the spatial and temporal pattern and intensity of degradation. In turn,
these attributes are important considerations for the design and implementation of an effective
degradation monitoring system. This assessment classifies drivers of forest degradation as direct
(proximate) and indirect (underlying). Direct drivers are activities occurring in the forest that directly
affect conditions. Indirect drivers can consist a myriad of factors, including poverty, land use and
economic policies, and regulations.
The primary direct driver of forest degradation was identified as tree harvest for a variety of uses:
commercial lumber (e.g., logs or cants sold for lumber or other commercial products), domestic lumber
(e.g., planks and beams for local house building), commercial fuelwood (e.g., fuel wood for crop drying
and brick making) and domestic fuelwood (e.g., fuel wood for cooking and heating). The target
diameter of tree varies among these uses, decreasing in diameter from commercial lumber, domestic
lumber, commercial fuelwood, and domestic fuelwood. This gradient from large to small diameter

- 3 -
material represents a decline in impacts on carbon and forest quality, and a decline in the ability to
detect these impacts through monitoring.
A diverse set of other activities contributed to forest degradation. Swidden agriculture (i.e., shifting
cultivation, slash-and-burn agriculture) and non-timber forest products (NTFP) gathering of items such
as medicinal plants and hunting also contribute to forest degradation and were considered as part of
this assessment. Uncontrolled fire and overgrazing are direct drivers commonly cited in Southeast Asia.
However, evidence of uncontrolled fire was not witnessed and the observed effects of grazing on forest
degradation were minimal, although grazing has been shown to limit tree regeneration in some systems
globally. Road building and hydroelectric power construction were prevalent, and these activities are
known to increase access to the forest, and thereby accelerate tree removal activities. Mining and
associated water quality impacts were also prevalent, and declines in water quality can also increase
dependence on native forest resources for food and income. Inefficient wood utilization was observed
on CCSFC lands, and improved utilization has the potential to reduce rates of carbon loss. Finally,
insufficient regulatory enforcement appeared to allow for more degradation activities than would be
likely to occur with increased enforcement. Although this suite of degradation activities were thought
to have substantial impacts on forest quality, they were determined to have a minimal contribution to
loss of carbon across Con Cuong District, as compared to other wood-based degradation activities.
Indirect drivers of forest degradation included land use regulations for family forests, housing
improvement policies, national and international market demands, and insufficient intergovernmental
coordination, market knowledge, and information sharing. For example, if local industries, such as brick-
making or tea processing, increase the demand for fuelwood (e.g.,), the opportunity for income would
be likely to increase unplanned tree removal. Similarly, increasing market values for any product will
push increased unplanned harvest, both in terms of amount and effort expended to retrieve products
(e.g., distance from access points).
Monitoring Design Parameters
The first step to assess monitoring options for estimating changes in forest carbon resulting from
degradation is to define the monitoring objectives. Broadly, these objectives are to detect, differentiate,
and quantify greenhouse gas emissions from forests that remain forests that are the result of human
activities. It is assumed that some combination of gain-loss and stock-change methods will be used to
quantify standing carbon at any given point in time and GHG emissions over some span of time
(depending on the specific scale, time, and application), thus a recommended monitoring design should
be robust enough to contribute to either inventory approach.
We recommend following the official Government of Viet Nam forest definition (crown cover ≥ 10%,
comprised of tree species whose height at maturity is ≥ 5m, and a minimum area of 0.5 ha), which will
allow for consistency of analyses with the national inventory data (FAO 2007). We suggest that forested
areas that are not converted to other uses, but do not meet these minimum criteria for ≥ 10 years,
should be considered deforested. Following this, we recommend these specific design parameters to
monitor forest condition with sufficient resolution and precision to account for degradation:
• Minimum absolute change detection of 10% crown cover for each strata of interest (in this case
the District);
• Maximum error rates for detecting change (i.e., type I and type II errors) of ≤20% , with target
rates of ≤10%;
- 4 -
• Minimum change detection of 10 t C/ha of carbon (roughly ≥ 10% loss of carbon); and
• Maximum remeasurement frequency of ≤ 4 years;
• Minimum density of 1 plot per 3000 ha;
• Minimum forested area of 0.5 ha.
Data Sources and Methods
Three sources of data are commonly identified as valuable contributors to monitoring forest extent and
condition in Asia: remote sensing, statistically rigorous field-based measurements, and Participatory
Forest Monitoring (PFM). Each has strengths and weaknesses, and there are proponents for each of
them to serve as the primary foundation of monitoring carbon, with the others serving in a support role.
Their strengths and weaknesses are largely complementary, and we suggest that all three are needed
for a robust carbon monitoring program. Remotely sensed data provide interpretations of conditions
across landscapes over time; however, they are limited in their ability to independently describe forest
structure conditions in detail. Field-based measurements can provide accurate, detailed information on
forest structure and composition, but alone they cannot efficiently provide precise estimates of carbon
densities at District or Province scales. PFM can take many forms, but in any case it is likely to provide a
valuable source of information on the occurrence of degradation activities of various types, and yet it is
unlikely to provide reliable field measurements unless closely supervised.
Remote Sensing
Investments in remote sensing are likely to have high yield (spatial coverage, repeatability) for forest
extent and enable modeled estimates of carbon. We recommend investment in the best available
imagery (although in many cases this will be limited to medium-resolution remotely sensed data , such
as Landsat or SPOT) to enable landscape-wide direct mapping of forest extent, forest type, and canopy
cover. Remotely sensed data is also essential for modeling estimates of carbon, forest structural
characteristics, and habitat values across the landscape. We recognize that canopy conditions change
rapidly, particularly in regard to regrowth, so image acquisition and interpretation is likely to require
frequent remeasurement (shorter than every 4 years) to detect some degradation activities, depending
on the density and remeasurement frequency of field measurements.
Standardized Field Measurements – National Inventory
Investments in field data measurements are most useful if designed to accomplish the following: 1)
provide data on standing biomass and growth rates for modeling growth and biomass over time 2)
provide estimates of forest structure and composition, and other measures of forest quality; and 3)
provide information on the occurrence and type of degradation activities. The current National Forest
Inventory (NFI) provides an important and valuable source of core data for describing forest type,
extent, mortality, removals, and growth at national and ecogional scales. It could be used to create
coarse-scale maps of forest extent and condition; however, a greater density of plots would be
necessary to create maps useful for informing forest policy and management at the sub-national scale.
The number and density of samples currently is too low to provide precise estimates of degradation,
forest condition, or carbon at sub-national scales (e.g., Province, District, commune). More intensive
standardized local field sampling would be needed to fulfill information needs for forest conditions at
commune, District and Province scales to meet Tier 2 or Tier 3 REDD+ monitoring requirements.

- 5 -
Standardized Field Measurements – Sub-national scale. At the sub-national scale (i.e., Province), the
implementation of standardized field measurements will be essential to assessing and monitoring the
impact of degradation on forest carbon and other condition characteristics. We recommend the use of
a systematic grid that is spatially unaligned (random plot location within each cell), in combination with
targeted stratified random sampling to adequately describe areas of rapid change, as the primary
sources of sub-national data on carbon, forest structure, and degradation intensity.
We recommend the systematic grid plots be considered permanent plots, and that they are a fixed
density that is feasible to sample and resample in its entirety. We do not recommend pre-stratification.
Although pre-stratification can be highly efficient in well-known stable systems, it can greatly increase
the complexity of selection probabilities and estimates, thus severely limiting the range of inferences
that can be made with the data in unstable landscapes (e.g., changing locations of forest, forest
allocations, intensity of forest uses) or where information needs change over time.
In extreme cases where original the stratification no longer exists, data cannot be pooled to make
inferences about conditions across a landscape – rather they are only useful as data points in developing
statistical relationships between plot and remotely sensed data, which can then be used to model
conditions across a landscape. The density of the systematic grid sampling is recommended to be a
minimum of ~ 1 plot per 3,000 ha (e.g., ~ 50 plots for the Con Cuong District, ~ 300 plots for the
Province). It may be possible to reduce this density, but it should be based on an analysis of forest
heterogeneity and expected rate and pattern of change based on empirical data (e.g., NFI or partial
implementation). A baseline set of consistent field measurement protocols should be used for all sub-
national field measurements – a subset of NFI protocols would be most beneficial to facilitate the
combination of national and sub-national data for the purposes of modeling and national-scale
inferences. Basic information collected ideally would include tree stem density, tree diameter, tree
species, canopy cover, shrub and herb cover, and degradation activity. Understory vegetation (shrubs
and herbs) is recommended for inclusion because of their value to forest quality and biodiversity.
Targeted Sample Plots
In addition to the systematic-grid, we recommend additional targeted sample plots (using the same field
methods as grid plots) be located in specific areas to meet sample size requirements for conditions ofor
concern or interest. Conditions of interest would most likely consist of sites or forest types of high risk,
high value, and/or high interest, such as less common forest types or conditions, degradation activities
of specific interest, and areas of rapid change or risk of high degradation. For example, areas identified
as high risk of degradation or otherwise expected to experience more rapid change (e.g., in proximity to
roads and villages, active commercial logging areas) would be the target for additional plots. Numerous
studies have used this technique to efficiently estimate carbon losses associated with specific types of
degradation. These strategically located plots should be placed using a stratified random sampling
technique to ensure that samples are representative of the strata (condition) of interest. The number of
these strategically located plots can vary over time and will depend on resources (time and funding) and
priorities. Thus, they are a flexible and highly efficient addition to an otherwise fixed sampling design to
address changing needs and conditions.
Participatory Forest Monitoring
We recommend that PFM be included as a valuable contributor to monitoring forest degradation and
associated driver activities. We suggest that PFM be limited to simple data collection efforts, such as
the tally of trees in diameter classes, and tally of stumps associated with degradation activities. These

- 6 -
data could be collected with limited training and equipment. Cell phone applications are readily
developed to accommodate these types of simple data collection, and the data can be uploaded
immediately to a central location for analysis. The most valuable aspect of PFM could be in engaging the
local community in assessing, protecting, understanding, and managing local forests, and thereby create
a positive feedback mechanism that decreases degradation. The educational opportunities that PFM
programs could provide to also help community members understand how they can benefit from
improved forest quality.
Statistical Modeling
Statistical analysis is an essential tool for determining status and change of natural resources over time
and across landscapes. The selection of analysis and modeling techniques are an integral part of
designing a monitoring approach. Estimates of carbon and greenhouse gas emissions can be based
directly on field data, or based on interpretations of remotely sensed data, or they can be modeled
using a wide variety of data sources. In general, conditions that are difficult to determine based on
remote sensing data alone are estimated based on predictable relationships (correlations) with
conditions that are more readily measured and quantified or mapped. For example, the degree of forest
degradation may be predictable, or at least some of the variation could be explained by examining their
relationship with more easily obtained parameters such as topography, slope, precipitation, proximity to
roads, human population densities, poverty levels, proximity to borders, etc. The relationships would be
determined using statistical analysis based on a set of representative sample points with reliable field
data on parameters of interest (e.g., biomass), and mapped data layers obtained through remote
sensing or other reliable sources. Further, determining change relative to reference levels and/or
change over time can be accomplished using any one of a number of statistical modeling approaches,
each of which has its own set of biases and sample size needs.
In summary, statistical analysis and modeling are essential tools in monitoring and reporting for REDD+.
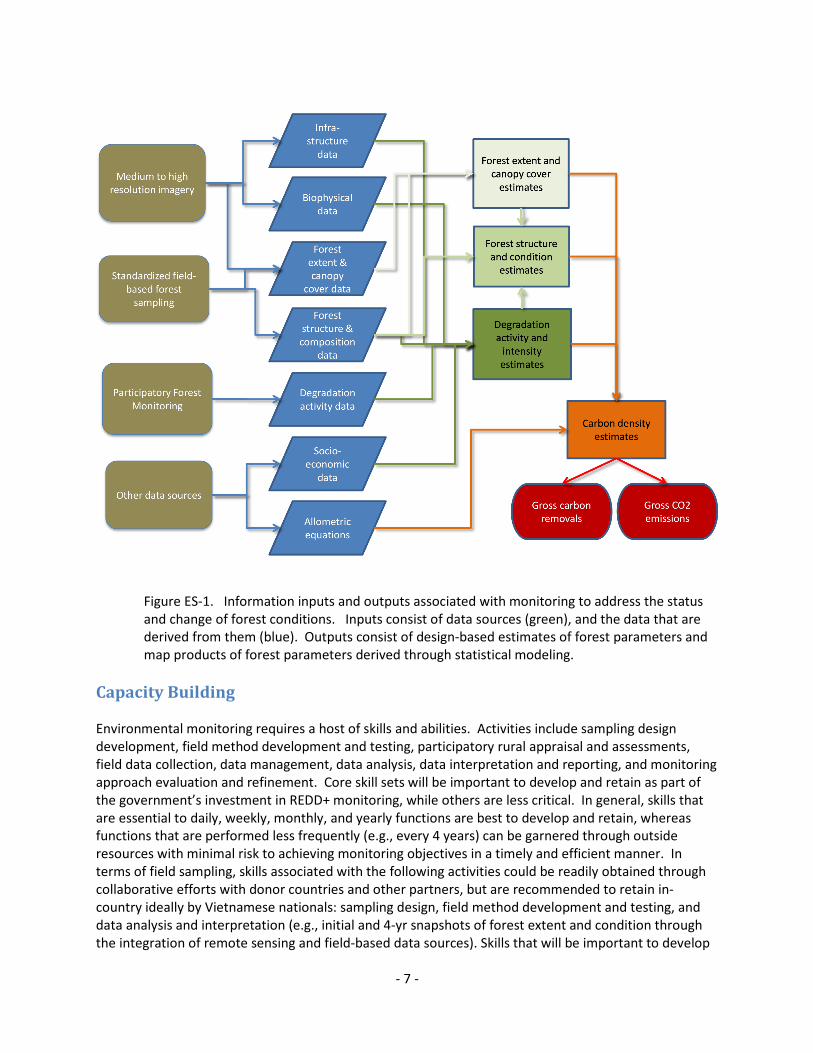
Empirical data obtained from a variety of sources provide the input – the raw material - for statistical
analysis and modeling, which is the means by which those data are used to generate output data for
various applications (Fig. ES-1). Carbon density estimates and resulting greenhouse gas emission
estimates can be estimated through extrapolation, or as a function of iterative modeling steps where
outputs from one modeling step become inputs into a subsequent modeling step to arrive at final
desired outputs.
One must be prudent in the interpretation of statistical modeling estimates across landscapes, given
that they are by nature inaccurate to some degree, and can have moderate to poor precision depending
on the characteristics of the input data. These errors are difficult to track through multiple analytical
steps, thus error propagation can undermine the reliability of estimates. In general, design-based
estimates (direct measures of condition and trend based on sample plots) will have greater precision but
more limited utility than modeled landscape-scale estimates of conditions that are derived from design-
based data. In terms of degradation, planned timber harvest activities may be a source of degradation
for which reliable estimates could be developed and then used to attribute harvested areas in the
future. However, for unplanned activities it will be difficult to attribute biomass impacts resulting from
individual degradation activities and use these estimates to attribute or correct estimates of biomass
because we observed overlapping unplanned degradation activities occurring in many locations,
particularly those with high demand and good accessibility. Thus, we recommend estimating overall
degradation intensity (not by individual activity) given contextual conditions, and continue to validate
and correct these estimates with periodic field measurements.
- 7 -
Figure ES-1. Information inputs and outputs associated with monitoring to address the status
and change of forest conditions. Inputs consist of data sources (green), and the data that are
derived from them (blue). Outputs consist of design-based estimates of forest parameters and
map products of forest parameters derived through statistical modeling.
Capacity Building
Environmental monitoring requires a host of skills and abilities. Activities include sampling design
development, field method development and testing, participatory rural appraisal and assessments,
field data collection, data management, data analysis, data interpretation and reporting, and monitoring
approach evaluation and refinement. Core skill sets will be important to develop and retain as part of
the government’s investment in REDD+ monitoring, while others are less critical. In general, skills that
are essential to daily, weekly, monthly, and yearly functions are best to develop and retain, whereas
functions that are performed less frequently (e.g., every 4 years) can be garnered through outside
resources with minimal risk to achieving monitoring objectives in a timely and efficient manner. In
terms of field sampling, skills associated with the following activities could be readily obtained through
collaborative efforts with donor countries and other partners, but are recommended to retain in-
country ideally by Vietnamese nationals: sampling design, field method development and testing, and
data analysis and interpretation (e.g., initial and 4-yr snapshots of forest extent and condition through
the integration of remote sensing and field-based data sources). Skills that will be important to develop

- 8 -
and retain at the District, Province and National levels will be basic field data collection, data
management, and basic data analysis, interpretation, and reporting (e.g., annual data summaries, data
quality assessments). In addition to physically collecting and managing data and reporting results, it will
be important to develop and retain modeling skills to respond to national annual assessment and
reporting requirements for REDD+ compliance. Spatial modeling requires substantial investment in
training, and might best be targeted for the Province or multi-Province scale.
Next Steps
We suggest that the proposed recommendations be discussed among potential collaborators, and then
a demonstration be conducted through a collaborative effort between the government of Viet Nam and
the potential collaborators - entities that are well positioned to contribute such as the US Forest Service,
SilvaCarbon, LEAF, Winrock International and USAID. The implementation of a field demonstration and
validation effort would entail the following:
1) Identify goals, monitoring questions, and information needed to meet monitoring objectives,
including identification of primary degradation activities;
2) Identify existing capacity – organizations, staff, and positions – that would be the target of
training and implementation of standardized field sampling and PFM;
3) Specify methods and associated data analysis for standardized field sampling and for PFM;
4) Obtain moderate to high resolution remote sensing data for the area and evaluate the degree
to which forest conditions (forest cover, forest type, canopy cover) can be derived across the
area;
5) Develop sampling grid and establish location of permanent grid-based plots;
6) Identify conditions that are undersampled based on local and regional priorities and determine
the location and number of targeted sample plots that will be measured for the current sample
period;
7) Design and conduct training for field personnel;
8) Supervise field data collection for standardized field measurements and PFM;
9) Conduct data analysis to determine the degree to which each data source (grid plot, targeted
sample plots, remote sensing data, PFM data) alone and in combination with each other and
other available data (e.g., topography, roads, population density) to assess current conditions
and change at various scales;
10) Determine the degree to which PFM contributes to monitoring degradation and the value of
PFM for increasing local interest in maintaining and restoring forest quality; and
11) Refine recommendations as informed by field testing and analysis.

1
1. Introduction
Changes in forest carbon stocks can be detected through monitoring of deforestation, forest
degradation, and/or reforestation. Techniques for monitoring deforestation and resultant changes to
forest carbon stocks are widespread and well published. However, techniques for monitoring
degradation and reforestation are relatively untested in developing countries despite their inclusion in
current UNFCCC REDD+ negotiations.
In Viet Nam, and other countries across the region, many recent proposals for developing capacity have
noted the need for addressing issues surrounding forest degradation monitoring. For example, the 2010
USAID/RDMA Asia Regional REDD Program Planning Assessment Report identified a strong need for
increased human resource technical capacity in regard to monitoring forest degradation at national and
sub-national scales. In Viet Nam, all of the following efforts independently identified degradation
monitoring capacity and methods as a priority: the 2011 USAID/Viet Nam Climate Change Assessment
conducted by USFS staff (USFS 2011), the Viet Nam Forest Carbon Partnership Fund/Readiness
Preparation Proposal (FCPF/RPP 2011), the FAO/MARD National Forest Inventory in Vietnam
(FAO/MARD 2012), the Viet Nam UNREDD proposal for Monitoring, Reporting and Verification (VN
REDD+ 2011), and a CIFOR review of MRV capacity in Viet Nam (Pham 2011). The FORMIS project
(FAO/MARD 2012) is a collaboration between the VNFOREST and the Finnish Government to upgrade
Viet Nam’s forest and lands change monitoring systems and applications, but degradation is not a
primary focus. No current donor work in Viet Nam is targeting monitoring forest degradation at sub-
national scale, or the needs for developing this capacity with partner institutions.
The United States Agency for International Development/Regional Development Mission for Asia’s
(USAID/RDMA) program called Lowering Emissions in Asia’s Forests (LEAF) is addressing these issues by
requesting the United States Forest Service (USFS) to design and implement an options assessment that
may be used to guide development of monitoring strategies with its country partners in Southeast Asia.
The LEAF program is being managed by Winrock International in collaboration with The Netherlands
Development Organization – SNV, Climate Focus and the People and Forests Center (RECOFTC), and
targets six countries in the Asia-Pacific region (Cambodia, Lao PDR, Thailand, Viet Nam, Malaysia, and
Papua New Guinea). SNV is the implementing partner in Viet Nam and Laos where they have been
established for more than 10 years. Two of LEAF’s main objectives are to build institutional technical
capacity for monitoring changes in forest carbon stocks and to demonstrate innovation in sustainable
land management.
The opportunity for LEAF to integrate forest degradation monitoring into REDD+ Action Plans and Low
Emissions Development Strategies are of paramount interest. While the future of international
agreements on REDD+ are unknown, the need for accurate information on land use trends and
addressing drivers of forest degradation at local levels is needed for improving land management even
without REDD+. USFS carried out three short month- assessments in Lao PDR, Viet Nam, and
Cambodia in the first half of 2012. This document focuses on the assessment in Viet Nam,
conducted in March-April 2012 and outlines key findings, assesses various options to effectively
monitor forest degradation processes, and makes recommendations on ways LEAF and LEAF’s
counterparts could move forward collaboratively on monitoring forest degradation at
demonstration sites in Viet Nam.
2
Specifically, this report describes options for LEAF and LEAF partners to monitor forest degradation in
the Con Cuong District, Nghe An Province, in Viet Nam. The objectives of the project were the following:
1. Assess current best practices consistent with global initiatives on monitoring forest degradation
and relevant to activities identified in Viet Nam REDD+ assessments;
2. Assess data sources and current on-the-ground activities at the pilot site level that contribute to
an expanded knowledge of above-ground forest carbon stocks;
3. Develop and evaluate options for field-based monitoring of forest degradation, with
considerations for complementarity with other monitoring methods and for cost-effectiveness,
precision, accuracy, and feasibility.
2. REDD+ Best Practices and Monitoring Requirements
REDD Monitoring
Four types of monitoring are recognized as needed to implement REDD+: 1) monitoring carbon stocks,
2) monitoring REDD interventions and actions, 3) monitoring revenue disbursement, and 4) monitoring
financial transactions (UN REDD 2010). This report addresses monitoring carbon stocks and forest
quality.
IPCC (2006) defined five carbon pools for the purposes of biomass accounting: above-ground, below-
ground, dead wood, litter, and soil (Annex A). For deforestation and forest degradation, the main
changes in carbon stocks occur in above ground vegetation (GOFC GOLD 2011). Estimation of soil carbon
emissions is only recommended for intensive practices that involve significant soil disturbance, and
generally does not apply in Viet Nam. Selective logging for timber or fuelwood in forests on mineral soil,
whether planned or unplanned, does not typically disturb soils significantly. Further, an added
assumption is that fire is not a major disturbance affecting large areas of forest in Viet Nam. Fires can
significantly influence stocks in the dead wood and litter pools, so if fire were to become a more
dominant disturbance in Viet Nam, it might be necessary to consider quantifying carbon emissions from
these sources in the future.
IPCC monitoring guidelines from the Kyoto Protocol identify three tiers of complexity in acquiring
activity data and assessing corresponding emission factors, and for assessing land-use change inducing
activities.
• Tier 1: provides all relevant default values, assumptions and methods. While permitting the
easiest way to calculate emissions, it contains the highest degree of uncertainty.
• Tier 2: builds on national measurement and monitoring data, such as from forest inventories
and the monitoring of deforestation, and permits to combine them with IPCC default values,
assumptions and methods. It offers therefore more realistic emission calculations than the
application of Tier1.
• Tier 3: builds on country-specific data, assumptions and methods. This most complex approach
offers the highest degree of certainty, but is also the most costly. It requires a high degree of
precision and data accuracy, which is not feasible in most countries as yet.
UN REDD policy brief (UN REDD2009) summarized the tradeoffs as one moves from Tier 1 to Tier 3
investments in monitoring carbon stocks (Fig. 1). The Viet Nam National REDD program strives to
achieve Tier 3 monitoring capacity, but current efforts are classified as Tier 2, and even at that fall short

3
of many basic information needs identified for REDD+ programs (e.g., reliable sub-regional estimates,
detection of location, type and extent of degradation activities).
The UN REDD Program recently (May 2012) completed an assessment of the capacity building progress
and needs in Viet Nam (UN REDD 2012). This assessment identified three primary gaps related to
monitoring, and provided recommended actions to address them.
1. Not enough organizations engaged in establishing national or sub-national REDD+ baselines
(build capacity within government agencies)
2. Lack of capacity building services to natural resource industries (discussions with industry)
3. Delivery style and format of REDD+ training for communities (small groups, participatory)
Figure 1. Tradeoffs in Tier 1-3 carbon monitoring for REDD compliance (UN REDD 2009).
There are a myriad of methods to measure vegetation and derive estimates of biomass; however, the
question remains what methods are optimal given the resources available and the information needs.
The Terrestrial Carbon Group (TCG) identified two primary information needs for REDD carbon
monitoring: 1) estimate of the areal extent of significant land use classes and monitoring land use
change within and between classes (the development of activity data); and 2) carbon density measures
and monitoring of changes to carbon density within major land use classes (the development of
emission factors; UN REDD 2009). A summary of capacities and limitations of the three primary
methods of characterizing vegetation condition and biomass is provided in Table 1. This assessment,
however, does not address the concomitant need for information on causal factors responsible for the
change – namely types of degradation. It is important to quantify the source of carbon loss, along with
the amount, in order to inform the efficacy of efforts directed at reducing the drivers of degradation,
such as improved cook stoves (ICS). If we include measures of types of activities associated with carbon
losses, it becomes clear that some type of field-based data collection effort is needed to provide the full
array of information needed to support the full suite of objectives of the REDD+ program. The
Terrestrial Carbon Group (UN REDD 2009) also point out that at the national scale, it is possible to cost-
efficiently measure and monitor carbon emissions and sequestration from deforestation, afforestation
and reforestation, but difficult for some types of forest degradation and non-forest land uses.

4
Additional targeted field measurements are needed detect and describe the impacts of degradation on
carbon and other aspects of forest quality. Higher-resolution remote sensing imagery can also
contribute valuable additional information to address degradation occurrence and impacts.
Table 1. Capacities and limitations of the key categories of methods for measuring and monitoring
terrestrial carbon (UN REDD 2009).
Method What can it do Capacities Limitations
Field Measurement
and observation
Carbon density, areal
extent, change over
time if measured
more than once
• Precise for measured
variables
• Low technology
requirements
• Can be inexpensive
depending on labor
costs
• Costs proportional to
area and labor
requirements
• Can be slow and may not
provide results that are
consistent over a large
area
• Precision will depend on
precision and
applicability of
conversion values
applied
Remote sensing Areal extent and
change over time if
measured more than
once
• May be cost-effective
• Supports field work
performance
• Transparent
interpretation and
methodologies
• Can be routinely
collected, if available
• Globally consistent
• Accurate for area
estimation
• Some forms of sensor
may not be suitable for
tropical forests or
available for all regions
• Can be technically
demanding/expensive to
interpret results
• Not suitable for
estimating stocks
Models Combine information
to derive carbon
volumes
Relate carbon
changes to
degradation activities
• Framework for
integrating various types
of data
• May be cost-effective
• Can be routinely
updated.
• Dependent on quality of
input data
• Model algorithms and
parameter selection may
be complex.
Best Practices
Best practices is a core concept that serves to identify principles and approaches that have proven
useful and successful in one or more countries for the edification of REDD+ program implementation.
The concept of best practices is simple: learn from successes by identifying successful local approaches
that can be readily applied elsewhere in a range of conditions and circumstances.
At the UN-REDD workshop in Barcelona, Spain in 2009, lessons learned regarding readiness and
momentum included increased capacity at the national level, strategic partnerships and stakeholder
participation – all three were vital to the future of a successful REDD mechanism. The following specifics

5
were summarized, and provide a valuable context for determining how to effectively design monitoring
for Viet Nam:
1. An approach shaped by principles of inclusion and engagement: country-led delivery, capacity
building and facilitating the stakeholder engagement process are crucial. A human rights-based
approach to development cooperation ensures that all programs and activities are in support of
the weak and the vulnerable, and gender equity, and serve as advocates for their rights through
principles of inclusion and engagement.
2. Building systems based on science: emphasized the importance of delivering on accounting for
carbon emissions within the broader scope of MRV/Monitoring, and the need for long-term
institutional development on MRV that relies on science-based methodologies
3. Early and continuing engagement: place REDD+ at the centre of national development policy to
mainstream REDD+ and enable cross-sectoral guidance, management and processes. Early and
continuing engagement of key stakeholder groups is crucial for national REDD readiness efforts
to be fair and sustainable
4. Biodiversity maximizes long-term stability of the carbon pool: importance of including
biodiversity experts, landholders and indigenous peoples - best practices can be drawn from
opportunities for synergies and multiple benefits in the planning phase and at landscape scale
through protected area gap analysis – REDD+ activities should take biodiversity into
consideration to help maintain forest ecosystem resilience and thus the long-term stability of
the carbon pool.
The UN REDD program did an evaluation of best practices in the Asia-Pacific region in December 2011
(UN REDD 2011). They identified two specific areas where lessons have been learned in the context of
information, monitoring, and MRV: 1) the value of national monitoring systems; and 2) the value of
participatory monitoring.
In terms of National monitoring systems, NFI is deemed a necessary and valuable component of REDD+
monitoring. The NFI has to be capable of collecting data necessary for REDD+ in a cost-effective and
reliable manner, and it is necessary to find the right balance between the number of parameters to be
measured, time available for measurements and a cost-effective implementation. Recommendations
from experiences in Indonesia are still in development, but are likely to have valuable applicability in
Viet Nam. Challenges and concerns identified by UN-REDD associated with NFI contributions to carbon
monitoring were four-fold:
1) Changes in carbon stocks in managed forests may require a longer-than-typical accounting
period and may be too small to be detected accurately through remote sensing;
2) The NFI will collect accurate data, but considering resolution in space and time required to
properly capture local changes in biomass – additional data will be needed to improve accuracy;
3) Mobilizing local people may be more cost-effective compared to the use of professional
surveyors in conducting basic measurements during ground-based surveys; and
4) Communities’ understanding of carbon monitoring is expected to work as an incentive to
promote further improvements in forest management - engaging local people in participatory
monitoring will also increase the ownership felt by communities of national REDD+ programs
and their engagement in the design of the programs, thus increasing the likelihood that carbon
payments will be efficiently distributed down to the local level.
In terms of Participatory Forest Monitoring (PFM), the UN REDD Lessons Learned report (UN REDD 2011)
identifies PFM (considered here as synonymous with Participatory Monitoring) as an essential
complement to NFI and satellite-based land monitoring efforts. They see PFM data as limited to basic

6
forest measurements on forest area and properties (e.g., diameter at breast height and tree species),
and serving to supplement NFI and satellite-based land monitoring data to estimate biomass per
management unit and eco-zone. This is in contrast to recommendations provided in the UN REDD
National Strategy lessons learned document (UN REDD Strategy 2011), where PFM was identified as the
primary data source to be augmented by NFI and modeling. We see this latter recommendation as
difficult to achieve given the potential for bias when data collection and payments for forest conditions
are both directed at community members.
Participatory Forest Monitoring is likely to play a central role in strengthening understanding and
commitment to forest quality and support for the REDD+ process within local communities. PFM is also
often identified as the only financially feasible approach to obtaining information on types and rates of
degradation. The financial arrangements associated with PFM also are expected to reduce rates of
forest degradation by reducing the dependence of some local residents (if only temporarily) on forest
resources. There is disagreement, however, in what data are realistic to be generated through PFM,
how reliable those data will be, and what role they can play in meeting Tier 2 or 3 REDD+ monitoring
requirements. In Viet Nam, high-investment (i.e., training, complexity, output) PFM efforts are being
piloted by SNV in Lam Dong Province to determine their feasibility at any scale (also see the “Kyoto:
Think Global, Act Local” program, which tested PFM in eight countries on four continents).
Information Needs for Effective Carbon Monitoring
The success of REDD+ relies on effectively measuring the potential reduction of emission levels and
increased carbon stocks resulting from altered management practices. Viet Nam is one of few REDD+
countries in which the national forest monitoring program is legalized by law and has been conducted at
nationwide level since 1991. Viet Nam has started the development of the national interim REL/RL in
collaboration with Japan and Finland (NORDECO, JOFCA and JAFTA) since late 2009.
Determining the difference between conditions resulting from the status quo and improved carbon
sequestration and avoided GHG emissions resulting from REDD+ implementation requires reliable
information on carbon stocks and emission factors either through direct measurements, reliable
estimates, or both. Historical data are used to predict Reference Emission Levels (REL) or Reference
Levels (RL). REL/RL’s are predictions based on historical trends as documented by satellite imagery
(principally to quantify activity data) and field measurements (principally to deveop robust emission
factors) ad may be adjusted for national circumstances.
In Viet Nam, available imagery consists of medium resolution imagery and dates back to 1990, and field
measurement data from the National Forest Inventory Program (NFI) is available for a similar time
period. However, generation of historical RELs for forest degradation requires a greater precision and
accuracy of data than these two data sources can provide. Thus, an assessment of historical forest
degradation in Viet Nam is very challenging due to limitations in availability of data. Sub-national
RELs/RLs may lead to higher resolution GHG accounting if developed using locally available data sources.
Most RLs currently are limited to comparisons of current degraded conditions to less or undegraded
conditions 5 or 10 yrs earlier. The level of precision needed to effectively portray a RL is entirely a
function of the increment of change REDD+ program is prepared to recognize, and followed by the
increment of change countries are willing and able to invest in detecting to achieve their desired
economic (e.g., carbon credits) or ecological (e.g., adaptations to reduce degradation rates) benefits.

7
The IPCC AFOLU Guidelines recommend either a stock-difference method or a gain-loss method for
estimating the carbon density and change within areas that remain forests throughout the monitoring
period – in other words, where carbon loss is primarily a function of forest degradation (GOFC GOLD
2011). With a gain-loss approach for estimating emissions, biomass gains would be accounted for with
rates of growth in trees after logging, and biomass losses would be accounted for with data on timber
harvests, fuel wood removals, and transfers from the live to the dead organic matter pool due to
disturbance. With a stock-difference approach, carbon stocks in each pool would be estimated both
before and after degradation (e.g., a timber harvest), and the difference in carbon stocks in each pool
calculated. In general, both methods are applicable for all tiers. The decision regarding whether a
stock-difference method or a gain-loss method is used will depend largely on the availability of existing
data and resources to collect additional data.
For legal biomass extraction, the gain-loss method could be more cost efficient, but using different
methods to derive each component of the equation carries the risk of non-compensating bias between
the two methods. Further, the combination of planned and unplanned logging associated with forest
degradation in Viet Nam argues for the stock-difference approach since it is burdened with fewer
assumptions. Certainly, the stock-difference method can be augmented with gain and/or loss data as
validation, since in many cases these data already exist to meet other objectives (e.g., harvest quota
documentation, tree growth models for forest management planning).
It was suggested by UN REDD in their National REDD Program Strategy for Viet Nam (UN REDD 2011) to
establish a “robust and transparent national forest monitoring system, using a combination of remote
sensing and ground-based assessments for carbon inventory. Approaches and the monitoring system
should provide estimates that are transparent, consistent, accurate and complete, reduce uncertainties
and provide results comparable with those from other countries (hence the need to apply the IPCC
methodologies and standards) that are available for review by the UNFCCC.”
The 2011 UNREDD Strategy recommended that the monitoring of emissions and removals should be
implemented in a two-pronged approach: Level 1, Collection of basic data by forest owners from a
statistically significant number of sample plots that record conditions and activities; and Level 2,
Generation of accurate data set on forests through professional forest survey that also records
conditions and activities. They recognized that data collected by forest owners (Level 1), as prescribed in
Participatory Forest Monitoring, is valuable, but not sufficient to reliably estimate biomass. They
identify the National Forest Inventory program and academic contributions (Level 2) as necessary
elements of the monitoring program to derive reliable biomass, carbon stock, and emissions factor
estimates and activity data. They suggest that National Forest Inventory data can be used to convert
forest owner data into reliable biomass estimates, however this is not described in detail. The results of
our field assessment address this issue later in this report.
Data Sources
Three sources of data on forest extent and conditions have been identified as valuable contributors to
monitoring forest extent and condition in Viet Nam, and the tropics in general: remote sensing,
statistically rigorous field-based measurements, and participatory forest monitoring (Fig. 2). It appears
there is an important role for all three data sources, but their respective roles and the investments
made in them remains unclear. The question is what role will each play – do they serve as the
foundational role or in a supporting role in carbon, degradation, and/or forest quality monitoring. There
are proponents for each of them to serve as the primary foundation of monitoring carbon, with one or
both of the others serving in a support role (e.g., training, verification, modeling).

8
Figure 2. Monitoring triad: three primary sources of data and their complementarity for
determining the status and change in forest extent and conditions.
The extent and condition of forests can be estimated through remote sensing methods and/or field
measurements. The extent of forest area is most efficiently estimated spectrally using remote sensing
methods, which are spatially and temporally comprehensive across large landscapes, but it has accuracy
problems. The condition of forests, including estimates of carbon, currently is most commonly derived
from data collected in the field through standardized field measurements; however, higher precision is
achieved when stratification is applied using maps derived from remote sensing and other sources are
used. Remote sensing, standardized field measurements, and participatory monitoring have different
strengths and weaknesses in the context of monitoring (Table 2).
The three primary data sources are identified in the monitoring triad: remote sensing, standardized field
measurements, and participatory forest monitoring. They have the ability to address forest
characteristics and conditions to varying degrees, often in a complementary manner (Table 3).
Remotely sensed data provide interpretations of conditions across landscapes over time; however, they
are limited in their ability to independently describe forest structure conditions in detail. Across large
landscapes (> 200,000 ha), moderate resolution remote sensing data is most feasible, but as a stand-
alone data source, it falls short of forest carbon monitoring information needs beyond forest extent and
canopy cover. For example, 10 by 10-meter SPOT5 images will likely detect the removal of larger trees,
but will not likely detect the removal of pole sized trees. If 5 by 5-meter imagery were to be obtained, it
is probable that the removal of pole-sized trees could be detected. Remote sensing data in combination
with field measurements at a sufficient density provides a strong complement of data to address
carbon, forest quality, and some aspects of degradation activities (Table 3). Participatory forest
monitoring, assuming that it is designed to function with minimal training and oversight, is likely to
REMOTE SENSING
=> Forest and canopy cover
mapping
PFM SURVEYS
=> Villagers conduct forest
degradation surveys as per
simple standardized
protocols
STANDARDIZED FIELD
MEASUREMENTS
=> Forest Rangers conduct
forest measurements as per
standardized protocols
Forest
condition
validation
Degradation
location and
rate validation
Data for
imagery
interpretation
and forest
quality
modeling
Validation for
cover change
and forest
condition maps
9
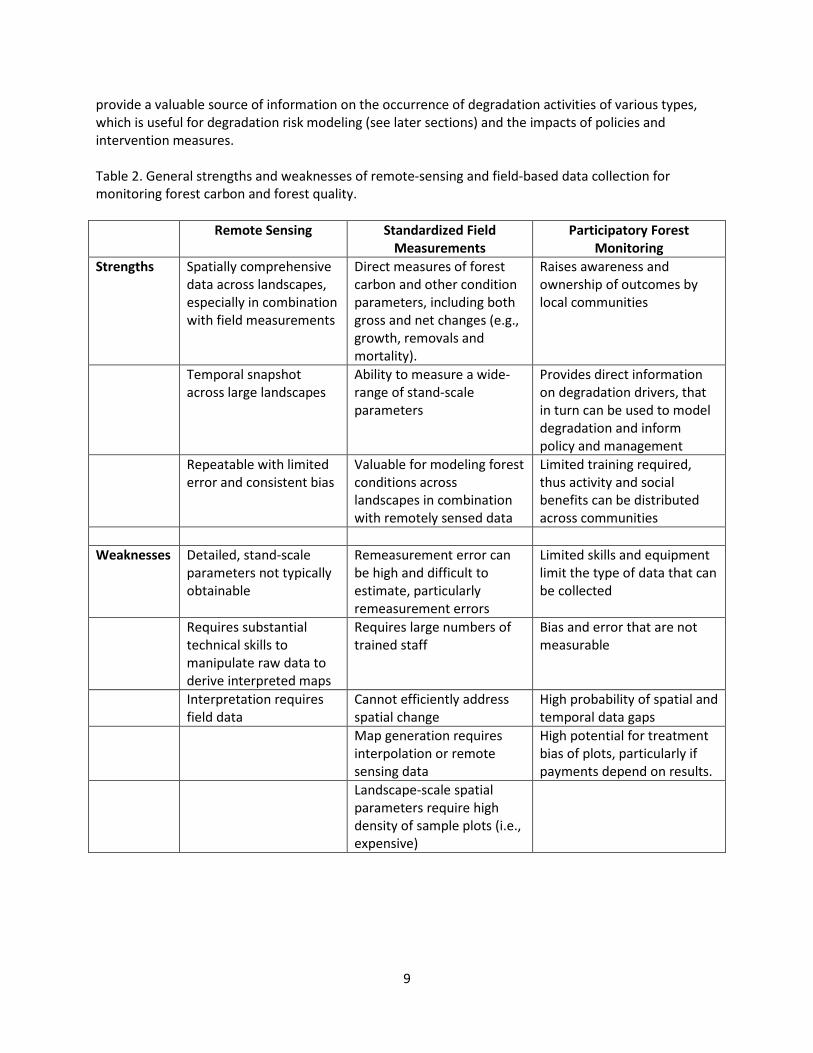
provide a valuable source of information on the occurrence of degradation activities of various types,
which is useful for degradation risk modeling (see later sections) and the impacts of policies and
intervention measures.
Table 2. General strengths and weaknesses of remote-sensing and field-based data collection for
monitoring forest carbon and forest quality.
Remote Sensing Standardized Field
Measurements
Participatory Forest
Monitoring
Strengths Spatially comprehensive
data across landscapes,
especially in combination
with field measurements
Direct measures of forest
carbon and other condition
parameters, including both
gross and net changes (e.g.,
growth, removals and
mortality).
Raises awareness and
ownership of outcomes by
local communities
Temporal snapshot
across large landscapes
Ability to measure a wide-
range of stand-scale
parameters
Provides direct information
on degradation drivers, that
in turn can be used to model
degradation and inform
policy and management
Repeatable with limited
error and consistent bias
Valuable for modeling forest
conditions across
landscapes in combination
with remotely sensed data
Limited training required,
thus activity and social
benefits can be distributed
across communities
Weaknesses Detailed, stand-scale
parameters not typically
obtainable
Remeasurement error can
be high and difficult to
estimate, particularly
remeasurement errors
Limited skills and equipment
limit the type of data that can
be collected
Requires substantial
technical skills to
manipulate raw data to
derive interpreted maps
Requires large numbers of
trained staff
Bias and error that are not
measurable
Interpretation requires
field data
Cannot efficiently address
spatial change
High probability of spatial and
temporal data gaps
Map generation requires
interpolation or remote
sensing data
High potential for treatment
bias of plots, particularly if
payments depend on results.
Landscape-scale spatial
parameters require high
density of sample plots (i.e.,
expensive)

10
Table 3. Complementary data sources to monitor forest carbon, forest quality, and degradation. Field-
based methods include National Forest Inventory (NFI), Standardized Local Forest Measurements
(SLFM), and Participatory Forest Monitoring (PFM). Darker shading indicates lower poorer ability to
obtain reliable data.
Methods Carbon Forest quality Degradation
activities
Remote sensing:
Moderate resolution
remote sensing
Not able to derive
estimates of carbon
other than by linking
cover estimates from
remote sensing to
biomass density
estimates from other
sources
Provides information
on forest canopy
cover and forest
type, but not
understory or wildlife
occurrence
Cannot detect
smaller-scale
changes in canopy
cover and density
Standardized field
measurements:
National Forest
Inventory
Insufficient density at
District and Province
scale to provide direct
estimates; could yield
growth rates for
modeling
Insufficient density to
address forest quality
at relevant sub-
regional scales
Insufficient density
to address extent,
intensity or causal
factors for
degradation
Standardized field
measurements: local grid
and augmented
locations
Sufficient sample plots
would provide a
reliable source of
direct carbon
measurements and
data for modeling
Sufficient number of
sample plots would
provide a reliable
source of direct
forest condition
measurements and
data for modeling
Strategically placed
sample plots could a
reliable source of
data for modeling
degradation activity
modeling
Participatory
monitoring:
PFM
Contributes little to
carbon estimates in
light of other methods
being recommended
Unlikely to yield
reliable measures of
forest structure at
local and sub-
regional levels
Could provide
reliable information
on extent, intensity
and type of
degradation
activities at a local
scale that can be
used in modeling
risk and carbon loss
Data derived from field measurements are not readily obtained from other data collection methods.
Field-based data are most versatile if they are designed to provide direct measures of biomass, forest
condition and degradation, as well as serve as input to interpret remotely-sensed data to generate
landscape-wide estimates of carbon, forest condition, and degradation risk.

11
3. Con Cuong Environmental and Social Characteristics
District Physical Setting and Land Use
Con Cuong District is located in Nghe An Province in north-central Viet Nam, approximately 120 km (75
miles) northwest of Vinh City (Fig. 3). The Ca River divides the northern and southern halves of the
district and the population predominantly lives in the river basin and its tributaries. Much of the district
lies in the rugged Giang Man and Kieng Du mountain ranges, and consequently 82% of the district is
mountainous. It shares a border with the Lao People’s Democratic Republic, in the south (Nguyen
ThiKhanh 2012). The district has two distinct seasons: a cooler dry season from November to March and
a warmer rainy season from April to October
Figure 3. Location of Con Cuong District in Nghe An Province, north central Viet Nam.
Land use classified as forest makes up 88.9 % of the total natural area in Con Cuong while 5.77% is
considered agricultural land, according to the Department of Agriculture and Rural Development (DARD;
Nguyen ThiKhanh 2012). The main agricultural crops are rice, maize, cassava, sugarcane, sweet
potatoes, tea, peanuts and vegetables with paddy rice (3,575 ha), maize (2,397 ha), and tea (525 ha)
being the most abundant. Agricultural yield and number of livestock has been increasing, according to
the district People’s Committee (Nguyen ThiKhanh 2012). As of 2008, 1,615 ha of swidden
agricutlurewere permitted in Con Cuong District although some additional unpermitted swidden
agriculture (i.e., shifting agriculture) occurs in order to meet families’ daily consumption needs. The
12
government of Viet Nam has legislation in place that aims to reduce the area of swidden agriculture in
Con Cuong District each year and the state regulates which areas can be used for swidden agriculture.
The largest manager of forest is Pu Mat National Park, which manages 68,528 ha while the Protection
Forest Management Board (PFMB) and Con Cuong Forest Company (CCFC) manage approximately
30,000 and 10,000 ha, respectively. Con Cuong is unquestionably representative of a high risk/high value
landscape (LEAF 2011).
Con Cuong District Social Setting and Livelihood Options
Con Cuong town is the capital of the district and the only urban area in the district. There are a 12
communes; Mon Son has the greatest population with 1,964 households (Nguyen 2012). Con Cuong
district has an estimated population of 65,239 in 16,134 households, with 70% of the population being
classified as ethnic minority (SNV 2010). Population growth in Nghe An Province ranks among the top
20 fastest growing province at 12.5% for 2009, compared to a national average of 10.8% (General
Statistics Office 2012). The district remains one of poorest districts in Viet Nam with estimates of the
population living under the poverty threshold varying between 30-50% (SNV 2010, Nguyen Thi Khanh
2012). There is significant variability between commune poverty levels with Cam Lam having the highest
at 48.5% while communes such as Luc Gia being substantially lower. In 2010, 62.1% of the population
was employed, predominantly in the agricultural sector with very low numbers employed in industry
(Nguyen ThiKhanh 2012).
Livelihood activities are typically divided into on-farm and off-farm activities (SNV 2010). Off-farm
activities occur because land suitable for permanent cultivation is lacking in Con Cuong District due to
topographic constraints (SNV 2010). Swidden agriculture, logging, gathering non-timber forest products
(NTFP) and hunting were all observed, often despite regulations banning these activities. Few
alternatives exist and in many instances natural forest resources have been over-exploited and are now
scarce. On-farm activities include wet rice cultivation on flat, low-lying areas or near streams, limited
animal husbandry and small-scale acacia plantations. The cost of the initial investment required limits
both animal husbandry and acacia plantations. Although highly valued, traditional home gardens, which
are often dominated by banana, are small in size relative to needs (SNV 2010).
Pu Mat National Park and UNESCO World Biosphere Reserve Designation
The Pu Mat National Park was established in 2001. Shifting agriculture was ordered to stop in the park
in 1990, as the government of Viet Nam formally invested in forest development at this time. The
discovery of the extremely rare Saola, a twin-horned, wild bovine, in 1992, along with the presence of
Indochinese Tigers, critically endangered Northern White-cheeked Gibbon, and the largest herd of
elephants in Viet Nam helped bring about the national park declaration (Mekong tourism 2011). Pu Mat
National Park consists of a 91,113 ha strictly protected area and an 86,000 ha buffer area, making it the
largest special use forest in northern Viet Nam. More than two thirds of the park falls in the Con Cuong
District but portions of the park also lie in Tuong Duong and Anh Son districts. The park supports many
species on the IUCN red list and park managers desire biodiversity monitoring support, as monitoring
capacity (funding and personnel) is low.
In 2009, Western Nghe An Province was declared one of 580 UNESCO World Biosphere Preserves, as
part of the Man and the Biosphere Program (MAB). MAB is an intergovernmental scientific program
with the goal of improving the relationship between people and their environment through science and
13
education. The preserve is centered on Pu Mat National Park but also includes O Pu Hue and Pu Heat
Nature Reserves. The biosphere reserve is home to many ethnic minorities; and the total population in
the biosphere (Viet Nam and Laos combined) is 83,000 in 110 villages. The Nghe An DARD highlighted
the need to leverage the UNESCO status for additional funding but this has yet to occur. A biodiversity
inventory was conducted by Pu Mat National Park in 2003-2004.
Nghe An Cover Change Assessment
With LEAF program funding, LEAF Vietnam has recently concluded a land cover change assessment in
both Con Cuong District in Nghe An Province, and Bao Lam and Cat Tien districts in Lam Dong Province in
southern Viet Nam. SPOT5 images were not available in Con Cuong District for 2010 so 20-meter
resolution SPOT images were used in the analysis. SPOT5 images were available for 2005 but not for
2000 or 1995 and 20-meter SPOT3 and SPOT2 images were used for those years. Digital elevation
models at the scale of 1:50,000 were used for ground control and ortho-rectification. District forest
maps and land use data were manually interpreted as well but these data were lacking QA/QC so the
reliability is unknown. Land use planning maps were available for Lam Dong Province and used in the
analysis but currently these maps/data do not exist for Con Cuong District (Nguyen 2012). Image
segmentation processing and unsupervised classification of multispectral- images were performed in
addition to ground truthing 116 randomly generated points during field surveys. Land was classified
based on forest type and volume as defined as the same categories used by the Government of Viet
Nam. There are 8 classes of forest in addition to plantation forest and 9 classes of non-forest land.
Accuracy in Con Cuong District was 81.1% (Nguyen 2012).
Rich, medium and young evergreen forests (16%, 21% and 26% of Con Cuong land cover respectively)
are currently the most common forest types (Fig. 4). Land cover classified as rich forest has steadily
shrunk from 1995 to 2010 (going from 36% in 1995 to 16% in 2010) (Nguyen 2012). Most rich and
medium areas are located in mountainous areas, either in Pu Mat National Park in the south of Con
Cuong District or in the Binh Chuan commune in the north of Con Cuong District. The relatively
consistent medium evergreen forest values are somewhat misleading. In reality, much of the area
currently classified as medium forest was previously classified as rich evergreen forest and much of what
was categorized as medium evergreen forest in 1995, is now young, often degraded, evergreen or mixed
forest. However, the conversion of rich evergreen forest to medium evergreen forest has slowed
considerably since 2005 (Nguyen et al. 2012). Young evergreen forest, plantation forest and annual crop
area all increased steadily since 1995 and are all centered around Con Cuong town where population
density is highest. Total agricultural land increased to 11.5% in 2010 from 6.7% in 1995 and young
evergreen forest is now the most common land cover at 26% of total land area (Nguyen 2012).
The LEAF analysis differs from the DARD estimations of district-wide forest cover of 89% as the LEAF
analysis showed forested land being only 76.8% of total Con Cuong District land area in 2010 and losing
an average of 0.7% since 1995. However, rates of deforestation were slower from 2005 to 2010 than
from 2000 to 2005 (Nguyen et al. 2012). The results of the 327 and 661 afforestation/reforestation
programs are evident as natural re-growth and recovering forested consistently increased, yet the rate
of forest lost was greater throughout the time period. In addition, the forest loss captured in the
analysis was generally the result of planned or unplanned logging, which generally occurs in forests of
much higher biomass than the low-biomass, freshly forested, young evergreen forests. Interestingly,
the LEAF analysis found deforestation and forest degradation occurring at higher rates on family
managed lands rather than state-owned lands or lands without clear ownership.

14
Figure 4. 2010 Land cover map of Con Cuong District, Nghe An Province, north-central Viet Nam.
Map produced by LEAF/SNV-Viet Nam, 2012.

15
In Con Cuong District there is difficulty differentiating between medium forest, mixed forest, poor forest
and young plantation forest. There is especially low accuracy (<70%) in differentiating between medium
and mixed forest. The poorly defined forest types are partially to blame but it is also difficult to
differentiate between these forest types with medium resolution. The analysis also cannot account for
transitional stages between forest types. Swidden agricultural practices in Con Cuong District are also
difficult to accurately detect, as they may go in and out of forest cover within five years. The complex
topography of Con Cuong District further complicates cover change analysis and no topographical
correction was applied to account for the effect of shadows (Nguyen 2012).
4. Con Cuong Forest Monitoring Activities and Field Assessment
National Initiatives that Relate to Sub-National Monitoring
Many initiatives to enhance or improve forest inventory in Viet Nam are currently occurring. Most
notably, MARD is in process of reforming the National Forest Inventory to increase its effectiveness in
monitoring the forest resource base across Viet Nam. Likewise, a Land Monitoring System (LMS) for Viet
Nam (VN REDD+ 2011) is under development by the government with support across ministries. This
system is intended to track land use and land cover change. As these initiatives, and others, have
potential linkages to sub-national forest monitoring programs, they are described more thoroughly in
Annex B.
Con Cuong District Forest Assessment Activities
A forest inventory has not been conducted in Con Cuong District in recent years due to lack of capacity,
appropriate technology and budget. A forest resource assessment was last conducted in 1998 using old,
poor quality SPOT images. As a result, this assessment was not very precise and is now very outdated.
Recent map data are also not available. Security regulations covering the Lao PDR/Viet Nam border do
not allow distribution or usage of aerial photographs, which further complicates monitoring through
remote sensing. A biodiversity inventory assessment was completed by Pu Mat National Park in 2003-
04. CCSFC does carry out a pre-harvest inventory at a 2% sample with 20m x 25m plots. However, the
plots are not installed on a systematic grid or at random. Plots are installed in places “where there are
harvest trees”. All trees ≥ 10cm are recorded, and trees with buttresses are measured (local people are
contracted). Volume is determined using provincial volume tables constructed by FIPI.
Effort is made by communal and district rangers to report and update forest cover changes. These data
are also used by the LMS – although resources and capacity are very limited. The Con Cuong District
ranger’s office has one computer and 1 trained technician who uses GPS and MAPINFO GIS software.
Any changes in forest cover mapping are then passed along to FIPI. Unplanned logging in large quantities
is reported up to the provincial level (Nghe An DARD, personal communication, March 22 2012). The
district ranger reported that commune leaders often do crosschecking and random checks in addition to
interviewing farmers about local forest activities.
A European Union funded research project called IREDD+ has also recently commenced in Con Cuong
District. This project is being administered by the University of Copenhagen and the remote sensing
work is being conducted by Humboldt University in Berlin. Generally, the group wants to do image

16
stacking and pixel extraction with Landsat or SPOT to get cloud free time series to do pixel level change
analysis; but they also did propose using MODIS at regional levels.
Observations and Results from Con Cuong District Trial Field Sampling
While in Con Cuong District, we assessed degradation monitoring options in four different forested
conditions and locations: Pu Mat National Park (special use area), Con Cuong State Forest Company
(CCSFC) Production Forest, and two Protection Forest areas (one adjacent to CCSFC lands and one
adjacent to a village). At each of the four field locations, rapid assessment field sample plots were
conducted (18 total). In addition, we observed the extent of forest degradation in a poor village (Cam
Lam) and a relatively affluent village (Luc Gia) (SNV 2010). The purpose of taking field measurements
was not to conduct a large-scale analysis (we would have needed many more plots), but to rapidly
assess the sites, acquire an unbiased perspective of the landscape, examine the efficacy of the variable-
radius plot method and test the feasibility of fixed transects.
Pu Mat National Park
We visited a medium quality forest in Pu Mat National Park, which had been officially closed to harvest
since 1995. The area was mapped as high quality forest. There was occasional evidence of past timber
extraction. This site had a mean basal area (ba)/ha of 7.5 m2 and a mean dbh of 37 cm. This area was
dominated by medium diameter trees and appeared to be experiencing significant NTFP collection.
Although fairly remote, a ridgeline trail that went all the way to Lao PDR bisected the area. We
encountered 7 small shelters/camps along the trail that appeared to be used by NTFP gatherers who
were seeking medicinal plants to sell commercially, according to our Pu Mat National Park forest ranger
guide. We observed many cleared transects going from the main ridgeline trail into the forest. Our
guide explained that these transects were used for navigation back to the main trail by NTFP gatherers.
Con Cuong State Forest Company Production Forest
On our second day in the field we visited the CCSFC production forest, a State-owned company (SOC)
that was being actively logged. The forest was dominated by medium and large diameter trees and had
a post-harvest mean DBH of 38 cm and a mean BA/ha of 5.25 m2. Felled trees are milled into cants
(approximately 0.25 cubic meter) on site; we observed what seemed to be significant post-harvest
waste. Extraction of the cants was accomplished by pushing the square logs downhill from the stump to
a trail. Small diesel winches were then used to pull the cants to a drainage, at which point the cants
were then pushed down the drainage to a common collection area. At the base of the drainage, water
buffalo were used to drag the cants to the road for hauling by truck (Figs. 5 and 6). CCSFC staff informed
us that the price for cants is $350 USD/m3. The area had recently become substantially more accessible
due to the construction of a new road by the Vietnamese military.

17
Figure 5. Rectangular blocks (cants) that have been sent down a narrow, steep drainage to a
landing. The water buffalo is used to pull the cants to the roadside for collection. Con Cuong
State Forest Company, April 2012.
Figure 6.Waste wood after chainsaw milling in Con Cuong State Forest Company, April 2012.
CCSFC/Protection Forest Boundary Area
Our third field visit was the boundary between CCSFC and protection forest. The area was a degraded
mosaic of medium, poor/young and mixed forest. This site had a CCSFC guard station that was
reportedly manned approximately every three days in addition to a fence barrier across a boundary trail
18
between the CCSFC and the protection forest. The boundary trail was also used as a route for hauling
illegally cut logs with water buffalo. The fence barrier was ineffective. This site had a mean dbh of 21 cm
and a mean ba/ha of 6.25 m2. The area was experiencing intensive unplanned logging as many water
buffalo skid trails went into CCSFC land. Trees 25-30 cm dbh were primarily being targeted.
PFMB Protection Forest
Our final day of plot sampling was on PFMB lands in an area of active forest degradation. The forest was
a mix of poor evergreen forest and mixed forest (evergreen and bamboo). Bamboo and banana had
high population densities at this site. The mean DBH was 35 cm with a mean site ba/ha of only 2.17 m2,
although surprisingly the largest DBH we recorded (72 cm) was at this site. Likely this was because this
massive tree was too large to be easily cut, milled or hauled. There were well-established long-distance
water buffalo skid trails that had guideposts to keep the logs from sliding sideways down the hill while
being towed. Trees 35-40 cm DBH were being targeted for harvest, as large cants similar to those at the
CCSFC logging operation were desired. There was significant swidden agriculture in the area. In
addition, we also observed our 4 PFMB ranger guides reprimand a villager with a water buffalo towing a
large (milled) illegal log. There was little confrontation although his yoke was dismantled and he was
ordered to leave the log.
5. Forest Degradation and Drivers in Con Cuong
Approach to Classifying Forest Degradation Drivers
A significant challenge globally in the monitoring and mitigation of forest degradation is that many
underlying causes, or drivers, of forest degradation are locally unique at all scales that are appropriate
for monitoring. Widespread forest degradation was evident during our field visits, but the extent and
intensity of degradation varied throughout the District and it was influenced by a variety of factors that
were not necessarily consistent across communes. Degradation also varied over time, according to the
PFMB staff. For example, unplanned logging is likely to be greater during times of food shortage
between rice harvesting periods, during the Tet holiday, and at the beginning of the school year. Thus,
driver identification and behavior (i.e., temporal and spatial characteristics) in a given landscape are
important to ensure that monitoring will effectively detect and describe associated degradation.
In this assessment, we designate drivers as direct (also referred to in literature as proximate) and
indirect (underlying or broad-scale factors) to account for the scales of influence associated with various
drivers. Defining drivers in this manner is consistent with the REDD+ driver definitions found in Kissinger
et al. (2012).
Tree Harvest for Wood Uses as a Primary Direct Driver
The primary direct driver of forest degradation was identified as tree harvest for a variety of uses. The
four basic diameter classes of trees harvested through planned and unplanned activities include:
commercial lumber (e.g., logs or cants sold for lumber or other commercial products), domestic lumber
(e.g., planks and beams for local house building), commercial fuelwood (e.g., fuel wood for crop drying
and brick making) and domestic fuelwood (e.g., fuel wood for cooking and heating), each with a
different optimal target tree diameter. The classification of harvest activities and the tree diameters that
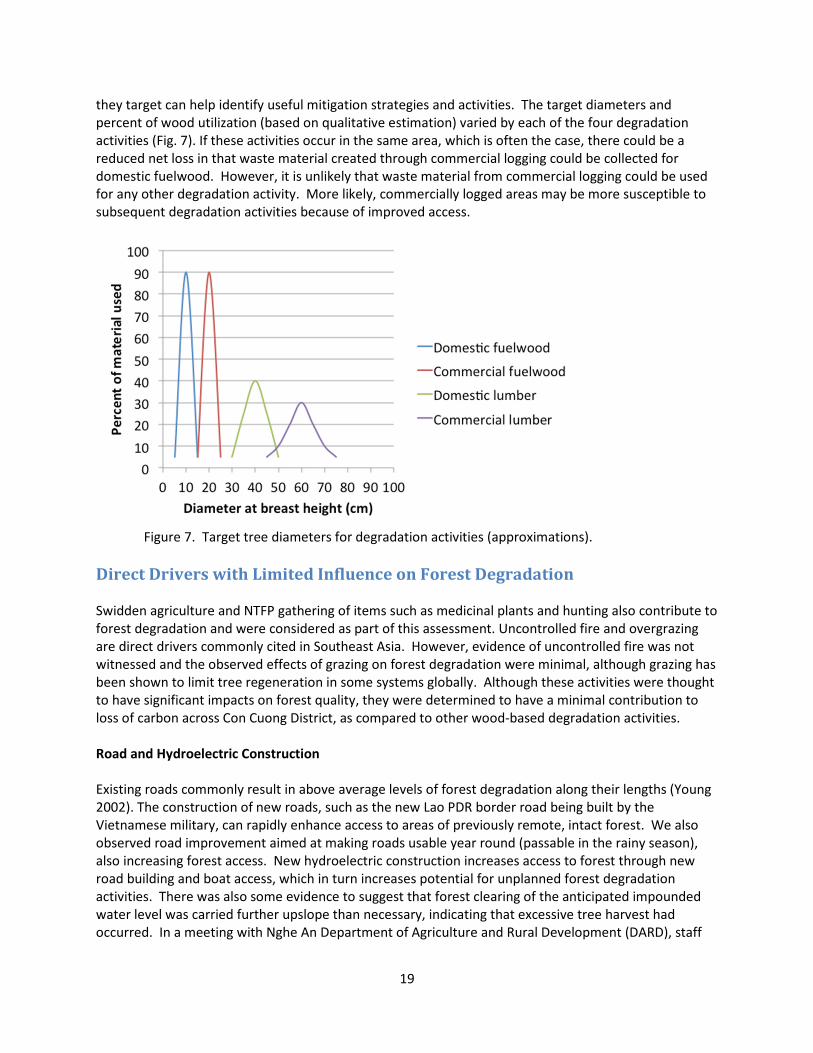
19
they target can help identify useful mitigation strategies and activities. The target diameters and
percent of wood utilization (based on qualitative estimation) varied by each of the four degradation
activities (Fig. 7). If these activities occur in the same area, which is often the case, there could be a
reduced net loss in that waste material created through commercial logging could be collected for
domestic fuelwood. However, it is unlikely that waste material from commercial logging could be used
for any other degradation activity. More likely, commercially logged areas may be more susceptible to
subsequent degradation activities because of improved access.
Figure 7. Target tree diameters for degradation activities (approximations).
Direct Drivers with Limited Influence on Forest Degradation
Swidden agriculture and NTFP gathering of items such as medicinal plants and hunting also contribute to
forest degradation and were considered as part of this assessment. Uncontrolled fire and overgrazing
are direct drivers commonly cited in Southeast Asia. However, evidence of uncontrolled fire was not
witnessed and the observed effects of grazing on forest degradation were minimal, although grazing has
been shown to limit tree regeneration in some systems globally. Although these activities were thought
to have significant impacts on forest quality, they were determined to have a minimal contribution to
loss of carbon across Con Cuong District, as compared to other wood-based degradation activities.
Road and Hydroelectric Construction
Existing roads commonly result in above average levels of forest degradation along their lengths (Young
2002). The construction of new roads, such as the new Lao PDR border road being built by the
Vietnamese military, can rapidly enhance access to areas of previously remote, intact forest. We also
observed road improvement aimed at making roads usable year round (passable in the rainy season),
also increasing forest access. New hydroelectric construction increases access to forest through new
road building and boat access, which in turn increases potential for unplanned forest degradation
activities. There was also some evidence to suggest that forest clearing of the anticipated impounded
water level was carried further upslope than necessary, indicating that excessive tree harvest had
occurred. In a meeting with Nghe An Department of Agriculture and Rural Development (DARD), staff

20
members noted that development plans such as hydropower may have unanticipated costs that
outweigh the benefits in the long run. The new road, gold mining, and hydroelectric construction
activities that are occurring in Con Cuong District appeared to increase the risk of substantial watershed-
damaging erosion during the rainy season. Water quality and aquatic dependent biota are likely to be
significantly impacted as a result.
Mining Development and Water Quality
Nghe An Province has approved 400 small-scale mining areas (Nghe An DARD, personal communication,
March 22, 2012) in addition to the larger commercial lead, zinc, gold and coal mines have been issued
permits for future development, or that are already in operation. Mines are planned but generally
loosely monitored so it is common for small mines to occur in naturally forested areas. Further, a
significant number of poles are required for infrastructure and project support for mines. These poles
come straight from the surrounding forest and are not included in mining companies harvest plans (SNV
2010).
In the Cam Lam Commune the levels of pollution in the river resulting from of a gold mine 30 kilometers
upstream were clearly high, with local residents complaining of no fish or shrimp in the river and skin
sores from bathing. Additionally, drinking water was being drawn from wells that were in close
proximity to the heavily polluted river. Low water quality can significantly impact health, well-being and
resource availability, as it cannot be used as a drinking source, for irrigation of crops, or for watering
livestock. In turn, these impacts increase the dependency on forest resources for generation of income
to maintain livelihoods. Greater dependency on forest resources may, but does not necessarily,
translate to impacts on carbon stocks.
Inefficient Wood Utilization
Inefficient wood utilization is a significant contributor to carbon storage reductions on state-owned
CCSFC lands. Logs are cut by chainsaw into rectangular cants in the forest, usually in close proximity to
where they are felled. Only one or two cants are generated from a single tree and the remaining wood
is left in the forest. CCSFC estimates 30% wood waste, although based on our field observations wood
waste may be higher than estimated. High rates of waste are a result of limited yarding, hauling and
scaling technology. Additionally, there is a single buyer who requires rectangular cants. Government
officials at scaling checkpoints prefer rectangular cants because they make load volume simple to
calculate. More efficient wood utilization could reduce the rate of harvest by increasing the yield per
tree and volume delivered to market.
Insufficient Regulatory Enforcement
In addition to minimal monitoring and regulatory efforts in the mining and hydroelectric sectors,
regulatory efforts in the forestry sector are inconsistent and often ineffective. Under Circular 38 DARD
has a process to “recheck”/remap the three forest types but implementation is inconsistent, and more
importantly, a cohesive forest plan is lacking. Forest protection rangers often patrol protection forests;
however, their ability to effectively enforce regulations in the face of impoverished local residents is
dubious. During the years of the 661 program, government funding was provided by Protection Forest
Management Boards (PFMB) to pay local households for forest protection patrolling services. Funding
for this forest degradation-limiting service is on-going (Decision No. 60/2010/QĐ-TTg and Resolution No.
30a/2008/NQ-CP), but it is unclear how long they will persist and to what degree these patrols affected

21
degradation impacts or reflected degradation activities. Pu Mat National Park employs 60 patrolling
protection rangers who are not residents of districts in which the park is located – an approach that
seems to increase the effectiveness of enforcement investments and activities.
Although non-biased monitoring is ultimately needed, undesignated forests (those not classified in some
way – special use, protected, production, plantation) were visually observed, during field visits, to be
noticeably more degraded than forests in Pu Mat National Park or family-owned forests. Again, the
LEAF land cover change assessment in Con Cuong did not find this to be the case. Family-owned forests
in villages are considered personal property and there is a culture of respecting the belongings of others.
In addition, their management is still regulated by the State and maintaining forest cover remains a
priority of the State for these lands (Nguyen et al. 2008).
Harvest levels of native forest on Con Cuong State Forest Company (CCSFC) was based on self-
assessment of capacity - state forest owners formulate their own logging plans, which in turn are
reflected in quotas provided by DARD. CCSFC is expected to cut roughly 1000 m3 annually with a
seemingly difficult to attain 100-cm minimum diameter requirement. Logging operations are not closely
monitored, particularly in the field, and the degree to which the initial plans are followed is uncertain.
Indirect Drivers
Detailed local knowledge is required to account for key local degradation drivers, such as heavily
polluting mines and local consumers of wood. We identified a wide range of indirect drivers, some of
which precipitate the use of natural resources while others set the intensity, rate and location.
International/National Market Demands
Market demands from outside Con Cuong District are the primary source of indirect drivers of forest
degradation. Most mined material, large harvested trees, and hydroelectric power eventually leave Con
Cuong District. External demand for tea grown and dried in Con Cuong District influences forest
degradation as three tea drying facilities use were observed using substantial quantities of mid-sized
wood, much of which appeared to be the result of unplanned harvest activities. The tea drying facility
we toured had 10 wood-fired ovens/machines running at one time. Firewood from Con Cuong District
also is routinely sold to intermediaries to be transported to Tan Ky District to meet the needs of the
brick factories there.
Insufficient Agricultural Land Allocation and Food Subsidies
By nature Con Cuong District has limited flat land area and therefore insufficient wet rice production to
keep the population nourished year round. Swidden agriculture (with fallow periods long enough to
allow for regrowth to meet the national definition of forest) has traditionally been practiced to
supplement wet rice production. Hill, or upland rice, cassava and maize are usually planted. The land
allocated by the government for swidden agriculture may be insufficient as the land has been exhausted
in many cases and a large and growing population requires more food, and therefore space. The
government has allocated food subsidies (predominantly rice) to households in exchange for not
practicing swidden agriculture. Local residents complained that rice subsidies were inadequate, and it
was clear that families were clearing new land for swidden agriculture to augment food resources.

22
Insufficient Intergovernmental Coordination, Market Knowledge and Information Sharing
Inefficient communication between land use planners and forest managers was identified, and cited by
DARD, as a significant indirect driver of forest deforestation and degradation. For example, severely
degraded forest that does not currently meet the VNFOREST definition of forest (e.g., commonly
consisting of primarily banana and bamboo) is required to remain forest under the 661 program. In
many instances it is unlikely that these lands will return to forest without restoration efforts. In some
instances, MARD allows these lands to be converted to other uses but this is uncommon. Converting
highly degraded accessible land to plantation or swidden agriculture could help reduce degradation
pressure on native, at-risk forests and therefore improve forest quality and carbon stocks. Likewise,
government program 134 calls for replacing thatched cottages in mountainous areas with fully wooden
homes, and program 167 supports poor households to upgrade their houses. Neither of these
programs, however, takes into account nor specifies where or how this timber will be obtained.
Meeting these government-mandated objectives is putting additional stress on native forests resources.
The lack of available agroforestry information – what to plant and where – is an information gap that, if
filled more effectively, could help increase the contribution of family gardens to meeting food resource
needs, and in turn reduce forest degradation. A single co-op agricultural advisor exists in each district
but they were characterized as commonly lacking forestry/agroforestry knowledge. Further, there is
minimal economic planning across sectors. Because there was no publicly available knowledge of
potential new or developing future markets, tree species that have high utility and could be desirable
and valuable in the near future are not planted. The creation of new products that can be derived from
smaller-sized lumber were not being explored nor promoted, and there was no discussion of what will
happen when large diameter trees no longer exist.
6. Sampling Design Foundations for Forest Monitoring
Definition of Forest
Forest is typically defined by minimum thresholds of crown cover, height and area (GOFC GOLD 2011).
FAO (2007) uses the following minimums: crown cover ≥ 10%, height of ≥ 5m and area of ≥ 0.5ha. the
official Government of Viet Nam forest definition is consistent with the FOA definition. As a point of
context, however, the Kyoto Protocol (UNFCC 2008), sets a more liberal definition that encompasses a
range of values and accounts for different aged forests: minimum crown cover 10 to 30%, potential to
reach a minimum height at maturity in situ of 2-5 m, and minimum forest area 0.05 to 1 ha depending
on the species.
Definition of Degradation
The definition of degradation has changed in response to the need for greater specificity in the source
and permanence of human alteration of forest ecosystems. Until recently, degradation has been limited
to human-induced losses of forest values that have an extended recover time relative to routine forest
management (IPCC 2003). The Intergovernmental Panel on Climate Change (IPCC 2003) describes
degradation in a variety of ways, including “direct human-induced activity that leads to a long-term
reduction in forest carbon stocks” and “the overuse or poor management of forests that leads to long-
term reduced biomass density (carbon stocks).” The most widely quoted definition of degradation from
the IPCC is “direct human-induced long-term loss (persisting for X years or more) of at least Y % of forest
23
carbon stocks (and forest values) since time T and not qualifying as deforestation or an elected activity
under Article 3.4 of the Kyoto Protocol.” This leaves longevity and magnitude of the loss for the user to
define.
Most globally established definitions of degradation reflect a, human-induced, long-term, negative
change in the forest’s structure, function and capacity to provide goods and services (Wertz-
Kanounnikoff 2008). For the purposes of REDD+ monitoring and associated information needs of Viet
Nam, the challenge is to monitor changes in carbon and forest quality within forests that remain forests.
Thus, discussions of degradation often broaden to include emissions associated with losses of forest
biomass within forests, without regard to the nature or the duration of the impact. For example, GOFC-
GOLD (2011) identified the common degrading activities in the tropics as including selective logging, fire,
and fuel wood collection. However, the magnitude of impact is usually related to the intensity and
duration of the activity, not necessarily the type of activity itself. The Second Expert Meeting on
Harmonizing Forest-related Definitions (FAO 2003) recommended using the term “stock reduction” in
the context of carbon monitoring in forests that remain forests, as opposed to “degradation” to avoid
confusion.
Our recommendations are designed to detect, differentiate, and quantify stock reductions within forests
that are the result of human activities within the context of monitoring gains and/or losses of forest
extent and carbon density. Consistent with the definition of forest, forested areas that have reduced
carbon densities (or other measures of forest quality) that remain reduced ≥ 10 years are considered
degraded.
Carbon and Forest Quality
Estimates of carbon are derived as a function of biomass. Tree biomass can be estimated directly using
ground based field measurements and allometric equations to estimate the biomass. Diameter at breast
height (DBH) is always a component of biomass allometric equations, and these equations sometimes
include tree height and wood specific gravity.
In pursuit of carbon monitoring, both sources and sinks are important to quantify, regardless of the
accounting method being used (stock-difference or gain-loss). Monitoring programs need to be as
versatile as possible in order to meet changing needs and priorities while maintaining data quality over
time through continuity in design and methods. Specifically, it is likely that a combination of the two
methods will be most effective.
Although carbon is the primary metric of interest for the purposes of REDD, forest quality is a critical
aspect of REDD+. Further, forest quality was viewed by most, if not all, of the forest managers we
visited, to be significantly reduced as a function of forest degradation activities. Forest quality is a
complex concept that encompasses biodiversity and ecosystem services. VNFOREST identified two
forest sector indicators for forest quality monitoring in 2006 that represented desired environmental
objective and outcomes: 1) forest cover (natural and plantation) by elevation and slope; and 2) number
of rare or endangered species (as indirect indicator of the status of biodiversity (VNFOREST 2006). FAO
(2003) highlighted the importance of the impacts of forest fragmentation on forest quality.
Many examples of indicators exist on the international stage. Widely used and internationally
recognized include the Montreal Process Criteria and Indicators for temperate and boreal forests (C&I
2009). This internationally developed and adopted set of indicators of forest sustainability identifies

24
seven criteria for the conservation and sustainable management of forests that are equally relevant in
Viet Nam and throughout Southeast Asia:
1 – conservation of biodiversity;
2 – maintenance of productive capacity of forest ecosystems;
3 – maintenance of forest ecosystem health and vitality;
4 – conservation and maintenance of soil and water resources;
5 – maintenance of forest contribution to global carbon cycles;
6 – maintenance and enhancement of long-term multiple socioeconomic benefits to meet the
needs of societies; and
7 – legal, policy, and institutional framework.
Indicators associated with criteria 1-4, which pertain directly to forest conditions, were parsed into tiers
roughly corresponding to the resolution of tiers outlines for REDD+ carbon monitoring (C&I 2009; Annex
C). Assuming a target minimum monitoring level equivalent to Tier 2 for Viet Nam, Table C-1 outlines
indicators of criteria 1-4 for consideration in forest quality monitoring for REDD+ in Viet Nam. These
indicators could be used to evaluate the ability of various monitoring approaches to achieve forest
carbon and forest quality monitoring objectives.
Target Data and Strata
The sampling design is a fundamental part of the development and evaluation of monitoring programs
intended to support decision making. The efficient use of time, money, and human resources to obtain
representative, accurate, precise and repeatable data are critical considerations in considering options
in a sampling design for forest monitoring. In this section, we outline the elements to be considered in
the development of a sampling design for forest monitoring at sub-national scales (e.g., District,
Province, ecoregion) in Viet Nam and the recommended parameters to use in the design (Table 4).
Target Data
We recommend evaluating monitoring options with carbon, degradation sources, and forest quality as
cumulative objectives, and using Montreal Criteria and Indicators (Annex C) as a source of indicators for
forest quality.
Target population
The target population is all forested lands in Viet Nam. Remote sensing will be key to tracking changes
in the location and extent of forest, since some areas will move into and out of forested status. The
IPCC (2006) states that if a forest that has not been permanently converted to another use (e.g., rice
paddy), but does not meet the definition of a forest (≥30% canopy cover) for ≥ 20yrs, that it be
considered deforested. If the area is reestablished as a forest after that time period, then it is
considered afforested. For example, if sampling is conducted every 4 years, a forest that existed in the
first sample period would have to be in a non-forested condition (e.g., swidden agriculture) in both the
second and third sample periods (4 and 8 years later) before considered deforested.

25
Table 4. Representation desired from REDD+ forest monitoring.
Representation Components
Target population • All forested lands
Data
• Biomass gains and losses (from which carbon stocks can be
estimated)
• Activities associated with losses (proportional allocation)
• Forest quality (plant and animal indicators)
Geographic area • National
• Province
• Land owner
• Ecoregion
Forest types Native forest
• Evergreen hardwood forest
• Mixed hardwood/bamboo forest
• Bamboo
• Mangrove
• Other
Plantation forest
• Bamboo
• Acacia
• Other
Forest designations • Special Use Forest
• Protected Forest
• Production Forest – natural
• Production Forest – plantation
Geographic Areas
There are four primary geographic delineations that were commonly identified by Vietnamese agencies
and personnel during our assessment as desired for reporting for carbon and other forest attributes:
national, ecoregion, province, and individual forest owner. Provinces were the primary sample unit of
interest – most planning and capacity building efforts, such as data management and reporting, target
the Province level as the target scale. There are 63 provinces (including 5 municipalities) ranging in size
from 823 km2 to 16,499 km2, the largest of which is the Nghe An Province, and with an average size of
5260 km2 (+/- 3670 km2). Ecoregions are a logical and useful geographic delineation for monitoring
forest conditions, including carbon. They represent major zones of physical and climatic conditions and
biological diversity, and thereby typically represent a unique set of forest types and species.
Concomitantly, they tend to represent a cohesive suite of human activities, forest uses, and drivers of
degradation. Ecoregional designations within Viet Nam vary depending on the source: Olson et al.
(2001) state that there are 18 global ecoregions that occur within Viet Nam; and alternatively provinces
can be grouped within-country into 9 general ecoregions.
Given the large number of Provinces and landowners in Viet Nam, it is not feasible to design or even
estimate requirements for Tier 2 monitoring to achieve specified accuracy and precision objectives for
each Province or forest owner. We recommend applying representation, accuracy, and precision targets
to be evaluated relative to reporting for ecoregions, forest types, and land use designations (below).

26
The need and capacity to improve estimates at the Province scale can be based on the first generation
of change data. Landowner estimates would have to be a function of land-owner or commune-level
efforts, such as might be accomplished through PFM.
Forest Types and Designations
Carbon and forest quality conditions and threats vary widely among forest types. The primary forest
types of interest are in broad categories: native forests include evergreen hardwood, mixed
hardwood/bamboo, bamboo, mangrove and other; plantation forests include bamboo, acacia, and
other. Recommendations that above-ground carbon be tracked in terms of shifts among primary forest
types (i.e., ‘disturbance matrix’, Wertz-Kanounnikoff 2008) would require post-stratification by forest
type. Forest designations are also important for tracking both carbon and forest quality because we
observed a very different forest degradation type and intensity as a function of forest designation. It is
also of great interest to the government to determine if forest protection objectives are being met as
intended through the forest designations. The primary forest designations are special use, protection,
production- natural, and production-plantation.
Accuracy and Precision
Accuracy and precision objectives are primary basis for determining the level of uncertainty we are
willing to accept in estimates of population parameters. Accuracy is the closeness of a measurement of
a quantity to that quantity’s actual (true) value. Precision is the closeness of - repeated measurements
of the same quantity. For example, if we are interested in detecting a change in forest area of 10% from
the current level of 39%, then what degree of uncertainty are we willing to accept that we have or have
not achieved this goal? Accuracy is a function of representation and measurement error, whereas
precision is a function of natural variability, sample size, and measurement error.
The first step is to determine the degree of change of interest – the effect size of interest - over what
period of time. Our primary parameters of interest are carbon and forest quality, with degradation
activities serving as an important link to the need for and effectiveness of interventions (i.e.,
adaptation). The amount of change of interest to detect in each primary parameter must be specified
so that sample size requirements can be determined. Effect size can be based on existing data, local
knowledge, or best estimates.
Resource monitoring is gravitating toward the goal for error rates at greater than 5%, and an explicitly
set ratio of type I errors (the chance of falsely detecting a change when there is none) and Type II errors
(the chance of not detecting a change when one exists) (e.g., Stefano 2001). It is the Type II errors, not
detecting a change, that is the greatest priority in a monitoring effort, but ideally the two error terms
are in balance with one another and reflect an attempt to reduce the errors that carry the greatest risk.
We recommend starting with an equal 1:1 ratio of Type I and Type II errors. We also suggest that error
rates of 5% are generally too costly to achieve, and recommend a target of 10% error, and an initial
tolerance for error rates of 20%. The risk associated with error rates, of course, is a function of effect
size, so these are general rules for Type I and Type II error rates that can be refined over time. With
these parameters set, we can evaluate the strengths and weaknesses of various monitoring methods
and approaches. Pilot sampling can help determine acceptable error rates, given the variability among
the sampling units and the capacity for obtaining sufficient data, e.g. the number of field plots needed

27
to reach monitoring objectives that can be reasonably obtained. This flexibility will help avoid designing
a monitoring system that cannot meet objectives, or that cannot be implemented.
7. Monitoring Design Recommendations
Design of Standardized Local Field Measurements
NFI provides an important and valuable source of vegetation data to regional and national estimates of
forest cover and condition, however the number and density of samples is too low to serve sub-regional
information needs on any of the target data needs: carbon, forest quality, and degradation.
Standardized local field sampling is needed to fulfill information needs for forest conditions at the
appropriate range of scales to meet Tier 2 and certainly to meet Tier 3 REDD+ monitoring requirements.
The design of standardized local field measurements could take a range of forms – e.g., plots located
using a systematic grid, transects or random plot locations with pre-stratified land allocations,
completely random plot locations - and would not necessarily need to be consistent across all provinces.
A systematic grid is still likely to be the most versatile approach for local field measurements, with
variable densities and measurement frequencies being the means by which efficiencies are gained. For
example, higher densities of sample plots or more frequent sampling could be conducted in areas that
are at greatest risk of degradation or other sources of change (Schelhas and Sanchez-Azofeifa 2006). In
Con Cuong District, protected forest areas in close proximity to villages might warrant higher densities
and/or more frequent measurement. Conversely, vast expanses of forest in special use areas far from
habited areas may be sufficiently characterized by a lower density of plots or less frequent
measurement.
Sub-national Systematic Grid
We recommend that at a baseline systematic grid with a density of approximately one plot for every
3,000 ha with the plot randomly located within the grid. These plots would be permanent plots that
employ some array of standard forest measurements within a 0.10 to 1.0 ha area, and with a
remeasurement frequency of every 4 years to be established for each Province. The 4-year frequency is
based primarily on greenhouse gas reporting requirements. Biennial update reporting of GHG
inventories by non Annex I countries to the UNFCCC is every 2 years; non-annex I countries do not yet
have a fixed date for submission of their National Communications documents, but generally they
should be submitted within four years.
Given the time consuming nature of monumentation (i.e., tagging every tree with unique numbers), and
the challenge of relocating and precisely resampling vegetation, it might not be important or valuable to
sample exactly the same locations in each sample period. Further, the potential impact associated with
avoiding marked plots is not to be under estimated, particularly since the primary source of degradation
is likely to be unplanned logging. We recommend that sample plots associated with the systematic grid
be monumented only at the center point to reduce the cost and any potential bias that might result
from tagging all the trees in the plot. The time gained by not tagging all trees and could be used to
establish additional plots, with a net gain in efficiency and precision.
It would be highly efficient for the standardized sample plots to use a subset of the revised NFI field
protocols as the baseline protocols to be implemented at all grid points. For example, the data could be

28
used to augment NFI data in training and validating interpretations of remote sensing. Provinces and
districts can add protocols to plots as needed or desired across part or all of a District or Province during
one sample period or repeated over time. Consistency in a core set of field methods across all Provinces
would be highly beneficial for a variety of applications.
Targeted Sample Plots
In addition to the systematic-grid, we recommend additional targeted sample plots (using the same field
methods as grid plots) be located in areas of particular interest or concern to meet sample size
requirements for common conditions (as needed) and to improve the representation of other conditions
of interest (i.e., high risk, high value, high interest), such as less common forest types or conditions,
degradation activities of specific interest, and areas of rapid change or risk of high degradation. For
example, areas identified as high risk of degradation or otherwise expected to experience more rapid
change (e.g., in proximity to roads and villages, active commercial logging areas) would be the target for
additional plots. Numerous studies using this technique and others have led to the ability to efficiently
estimate carbon losses associated with specific types of degradation (e.g., Harris et al. 2012).
Strategically located plots should be placed using a stratified random sampling technique to ensure that
samples are representative of the strata (condition) of interest. The number of these strategically
located plots can vary over time and will depend on resources (time and funding) and priorities. Thus,
they are a flexible and highly efficient addition to an otherwise fixed sampling design to address
changing needs
Accuracy and Precision recommendations for key forest condition parameters are as follows:
• We suggest setting the change detection goal of the ability to detect a 10% change in crown
cover by units or designations of interest (e.g., ecoregion, forest type, land use designation).
This will enable managers to gain an understanding of the spatial relationships between forest
quality and specific threats and drivers, in order to identify where degradation is occurring, and
to populate disturbance matrices.
• We recommend that the maximum effect size be 10 t C/ha, with a target effect size of 5 t C/ha,
over the course of 4 years. This reflects the assertion that most existing native forests are
already degraded to some degree such that most will have 100 t C/ha or less. Given that we can
only roughly estimate CCC based on forest type, and that monitoring cannot be customized by
forest type, we need to translate these general principles into concrete, fixed values since
credits pertain to absolute increments of carbon, not relative gains or losses.
• We suggest that the remeasurement period be every 4 years to correspond to Greenhouse Gas
emissions reporting, and also accomplish NFI remeasurement goals and to provide a reasonable
periodicity for deriving annual estimates of change.
• We recommend a minimum mapping unit of 0.5 ha to correspond to the minimum size of an
area to be designated as forest.
The Role of Statistical Modeling to Estimate Conditions
Statistical modeling is an essential tool for determining status and change of natural resources over time
and across landscapes. The selection of analysis and modeling techniques are an integral part of
designing a monitoring approach. Estimates of carbon and greenhouse gas emissions can be based
directly on field data, or based on interpretations of remotely sensed data, or they can be modeled
using a wide variety of data sources. In general, conditions that are difficult to determine with remote

29
sensing data alone are estimated based on predictable relationships (correlations) with conditions that
are more readily measured and quantified or mapped. For example, the degree of forest degradation
may be predictable, or at least some of the variation could be explained by examining their relationship
with more easily obtained parameters such as topography, slope, precipitation, proximity to roads,
human population densities, poverty levels, proximity to borders, etc. The relationships can be
determined using statistical modeling based on a set of representative sample points with reliable field
data on parameters of interest (e.g., biomass), and mapped data layers obtained through remote
sensing or other reliable sources. Further, determining change relative to reference levels and/or
change over time can be accomplished using any one of a number of statistical modeling approaches,
each of which has its own set of biases and sample size needs.
In the case of monitoring carbon stocks and emissions over time, statistical modeling can provide
estimates for a variety of applications, including but not limited to the following:
1) Field data on forest conditions can be used for satellite imagery interpretation of forest type and
canopy closure;
2) Field data on forest conditions can be used to determine average standing biomass associated
with forest type/canopy closure combinations (polygons) within a landscape and then attribute
polygons with those values;
3) Field data on forest conditions and degradation activities can be used to determine the type
and/or the carbon “discounts” or reductions from degradation that are typically associated with
certain management actions (e.g., selective logging), conditions (e.g., road access), or contextual
surroundings (e.g., poverty level, topography, population density), and then reduce average
biomass estimates based on their management and/or context;
4) Field data can be used to extend inferences beyond biomass and emissions to other facets of
forest quality, such as tree species diversity, plant species diversity, invasive species impacts,
and habitat suitability for wildlife; and
5) Estimates of biomass, degradation, other forest condition characteristics can be applied across
landscapes and projected over time using mapped data as predictors;
One must be prudent in the interpretation of statistical modeling estimates across landscapes, given
that they are by nature inaccurate to some degree, and can have moderate to poor precision depending
on the characteristics of the input data. These errors are difficult to track through multiple analytical
steps, thus error propagation can undermine the reliability of estimates. In general, design-based
estimates will have greater precision but more limited utility than landscape-scale estimates of
conditions that are derived from design-based data. In terms of degradation, planned timber harvest
activities may be a source of degradation for which reliable estimates could be developed and then used
to attribute harvested areas in the future without remeasurement.
Individual unplanned activities will be difficult to predict and attribute with biomass impacts because we
observed overlapping unplanned degradation activities occurring in many locations, particularly those
with high demand and good accessibility. Further, the location and character of unplanned degradation
activities are more variable over time because they reflect of a wide range of influences. We
recommend estimating overall degradation intensity (not by individual activity) given contextual
conditions, and continue to validate and correct these estimates with periodic field measurements. In
any case, it is important for monitoring efforts to have a high probability of detection for the composite
of degradation impacts in a given location. The lower the intensity, the more difficult it is to detect the
activity. The relevance of detectability in monitoring is that the lower the detectability, the greater the
sample size required to achieve the same statistical power to detect a change. Further, sample size

30
requirements tend to increase geometrically with declines in detectability, meaning that a sampling
method that has a higher probability of detection is likely to require a much lower sample size to
achieve a given level of precision in detecting change.
Remote sensing and field measurements have differing abilities to detect the primary degradation
activities (Table 5). Consideration of the types of activities occurring in a given area and what type of
methods will be required to detect them as a composite will be a valuable exercise.
The combination of field measurements and remote sensing data can be used for any number of
statistical modeling applications to estimate, predict, and project conditions that are not the primary
target of REDD+ but that are important aspects of forest quality. For example, if animal data are
collected at a subset of points within a Province during one measurement period, those data could be
used to develop predictive models of species occurrence based on imagery and other spatially explicit
data. These models can be used to predict probability of occurrence or abundance for one or many
species across large landscapes, including entire Districts and Provinces, at any point or multiple points
in time. Statistical modeling approaches such as this can be used to leverage existing data to greatly
increase the ability of monitoring to address questions, including forest quality and biodiversity.
In summary, statistical modeling is an essential tool in monitoring and reporting for REDD+. Empirical
data obtained from a variety of sources provides the input data – the raw material - for statistical
modeling, which is the means by which those data are used to generate output data for various
applications (Fig. 8). Carbon density estimates and maps and resulting greenhouse gas emission
estimates will be, in most cases, a function of iterative modeling steps where outputs from one
modeling step become inputs into a subsequent modeling step to arrive at final desired outputs.

31
Table 5. Detection capabilities of forest monitoring data sources for specific degradation activities.
Commercial/
non-commercial
selective
harvesting
DBH ≥ 45 cm
Commercial/
non-commercial
pole/fuelwood
extraction
DBH 5-44 cm
Swidden
agriculture/
shifting
cultivation
Confirmed by
village surveys/
activity data
Fire
Continuous fire
area ≥ 10 ha
(allowing for
spatial
complexity)
Low resolution
remote sensing
(e.g. MODIS)
Some
detectability of
multiple crowns
removed in close
proximity
Not possible 5 ha field, needs
to occur
biannually or
annually
Detectable at
size considered
not part of slash
and burn
Medium
resolution
remote sensing
(e.g. LandSat)
Detectability of
multiple crowns
removed in close
proximity. 10-
20% canopy
disturbance
May be
detectable, if
multiple stems
harvested in
close proximity.
Not possible if
covered by
overstory
1-2 ha field,
needs to occur
biannually or
annually
Detectable
High resolution
remote sensing
(e.g. RapidEye)
5m individual
tree crown
detectable. 2
trees/8m3
Detectable. Not
possible if
covered by
overstory
Very detectable,
needs to occur
biannually or
annually
Detectable
Permanent plot
data
Forest type,
condition, counts
of removed
trees, local
names & DBHs of
harvested trees
Forest type,
condition, counts
of removed
trees, local
names & DBHs of
harvested trees
Presence/
absence,
estimate of years
in fallow, counts
of “saplings”,
year of last
clearing/burn
Presence/
absence, counts
of burned
stumps (cut
trees), measures
of severity,
intensity &
spatial pattern
Targeted plot
data
Forest type,
condition, counts
of removed
trees, local
names of
harvested trees
(if possible)
Forest type,
condition, counts
of removed
trees, local
names of
harvested trees
(if possible)
Presence/
absence,
estimate of years
in fallow, counts
of “saplings”
Presence/
absence, rough
counts of burned
stumps (previous
trees)
Observational
survey data
(PFM)
Presence/
absence, local
names of
harvested trees
(if possible)
Presence/
absence, local
names of
harvested trees
(if possible)
Visual presence/
absence and
verbal history of
swidden
agriculture land
use history from
villagers
Presence/
absence, rough
estimate of
extent

32
Figure 8. Information inputs and outputs associated with monitoring to address the status and
change of forest conditions. Inputs consist of data sources (green), and the data that are
derived from them (blue). Outputs consist of design-based estimates of forest parameters and
map products of forest parameters derived through statistical modeling.

33
8. Summary of Monitoring Recommendations
Box 1. Recommended Target Sampling Design Parameters for
Forest Degradation Monitoring in Viet Nam
Definition of Forest
We recommend the following parameters be used to define forest: crown cover ≥ 10%, comprised of
tree species whose height at maturity is ≥ 5m, and a minimum area of 0.5 ha (differs from current
definition of forest for GHG reporting in Viet Nam of 30% crown cover, > 3m height at maturity, and
0.5 ha). Further, areas with trees that are not converted to other uses, but do not meet these
minimum criteria for ≥ 10 years are considered deforested.
Definition of Degradation
Our recommendations are designed to detect, differentiate, and quantify stock reductions within
forests that are the result of human activities within the context of monitoring gains and/or losses of
forest extent and carbon density. Consistent with the definition of forest, forested areas that have
reduced carbon densities (or other measures of forest quality) that remain reduced ≥ 10 years are
considered degraded.
Target Data: Carbon and Forest Quality
We recommend designing monitoring to address carbon, forest quality, and degradation activities so
that investments in data beyond carbon can be built on the same monitoring foundation. We
recommend evaluating monitoring options with carbon, degradation activities, and forest quality as
cumulative objectives, and using or developing indicators (such as the Montreal Criteria and
Indicators) as measures of forest quality. Strata of interest for post-hoc analysis and interpretation
include Districts, ecoregions, forest type, and forest designation.
Accuracy and Precision
We suggest the following thresholds be applied to forest monitoring designs: minimum density of 1
plot per 3000 ha; minimum mapping unit of 0.5 ha, minimum change detection of 10% crown cover
per strata of primary interest (such as forest type, ecoregion, District), maximum error rates for
detecting change (type I and type II errors) ≤ 20%, with target rates of ≤ 10%, minimum change
detection of 10 t C/ha of carbon (roughly ≥10% loss of carbon) with a target of 5 t C/ha, and a
maximum 4-year remeasurement frequency.

34
Box 2. Sub-National Forest Monitoring Recommendations
Monitoring Triad
We recommend a combination of remote sensing, standardized sampling plots (permanent and
targeted temporary), and participatory monitoring to address carbon, forest quality, and degradation
activity monitoring needs.
Standardized Field Measurements
Standardized field measurements are recommended to consist of three components: 1) the National
Forest Inventory (not addressed in this report), 2) a more intensive systematic grid of permanent
sample plots with simplified field measurements, and 3) strategically located temporary sample plots
that target areas of high risk or change. A baseline set of consistent field measurement protocols
used for all standardized local field measurements – a subset of NFI protocols - would be most
beneficial to obtain reliable estimates of conditions at sub-national scales and facilitate spatial
modeling a range of forest characteristics over a range of scales.
We recommend a more intensive, sub-national systematic grid be established, ideally based on a
densification of the NFI grid. Evaluate sample plot density needs to meet representation, accuracy,
and precision targets for a diversity of strata - ecoregions, Districts, primary forest types – in the
process of setting target sample density. Initial design parameters for the intensive systematic grid
plots:
- Conducted by individuals with relevant and specific field training
- Increase density of NFI, or plots comparable to NFI to 1/3000 ha in target district
- Systematically grid with randomized plot locations
- Permanent plots (no tree tags) with 4-year remeasurement frequency
Targeted temporary sampling plots are recommended to be strategically located to increase
representation or reliability of estimates of areas or strata of interest (e.g., high risk, rapid change).
Their primary function is to improve degradation intensity and carbon loss estimates, but can be used
to improve overall carbon density and forest quality estimates. Targeted sampling plot parameters:
- Conducted by forest protection rangers and district data manager
- Target forest types or conditions
- Randomized plot locations in area of interest
- Same protocols as sub-national intensified grid plots
Participatory Forest Monitoring (PFM)
Participatory Forest Monitoring targets collection of data on degradation activities by type of activity
(driver), and is accomplished by citizens with limited training and oversight. Additional data collection
could be added to PFM protocols – such as occurrence of high value or large diameter trees – but we
recommend designing standardized field measurements to meet forest characteristic data needs.
- Base – Presence/absence activities, conducted by villagers without supervision after initial
training, likely using a transect method.
- Add-ons – Measurements (primarily DBH), conducted where possible, may vary by district within
province.

35
9. Capacity Building
Overview
Environmental monitoring requires a host of skills and abilities. Activities include sampling design
development, field method development and testing, participatory rural appraisal and assessment, field
data collection, data management, data analysis, data interpretation and reporting, and monitoring
approach evaluation and refinement. Core skill sets will be important to develop and retain as part of
the government’s investment in REDD+ monitoring, while others are less critical. In general, skills that
are essential to daily, weekly, monthly, and yearly functions are best to develop and retain, whereas
functions that are performed less frequently (e.g., every 4 years) can be garnered through outside
resources with minimal risk to achieving monitoring objectives in a timely and efficient manner. In
terms of field sampling, skills associated with the following activities could be readily obtained through
collaborative efforts with donor countries and other partners, but are recommended to retain in-
Box 3. Role of Modeling in Degradation Monitoring
Role of Statistical Modeling
Statistical modeling is an essential tool in monitoring and reporting for REDD+. Empirical data
obtained from a variety of sources provides the input data – the raw material - for statistical
modeling, which is the means by which those data are used to generate output data for various
applications.
Carbon density estimates and resulting greenhouse gas emission estimates will be, in most cases, a
function of iterative modeling steps where outputs from one modeling step become inputs into a
subsequent modeling step to arrive at final desired outputs.
We recommend estimating overall degradation intensity (not by individual activity) given contextual
conditions, and continue to validate and correct these estimates with periodic field measurements.
Limitations of Statistical Modeling
One must be prudent in the interpretation of statistical modeling estimates across landscapes, given
that they are by nature inaccurate to some degree, and often have moderate or low precision. These
errors are difficult to track through multiple analytical steps, thus error propagation can undermine
the reliability of estimates.
Planned timber harvest activities may be a source of degradation for which reliable estimates could be
developed and then used to attribute harvested areas in the future without remeasurement.
Individual unplanned activities will be difficult to predict and attribute with biomass impacts because
they often co-occur in the same forested area, and they can change rapidly over time in their location
and intensity.
We recommend estimating overall degradation intensity (not by individual activity) given contextual

36
country ideally by Vietnamese nationals: sampling design, field method development and testing, and
data analysis and interpretation (e.g., initial and 4-yr snapshots of forest extent and condition through
the integration of remote sensing and field-based data sources). Skills that will be important to develop
and retain at the District, Province and National levels will be basic field data collection, data
management, and basic data analysis, interpretation, and reporting (e.g., annual data summaries, data
quality assessments). In addition to physically collecting and managing data and reporting results, it will
be important to develop and retain modeling skills to respond to national annual assessment and
reporting requirements for REDD+ compliance. Spatial modeling requires substantial investment in
training, and might best be targeted for the Province or multi-Province scale. This assessment provides
general guidelines and next step for capacity building in preparation for REDD+. Once monitoring tools
and data sources are selected, we recommend the development of an implementation plan that
outlines roles, responsibilities, and products associated with each primary spatial scale and temporal
increment (Table 6). Monitoring objectives at the sub-District scale can be identified and monitoring
efforts tailored to meet them as needs and resources allow.
Table 6. Example of spatial and temporal scales of monitoring and reporting activities.
District Province National
On-going • Field data collection for
SLFM and PFM
• Quality control checks
on field activities –
SLFM and PFM
• PFM methods training
• Summarize data across
Districts
• Evaluate consistency
across Districts
• Integrate District and
NFI data
• Field data
collection for NFI
Annual • SLFM and PFM data
summary and reporting
• SLFM methods training
• PFM program review
• SLFM data compilation
and reporting
• SLFM implementation
review
• Annualized modeling of
forest extent and
condition
• NFI
implementation
review
Every 4 years • PFM methods and
design review
• SLFM methods and
design review
• Integrated assessment of
land use, forest
conditions, well-being
• Remote sensing
data acquired and
interpreted
• Entire monitoring
system review
Remote Sensing
The application of remote sensing of forest resources in developing countries is generally conducted by
NGOs, foreigners, or western-educated contractors that work for government agencies. However, Viet
Nam is now gaining enough capacity in institutions such as STI that internal remote sensing capacity is
feasible in the near future. The capacity to obtain and analyze remotely sensed data seems to be an
important one to develop within one or more government agencies. Many of the goals of the
SilvaCarbon group are centered on remote sensing training and capacity building at the national level.
Remote sensing data manipulation and interpretation skills could likely can be successfully developed at
the national level by Government of Viet Nam scientists with the help of SilvaCarbon and FAO-Finland

37
training. Ideally some remote sensing skills would be developed at the Province level to create a robust
MRV system.
Like most remote sensing applications, modeling usually is not performed by government agencies in
developing countries, but as is the case with remote sensing, Government of Viet Nam agencies appear
ready to perform much of their own modeling, which is highly advantages. Simple carbon modeling tools
and techniques such as the use of locally inventoried volume, global biomass expansion factors,
standard annual growth rate estimates, and spreadsheets (see Gibbons et al. 2011) can help advance
potential REDD+ activities in Con Cuong District. The Nghe An DARD repeatedly expressed their desire
for capacity building assistance from LEAF/USFS in climate change modeling, risk assessment and
implementation of mitigation strategies.
Field Measurement and Data Management Capacity
Capacity building assistance in degradation monitoring was requested at the national, provincial and
district levels during our assessment in Viet Nam. This report presents monitoring options, but
additional specifics on design likely will be needed to reach readiness for implementation. USFS could
provide this advice; however, piloting of preferred approaches in Con Cuong District, especially if PFM or
SLFM ranger monitoring is used, would be advisable and advantageous. Database design, methods of
data entry, and data management are a concern at all levels. SilvaCarbon and FAO-Finland are providing
advice on this matter at the national level, but additional capacity building is needed at the Provincial
and District level. A data manager or a position whose description includes data management would be
very useful and effective at the District level.
Building capacity for field measurements at the local level will be essential to successful carbon and
forest quality monitoring in Viet Nam. USFS/LEAF can assist in the initial training of basic forest
measurement techniques, but eventually there will need to be staff to train and coordinate PFM/PFMB
forest ranger monitoring on an on-going basis. PFMB forest rangers have more skills and training than
most villagers, but they still would need substantial training to effectively contribute to a reliable
monitoring program.
Integration of Monitoring and Forest Outcomes
Our assessment identified a range of social and institutional factors that link forest conditions, forest
management, quality of life, and forest monitoring objectives. For example, there are efforts to increase
the efficiency of fuel use for cooking. The effectiveness of these efforts would ideally result in a
decreased rate of degradation of forests as a result of the removal of fuels. Monitoring designed with
these linkages in mind will ultimately be more useful in addressing long-term forest objectives. Annex D
offers some specific thoughts on this subject.
10. Next Steps
Our assessment identified a number of tasks that would further the ability of Viet Nam to prepare and
successfully participate in REDD+ at the sub-national level. Of course preparedness at the sub-national
level is not independent of larger scales, including National preparedness. Thus, we identify actions
here that we believe will help move forward across a range of scales.

38
A workshop to discuss the recommendations coming from this and the other two sub-national
assessments (Laos and Cambodia) was organized by the LEAF program in November 2012, Bangkok,
Thailand). The workshop was very successful, and the resulting proceedings and planned synthesis
paper will further expand the distribution of knowledge gained by these assessments. The workshop
made it clear that many the applicability of various data sources, sampling designs, and analysis
approaches had been used and tested in various contexts, there remains uncertainty about how best to
design monitoring to effectively detect and quantify degradation impacts on forests. We suggest that
implementation of a sub-national monitoring demonstration program for one or two Districts is the next
step, and will be essential to test, refine, and finalize monitoring recommendations.
Our sub-national assessment targeted Con Cuong District, and this District would be a logical candidate
for a demonstration project for training and implementation of standardized local field measurements.
Another good candidate would be the Lam Dong Province where the LEAF program is also actively
testing monitoring options, including PFM. The effective interface and complementary design of these
two data sources will be critical to the success of carbon and degradation monitoring. It would be ideal
to have both of these approaches co-located and coordinated as part of a demonstration project in at
least one District, and ideally multiple Districts. Demonstration project objectives could be met within a
1-year period, with field efforts designed for a 3-6 month period.
We suggest that the proposed recommendations be discussed among potential collaborators, and then
a demonstration be conducted through a collaborative effort between the government of Viet Nam and
the potential collaborators - entities that are well positioned to contribute such as the US Forest Service,
SilvaCarbon, LEAF, Winrock International and USAID. The implementation of a field demonstration and
validation effort would entail the following:
1) Identify goals, monitoring questions, and information needed to meet monitoring objectives,
including identification of primary degradation activities;
2) Identify existing capacity – organizations, staff, and positions – that would be the target of
training and implementation of standardized field sampling and PFM
3) Specify methods and associated data analysis for standardized field sampling and for PFM;
4) Obtain moderate to high resolution remote sensing data for the area and evaluate the degree
to which forest conditions (forest cover, forest type, canopy cover) can be derived across the
area;
5) Develop sampling grid and establish location of permanent grid-based plots;
6) Identify conditions that are undersampledbased on local and regional priorities and determine
the location and number of targeted sample plots that will be measured for the current sample
period;
7) Design and conduct training for field personnel;
8) Supervise field data collection for standardized field measurements and PFM;
9) Conduct data analysis to determine the degree to which each data source (grid plot, targeted
sample plots, remote sensing data, PFM data) alone and in combination with each other and
other available data (e.g., topography, roads, population density) to assess current conditions
and change at various scales;
10) Determine the degree to which PFM contributes to monitoring degradation and the value of
PFM for increasing local interest in maintaining and restoring forest quality; and
11) Refine recommendations as informed by field testing and analysis.

39
11. Literature Cited
C&I. 2009. Criteria and indicators for the conservation and sustainable management of temperate and
boreal forests: the Montreal Process. 4th edition, October 2009.
FAO. 2003. Second Expert Meeting on Harmonizing Forest-related Definitions for Use by
Various Stakeholders, jointly organized by IPCC, FAO, UNEP, CIFOR and IUFRO on
September 11-13, 2002 in Rome.
FAO. 2007. Brief of National Forest Inventory (NFI), Viet Nam. FAO MAR-SMF Working Paper 30/ 2007.
Rome.
FAO/MARD. 2012. Land cover and forest type mapping for National forest inventory in Viet Nam.
Ministry of Agriculture and Rural Development and the Finland Food and Agriculture Organization.
http://typo3.fao.org/fileadmin/templates/faovn/files/Administration/
VN_ForestMapping_2012_NFA.pdf
FAO and Government of Viet Nam. 2011. FAO/Project of the Government of the Socialist Republic of
Viet Nam GCP/GLO/194/MUL (FIN) Project Document: Support to National Assessment and Long Term
Monitoring of Forest and Tree Resources in Viet Nam (NFA).
FCPF/RPP. 2011. Forest Carbon Partnership Facility readiness preparation proposal. Socialist Republic
of Vietnam. March 4, 2011. https://www.forestcarbonpartnership.org/sites/
forestcarbonpartnership.org/files/Documents/PDF/Mar2011/
General Statistics Office. 2012. Average population growth by province: 2009. Statistics Documentation
Centre - General Statistics Office of Viet Nam. http://www.gso.gov.vn.
Gibbon, A., Evans, V., Langford, T. B., Chien, N. T., Lai, T. Q., Nguyen, T. 2011. Feasibility study for the
potential of land based carbon project development in LocBac SOC, Lam Dong Province, SOC. SNV Viet
Nam and Rainforest Alliance, London UK.
GOFC-GOLD. 2011, A sourcebook of methods and procedures for monitoring and
reportinganthropogenic greenhouse gas emissions and removals caused by deforestation, gains and
losses of carbon stocks in forests remaining forests, and forestation. GOFC-GOLD Report version COP17-
1, (GOFC-GOLD Project Office, Natural Resources Canada, Alberta, Canada)
Harris, N.L., S. Brown, S.C. Hagen, S.S. Saatchi, S. Petrova, W. Salas, M.C. Hansen, P. V. Potapov, A.
Lotsch. 2012. Baseline map of carbon emissions from deforestation in tropical regions. Science
22(336):1573-1576.
IPCC. 2003. Report on Definitions and Methodological Options to Inventory Emissions from Direct
Human-induced Degradation of Forests and Devegetation of Other Vegetation Types.
IPCC. 2006. Guidelines for National greenhouse gas inventories. Volume 4: Agriculture, forestry and
other land uses.

40
Keith H., Mackey B.G., Lindenmayer D.B.2009. Re-evaluation of forest biomass carbonstocks and lessons
from the world’s most carbon dense forests.Proceedings of theNational Academy of Science,
106:11635–11640.
Kissinger, G., M. Herold, V. De Sy. Drivers of Deforestation and Forest Degradation: A Synthesis
Report for REDD+ Policymakers. Lexeme Consulting, Vancouver Canada, August 2012.
Klassen, A. 2010.Innovations in RIL Technology. Tropicalforestfoundation.org/projects/Indonesia. June
2011
LEAF (Lowering Emissions in Asia’s Forests). 2011. “Road to REDDiness – Making RELs Work”: Workshop
Proceedings. August 23-25 2011, Bangkok, Thailand. Accessed online: www.forestcarbonasia.org/wp-
content/uploads/2011/09/Road_to_REDDiness_Workshop_Report_FINAL1.pdf
LEAF (Lowering Emissions in Asia’s Forests). 2011. Pilot Site Selection in Vietnam, Laos and Thailand.
Cooperative Agreement Number: AID-486-A-11-00005
Mekongtourism.2011. Mekongtourism.org/website/2011/06/pu-mat-national-park-named-unesco-
world-biosphere/). April 18, 2012.
Mora, B, Herold. M, Woodcock, C. 2012. GOFC-GOLD-45: Summary of the GOFC-GOLD Land Cover
Implementation Team on workshop, Boston January 2012, and side meeting of the Sentinel 2
Preparatory Symposium, Frascati, April 2012.
Nguyen, Q.T., Nguyen, B.N., and Tran, N.T. 2008. Whose forest tenure reform is it? Lessons from case
studies in Vietnam. RECOFTC Policy Brief #1, April 2008.
Nguyen ThiKhanh, V. 2012.Socio-economic Baseline and Drivers of Deforestation Report. Con
CuongDistrict, NgheAn Province.SNV Viet Nam, Hanoi, Viet Nam.
Nguyen, V.2012.Con Cuong Inventory Branch Official Report Population in 2011.NgheAnProvince
Inventory Department, Vinh City, Viet Nam.
Nguyen, V.G., Pham, V.H., Tong, S.S., Le, Q.T., Dinh, N.D., Nguyen, P.H., Nguyen, T.Q.T. 2012. Forest
Stratification and Forest Change Mapping in NgheAn and Lam Dong. Technical Report, SNV Viet Nam
and Space Technology Institute – STI, Hanoi, Viet Nam.
Olson, D. M., Dinerstein, E., Wikramanayake, E. D., Burgess, N. D., et al. 2001. Terrestrial
ecoregions of the world: a new map of life on earth. Bioscience 51(11):933-938.
Schelhas, J., Sanches-Azofeifa, G.A. 2006. Psot-frontier change adjacent to Braulio Carrillo National
Park, Costa Rica. Human Ecology 34(3):407-431.
Pham, M.C. 2012. Development of a national forest monitoring system for REDD+ in Vietnam. Pp. 41-46
in B. Mora, M. Herold, V. De Sy, A. Wijaya, L. VErchot, and J. Penman, eds. Capacity development in
national forest monitoring: experiences and progress for REDD+. Joint report by Center for International
Forestry Research and GOFC-GOLD, Bogor, Indonesia.

41
SNV. 2010. Pilot study: Pro-poor REDD IN NgheAn province. Socio-economic assessment and analysis of
drivers for deforestation and forest degradation 2010. Hanoi, Viet Nam .
Stefano, J. 2001. Power analysis and sustainable forest management. Forest Ecology and Management
154:141-153.
UNFCC. 2008. Kyoto Protocol reference manual on accounting of emissions and assigned amount.
United Nations Framework Convention on Climate Change, Bonn, Germany. 127 pp.
UN REDD. 2009. Measuring and monitoring terrestrial carbon as part of REDD+ MRV systems: the state
of the science and implications for policy makers. T. Havermann, C. Negra, R. Ashton. Terrestrial Carbon
Group Project, Policy Brief 5, October 2009. Accessed on line: www.terrestrialcarbon.org.
UN REDD. 2010. Design of a REDD-compliant benefit distribution system for Viet Nam. UN-REDD
Programme
UN REDD. 2011. UN-REDD Lessons learned: Asia-Pacific. December 2011.
UN REDD. 2012. Viet nam REDD+ capacity building services assessment. J. Stephenson, N.Q. Tan, T.
Enters, W. Patwa-Shah, Y. Yasmi, C. Silori. May 2012.
UN REDD National Strategy. 2011. Viet Nam National REDD+ Program: background document, vers. 3.
N. Hang, W. Killmann, X.P. Pham, E. Trines. February 2011.
USFS. 2011. Climate change in Vietnam: Assessment of issues and options for USAID funding. Final
report, February 2011. Prepared for USAID Vietnam.
VNFOREST. 2006. Chapter 6: Environmental objective and outcome indicators. Pp 74-80 In Viet Nam
forest sector indicators and 2005 baseline data report.
Wertz-Kanonnikoff, S. 2008.Monitoring forest emissions: A review of methods.Working Paper No.
39.Center for International Forestry Research. Bogor, Indonesia.
VN REDD+. 2011. Measurement, reporting, & verification (MRV) framework document. Viet Nam
National REDD+ Program. September 2011, Vers 1 draft 3.
Young, Kenneth R. 2002. Roads and the environmental degradation of tropical montane forests. Con.
Bio. 8(4): 972-976.

42
Annex A. Sources of forest carbon emissions (GOFC GOLD 2011).
Above-ground biomass pool “All biomass of living vegetation, both woody and herbaceous, above the soil
including stems, stumps, branches, bark, seeds and foliage.”
Below-ground biomass pool “All biomass of live roots. Fine roots of less than 2 mm diameter (the suggested
minimum) are often excluded because these often cannot be distinguished
empirically from soil organic matter.”
Dead wood pool “All non-living woody biomass not contained in the litter, either standing, lying
on the ground, or in the soil. Deadwood includes wood lying on the surface,
dead roots, and stumps larger than or equal to 10 cm in diameter.”
Litter pool All non-living biomass with a size greater than the limit for soil organic matter
(the suggested minimum is 2 mm) and less than the minimum diameter chosen
for deadwood(for example 10 cm) lying dead and in various states of
decomposition above or within the mineral organic soil. This includes the litter
layer as usually defined in soil typologies. Live fine roots above the mineral or
organic soil (of less than the suggested minimum for below-ground biomass) are
included whenever they cannot be empirically distinguished from the litter.”
Soil organic matter pool “Organic carbon in mineral soils to a specified depth chosen and applied
consistently through a time series. Live and dead fine roots within the soil (of
less than the suggested minimum for below-ground biomass) are included
whenever they cannot be empirically distinguished from the soil organic
matter.”

43
Annex B. National Level Forest Inventory Initiatives
National Forest Inventory (NFI)
The Forest and Planning Institute (FIPI) conducts the NFI, which began in 1968, using aerial photos, a
Russian computer and German technical support. FAO first assisted with inventory activities in 1981 and
FAO-Finland now assists with capacity building. NFI has a 20 million USD annual budget, a staff of 600
with 6 regional “sub-FIPIs”. Four inventory cycles have been completed: 1991-95 (Landsat MSS
photographs 2,679 plots – 8x8 km grid), 1996-2000 (used SPOT3 15x15m prints, 3,690 plots), 2001-05
(Landsat 30x30m digital classification, 4,200 plots), and 2006-10 (SPOT5 2.5m, ERDAS IMAGINE visual on
screen, printed at 5m, 2,100 plots 8x8km grid) (FAO 2007). NFI attempts to measure the same locations
every 5 years but do not track individual trees. The Research Center for Forestry and Environment
(RCFEE) is currently improving allometric models for biomass to be used in the NFI and the General
Department of Land Administration (GDLA) is responsible for surveying within forest land and the
creation of topographic and forest maps.
NFI reform is currently occurring. NFI/NFA is examining/piloting the possibility of including biodiversity
and/or PFM in BacKan and Ha Tin provinces. One pilot is being done by FIPI and Vietnamese universities
are completing the other (Nghe An DARD, personal communication, March 22 2012). Additionally SNV is
working closely with VNFOREST on piloting PFM in Lam Dong Province. In Nghe An Province there are
currently only 7 NFI plots, which is insufficient for monitoring forest degradation, as a significantly
higher plot density would be required.
National Forest Assessment with FAO-Finland (NFA)
NFA is a $ 3,252,800 USD, 3-year project funded primarily by FAO-Finland with the goal of strengthening
the institutional capability of VNFOREST, MARD and FIPI and harmonizing/consolidating forest and
resource monitoring systems (FAO and Government of Viet Nam 2011). The program is reviewing the
previous NFI sample design and will eventually make recommendations for a more robust system.
Finnish NFA statisticians favor a clustered plot design and extending the sample design across all land
types, not just forested lands, as is currently the case. NFA is also making recommendations for data
collection, data management and QA/QC in addition to building capacity in these fields.
Land Monitoring System (LMS) and National Land Inventory
Land statistics, based on activity data, are collected and reported every year for all 58 provinces,
although by law land inventory is done every 5 years. Data are aggregated from the communal, district,
provincial and national level as maps exist at these four scales. Data quality is often suspect or missing
(like Con CuongDistrict) and thus not used for National Land Inventory results. With financial support
from the World Bank, the LMS program is working on their information management system and on the
design and development of a uniform inventory system. They are investing in aerial photography in
some remote areas; as they need to include agriculture, forest, rice paddies, infrastructure, public
services, etc. They are investing over 100 billion VND on the land survey, which includes taking GPS
coordinates at points and boundaries. The new system is scheduled for implementation in 2015.

44
Annex C. Montreal Process Criteria and Indicators 2007
The current set of Montréal Process criteria and indicators continues is based on contemporary scientific
understanding of temperate and boreal forest ecosystems and the values society attaches to forests.
Criteria 1-6 and associated indicators relate specifically to forest conditions or functions, and to the
values or benefits associated with forest goods and services. Criterion 7 and its indicators relate to the
overall policy framework needed to facilitate and support forest conservation and sustainable
management. This policy framework includes aspects often external to the forest itself but which affect
efforts to conserve, maintain or enhance one or more of the conditions, functions, values or benefits
captured in Criteria 1-6. Only Criteria 1-4 are provided below (Table C-1), since they are most relevant
to monitoring forest quality. We parsed the associated indicators into tiers corresponding roughly to
the resolution of the REDD+ carbon monitoring tiers.
Table C-1. Criteria 1-4 and indicators from the Montreal Process (C&I 2009).
Criterion Tier 1 indicator Tier 2 indicator Tier 3 indicator
1 - Conservation
of biological
diversity
Area and percent of forest
by forest ecosystem type,
successional stage, age
class, and forest ownership
or tenure
Fragmentation of forests Status of on -site and off-site
efforts focused on
conservation of species
diversity
Area and percent of forest
in protected areas by forest
ecosystem type, and by age
class or successional stage
Number of native forest
associated species
Number and geographic
distribution of forest
associated species at risk of
losing genetic variation and
locally adapted genotypes
Number and status of
native forest associated
species at risk, as
determined by legislation or
scientific assessment
Population levels of selected
representative forest
associated species to describe
genetic diversity
Status of on-site and off-site
efforts focused on
conservation of genetic
diversity
2 - Maintenance
of productive
capacity of forest
ecosystems
Area and percent of forest
land and net area of forest
land available for wood
production
Total growing stock and
annual increment of both
merchantable and non-
merchantable tree species
in forests available for
wood production
Annual harvest of non-wood
forest products
Annual harvest of wood
products by volume and as
a percentage of net growth
or sustained yield
Area, percent, and growing
stock of plantations of
native and exotic species

45
Table C-1 cont.
Criterion Tier 1 Indicator Tier 2 indicator Tier 3 indicator
3 - Maintenance
of forest
ecosystem health
and vitality
Area and percent of forest
affected by biotic processes
and agents (e.g. disease,
insects, invasive species)
beyond reference
conditions
Area and percent of forest
affected by abiotic agents
(e.g. fire, storm, land
clearance) beyond reference
conditions
4 - Conservation
and maintenance
of soil and water
resources
Area and percent of forest
whose designation or land
management focus is the
protection of soil or water
resources
Area and percent of forest
land with significant soil
degradation
Proportion of forest
management activities that
meet best management
practices or other relevant
legislation to protect soil
resources
Area and percent of water
bodies, or stream length, in
forest areas with significant
change in physical, chemical
or biological properties
from reference conditions
Proportion of forest
management activities that
meet best management
practices, or other relevant
legislation, to protect water
related resources.

46
Annex D. Opportunities for Effective Capacity Building to Mitigate
Emissions
Land Use Planning & Interagency Communication
Improving land use and forest planning is a central goal of the LEAF project and the Nghe An DARD
emphasized the need for help in this area. Specifically Nghe An DARD mentioned the need to apply
advanced technology as well as methodology to planning and the need to change the structure of plans
to enrich the forests. The Nghe An DARD also specifically mentioned the need for improved linkages
among sectors at all levels. The lack of communication between agencies leads to great inefficiency,
which leads to increased forest degradation. For example, the sub-FIPI in Nghe An carried out 7
permanent sample plots for NFI but the data were not shared with the Nghe An DARD. Land use
planning needs to be centered on effective allocation of land and resources in order to meet economic
and natural resource objectives. In Con Cuong District, the allocation of production, protection and
family-owned forest could be improved and made more efficient through enhanced land use planning
(see LEAF program activities). Changing the manner in which different agencies communicate and share
information can be challenging but it will be necessary to reduce the rate of forest degradation in Nghe
An Province.
Timber Harvest Techniques and Technology
In Viet Nam, state-owned forest companies have been steadily losing land area as some companies have
privatized and other lands have been converted to Special Use Forest or PFMB land. The Government of
Viet Nam has recently been pushing for State Forest Company budget reduction and reform, and it has
been proposed that REDD+ activities and the carbon market could help make State Forest Companies
more self-sustainable (Gibbon et al. 2011). CCSFC management also expressed interest in receiving
advise/assistance from LEAF/USFS on harvesting/wood processing techniques that would minimize
wood waste and improve forest carbon reserves. During our meetings, MARD leadership stated that
new forestry techniques and approaches proven successful on CCSFC land could be scaled up to all
State-owned forest company (SOC) land in Viet Nam. As a result, fairly basic technology and
improvements that could make a large impact and pilot projects that field tested new
techniques/approaches were highly encouraged by MARD leadership.
The feasibility of carbon project development in the LocBac SOC in Lam Dong Province is well
documented by Gibbon et al. (2011) and much of this report is applicable to CCSFC. Under the Verified
Carbon Standard (VCS), there are three Improved Forest Management (IFM) project development
methodologies that would be appropriate for State Forest Companies including CCSFC. Four options for
alternative management that would be appropriate on CCSFC lands are outlined by Gibbon (2011).
These are Reduced Impact Logging (RIL), Logged to Protected Forest (LtPF), Extended Rotation
Age/Cutting Cycle (ERA) and Converting Low Productivity to High Productivity Forest (LtHP). The rough
costs of starting and maintaining a VCS carbon project are also outlined in Gibbon (2011). The planning,
modeling and creation of a carbon project on CCSFC land would require outside assistance or substantial
training, technological upgrades and capacity building.
Increased utilization of each tree harvested and minimized wood waste will contribute to reduced forest
degradation on CCSFC lands through the reduction of total hectares logged per year to yield the
equivalent wood volume. Market development and improved access to existing markets for smaller

47
size-lumber and woodchips would be necessary to support the reduction in the rate of forest harvest. A
relatively inexpensive portable wood-chipping machine would greatly help whole-tree utilization. A
wood chip market exists in Viet Nam but this potential market has not been utilized by CCSFC, perhaps
in part because of high transportation costs. Finding a local buyer, such as a tea drying facility, might be
a more practical and financially viable solution since it would limit the cost of transportation.
In Indonesia, the simple “monocable” machine is being used in RIL areas and this machine could likely be
applied in Viet Nam. Indonesian loggers first pioneered the inexpensive machine, which is built with
locally available materials and based on machines used in small European woodlots. The machine,
which can winch itself into position, drags logs along the ground for up to 100 meters and eliminates the
need for environmentally damaging skid roads (Klassen 2010).
The expansion of wholesale wood buyers from a single buyer to multiple buyers interested in different
wood characteristics also would help support this wood waste reduction. The transportation of whole
logs to more advanced, non-field mills is another option that would help reduce wood waste if there
was a buyer who accepted whole logs, rather than just rectangular cants. Government checkpoint
operators also would need to become accustomed to quickly assessing the volume of loads comprised
of non-rectangular logs.
Agroforestry Extension Advisor
In areas such as on the banks of the Ca River or in the Luc Gia commune, the agricultural land appears
productive and well planned. In general, forested lands within at least a few kilometers of some type of
access were in moderate to poor condition. A lack of agroforestry and market knowledge is apparent,
and a contributing factor to forest degradation. VN Forest has an agricultural advisor in the Con Cuong
District who doesn’t provide advice on forestry issues. The concept of an agroforestry extension advisor
was well received by stakeholders. Access to market information to the development of new markets
would be an essential role of the agroforestry extension advisor.
An agroforestry extension advisor could provide advice on managing family forestland, forest
engineering operations, and potentially coordinate PFM and data management activities. On family
managed lands the agroforestry extension advisor could assist with the restoration of poor forests,
planting trees for houses, methods for improving crop yield, diversification of crops, native tree-food
crop combinations, and medicinal plant gardens. In PFM, the advisor would be involved in protocol
training, survey coordination and quality assurance/quality control. The advisor also could contribute
knowledge on forest engineering techniques such as whole log scaling, scaling and in-field chipping
technology.
During discussions with the SNV/LEAF Viet Nam group, it was thought that funding likely could be
obtained for this potential position. There was concern, however, about retention - training an
agroforester and then having the agroforester move up to a higher-ranking position. In the past the
Government of Viet Nam has not supported the implementation of extension services. It was suggested
that a system using non-government contractor trainers or non-governmental agroforestry advisors
could be most efficient.