options for income - fidelity investments fidelity internal information to discuss option strategies...
TRANSCRIPT
Options for Income
719881.4.0
Fidelity Brokerage Services, Member NYSE, SIPC, 900 Salem Street, Smithfield, RI 02917. © 2015 FMR LLC. All rights reserved.

2 Fidelity Internal Information
Options trading entails significant risk and is not appropriate for all investors. Prior to trading options, you must receive a copy of Characteristics and Risks of Standardized Options, which is available from Fidelity Investments, and be approved for options trading. Supporting documentation for any claims, if applicable, will be furnished upon request.
Examples in this presentation do not include transaction costs (commissions, margin interest, fees) or tax implications, but they should be considered prior to entering into any transactions.
Characteristics and Risks of Standardized Option The information in this presentation, including examples using actual securities
and price data, is strictly for illustrative and educational purposes only and is not to be construed as an endorsement, recommendation.
Annualized returns cited might be achieved only if the parameters described can be duplicated and there is no certainty of doing so.
Disclosures
3 Fidelity Internal Information
To discuss option strategies that can be used to generate income, and to show investors how to build, evaluate, and manage these strategies to reflect a level of risk/return that is appropriate for their specific portfolios.
Proper evaluation for income focused option strategies
Common selling strategies used to generate income
Matching strike price and expiration selection to your objective
Setting expectations and knowing what affects option premium
Managing risk and avoiding common mistakes for income generation strategies
Goal of this webinar
Topics that will be covered

4 Fidelity Internal Information
Outlook: Bullish/neutral Construction: Buying (or owning) stock and selling call options on a share-for-share basis Max Gain: (Strike Price + Call premium received) – Cost of the long shares Max Loss: Substantial (cost of the long shares – call premium received Breakeven @ expiration: Cost of long shares - call premium received
A full explanation of this strategy is available using the Option Strategy Guide in Fidelity’s Learning Center or by watching the archived webinar titled “Writing Covered Calls” A covered call writer forgoes participation in any increase in the stock price above the call exercise price and continues to bear the downside risk of stock ownership if the stock price decreases more than the premium received.
Covered Call Strategy

5 Fidelity Internal Information
Outlook: Bullish/Neutral Construction: Selling a put (cash-covered or naked) in return for premium Max Gain: Premium received Max Loss: Substantial (but limited to the strike price - premium) Breakeven @ expiration: Strike price – Premium received
A full explanation of this strategy is available using the Option Strategy Guide in Fidelity’s Learning Center or by viewing the archived webinar titled “Selling Puts”
Short Put Strategy
6 Fidelity Internal Information
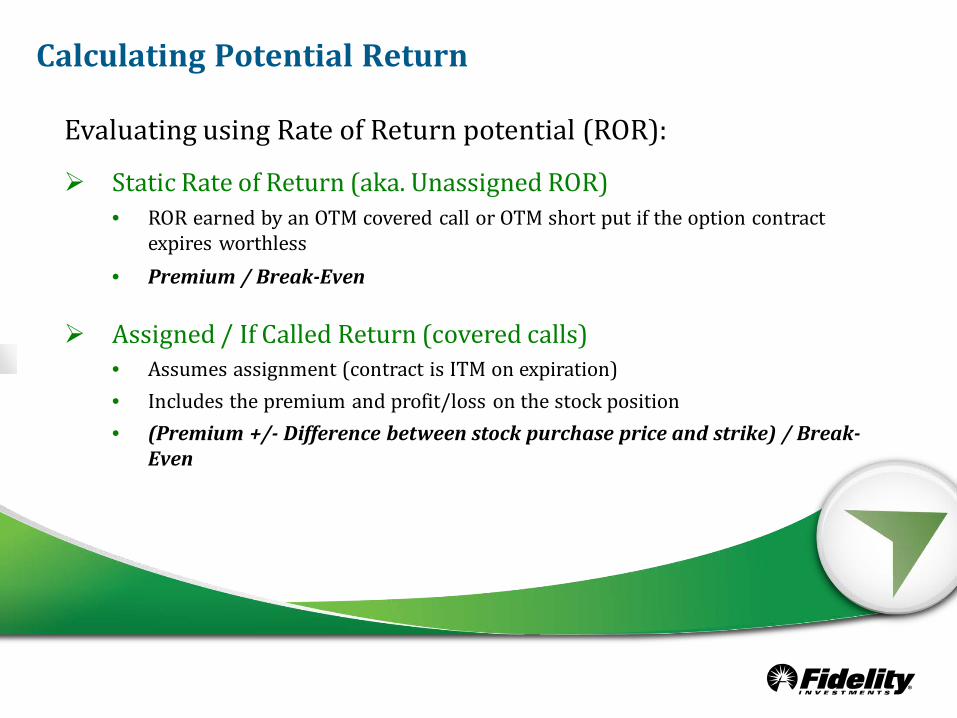
Evaluating using Rate of Return potential (ROR):
Static Rate of Return (aka. Unassigned ROR)
• ROR earned by an OTM covered call or OTM short put if the option contract expires worthless
• Premium / Break-Even
Assigned / If Called Return (covered calls)
• Assumes assignment (contract is ITM on expiration)
• Includes the premium and profit/loss on the stock position
• (Premium +/- Difference between stock purchase price and strike) / Break-Even
Calculating Potential Return
7 Fidelity Internal Information
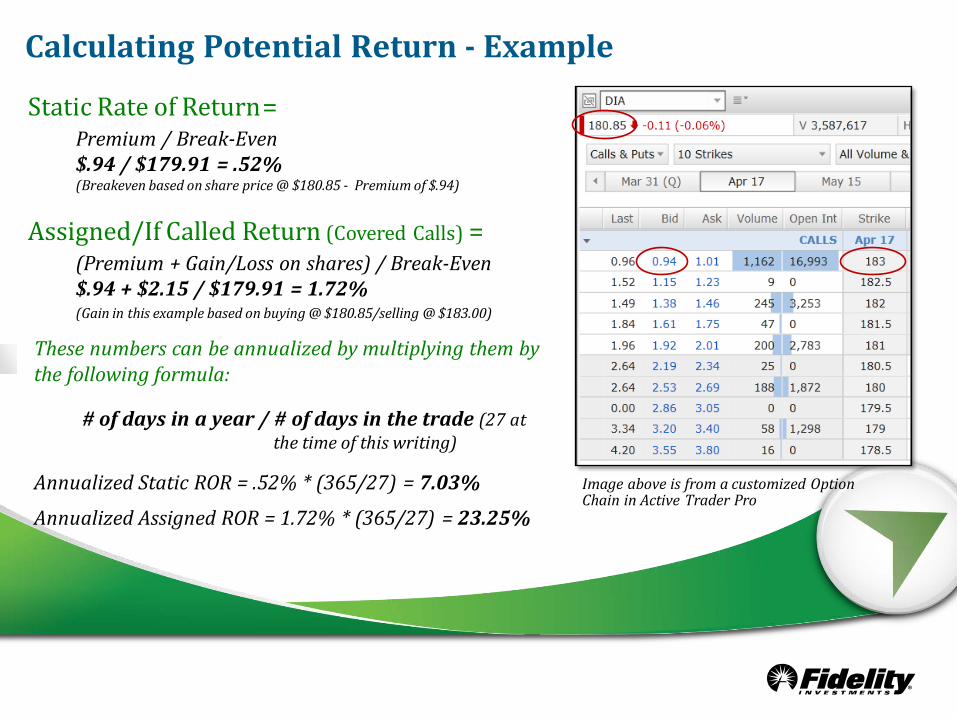
Image above is from a customized Option Chain in Active Trader Pro
Static Rate of Return =
Premium / Break-Even $.94 / $179.91 = .52% (Breakeven based on share price @ $180.85 - Premium of $.94)
Assigned/If Called Return (Covered Calls) =
(Premium + Gain/Loss on shares) / Break-Even $.94 + $2.15 / $179.91 = 1.72%
(Gain in this example based on buying @ $180.85/selling @ $183.00)
These numbers can be annualized by multiplying them by the following formula: # of days in a year / # of days in the trade (27 at the time of this writing)
Annualized Static ROR = .52% * (365/27) = 7.03%
Annualized Assigned ROR = 1.72% * (365/27) = 23.25%
Calculating Potential Return - Example

8 Fidelity Internal Information
There are 2 components to an option’s price – Intrinsic value and Time value
Intrinsic value is the measure of the true value of the “right” the option represents – it is the difference between the stock price and the strike price
Time value is a measure of “uncertainty” – the potential that the option could hold more intrinsic value in the future
All else equal, the time value erodes as expiration nears – the uncertainty about the stock’s price movements between now and expiration gets lower and lower
Selling strategies (selling covered calls and selling puts) aim to take advantage of the erosion in time value throughout the life of the trade – the time value in the premium represents the potential “reward” to the seller
Importance of Time Value
9 Fidelity Internal Information
Importance of Time Value
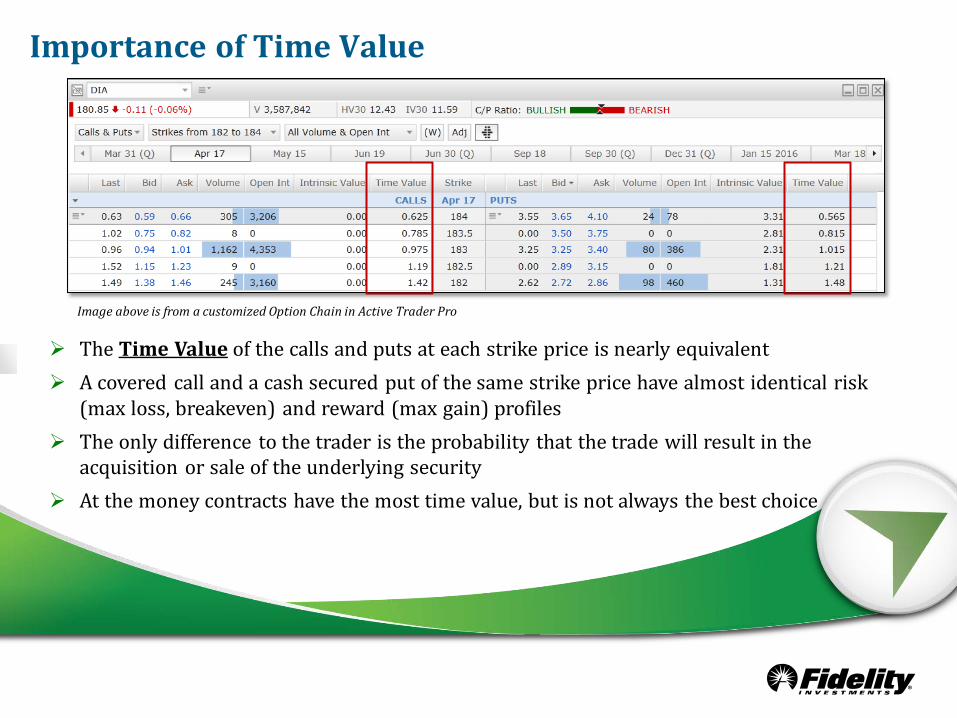
Image above is from a customized Option Chain in Active Trader Pro
The Time Value of the calls and puts at each strike price is nearly equivalent A covered call and a cash secured put of the same strike price have almost identical risk
(max loss, breakeven) and reward (max gain) profiles The only difference to the trader is the probability that the trade will result in the
acquisition or sale of the underlying security At the money contracts have the most time value, but is not always the best choice

10 Fidelity Internal Information
Generating a Steady Income Stream Example: Assumes DIA trading @ $180.84 with 27 days to expiration
To start, assume a trader owns 100 shares of DIA in their stock portfolio. Their objective has shifted from growth to being more income focused, and their outlook is neutral/slightly bullish. As such, they decide to sell 1 April $183 call for $.94
But it doesn’t end there….
As expiration nears, assume DIA has increased in value and the call is in the money (Stock Price >Strike)
The trader lets their shares be called away (Maximum Gain has been achieved!!), selling them at the strike price of $183, generating 1.72% total return and .52% in income over the 27 day period (example from slide 7)

11 Fidelity Internal Information
Generating a Steady Income Stream Example: Assume it is now April 17th, and the shares have been sold due to call assignment, leaving the trader with a cash position of $18,394.00 (Strike price of $183.00 + $.94 in collected premium * 100 shares)
Image above using hypothetical pricing data
In this situation assume the trader’s outlook is still neutral, but they want a lower risk trade. With DIA now @ $183.85, they decide to sell 1 Out of the Money May $182 put for $1.55
Let’s look at 2 potential outcomes at expiration:
Put Expires Worthless Put is assigned
The cash is available and a new cash covered put can be established
The trader now owns the shares, bought at the strike price
Start the process again with a new covered call against those shares
Static Rate of Return = $1.55 / $180.45 = .86%

12 Fidelity Internal Information
Proper security selection is critical - the strategy MUST match the outlook – this is not a one size fits all, foolproof strategy
Most traders find that the slightly out of the money contracts offer a reasonable balance of risk/reward
This process of rotating covered calls and cash secured puts can continue as long as the underlying continues to offer opportunity
Strike price selection can be used to reduce risk, but only to a limited degree
Generating a Steady Income Stream
There may be events that cause you to exit the trade early, but it should not be managed for the sole purpose of avoiding assignment

13 Fidelity Internal Information
What factors affect the premium?
1. Money-ness of the option being sold (Strike Selection) • Out of the money options offer lower premiums • At the money option contracts have the most time value • In the money options offer higher premiums
2. Time to expiration (Expiration Selection) • Nearer term expirations offer the potential for the highest annualized return but
offer a lower up front premium • Longer dated expirations decay at a slower rate, but offer the advantage of more
upfront premium (income certainty)
3. Expected Movement from the Underlying (Implied Volatility) • Higher implied volatility (expected price movement) results in higher premiums • When selling options, if that expected volatility becomes realized volatility, it can
result in substantial losses

14 Fidelity Internal Information
Generating a Steady Income Stream
Matching strike selection to price outlook and risk tolerance
Concerned about a small drop in price (lower risk)?
Slightly bullish (higher risk)? Completely neutral?
OR OR OR
In the money buy-write At the money buy-write Out of the money buy-write
Out of the money cash covered put
In the money cash covered put
At the money cash covered put

15 Fidelity Internal Information
Impact of Expiration Selection The rate at which the time value of an option decays
typically accelerates as expiration comes closer, meaning shorter term options have the higher rate of decay
Theta measures how much time value erodes from the option contract each day (assumes all else equal)
The time value on every option contract is $0 at expiration
Remember, there are 2 parts to an option’s value – Intrinsic Value and Time Value
As the stock price moves, time value can be replaced by intrinsic value – this is why price movement (realized volatility) is viewed as a risk to option sellers
With both covered calls and cash covered puts, the directional risk is to the downside
This acceleration becomes most apparent with 30-45 days to expiration
What could go wrong....?

16 Fidelity Internal Information
Impact of Expiration Selection With cash on hand, a trader feels DIA offers a good opportunity to generate income by
selling puts. With DIA at $180.85, the trader has a neutral price outlook, and the following contracts to choose from:
Option 1: Write an April 17th $181 Put for $2.25 in premium
Option 2: Write a June 19th $181 Put for $5.10 in premium
Which is better....?
Image above is from a customized Option Chain in Active Trader Pro
17 Fidelity Internal Information
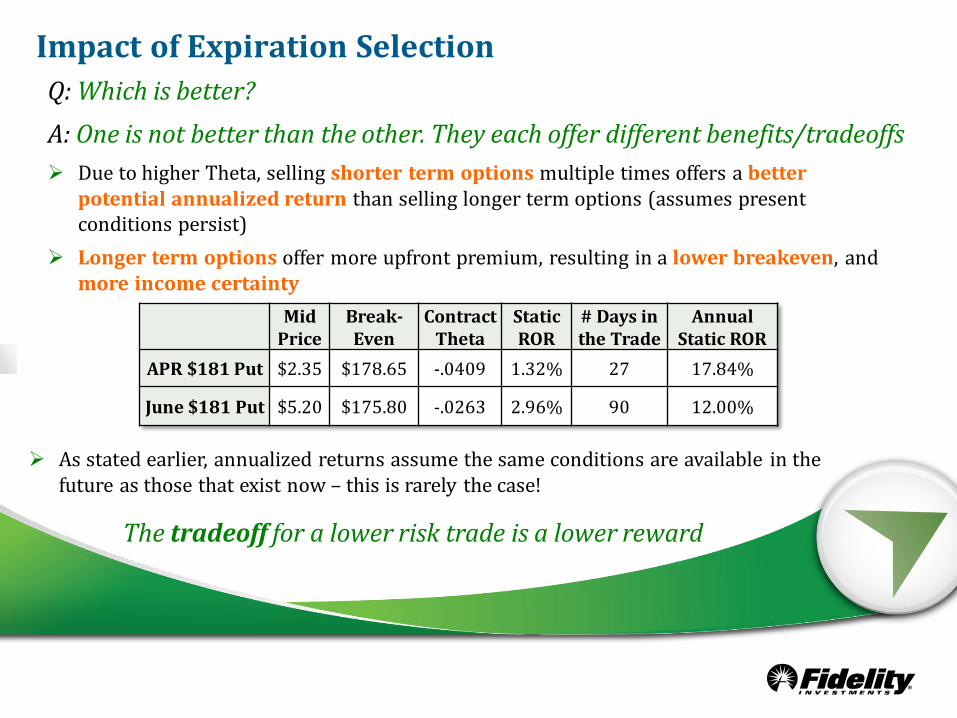
Due to higher Theta, selling shorter term options multiple times offers a better potential annualized return than selling longer term options (assumes present conditions persist)
Longer term options offer more upfront premium, resulting in a lower breakeven, and more income certainty
Impact of Expiration Selection Q: Which is better?
A: One is not better than the other. They each offer different benefits/tradeoffs
Mid Price
Break- Even
Contract Theta
Static ROR
# Days in the Trade
Annual Static ROR
APR $181 Put $2.35 $178.65 -.0409 1.32% 27 17.84%
June $181 Put $5.20 $175.80 -.0263 2.96% 90 12.00%
As stated earlier, annualized returns assume the same conditions are available in the future as those that exist now – this is rarely the case!
The tradeoff for a lower risk trade is a lower reward

18 Fidelity Internal Information
Shorter Term Longer Term
Common Use Maximize annual ROR and maintain flexibility (dividends and earnings)
Targeting a specific annual ROR Prioritizing income certainty
Premium Potential for the higher annualized return (all else equal) Offer more upfront premium
Risk/ Considerations
Offer the most exposure to time decay Have the highest gamma risk More commissions incurred
Offer more upfront downside protection Lower exposure to time decay
Lower gamma risk
Impact of Expiration Selection

19 Fidelity Internal Information
Common Pitfalls
1. Viewing assignment, in and of itself, as a risk If you are not willing to sell a position, you should not write calls against it If you are not willing to own a stock, you should not sell puts on it If generating income is the objective, assignment should not be seen as a negative
(with the exception of large downward price moves or changing outlook)
2. Going too deep in or out of the money The further away from the at the money strike one goes, the less time value there is
in the contract While strike price selection can be tailored to the outlook, be careful not to select a
strike with minimal/no time value If you are not comfortable choosing a strike that offers fair value, this security may not be for you – find another opportunity

20 Fidelity Internal Information
Common Pitfalls
4. Holding onto losers too long / Failing to manage risk Premiums collected only go so far to reduce the impact of a falling stock Establish predetermined exit strategies (based on price, news, market trends, etc.)
5. Failing to objectively evaluate old opportunities and look for new ones Be able to properly evaluate if a security is offering a good opportunity Be comfortable selling winners and cutting losses Use the resources available to you to uncover new opportunities If the potential reward does not fit the perceived risk, move on
3. Setting unrealistic expectations and taking on too much risk in an effort to meet them It’s unrealistic to assume every trade will be a winner Option premiums are directly related to the amount of volatility (movement) the
market expects in the underlying – know why and if you’re comfortable with it

21 Fidelity Internal Information
Finding and Evaluating Opportunities Resources to help with Idea Generation:
Preset Expert Strategies – provide ideas based on criteria the professionals use
Stock Screener and ETF screener – allow users to find securities that match the criteria they want the underlying to meet (fundamentals, technical trends, analyst opinions, etc.)
Strategy Ideas – offer specific strategy specific option trading ideas based on criteria professionals find to be important for the selected strategy
Market Scanner – allows the user to look for specific characteristics in an underlying or an underlying’s option contracts (volatility comparison, volume, price)
Resources to help with Research/Analysis:
Equity Summary Score – An accuracy weighted average analyst score for individual securities
Recognia Chart Pattern Analysis – identifies and interprets existing and anticipated technical events on the advanced charts in Active Trader Pro and Fidelity.com
Probability Calculator – Allows the used to evaluate statistical probabilities of security reaching a specific price by a specific date
Covered Call Strategy Ideas–Back-test the performance of user specified covered call strategies
Volatility Analysis – IV charts and key statistics help a trader evaluate whether options on a given underlying are relatively “cheap” or “expensive”

22 Fidelity Internal Information
A rotation of covered calls and cash secured puts can be used as an efficient way to generate income on securities where a trader has a neutral to slightly bullish outlook
Security selection is critical – are you comfortable being long the underlying security? You must be able to properly evaluate the tradeoffs in the risk and reward when trading options
Outlook and objective will help determine proper strike and expiration, but traders often find that using a rotation of slightly OTM contracts, expiring in 30 - 60 days, offers a good risk/reward tradeoff
Avoid costly mistakes by adopting a risk level you can live with • Diversify amongst market capitalization, sectors, geography and style • Watch out for concentrated positions (exposure > 5% of portfolio) • Consider ETF’s to limit volatility
If it appears too good to be true, then it probably is! - watch out for earnings announcements, dividends, or other events that could lead to significant moves
Having an exit strategy at the time of trade entry gives a you a reference point when evaluating the trade down the road and reduces emotional decisions
Use the resources at your disposal to seek out and analyze new opportunities
Key Takeaways

23 Fidelity Internal Information
This concludes today’s presentation.
Income Strategies Using Options
Thank you for attending. To Register, please visit the Fidelity.com Learning Center https://www.fidelity.com/learning-center For additional support, please contact a Fidelity representative at (800) 564-0211