optimum utilization of fission power with gas...
TRANSCRIPT
OPTIMUM UTILIZATION OF FISSION POWER WITH GAS CORE REACTORS
By
ROBERT NORRING
A THESIS PRESENTED TO THE GRADUATE SCHOOL OF THE UNIVERSITY OF FLORIDA IN PARTIAL FULFILLMENT
OF THE REQUIREMENTS FOR THE DEGREE OF MASTER OF ENGINEERING
UNIVERSITY OF FLORIDA
2004

Copyright 2004
by
Robert Norring

Dedicated to my parents for encouraging me to do my best.
ACKNOWLEDGMENTS
The author would like to express his sincere gratitude to the members of his
supervisory committee, Dr. Edward T. Dugan, Dr. Jacob Chung, and Dr. Samim Anghaie
for their help and guidance throughout the course of this research. The author would also
like to thank others who have helped him throughout the course of this work, namely Dr.
Travis Knight, Dr. Blair Smith, and Dr. Alireza Haghighat.
The author would like to give special thanks to Dr. Anghaie, supvisory committee
chair, for his patience and constant support, without which none of this would have been
possible. The author recognizes that much of his knowledge in the area of study is a
direct result of working in conjunction with Dr. Anghaie.
Support for this research has been provided by Innovative Nuclear Space Power
and Propulsion Institute (INSPI) and the University of Florida. The author expresses his
thanks to those who supported him during his research.
Finally, the author would also like to thank his parents for encouraging him to do
his best, and his fiancé for her support and patience during his work.
iv
TABLE OF CONTENTS Page ACKNOWLEDGMENTS ................................................................................................. iv
LIST OF TABLES............................................................................................................ vii
LIST OF FIGURES ......................................................................................................... viii
ABSTRACT....................................................................................................................... ix
CHAPTER 1 INTRODUCTION ........................................................................................................1
Introduction...................................................................................................................1 Features of the Gas Core Reactor .................................................................................1 Thesis Objectives..........................................................................................................3 Thesis Organization ......................................................................................................4
2 STATE OF THE ART STUDY....................................................................................6
Vapor Core Reactors.....................................................................................................6 Actinide Transmutation Through Neutron Acceleration..............................................7 Reprocessing.................................................................................................................8 Liquid Metal Fast Breeder Reactors .............................................................................9
3 DESIGN OF THE URANIUM TETRA-FLUORIDE GAS CORE REACTOR .......11
Introduction.................................................................................................................11 Preliminary Design Considerations ............................................................................11 Material Selection.......................................................................................................12
Moderator-Reflector Material .............................................................................12 Fissioning Fuel Material......................................................................................14
Power Cycle Description ............................................................................................15 Neutronic Analysis for the Gas Core Reactor ............................................................18
4 CONFIGURATION AND OPTIMIZATION OF DESIGN PARAMETERS...........21
Reflector and Fuel Density Optimization ...................................................................21 Core Size Optimization...............................................................................................25 Feed Fuel and Enrichment Optimization....................................................................28
v
Iterative Optimization of Feed Fuel Enrichment.................................................30 Important Actinide Inventory ..............................................................................32
Reference LWR Design..............................................................................................33 5 CORE COMPARISONS ............................................................................................34
Actinide Inventory Comparison .................................................................................38 Evaluation of Integrated Cycle Performance..............................................................39 Flux Calculations ........................................................................................................48
6 RESULTS AND RECOMMENDATIONS FOR FUTURE RESEARCH ................53
Introduction.................................................................................................................53 Summary of Results....................................................................................................53
APPENDIX SAMPLE INPUTS.............................................................................................................57
Sample MCNP Input...................................................................................................57 Monteburns Input........................................................................................................60 Monteburns Feed File .................................................................................................61
LIST OF REFERENCES...................................................................................................63
BIOGRAPHICAL SKETCH .............................................................................................64
vi
LIST OF TABLES
Table page 4-1. Keff values for 10 cm reflected core ..........................................................................26
4-2. Keff values for 20 cm reflected core ..........................................................................27
4-3. Keff values for 30 cm reflected core ..........................................................................27
4-4. Keff values for 40 cm reflected core ..........................................................................28
4-5. Keff values for 50 cm reflected core. .........................................................................28
5-1. The three analyzed GCR design specifications. ........................................................35
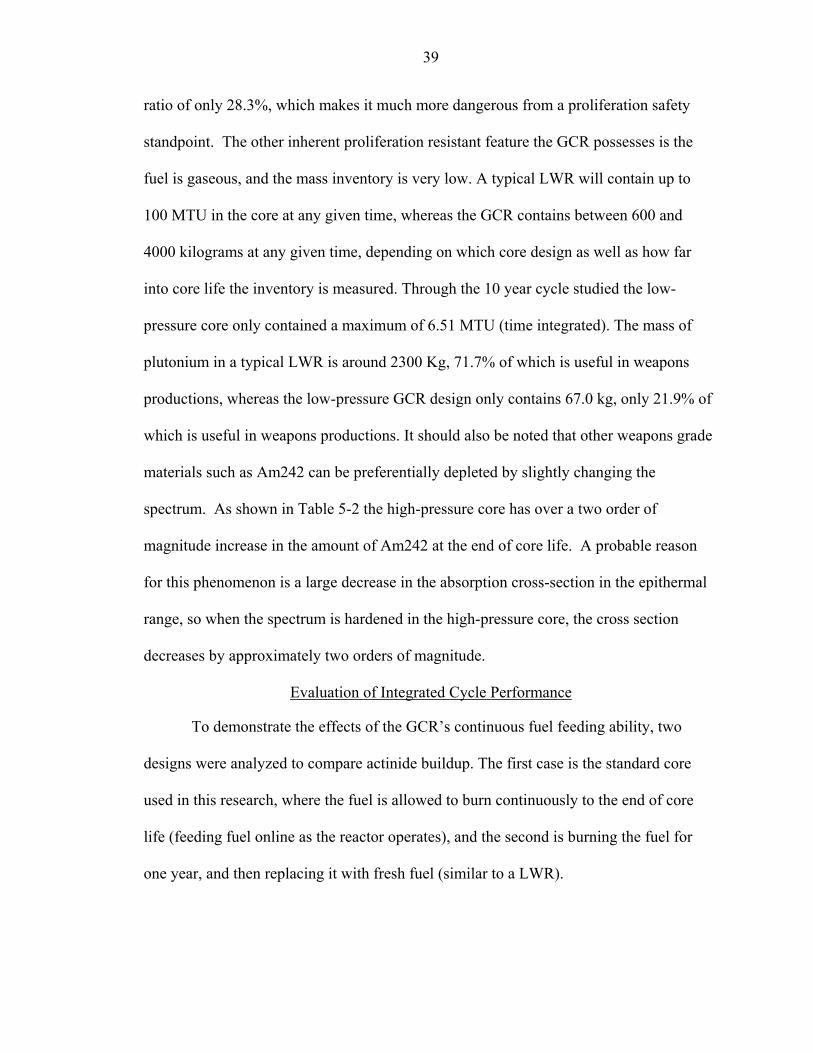
5-2. Core isotopic abundance in Kg...................................................................................37
5-3. Integrated cycle performance comparison, representing the benefits of switching to online fuel feeding, as opposed to regular fuel reload dates. ...................................40
vii
LIST OF FIGURES
Figure page 3-1. Saturation curves for UF4 and UF6............................................................................16
3-2. Saturation curves for UF4 and uranium metal............................................................17
3-3. Example of a combined cycle schematic for a GCR. A 1500MWth, 1000MWe G/VCR power plant with a combined cycle efficiency of 69%. ..............................18
4-1. Sample core geometry ...............................................................................................21
4-2. Sample BeO column configuration ............................................................................24
5-1. Mass of the major actinides present in the high-pressure core (Core 1) as a function of time. .....................................................................................................................42
5-2. Mass of the major actinides present in the intermediate-pressure core (Core 2) as a function of time. .......................................................................................................43
5-3. Mass of the major actinides present in the low-pressure core (Core 3) as a function of time...........................................................................................................................44
5-4. Mass abundance of minor actinides present in the high-pressure (Core 1) core as a function of time. .......................................................................................................45
5-5. Mass abundance of the minor actinides in the intermediate-pressure core (Core 2) as a function of time. ....................................................................................................46
5-6. Mass abundance of the minor actinides in the low-pressure core (Core 3) as a function of time. .......................................................................................................47
5-7. Relative flux plots for the low and high-pressure cores. Fluxes were normalized by maintaining the maximum value of 1.0....................................................................50
5-9. Spatial flux plots for the high-pressure core, split into different volumes. ................51
viii
Abstract of Dissertation Presented to the Graduate School of the University of Florida in Partial Fulfillment of the Requirements for the Degree of Master of Engineering
OPTIMUM UTILIZATION OF FISSION POWER WITH GAS CORE REACTORS
By
Robert Norring
May, 2004
Chair: Samim Anghaie Major Department: Nuclear and Radiological Engineering
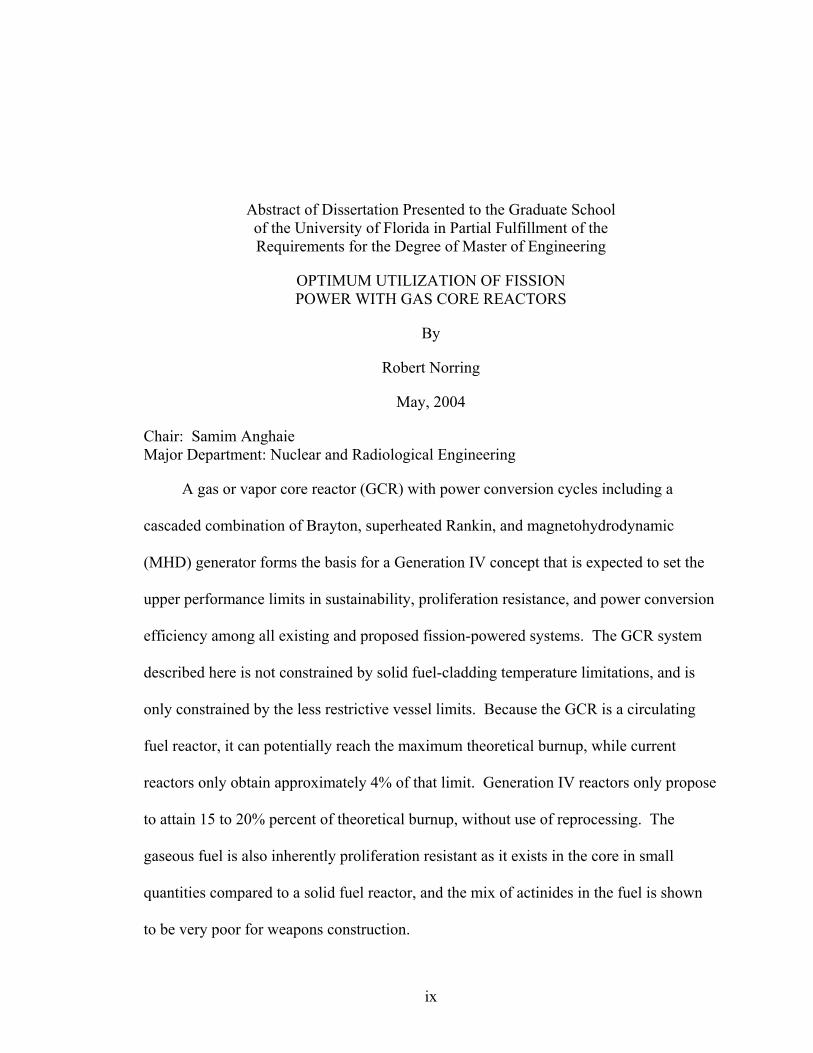
A gas or vapor core reactor (GCR) with power conversion cycles including a
cascaded combination of Brayton, superheated Rankin, and magnetohydrodynamic
(MHD) generator forms the basis for a Generation IV concept that is expected to set the
upper performance limits in sustainability, proliferation resistance, and power conversion
efficiency among all existing and proposed fission-powered systems. The GCR system
described here is not constrained by solid fuel-cladding temperature limitations, and is
only constrained by the less restrictive vessel limits. Because the GCR is a circulating
fuel reactor, it can potentially reach the maximum theoretical burnup, while current
reactors only obtain approximately 4% of that limit. Generation IV reactors only propose
to attain 15 to 20% percent of theoretical burnup, without use of reprocessing. The
gaseous fuel is also inherently proliferation resistant as it exists in the core in small
quantities compared to a solid fuel reactor, and the mix of actinides in the fuel is shown
to be very poor for weapons construction.
ix
This research studies the actinide production and depletion features of three GCR
designs. The research is done using Monteburns, which integrates MCNP and Origen
computer codes to simulate a time-dependent monte-carlo method depletion analysis.
Several designs were analyzed during the research and three specific designs were chosen
to evaluate in depth. These designs were then compared to a LWR design to evaluate
how the GCR functions compared to current power reactors. The research simulates an
operation time of 10 years, studying the effects of parametric changes in design
specifications on actinide inventory.
Core depletion analysis has shown that using a GCR for power production limits
both the actinide inventory produced, as well as the unused spent fuel. The GCR is up to
15 times more efficient than a typical LWR in terms of fuel utilization (percent of fuel
fissioned). The GCR produces as little as one-tenth the actinides of a conventional LWR,
while limiting the overall waste by two orders of magnitude, and is inherently resistant to
weapons proliferation. The GCR shows promise as being a viable means of power
production while limiting nuclear waste.
x
CHAPTER 1 INTRODUCTION
Introduction
The Gaseous Core Reactor (GCR) concept has the potential to surpass all existing
and current plans for advanced reactors in the areas of sustainability, proliferation
resistance, and power conversion efficiency. The fuel in a GCR (as its name implies) is
in a gaseous state throughout the lifecycle of the core. Because of its gaseous state, the
fuel can be pumped into the system allowing continuous online fueling, giving operators
greater control over the nuclear environment in the core. The unique ability to rapidly
change the neutron environment through online fueling opens up a range of abilities to
manage fission products, manage actinide production, and limit proliferation dangerous
materials.
The GCR design is being studied as a viable alternative to solid-fuel power
reactors, because of its promise in the areas of waste products and high burnup
capabilities. Currently there are no regulations differentiating solid or gas fuel reactors
for core limitations, therefore the GCR must abide by the current regulations placed on
existing reactors. The GCR design is being studied under the assumption that these
current regulations and restrictions do not change. The GCR design would prove even
more effective if limitations on the reactor were less severe than on solid-fuel reactors.
Features of the Gas Core Reactor
The GCR design can be characterized as an externally moderated, circulating fuel
reactor with a thermal neutron spectrum. The fuel will typically be enriched uranium
1
2
tetra-fluoride (UF4) and will remain with current licensing limitations for the purpose of
this study.
The GCR features a unique list of traits that promise to make it an exceptionally
safe and environmentally suitable reactor. The GCR design features a very low fuel
inventory, requiring nearly 2 orders of magnitude lower inventory than a Light Water
Reactor (LWR). Because the fuel is constantly being fed into the core excess fuel will be
required on site, so that the core can remain critical, however this can be kept secure
while not in use. The system’s criticality is a direct function of the core pressure,
therefore any pressure leak will immediately cause a loss in reactivity, thus protecting the
workers and the public from criticality accidents. The reactor will be kept isolated from
the workers, and operated remotely, limiting the radiation dose to plant workers
compared to current operating reactors. The GCR design also shows promise of being
able to achieve extremely high burnups, thus limiting the amount of nuclear waste that
must be stored in containment.
Neutronically and electrically the GCR design promises to set the upper limit in
performance for power reactors. Plant operators can directly change the neutronics in the
core through a variety of methods. Rotating BeO columns, mass flow rate, and pressure
can be adjusted to control core reactivity and neutron energy spectrum, allowing the users
to achieve optimum neutronics. The system is designed to use a minimum of a combined
cycle (Brayton and Rankine), as well as possibly including a Magneto-Hydro-Dynamic
(MDH) third tier system. The electrical efficiencies are expected to achieve upwards of
60% for the combined cycle design and 70% when including the MHD topping cycle [1].
3
Mechanically the system is very simple compared to current nuclear power plants.
There will be no control or fuel rods, or any other mechanical structures in the core:
simply a cylinder containing the gaseous fuel, and an outside cylinder containing the
reflector material. This drastically reduces the risk of accidents caused from mechanical
limitations. There will be no cladding as the fuel is gaseous, further eliminating any
mechanical or material concerns. The MHD system will present a mechanical challenge,
however the system with just the combined cycle is no different than current combined-
cycle systems used throughout the world, and therefore imposes no additional danger to
mechanical limits.
The backend of the cycle will function like existing power plants, there will be
filters to remove unwanted products (in this case fission products will most likely be
chemically separated) and the fuel will be pressurized to preset specifications. The
backend of the cycle will also include a feeding valve where new fuel is mixed with the
existing fuel, thus removing the current shutdown period required by current nuclear
power plants to reload the fuel.
Thesis Objectives
The goal of this research is to study the design of a GCR and analyze its ability to
reduce the production of nuclear waste while operating as a power reactor. The work will
focus on reasons why waste is produced, which waste products are most important,
methods in which to reduce their production, and how well the GCR design functions in
reducing waste compared to a solid-fuel reactor. The main objectives of this research can
be classified as follows:
• Evaluate reflector size changes and their effects on criticality, spectrum, and actinide inventory.
4
• Evaluate effects on spectrum and actinide inventory for varying core pressures. • Evaluate effects on spectrum and actinide inventory for varying fuel.
Enrichments. • Evaluate effects on spectrum and actinide inventory for varying core sizes. • Evaluate different fuel-feeding schemes and their affects on spectrum and
actinide inventory. • Determine important and dangerous actinides and evaluate the GCRs ability to
limit these actinides. • Compare GCR designs to current operating LWR designs.
It is recognized that assumptions made in the analysis of the core will affect the
results, however reasons will be given as to why they may or may not be important.
Additionally it should be noted that there is acoustic phenomena related with GCR
designs with the potential to significantly affect the results. This research does not
include acoustic effects, as the necessary tools to evaluate their effects are not available.
Thesis Organization
A brief description of current work that may reduce nuclear waste is given in
Chapter 2. The chapter includes methods to reduce waste (such as transmutation), as well
as other reactor designs that will limit waste production.
Current design methodology for the GCR is described in Chapter 3. This includes a
description of the GCR, and its subsystems. The chapter also includes current licensing,
material and mechanical limitations, as well as any limitations the GCR possesses in the
areas of meeting those licensing requirements.
A section describing how the materials and geometries were selected for this
research is detailed in Chapter 4. It includes detailed reasons why every choice in the
GCR design was made for this research, as well as the effects of that design choice. This
5
chapter includes the step by step methodology performed in designing the systems to be
evaluated.
A complete analysis of three different GCR designs, as well as a reference LWR
design is included in Chapter 5. This chapter analyzes reasons why the GCRs performed
as they did, as well as describing any limitations found in the research. The neutronic
analysis was performed using MCNP4C2, in conjunction with Origin2.1. The code
package Monteburns assimilated both packages to work in conjunction with each other,
to produce time-dependent results.
A brief summary of results and recommendations for future work is included in
Chapter 6. This includes any problems found during the course of the research, as well as
the overall performance of the GCR compared to LWR designs.
The appendix section lists sample inputs used in the code packages and any insights
that were thought relevant. Inputs were taken from actual code inputs used in the
research, and can therefore be used to recreate some of the results obtained in this
research.

CHAPTER 2 STATE OF THE ART STUDY
Designs discussed in this chapter include vapor core reactors (VCRs), neutron
accelerators, liquid metal fast breeder reactors (LMFBRs), molten salt cooled reactors,
and gas cooled reactors. Each design has some benefit in the area of lowering waste
production, or depleting current waste, and should be discussed in comparison to the
GCR design that is being studied in this research.
Vapor Core Reactors
Vapor core reactors (VCR) design emerged as an alternative to the GCR, with
functions tailored to utilizing a faster neutron spectrum. Analyses of the VCR cycle and
neutronics have been performed by Kahook [2]. Vapor core reactors function similarly to
GCRs, except the fuel changes phase from gaseous to liquid during its cycle through the
core. Typically VCRs are associated with very high operating temperatures and
efficiencies, simple geometry, and a variety of power control mechanisms. The
secondary side for a VCR is similar to the GCR discussed in this research and would
most likely include MHD as an additional means of power conversion. Therefore an
additional working fluid must be used to increase conductivity of the fuel. The fissioning
fuel would most likely be UF4, the same as in a GCR design, however the operating
temperature for the fuel will be around 3000 K. The main geometry difference between
the VCR and GCR design is the inclusion of boiler columns in a VCR, where the fuel
vaporizes and flows through the core, as opposed to the open cylinder geometry in a GCR
design. The main use for VCR appears to be space transportation, because in a terrestrial
6
7
design, building and maintaining a GCR is easier while still providing most of the
benefits from using a gaseous fuel. The only benefits GCRs do not also possess is the
smaller size that can be used for the VCR because of its liquid stage, as well as its
slightly higher efficiency because of the temperature increase. The high operating
temperature is of course tailored for space power, as the only method of heat rejection is
thermal radiation. The VCR should be just as proficient at reducing actinide inventories,
however is more costly and less practical than a GCR design for terrestrial concerns.
Actinide Transmutation Through Neutron Acceleration
Accelerator driven transmutation system using particle accelerators to eliminate
waste is an alternative (or can be used in conjunction) to minimizing waste production.
Ideally almost all waste can be transmuted into nonradioactive material. Of course all of
the produced actinides will be radioactive, but they can be transmuted into actinides with
short half-lives, and then be allowed to decay naturally.
The process works by accelerating protons through a linac or cyclotron, and
impinging them onto a system comprised of a subcritical nuclear assembly and target.
The protons enter the target (typically W or Pb/Bi) and cause spallations, thus sending
neutrons into the fuel, and causing power to be generated. The idea is that the spallations
will cause a high enough neutron flux (with the correct energy) to transmute any
transuranics. The power generated will then be used to power the accelerator with some
energy left over for commercial use. Thermal efficiencies are believed to be in the 10%
to 20% range [3], with the accelerator taking up approximately 10% of the power.
Fission products would be separated out chemically in-between cycles, which would take
place approximately three times a year. The system provides a unique way of attempting
to eliminate waste, however one major problem exists in this design. The accelerators
8
have to remain on at all times, or the system will shut down, as it is sub critical by itself.
For commercial use this presents a large problem as any shutdown time will cost a
company a large amount of money lost in profits.
The actual transmutation of waste as opposed to a GCR should be comparable, as
the main factor in determining how much waste is transmuted is neutron energy. It
should be noted that while the GCR can vary the neutron energy drastically through user
control, the average spallation neutron energy may be past what the GCR is capable of
achieving, therefore transmuting a greater portion of actinides. An increased flux does
not correlate to an increased transmutation, as more actinides will also be produced as
well (the ratio of actinides removed to produced is dependent only on cross-sections), the
only way to transmute the actinides is to use a very specific neutron energy. The
Accelerator Driven System (ADS) also heavily relies on reprocessing fuel, which is
another expensive process. Commercially the accelerator driven systems do not possess
the same possibility for economical power generation as the GCR system does. As far as
waste transmutation is concerned, the ADS design may prove to be effective yet costly
and not for commercial use.
Reprocessing
Although fuel reprocessing is not a method of power generation, it is a method that
enables power reactors to approach theoretical maximum burnup. Spent fuel is taken
from reactors and deposited into the reprocessing plant, where chemical processes will
separate the unused fuel from the nuclear waste. Reprocessing potentially allows
maximum burnup in fuel, as any fuel that is not burned, can be placed back into another
core.
9
Currently the only type of reprocessing used commercially is PUREX, which uses
nitric acid to remove useful fuel from waste products. The downside to this method of
reprocessing is the expense that it entails. Lamarsh [4] gives a simple explanation of the
reprocessing method. Reprocessing is currently not very economical not only from an
operations standpoint but from a capital cost as well. The plants require very strict
regulations because they are dealing with large amounts of hazardous materials
(radioactive and proliferation dangerous), thus raising the capital costs considerably. As
fuel becomes more expensive in the future the operation viability may increase however.
From an engineering standpoint, the main concern is limiting the potential for
flammability due to the organic solvent.
Liquid Metal Fast Breeder Reactors
The Liquid Metal Fast Breeder Reactor (LMFBR) is a concept that increases the
electric efficiency (40%) and fuel utilization compared to a LWR. The fuel is typically
enriched uranium or plutonium (15-30%) and is surrounded by liquid sodium as the
coolant. The fuel is in solid form, in fuel pins, much like a LWR, except the cladding is
usually stainless steel.
Sodium has a much higher thermal conductance than water and therefore makes a
better heat transfer medium. Using sodium as a coolant allows higher maximum
temperatures because of its high thermal conductance (141 w/mK compared to 0.6 w/mK
for water), allowing for faster removal of heat. There is no moderator in this reactor
design as the purpose is to utilize high-energy neutrons to breed fissile material [4].
Sodium is heavier than water, which will limit the ability of the system to thermalize
neutrons compared to a LWR, allowing for a higher neutron energy spectrum. Plutonium
will then be bread from absorptions in U238, which can then be used as fissile fuel to
10
extend the life of the core. Maximum burnup is expected between 100 and 150
GWD/MTU, which is three to four times greater than burnups for LWRs.
The most significant problem with the system is the sodium is highly reactive with
air and water. Therefore extreme precautions must be taken to insure the system is sealed
off from the outside environment. The secondary side in this system (the turbine side)
requires a working fluid to go through the turbine. The working fluid is typically water
(steam), which creates the potential for sodium-water interaction. Therefore the
secondary and primary side must be very carefully sealed off from each other. If any
leaks were to occur and the sodium came into contact with water, the system would
undergo a violent explosion depending on the break in the system. This is a very large
detriment to this system, as any sodium leaks will lead to a loss of the system. Sodium
also has a very high melting point (98 ºC), therefore requiring the system to remain above
room temperature at all times. This causes problems in the case of emergency if the
reactor needed to be shut down, the sodium would solidify, thus ruining the core. At then
end of core life, the sodium is also very radioactive and must be handled with care,
further increasing safety problems and costs associated with LMFBRs. Finally since the
fuel used in the LMFBR is enriched well above current limits, licensing problems are
certain to arise. If the licensing restrictions can be changed, and the system can be sealed
perfectly, this reactor design shows promise for reducing nuclear waste by not only using
more of the initial uranium, but by breeding plutonium from unfissioned uranium to then
be used as fuel.
CHAPTER 3 DESIGN OF THE URANIUM TETRA-FLUORIDE GAS CORE REACTOR
Introduction
In the design of a GCR the choice of geometry, pressure, enrichment and fuel
feeding must be based on the application of the plant. The purpose of this research is to
study the GCR’s ability to limit actinide inventory, either by burning actinides as they are
produced, or by limiting the production of those actinides. The biggest factor in
determining actinide production and depletion is the neutron energy spectrum, which is
affected by the physical properties of the core. Therefore once a general design is
established the purpose of the research is to parametrically evaluate the properties of the
core, and their effects on actinide production and depletion. When establishing the
general design it must be known how strict current regulations will be followed as well as
the limiting effect of current material and mechanical properties. The reactor must also be
able to maintain criticality throughout the life of the core. Although the primary focus of
this research is to evaluate actinide production, the system must be feasible from both a
neutronics and materials standpoint.
Preliminary Design Considerations
This particular GCR design is being developed for terrestrial power production, and
as such must attempt to adhere as closely as possible to current restrictions placed on
existing designs. Therefore the following issues should be addressed:
• The pressure of the core should not reach an unattainable state. Current reactor pressure vessels for Pressurized Water Reactors (PWR) operate at approximately 2000 psi or 138 bar. As long as the pressure of the GCR does not overly exceed
11
12
the nominal PWR pressure, there is no cause for concern. Pressure vessels can be built to operate at higher pressures currently, however in the scope of the research the limiting pressure will be 175 bar.
• The dimensions of the reactor must be feasible. Reactor dimensions will vary
between three and four meters for a right circular cylinder.
• Material considerations for wall liners, coolant flow, and reflector liners and coolant are not considered in the scope of this research. They will be discussed later as to how they will affect the reactor, but are not included in any calculations.
• The lifetime for the core is 10 years, where radiation damage is considered the
limiting factor on core length.
• Fueling will done on-line, meaning fuel will be added to the core during operation, either at state points, or continuously. During operation, fission product removal must be done online, also at either state points or continuously.
The above issues are considered to be the most important from a design standpoint for
the scope of this research.
Material Selection
The GCR design being study in this research is a BeO externally moderated core
with UF4 circulating as the fissioning fuel. The choice for BeO as the moderator/reflector
and UF4 as the fuel is based on considerations outlined in the following sections.
Moderator-Reflector Material
Conventional thermal reactors use low mass number isotopes with small absorption
cross-sections relative to their scattering cross sections. The low mass number allows
rapid loss of energy upon scattering, and the lower the ratio of absorption to total cross
section allows for more neutrons to reach thermal energies without being absorbed in the
moderator-reflector. Traditional materials include normal water (H2O), deuterium (D2O),
beryllium (Be) and beryllium oxide (BeO), and pyrolitic graphite, which have all been
studied in [5-7]. The decision of material must be based on the specific design goals for

13
the material. Since the purpose of this research is to evaluate actinide inventory, the
spectrum desired for the reactor is faster than the conventional LWR. As will be shown
later, faster spectrums have higher fission to capture cross section ratios, which lead to
higher removal rates. The choice of BeO will allow the reactor to operate at a faster
spectrum than traditional thermal reactors, while also allowing spectrum shifts if desired.
The BeO can be processed into columns that can be externally adjusted to change the
spectrum inside the core. By making the external moderator BeO instead of a liquid, there
is no pumping required, which lessens the number of movable parts. As the GCR is a
high temperature reactor Be may be an unsafe material to implement as the reflector.
Operating temperatures for Be must remain in the region between 1600 and 2000K, while
this reactor design will reach temperatures of up to 2400 K. The BeO reflector can
operate safely at temperatures up to 2800K. As far as thermodynamic safety is concerned
graphite is superior as it can operate safely at temperatures of up to 4000K, exceeding the
system requirements. Neutronically it was shown by S.D. Kahook [2] that graphite is
inferior to the BeO reflector as it provides a lower reactivity gain for the same size
reflector. In terrestrial applications size is not an explicit demand for feasibility, however
as the reactor may be moderated by rotating reflector columns, graphite becomes
cumbersome to maneuver and may pose problems for moderation control systems.
From a chemical standpoint BeO and Be prove to be superior to H2O or D2O as
well. Chemically H2O and D2O are not compatible with either choice of fuel, UF4 or
UF6. If there were to be any leak in the system the chance for the fuel and reflector
coming into contact is possible, and would cause a violent reaction if the reflector were
D2O or H2O.
14
For the purposes of code calculations the reflector is assumed to be a cylindrical
shell around the fuel, in reality it will be many columns containing graphite on one side,
and an absorber material on the other. Criticality control will be accomplished by
rotating the graphite columns to achieve an optimum mix of absorption and
moderation/reflection. Reflector size in a GCR has a direct effect on the core’s spectrum
and ability to limit actinide production, and various sizes will be studied and discussed in
chapter 5.
Fissioning Fuel Material
The possible choices for fuel for this reactor consist of only UF4 and UF6. The
University of Florida has done research on both the above fuel types examining their
viability as fuel choices [2,5-7]. The choice of fuel for this reactor is based on chemical
stability and thermo-physical properties.
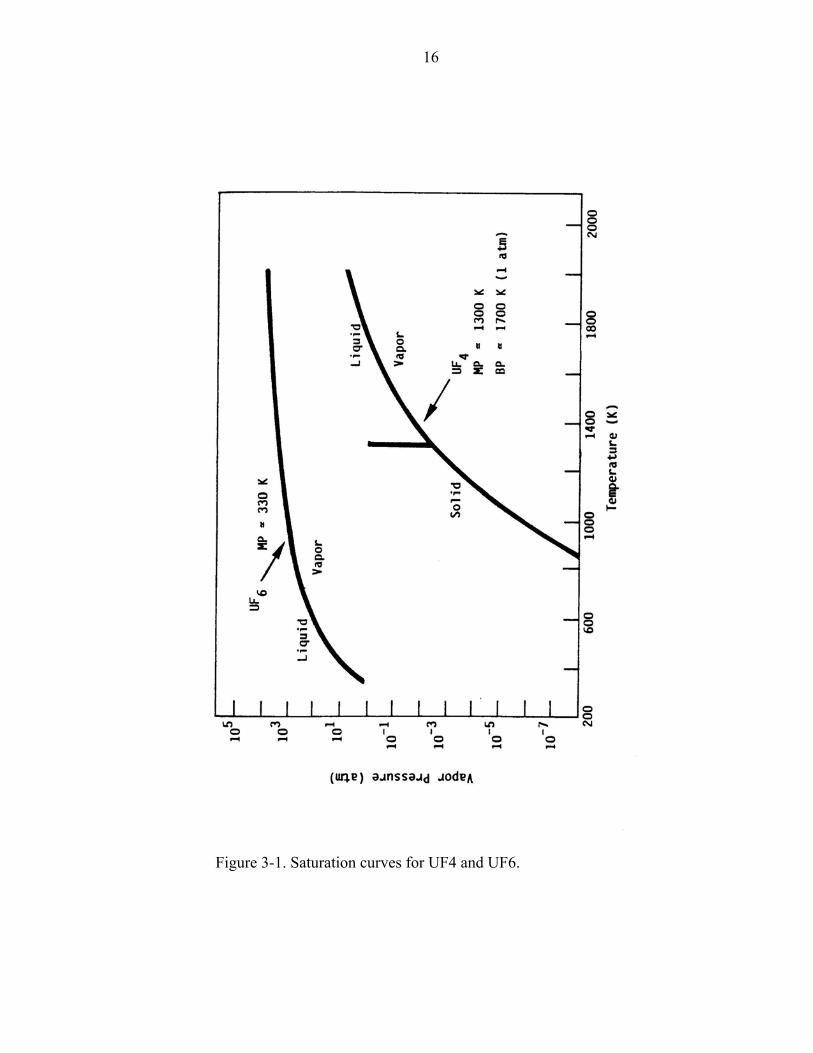
For the purpose of this research, it can be shown in Figure 3-1 that UF4 is the ideal
choice. Pressure for the core may exceed 100 bar to harden the spectrum, therefore at
those pressures and the 2400 ºK operating temperature of the core, UF6 would be in a
liquid phase. It should be noted that UF6 is also not as stable as UF4 and will lead to
material and decomposition problems at the operating pressure and temperatures used in
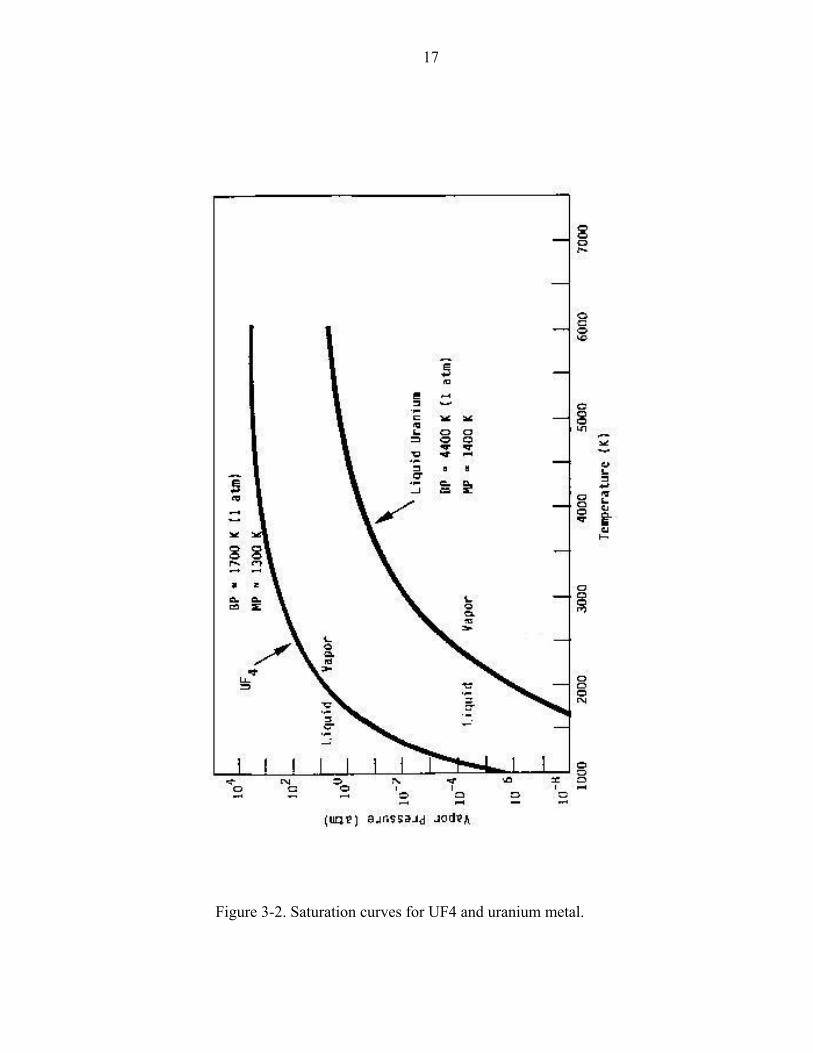
the reactor. Uranium metal is not being looked at as a feasible choice as it would remain
solid at the operating temperature and pressure as shown in Figure 3-2. Fuel enrichment,
as well as feed fuel enrichment must also be considered when designing a core. The
lower the enrichment, in principal, the higher the conversion ratio (it will be shown in
Chapter 5 that this does not represent the best limitation of actinides as was originally
thought). Another important parameter affecting fuel enrichment is the legality of the

15
fuel. Currently 5%-enriched fuel is the upper limit for fuel used in power production.
This research is focused on designed a viable means of power production and therefore
must try and comply with current standards (although the limit on enrichment has
steadily risen over recent years and is being proposed to be raised again). The
enrichment of the feed fuel can also be varied, however it was chosen to be the same
enrichment as was being burned (if the core burns 35% U238 and 65% U235, then the
feed fuel enrichment will be the same mix). Although this will cost more than
conventional fuel for the increase in seperative work units (SWU) needed, this method
was chosen to try and keep the U238 constant, and to limit pressure increases from excess
fuel. It is possible to operate the core with low feed fuel enrichment (although this will
decrease the effectiveness of the reactor), however for this research the feed fuel
enrichment will not be limited to conventional fuel enrichment limitations.
Power Cycle Description
Ideally the power cycle for the GCR would include MHD power conversion, which
leads to a combined brayton-rankine cycle. The schematic design for this system is
shown in Figure 3-3. The design shown operates at 70% efficiency, however for this
research it is assumed that the design will not encompass the use of MHD, thus only
being 60% efficient. For the purpose of this research it is assumed that the fission
products can be completely removed chemically during operation. This chemical cleanup
would be done in the backend of the cycle before the fuel is sent back to the core. The
assumption that all fission products can be removed may shown not be viable in future
studies, however for the scope of this study it is assumed acceptable
16
Figure 3-1. Saturation curves for UF4 and UF6.
17
Figure 3-2. Saturation curves for UF4 and uranium metal.
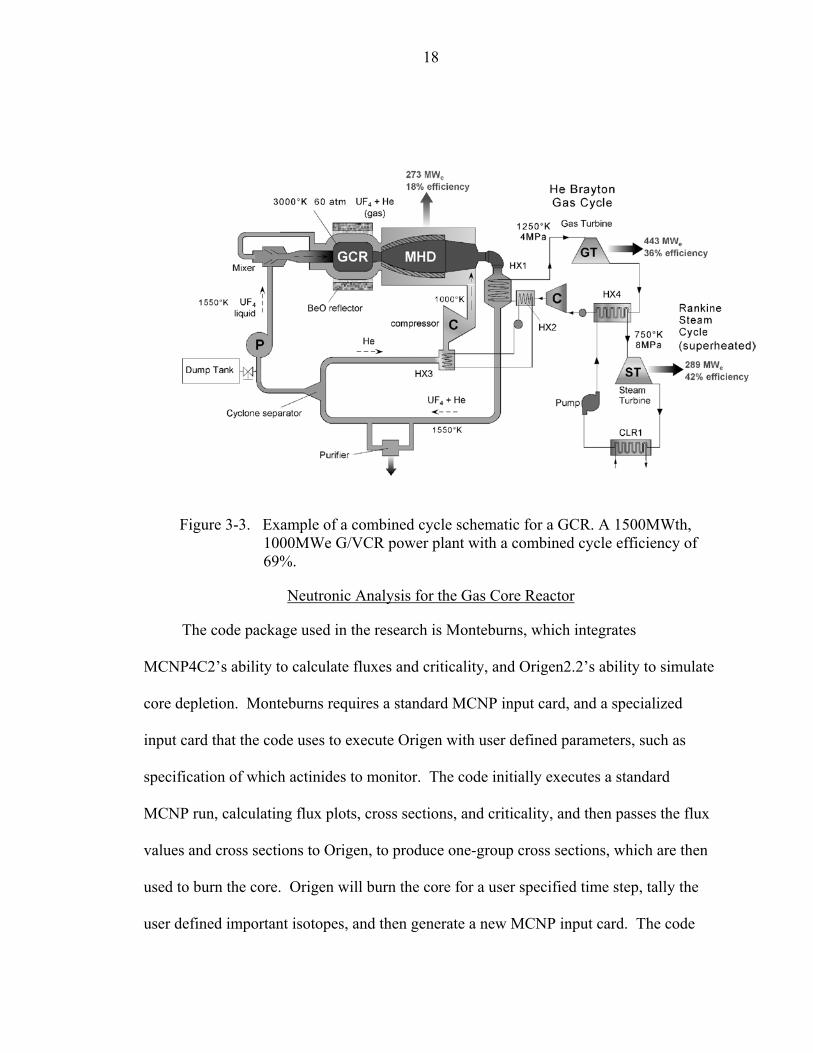
18
Figure 3-3. Example of a combined cycle schematic for a GCR. A 1500MWth, 1000MWe G/VCR power plant with a combined cycle efficiency of 69%.
Neutronic Analysis for the Gas Core Reactor
The code package used in the research is Monteburns, which integrates
MCNP4C2’s ability to calculate fluxes and criticality, and Origen2.2’s ability to simulate
core depletion. Monteburns requires a standard MCNP input card, and a specialized
input card that the code uses to execute Origen with user defined parameters, such as
specification of which actinides to monitor. The code initially executes a standard
MCNP run, calculating flux plots, cross sections, and criticality, and then passes the flux
values and cross sections to Origen, to produce one-group cross sections, which are then
used to burn the core. Origen will burn the core for a user specified time step, tally the
user defined important isotopes, and then generate a new MCNP input card. The code
19
will then run the new MCNP input card, and repeat the process for a specified number of
iterations, simulating time dependent depletion. Monteburns allows the input of fuel
feeding, which allows the user to determine how much fuel should be added per cycle, as
Origen will be depleting the current inventory. The feed fuel can be input daily, or at
specified state points throughout the life of the core. When evaluating longer cycle
lengths (10 years), it is assumed acceptable to input the fuel continuously throughout the
core life. In practice the fuel will most likely be fed into the core every few days or
weeks, however to do this explicitly in Monteburns would require a tremendous amount
of CPU time, as the code has to execute an MCNP run every state point. Feeding the fuel
continuously should not significantly change the neutronics in the core, as the extra fuel
would only be present for a few days or weeks at most. Adding the fuel continuously or
at state points will not affect the reactivity of the core, as the external BeO reflector
cylinders can be rotated to maintain criticality. It should be noted that Monteburns does
not calculate burnup correctly (when including online fueling), it will only calculate
burnup as a function of Metric Ton Heavy Metal (MTHM) of initial inventory, the user
must tally the total MTHM put into the core through the feed file, and recalculate the
correct burnup. It is also assumed that the removal of fission products can also be done
continuously online, and this is simulated in Monteburns as well. The lack of liners and
wall cooling materials will lead to an overestimation of Keff, as will the assumption that
the fuel remains in a static position. Fuel in the GCR is circulating which means that
when the fuel exits the core, delayed neutrons will still be produced, however the code
packages used do not account for this effect which will cause a phantom increase in
reactivity that would not be experienced in practice. This means that in practice delayed
20
neutrons will be released while in the backend of the cycle, which will not be
contributing to the criticality of the core, whereas in the research those neutrons are
emitted while still in the core, causing the phantom increase in reactivity. It was shown
by S.D. Kahook [2] that these assumptions do not severely affect the reactivity worth in
the core, and values obtained under these assumptions are reasonable.
CHAPTER 4 CONFIGURATION AND OPTIMIZATION OF DESIGN PARAMETERS
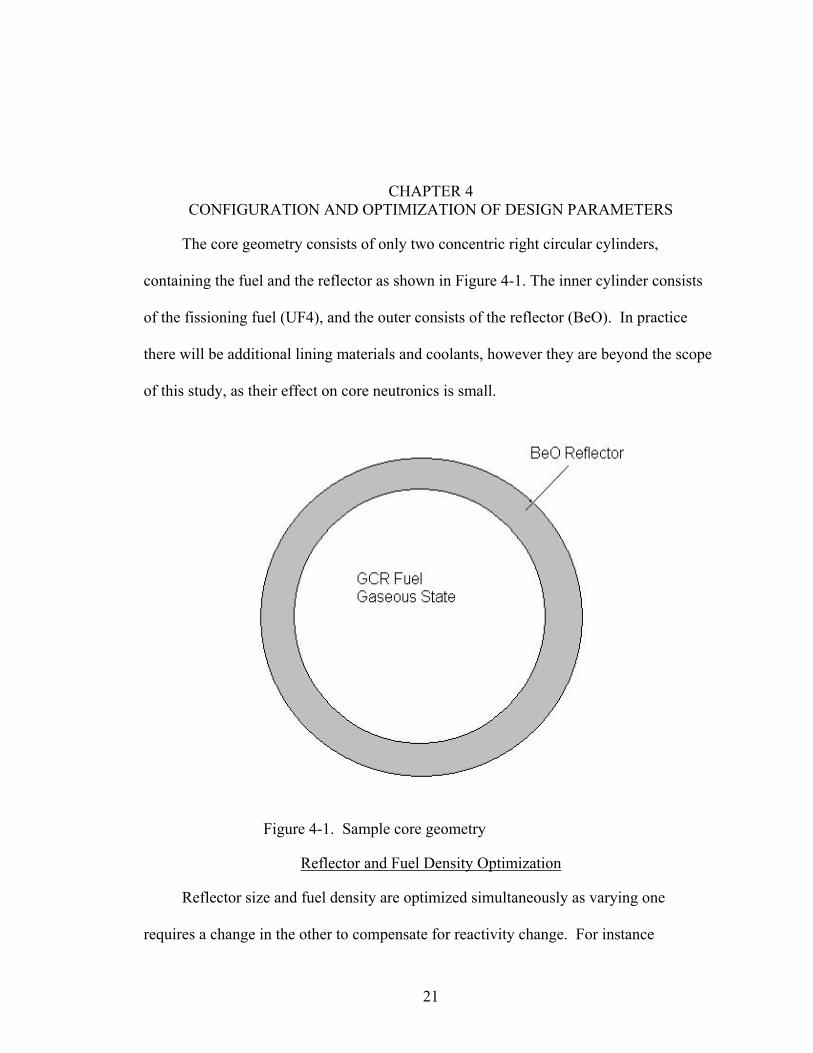
The core geometry consists of only two concentric right circular cylinders,
containing the fuel and the reflector as shown in Figure 4-1. The inner cylinder consists
of the fissioning fuel (UF4), and the outer consists of the reflector (BeO). In practice
there will be additional lining materials and coolants, however they are beyond the scope
of this study, as their effect on core neutronics is small.
Figure 4-1. Sample core geometry
Reflector and Fuel Density Optimization
Reflector size and fuel density are optimized simultaneously as varying one
requires a change in the other to compensate for reactivity change. For instance
21
22
increasing the reflector size introduces a positive reactivity insertion and must be offset
with a decrease in fuel density. Conversely shrinking the reflector size requires an
increase in fuel density to maintain criticality. It should be noted that instead of lowering
the fuel density the enrichment could be adjusted, however evaluating the system with
three variables simultaneously significantly increases the difficulty. Therefore it was
decided to evaluate reflector and fuel density parameters for chosen enrichments.
Pressure limitations were not placed on the core at this stage, as it is just scoping
calculations to determine viable reflector size and pressure combinations (viable in the
sense that the reactor would start its cycle critical).
In this stage of optimization varying reflector sizes were matched up with fuel
densities to achieve several critical reactor design possibilities. This stage of the research
is not concerned with actinide inventory, but is only concerned with producing several
critical reactor designs that can be studied in depletion analysis. The initial enrichment
used in this optimization phase was 10% U235 by atom. This value will be changed
during depletion analysis, but in this stage of the research it was used as a benchmark
value. For a given enrichment, there is a minimum reflector thickness where no amount
of pressure increase will cause the reactor to reach criticality. It was also initially
assumed that the fastest neutron spectrum would produce the best actinide composition,
so reflector size was minimized in many cases. A smaller reflector will provide a faster
neutron spectrum because a neutron scattered into the reflector will either escape the
reflector and disappear from the system or be reintroduced into the fuel region with a
lower average number of scatters than when a larger reflector is present. The lower
number of scatters is because in a larger reflector the neutron may backscatter towards
23
the core from a point in space where if a smaller reflector were present the neutron would
have already escaped the geometry. The faster neutron spectrum also produces higher
fission to capture ratios for the actinides, resulting in more fissions per interaction, thus
depleting the actinides. However it will be shown in Chapter 5 that the assumption that
the fastest neutron spectrum results in the best actinide inventory is false and therefore
other designs were researched.
One benefit to a smaller reflector is an increase in plutonium generation, which
increases the conversion ratio of the core (fissile material produced compared to fissile
material depleted). A faster spectrum causes more U238 to undergo capture thus
eventually creating Pu239, which has high relative neutron cross-sections within the
energy regime that the GCR operates. A higher conversion ratio in a LWR leads to a
higher achievable burnup. It was also initially believed that this would increase the
GCRs effectiveness, and designs were based on achieving the highest plutonium
production.
It should also be noted that rotating the BeO columns to increase or decrease
neutron thermalization can control the spectrum of the core. As was previously
mentioned the reflector may consist of many BeO columns as shown in Figure 4-2 (The
figure shows the BeO and absorber material with a random configuration, this is just a
sample made to show the general setup of the columns). However, the columns were
simulated by one concentric cylinder enveloping the core, which they will approximate in
an actual design. Criticality of the core can also be managed by rotating these BeO
reflector columns; however, an easier method is to adjust the flow rate of the fuel. As
there is no way to model dynamically rotating BeO columns in MCNP, the geometry

24
used was a concentric cylinder around the fuel core. Because of code limitations the only
way to manage criticality is through the fuel feed rate in Monteburns (as opposed to the
rotating column method) and enrichment, however in practice this will not be the case.
Figure 4-2. Sample BeO column configuration
The initial reflector material used in this research was Be, however because of
temperature limitations BeO will be used instead. The change in reflector thickness
required to achieve the same criticality when going from Be to BeO is approximately
2.5 cm, not a significant change in size. Changing from Be to BeO does not significantly
affect the neutron spectrum as most of the scatters are from interactions with Be, and the
few scatters that occur from an interaction with oxygen will result in almost the same
energy loss as from Be (although the maximum energy loss possible from an interaction
with Be compared to O is different, when taking into account the probability of
25
interaction with O the average energy loss per scatter is nearly the same for Be and BeO).
The use of BeO became necessary as a shielding material when considering a highly
pressurized core, since UF4 would be in a liquid phase at the temperatures needed to keep
Be from melting. Using UF4 requires a higher temperature therefore BeO is needed
because its melting point is 2800 K, well above the operational temperature of 2400 K
used in this research.
Tables 4-1 through 4-5 show the varying pressure and reflector size combinations
studied to achieve criticality. The minimum shield thickness to reach criticality in a 10%
enriched core is approximately 30 cm. This reflector thickness is the base design used in
the next phase of optimization – actinide inventory optimization. No amount of pressure
increase using a 20 cm reflector thickness and 10% U235 enrichment will cause
criticality to be achieved (pressure surpasses the previous statement of the 175 bar
limitation to show that pressure is not the limiting agent in reaching criticality in that
design). When using a 50 cm reflector size, which also gives the softest neutron
spectrum, enrichment can be decreased under the initial 10% as shown in the inventory
optimization stage.
Core Size Optimization
The core varied between a three and four meter right circular cylinder. Reasons for
varying the size include effects on neutron spectrum and leakage. A larger core (for a
given gas pressure and enrichment) features lower leakage, as well as a faster neutron
spectrum. The lower leakage is an obvious result of increased core size as an increased
core size increases the number of mean free paths in the core, causing more neutrons to
interact before escaping into the reflector. Most of the interactions take place from
neutrons that have backscattered into the core from the reflector, and those neutrons will
26
see more mean free paths before being able to pass through the core into the reflector
again, thus causing more interactions and a lower leakage. The faster spectrum is a result
of more interactions taking place in the core without having seen the reflector region
(without having seen the reflector region as often as would occur with a smaller core).
Neutrons must pass through more mean free paths to reach the reflector and thermalize,
increasing the chance that a fast reaction will occur. A larger core will raise keff,
however the hardened neutron spectrum causes more actinide buildup in the core.
Mechanical properties also favor a smaller core, as it is easier to manufacture, and to
maintain pressure in compared to a larger core. Since active LWRs today are around the
same size as a three-meter right circular cylinder now, production of such a core should
pose no problem.
Table 4-1. Keff values for 10 cm reflected core Fuel * Enrichment U * U235 * U238 * F * P (bar) K eff %Rel Error MFP (cm)
1.42E-04 10.00% 2.84E-05 2.84E-06 2.56E-05 1.14E-04 9.42 0.2133 1.41E-03 1210.5
1.42E-03 10.00% 2.84E-04 2.84E-05 2.56E-04 1.14E-03 94.16 0.4558 2.06E-03 131.2
1.42E-02 10.00% 2.84E-03 2.84E-04 2.56E-03 1.14E-02 941.6 0.7974 1.74E-03 12.899
3.40E-02 10.00% 6.80E-03 6.80E-04 6.12E-03 2.72E-02 2253.9 0.9048 1.21E-03 5.351
4.40E-02 10.00% 8.80E-03 8.80E-04 7.92E-03 3.52E-02 2916.81 0.9227 1.55E-03 4.129
8.40E-02 10.00% 1.68E-02 1.68E-03 1.51E-02 6.72E-02 5568.45 0.9553 1.25E-03 2.159
1.40E-01 10.00% 2.80E-02 2.80E-03 2.52E-02 1.12E-01 9280.74 0.9647 1.03E-03 1.295
2.80E-01 10.00% 5.60E-02 5.60E-03 5.04E-02 2.24E-01 1.86E+04 0.9668 9.90E-04 0.647
5.60E-01 10.00% 1.12E-01 1.12E-02 1.01E-01 4.48E-01 3.71E+04 0.9668 9.90E-04 0.324
1.20E+00 10.00% 2.40E-01 2.40E-02 2.16E-01 9.60E-01 7.95E+04 0.9668 9.90E-04 0.151
1.20E+01 10.00% 2.40E+00 2.40E-01 2.16E+00 9.60E+00 7.95E+05 0.9668 9.90E-04 0.015
1.20E+04 10.00% 2.40E+03 2.40E+02 2.16E+03 9.60E+03 7.95E+08 0.9668 9.90E-04 1.51E-05
1.42E-02 15.00% 2.84E-03 4.26E-04 2.41E-03 1.14E-02 941.6 0.9436 1.20E-03 12.923
1.93E-02 15.00% 3.86E-03 5.79E-04 3.28E-03 1.54E-02 1279.42 0.9996 1.26E-03 9.48
2.00E-02 15.00% 4.00E-03 6.00E-04 3.40E-03 1.60E-02 1325.82 1.0084 1.23E-03 9.145
2.50E-02 15.00% 5.00E-03 7.50E-04 4.25E-03 2.00E-02 1657.28 1.0422 1.36E-03 7.304
3.40E-02 15.00% 6.80E-03 1.02E-03 5.78E-03 2.72E-02 2253.9 1.084 1.48E-03 5.36
* Units of (atoms/barn*cm) Volume (m^3) 21.21 BeO Thickness(cm) 10
27
Table 4-2. Keff values for 20 cm reflected core Fuel * Enrichment U * U235 * U238 * F * P (bar) K eff %Rel Error MFP (cm)
1.42E-04 10% 2.84E-05 2.84E-06 2.56E-05 1.14E-04 9.42 0.61938 2.64E-03 1093.3
1.42E-03 10% 2.84E-04 2.84E-05 2.56E-04 1.14E-03 94.16 0.93954 2.64E-03 29.04
2.80E-03 10% 5.60E-04 5.60E-05 5.04E-04 2.24E-03 185.61 0.95242 2.24E-03 65.74
5.60E-03 10% 1.12E-03 1.12E-04 1.01E-03 4.48E-03 371.23 0.96322 2.47E-03 32.9
1.20E-02 10% 2.40E-03 2.40E-04 2.16E-03 9.60E-03 795.49 0.96661 2.11E-03 15.25
2.40E-02 10% 4.80E-03 4.80E-04 4.32E-03 1.92E-02 1590.98 0.96661 2.11E-03 7.59
4.80E-02 10% 9.60E-03 9.60E-04 8.64E-03 3.84E-02 3181.97 0.96661 2.11E-03 3.79
8.40E-02 10% 1.68E-02 1.68E-03 1.51E-02 6.72E-02 5568.45 0.96661 2.11E-03 2.16
8.40E-01 10% 1.68E-01 1.68E-02 1.51E-01 6.72E-01 5.57E+04 0.96661 2.11E-03 0.22
8.40E+00 10% 1.68E+00 1.68E-01 1.51E+00 6.72E+00 5.57E+05 0.96661 2.11E-03 0.02 * Units of (atoms/barn*cm) Volume (m^3) 21.21 BeO Thickness(cm) 20
Table 4-3. Keff values for 30 cm reflected core
Fuel * Enrichment Core
Radius (m) U * U235 * U238 * F * P (bar) K eff %Rel Error MFP (cm)
1.42E-04 10.00% 3 2.84E-05 2.84E-06 2.56E-05 1.14E-04 9.42 0.80734 2.15E-03 1041
1.42E-03 10.00% 3 2.84E-04 2.84E-05 2.56E-04 1.14E-03 94.16 1.13973 2.17E-03 126.17
5.00E-04 10.00% 3 1.00E-04 1.00E-05 9.00E-05 4.00E-04 33.15 1.07378 2.41E-03 333.45
2.50E-04 10.00% 3 5.00E-05 5.00E-06 4.50E-05 2.00E-04 16.57 0.96226 2.27E-03 623.16
4.00E-04 10.00% 3 8.00E-05 8.00E-06 7.20E-05 3.20E-04 26.52 1.03446 2.36E-03 432.77
3.25E-04 10.00% 3 6.50E-05 6.50E-06 5.85E-05 2.60E-04 21.54 1.01311 2.52E-03 492.21
3.13E-04 10.00% 3 6.25E-05 6.25E-06 5.63E-05 2.50E-04 20.72 1.0078 2.32E-03 509.8
3.00E-04 10.00% 3 6.00E-05 6.00E-06 5.40E-05 2.40E-04 19.89 1.00045 2.19E-03 529.18
1.80E-03 7.50% 3 3.60E-04 2.70E-05 3.33E-04 1.44E-03 119.32 1.14515 3.16E-03 101.54
2.00E-03 7.50% 4 4.00E-04 3.00E-05 3.70E-04 1.60E-03 132.58 1.11223 2.60E-03 91
2.17E-03 7.50% 4 4.34E-04 3.26E-05 4.01E-04 1.74E-03 143.85 1.07764 4.72E-03 100.64
2.17E-03 6.00% 4 4.34E-04 2.60E-05 4.08E-04 1.74E-03 143.85 1.07764 4.72E-03 69.22
1.80E-03 5.00% 4 3.60E-04 1.80E-05 3.42E-04 1.44E-03 119.32 1.04945 3.63E-03 101.72
2.40E-03 5.00% 4 4.80E-04 2.40E-05 4.56E-04 1.92E-03 159.1 1.04255 2.99E-03 76.64
2.66E-03 5.00% 4 5.32E-04 2.66E-05 5.05E-04 2.13E-03 176.33 1.03093 3.51E-03 69.22 * Units of (atoms/barn*cm)
28
Table 4-4. Keff values for 40 cm reflected core Fuel * Enrichment U * U235 * U238 * F * P (bar) K eff %Rel Error MFP (cm)
1.42E-04 10.00% 2.84E-05 2.84E-06 2.56E-05 1.14E-04 9.42 0.93312 2.02E-03 1018.2
2.80E-04 10.00% 5.60E-05 5.60E-06 5.04E-05 2.24E-04 18.56 1.09133 2.04E-03 556.01
2.00E-04 10.00% 4.00E-05 4.00E-06 3.60E-05 1.60E-04 13.26 1.02232 2.45E-03 749.61
1.80E-04 10.00% 3.60E-05 3.60E-06 3.24E-05 1.44E-04 11.93 0.99529 1.88E-03 824.42
1.90E-04 10.00% 3.80E-05 3.80E-06 3.42E-05 1.52E-04 12.6 1.00431 2.36E-03 786.08
* Units of (atoms/barn*cm) Volume (m^3) 21.21 BeO Thickness(cm) 40 Table 4-5. Keff values for 50 cm reflected core.
Fuel * Enrichment U * U235 * U238 * F * P (bar) K eff %Rel Error MFP (cm)
1.42E-04 10.00% 2.84E-05 2.84E-06 2.56E-05 1.14E-04 9.42 0.986 2.12E-03 1010.8
1.45E-04 10.00% 2.90E-05 2.90E-06 2.61E-05 1.16E-04 9.61 0.9899 2.57E-03 992.09
1.50E-04 10.00% 3.00E-05 3.00E-06 2.70E-05 1.20E-04 9.94 0.9986 2.06E-03 962.65
1.52E-04 10.00% 3.04E-05 3.04E-06 2.74E-05 1.22E-04 10.08 1.0003 2.39E-03 908.47
1.55E-04 10.00% 3.10E-05 3.10E-06 2.79E-05 1.24E-04 10.28 1.0116 2.50E-03 934.71
1.60E-04 10.00% 3.20E-05 3.20E-06 2.88E-05 1.28E-04 10.61 1.018 1.96E-03 951.1
3.60E-04 5.00% 7.20E-05 3.60E-06 6.84E-05 2.88E-04 23.86 1.0207 2.06E-03 460.45 * Units of (atoms/barn*cm) Volume (m^3) 21.21 BeO Thickness(cm) 50
Feed Fuel and Enrichment Optimization
The defining aspect of the GCR is that it allows online fuel feeding, enabling the
reactor operator to very accurately control criticality and actinide production. The feed
fuel can vary by enrichment and flow. Adjusting the enrichment affects not only the
spectrum and reactivity of the core, but also affects the overall enrichment of the core,
which could pose licensing problems. The flow at which feed is introduced into the core
affects both the criticality and the spectrum of the core. A higher flow rate will induce a
positive reactivity insertion, as fissile fuel will be replaced faster after fissions. The

29
spectrum is dependent on actinide inventory in the core, and a lower flow rate will affect
the ratio of U235 to other actinides in the core at a given time.
The enrichment of the feed in this research was chosen to match the enrichment at
which the fuel was depleted. This does not have to be the case; the enrichment can be of
any amount as long as the core remains critical. Monteburns outputs how much U235
and U238 are depleted at each step point in the depletion analysis. Using those values to
derive an average “depletion enrichment” generates the enrichment used for the feed fuel.
One reason for using this “depletion enrichment” method is simplicity; it allows a single
enrichment to be used for fuel feeding. In practice, the feed fuel enrichment would vary
every time fuel was injected into the core, be it at state points, or continuously. However
this research is used mainly for scoping calculations and it is assumed acceptable to use
an average enrichment for the feed fuel. Changing the enrichment would allow a tighter
control on spectrum and actinide production, although would be much more
computationally difficult, and require new methodology to be developed in the area of
fuel management. It is possible to use highly enriched fuel, which then requires less fuel
to be injected into the core, however the concern then arises with transporting highly
enriched fuel, and raising the overall core enrichment to dangerous levels (with respect to
licensing), as well as cost increases to generate the fuel. Using low enriched fuel is the
safest from a proliferation aspect, and cheapest to produce; however, it may produce a
problem in pressure control. Because more U238 is introduced into the core than
depleted, the pressure of the core will gradually rise, and if the enrichment of the feed
fuel is lowered the rise of pressure becomes more dramatic, and eventually will strain the
mechanical limits of the core. Highly (>20% U235 by atom) enriched fuel will also
30
allow a higher burnup to be achieved however commercially highly enriched fuel is not
viable at this time (commercial reactors can not operate with greater than 20% U235 by
atom enriched fuel). Therefore using approximately the depletion enrichment limits
pressure increase as well as simplifies the fuel management process.
The initial core enrichment is varied between 5 to 10% throughout the research,
however this does not drastically affect the fuel cycle as a whole. The reason for this is
that no matter the initial enrichment, the feed fuel will vary the overall enrichment.
Although current limitations restrict commercial reactors from operating with high-
enriched fuel (>20%) it was felt that these reactors should operate with as low enrichment
as possible (lower enrichments lead to less proliferation concerns and cost of fuel
production). The only reactivity restriction on the fuel is based on the reflector size, for a
given reflector size there is a minimum enrichment below which the reactor will not be
critical. Therefore ideally the fuel enrichment should be as low as manageable to not
only keep costs down, but to be proliferation resistant, and to reside within the bounds of
current legislation.
Iterative Optimization of Feed Fuel Enrichment
Unfortunately the optimization of the feed fuel is an iterative process and can only
be done by evaluating the change in criticality and actinide inventory of the previous
execution. This is to say that an initial guess must be made of the feed fuel amount per
step, and then after evaluating the results of that step another input must be determined
using the output from that step. This is the drawback in using the Monteburns code
package, because each step may take a large amount of CPU time, and if the change in
feed fuel does not reach the desired results, the problem must be executed again,
requiring more CPU time, until acceptable results are achieved.
31
When optimizing the feed fuel, a few restrictions must be in place on the design
specifications and the output, these are:
• Reactor must remain critical at all step points (it should actually be supercritical at the start of every step to account for burnup between steps). Keff for the core should remain between 1.0 and 1.05, with an error less than 1%.
• The U235 enrichment should not significantly change throughout the life of the
core, and should preferably remain as low as possible.
• The pressure of the core should not rise above current mechanical limits (these are assumed to be around 175 bar, ideally however, the pressure will remain below 140 bar).
• All fission products are assumed to be removable throughout the life of the
core. Using these initial guidelines for optimization the iterative process can then begin with
the goal of limiting actinide inventory. It should be noted however that Monteburns
allows the fuel to be input in either a specified amount of grams per day, or a specified
amount in discrete step points. Because this reactor is being operated for 10 years the
method chosen was in grams per day, as to do it in step points every two weeks would
require too much CPU time. Also of note is that the MCNP mockup of the core does not
include the backend cycle, and assumes all fuel in the reactor is residing in the core at all
times, this is obviously not the case, and in practice the reactor would require slightly
more fuel in it during operation. The fact that in practice the core would require slightly
more fuel does not affect the results of this research as the burnup would not significantly
change, as the reactor would not require a large amount of fuel to be added to compensate
for the fuel in the backend of the cycle. The backend of the cycle itself only requires a
small mass inventory and thus is considered negligible for the purposes of scoping
calculations.
32
Important Actinide Inventory
Once a reactor design has been simulated for 10 years while maintaining criticality
and operating within all the limits placed upon it by this research the actinide inventory is
then evaluated and compared to other GCR designs and a reference LWR design.
However a decision must be made as to which actinide s are considered “important”. It is
important to limit overall actinide inventory however certain actinides pose a higher
threat to the environment than others. The actinide inventories were evaluated according
in four different categories, total actinide inventory, and actinides with over 100, 1000,
and 10000 year half-lives. The short-lived actinides can be contained while they decay
naturally without posing a threat to the environment. It is the actinides with long half
lives that pose a threat to long term containment, which is a problem the nuclear industry
is currently facing (storing waste for up to 10,000 years). If the long-lived actinides can
be reduced, then much less storage space is required for nuclear waste, as the short half
live actinides can be stored on-site or in a remote location, but do not require the long-
term storage of a facility like Yucca Mountain. Another criteria on which actinides are
evaluated is their usefulness, certain actinides can be reused for other purposes, research
or commercially, while others may pose a proliferation threat. Based on those criteria
each cores final actinide inventory will be evaluated and discussed.
This basis for this research is to determine a general idea of how efficient a GCR
can be in the area of actinide inventory, therefore the main concerns of the research is
limiting overall actinides. The main criteria in evaluating the actinide inventory is
therefore overall mass, while the secondary evaluations are based on mass for specific
half-life intervals. A tertiary concern, and one on which the research does not adjust to
correct, is the usefulness and safety concerns of the actinides. The next chapter will
33
discuss the three GCR designs chosen and their relative performance compared to a
reference LWR design.
Reference LWR Design
A reference LWR design is used to evaluate the performance of the GCR designs,
as the LWR is the only currently operating power reactor. The LWR design features
10.2 g/cc fuel density comprised of UO2 with 100 MTU operating at 1000ºF. The
cladding is zircaloy, and the moderator is light water, with an operational temperature of
588ºF. The radii for the fuel, gap, clad, and moderator are 0.4096 in, 0.4178 in,
0.4750 in, and 0.7094 in respectively. The code used to simulate the fuel cycle was
CASMO3. The core was simulated for a burnup of 35 MWD, producing the same total
thermal power as the GCR designs studied in this research. Because the goal of the
research is to compare how equal power designs (GCR and LWR) compare, electrical
efficiency must be taken into account. The electrical efficiency assumed for the LWR is
30%, while the GCR design uses 60% for its efficiency. Because the LWR operates at
half the electrical efficiency it must produce twice the total thermal power and therefore
the LWR design would require two operating reactors to produce an equivalent power.
The actinide inventory of the LWR is therefore doubled to take into account the electrical
efficiency.
CHAPTER 5 CORE COMPARISONS
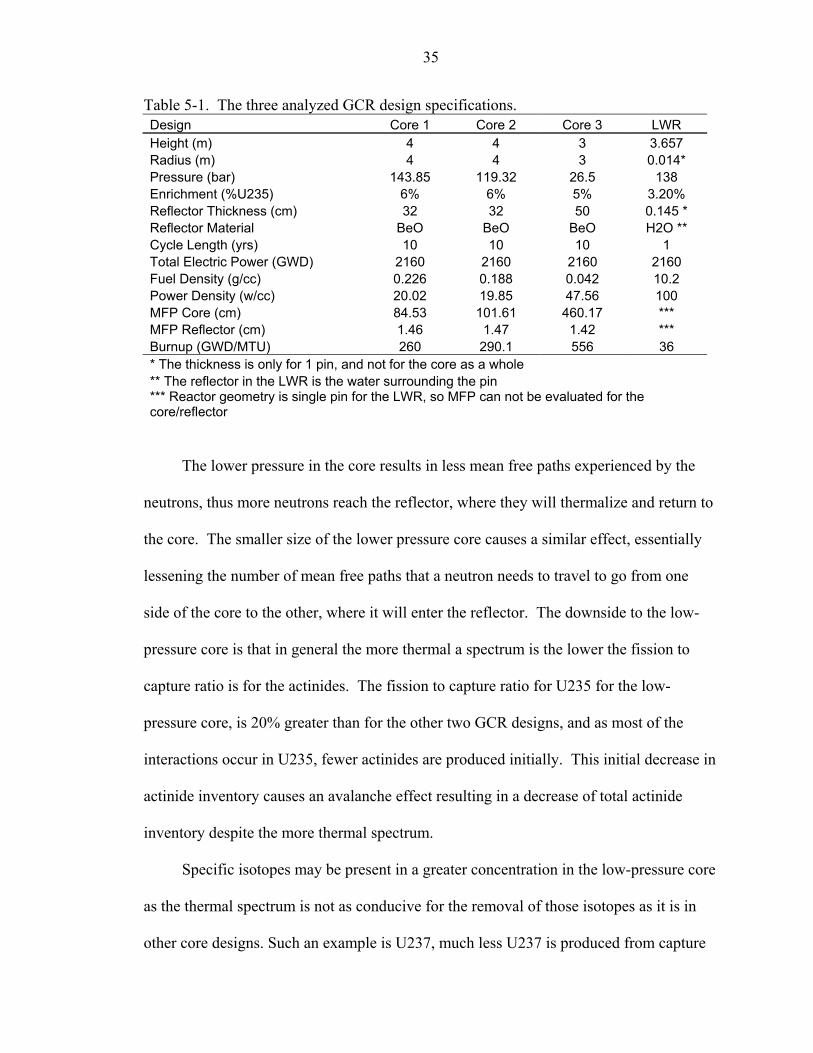
The actinide inventories for the different cores will be evaluated in this chapter
according to the guidelines specified in chapter 4. The list of cores evaluated in this
chapter is shown in Table 5-1. As shown in Table 5-2, the optimal design is the lower
pressure core, which features both the lowest total actinide inventory, as well as lowest
inventory of isotopes with long half-lives. The reference LWR core output file does not
show inventories for some of the listed isotopes, therefore making it appear to have a
lower inventory then an actual LWR core design. Both cores produce approximately the
same thermal power (3600 GWD) during operation. The table takes into account
electrical efficiencies of 30% for the LWR and 60% for the GCR.
The important actinides are considered to be those with half-lives of greater than
100 years, because these represent the largest concern for the issue of waste storage. The
shorter-lived actinides will decay naturally, and do not present problems for long-term
storage. The low-pressure core has significantly lower amounts of important actinides at
the end of core life when compared to the other gas core designs and the reference LWR.
Two factors are important when calculating actinide production and depletion, overall
cross section and fission to capture ratio. These two parameters vary as a direct function
of neutron energy [8]. When comparing the gas core designs, the spectrum is the most
important criteria for determining actinide inventory. The lower pressure core is the most
thermal, as the reflector is largest in this design, forcing more neutrons to thermalize and
return to the core from the reflector.
34
35
Table 5-1. The three analyzed GCR design specifications. Design Core 1 Core 2 Core 3 LWR Height (m) 4 4 3 3.657 Radius (m) 4 4 3 0.014* Pressure (bar) 143.85 119.32 26.5 138 Enrichment (%U235) 6% 6% 5% 3.20% Reflector Thickness (cm) 32 32 50 0.145 * Reflector Material BeO BeO BeO H2O ** Cycle Length (yrs) 10 10 10 1 Total Electric Power (GWD) 2160 2160 2160 2160 Fuel Density (g/cc) 0.226 0.188 0.042 10.2 Power Density (w/cc) 20.02 19.85 47.56 100 MFP Core (cm) 84.53 101.61 460.17 *** MFP Reflector (cm) 1.46 1.47 1.42 *** Burnup (GWD/MTU) 260 290.1 556 36 * The thickness is only for 1 pin, and not for the core as a whole ** The reflector in the LWR is the water surrounding the pin *** Reactor geometry is single pin for the LWR, so MFP can not be evaluated for the core/reflector
The lower pressure in the core results in less mean free paths experienced by the
neutrons, thus more neutrons reach the reflector, where they will thermalize and return to
the core. The smaller size of the lower pressure core causes a similar effect, essentially
lessening the number of mean free paths that a neutron needs to travel to go from one
side of the core to the other, where it will enter the reflector. The downside to the low-
pressure core is that in general the more thermal a spectrum is the lower the fission to
capture ratio is for the actinides. The fission to capture ratio for U235 for the low-
pressure core, is 20% greater than for the other two GCR designs, and as most of the
interactions occur in U235, fewer actinides are produced initially. This initial decrease in
actinide inventory causes an avalanche effect resulting in a decrease of total actinide
inventory despite the more thermal spectrum.
Specific isotopes may be present in a greater concentration in the low-pressure core
as the thermal spectrum is not as conducive for the removal of those isotopes as it is in
other core designs. Such an example is U237, much less U237 is produced from capture
36
in the low-pressure core however the cross-section ratios (fission to capture) are higher in
the harder spectrum cores, and thus remove much more than the low pressure core does.
The net effect is to see a higher concentration of U237 in the low-pressure core. A
similar effect occurs in the low-pressure core as well for Cm246, Cm247, and Cm248.
For those three isotopes, the fission to capture ratio for the high-pressure cores is much
higher compared to the more thermal low-pressure core, this increase in fission to capture
ratio causes more of those actinides to be fissioned in the high-pressure core, whereas in
the low-pressure the dominant effect is the transmutation of those isotopes into heavier
actinides.
During the initial design of the GCR for this research it was assumed that the
optimum design would also contain the highest conversion ratio (fissile material
produced compared to fissile material depleted). The logic behind this is that if the core is
producing and then burning more plutonium, the same effect should be seen on the higher
actinides. Moreover at higher energies the fission to capture for most actinides favors
fission, however, it was shown that this is not the determining factor for actinide
inventory. In this study the low-pressure core produces 50% of the total actinides
compared to the high-pressure core. The cores were then modified to try and obtain a
very thermal spectrum, as the high-pressure core’s spectrum was optimal for minimizing
actinide inventory.
As shown the reference LWR design fares poorly when comparing it to the GCR
designs. Although some of the isotopes are not listed in the output (certain isotopes are
not explicitly listed in the output however their aggregate mass is included), the core still
possesses a higher actinide concentration at the end of life. The LWR design has an
37
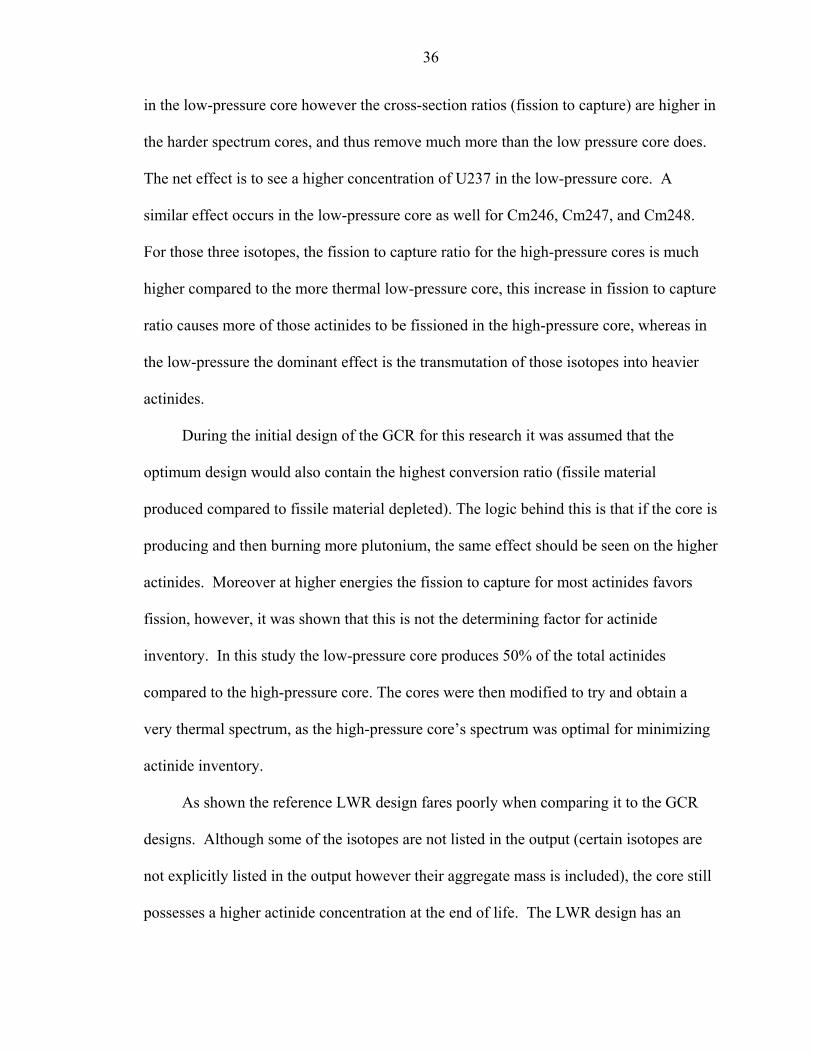
increase in total actinide inventory of 342% over the worst of the GCR designs. When
comparing to the optimum GCR design the actinide inventory of the LWR is 703% of the
GCR’s (This does not include unspent fuel, the inclusion of the unspent uranium
increases the factor from 704% to almost 9,800%).
Table 5-2. Core isotopic abundance in Kg. Isotope Core 1 (Kg) Core 2 (Kg) Core 3 (Kg) LWR (Kg) U234 1.4 1.32 0.25 28.43 U236 518 510 367 818.24 U237 0.51 0.56 0.94 *
Np237 39.5 36.1 14.7 102.2 Pu238 43.9 43.2 19.8 38.95 Pu239 130 95.9 9.57 1339.59 Pu240 120 95 13.3 514.91 Pu241 46.2 37.5 5.08 336.78 Pu242 41.8 39.7 19.2 108.7 Am241 1.67 1.13 0.03 9.11 Am242 1.81E-01 1.02E-01 6.62E-04 0.14 Am243 3.18 3.32 1.65 24.8 Cm242 0.68 0.58 0.09 3.96 Cm243 4.22E-02 3.63E-02 4.39E-03 * Cm244 21.6 24.2 17.8 7.47 Cm245 3.13 3.08 1.15 * Cm246 1.11 1.45 3.07 * Cm247 0.08 0.11 0.19 * Cm248 0.02 0.04 0.32 *
T1/2 > 100a 860.07 787.25 430.43 2946.12 T1/2 >1000a 858.4 786.12 430.41 2937.01 T1/2 >1E4a 730.8 683.17 411.24 2397.16 Total 973 893.32 474.14 3333.29
*Not explicitly given in Casmo output. The T1/2 designator represents total actinides with half life greater than that listed.
The cause for the increase in actinide inventory is because the fuel in the LWR
does not experience the same burnup that the GCR fuel does. The burnup required for
the same total power output in the LWR is 35 GWD/MTU, compared to a burnup of
560 GWD/MTU for the gas core reactor (design 3), over an order of magnitude lower.

38
Essentially this means that the fuel in the LWR does not remain in the core long enough
to burn the actinides that are being produced. Typical LWR fuel will remain in the core
until a burnup of around 40 MWD/KgU, which means conventional LWR’s are getting
an order of magnitude less power from the same amount of fuel used in a GCR. This
translates to excess waste being produced by LWR’s from unspent fuel. It should be
noted that the maximum possible power for uranium (assuming 200 MeV per fission) is
about 950 MWD/kgU, the GCR design is operating at 59% of that upper limit, whereas
the LWR is operating typically at around 4.2% of that limit.
Actinide Inventory Comparison
The GCR’s ability to preferentially produce or burn, actinides is also shown in Table
5-2. The Pu238 inventory for the high-pressure (harder spectrum) design is 2.22 times
that of the low-pressure more thermal spectrum core. The Pu240 inventory for the high-
pressure core is 9.02 times that of the low-pressure core and Am242 is increased by a
factor of 273.4 when going from low to high pressure. This gives GCRs the ability to
preferentially produce particular isotopes that could then be potentially used for other
research or space power as is the case for Pu238. The ability also allows the GCR to
preferentially burn dangerous actinides, thus making it proliferation resistant. The ratios
of Pu238, Pu240, and Pu242, to overall plutonium inventory determine how proliferation
resistant a core will be, as those isotopes are difficult to separate from the useful isotopes
of plutonium. Those three isotopes have very low fission cross-sections, and when
present in high concentrations make weapon production unfeasible. The ratios for those
plutonium isotopes to the overall plutonium inventories are 53.9%, 57.1%, and 78.1% for
the high, intermediate, and low-pressure cores respectively (meaning the best GCR
design possesses 21.9% usable plutonium for weapons purposes). The LWR design has a
39
ratio of only 28.3%, which makes it much more dangerous from a proliferation safety
standpoint. The other inherent proliferation resistant feature the GCR possesses is the
fuel is gaseous, and the mass inventory is very low. A typical LWR will contain up to
100 MTU in the core at any given time, whereas the GCR contains between 600 and
4000 kilograms at any given time, depending on which core design as well as how far
into core life the inventory is measured. Through the 10 year cycle studied the low-
pressure core only contained a maximum of 6.51 MTU (time integrated). The mass of
plutonium in a typical LWR is around 2300 Kg, 71.7% of which is useful in weapons
productions, whereas the low-pressure GCR design only contains 67.0 kg, only 21.9% of
which is useful in weapons productions. It should also be noted that other weapons grade
materials such as Am242 can be preferentially depleted by slightly changing the
spectrum. As shown in Table 5-2 the high-pressure core has over a two order of
magnitude increase in the amount of Am242 at the end of core life. A probable reason
for this phenomenon is a large decrease in the absorption cross-section in the epithermal
range, so when the spectrum is hardened in the high-pressure core, the cross section
decreases by approximately two orders of magnitude.
Evaluation of Integrated Cycle Performance
To demonstrate the effects of the GCR’s continuous fuel feeding ability, two
designs were analyzed to compare actinide buildup. The first case is the standard core
used in this research, where the fuel is allowed to burn continuously to the end of core
life (feeding fuel online as the reactor operates), and the second is burning the fuel for
one year, and then replacing it with fresh fuel (similar to a LWR).
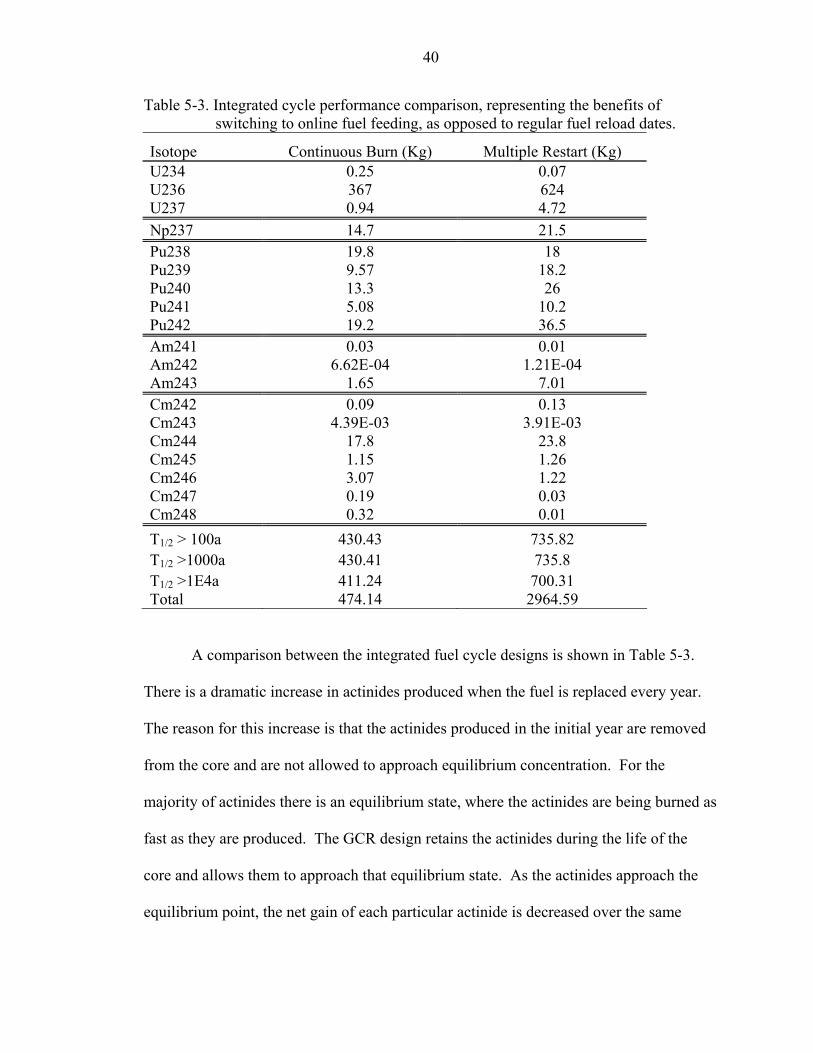
40
Table 5-3. Integrated cycle performance comparison, representing the benefits of switching to online fuel feeding, as opposed to regular fuel reload dates.
Isotope Continuous Burn (Kg) Multiple Restart (Kg) U234 0.25 0.07 U236 367 624 U237 0.94 4.72 Np237 14.7 21.5 Pu238 19.8 18 Pu239 9.57 18.2 Pu240 13.3 26 Pu241 5.08 10.2 Pu242 19.2 36.5 Am241 0.03 0.01 Am242 6.62E-04 1.21E-04 Am243 1.65 7.01 Cm242 0.09 0.13 Cm243 4.39E-03 3.91E-03 Cm244 17.8 23.8 Cm245 1.15 1.26 Cm246 3.07 1.22 Cm247 0.19 0.03 Cm248 0.32 0.01 T1/2 > 100a 430.43 735.82 T1/2 >1000a 430.41 735.8 T1/2 >1E4a 411.24 700.31 Total 474.14 2964.59
A comparison between the integrated fuel cycle designs is shown in Table 5-3.
There is a dramatic increase in actinides produced when the fuel is replaced every year.
The reason for this increase is that the actinides produced in the initial year are removed
from the core and are not allowed to approach equilibrium concentration. For the
majority of actinides there is an equilibrium state, where the actinides are being burned as
fast as they are produced. The GCR design retains the actinides during the life of the
core and allows them to approach that equilibrium state. As the actinides approach the
equilibrium point, the net gain of each particular actinide is decreased over the same
41
change in time, as the ratio of actinide production to depletion approaches unity. Heavier
actinides are produced in greater quantities in the continuous burn design, as opposed to
the multiple burns, because in a multiple burn scenario actinides are removed before they
are able to transmute in significant quantities. Although the continuous burn design
produces more curium than a multiple burn scenario, the overall actinide production
(total as well as those with long half-lives) is lower for a continuous burn design,
meaning it is more effective at limiting overall actinide (as well as dangerous actinide)
production.
The effects of the integrated fuel cycle on actinide production can also be seen in figures
5-1 through 5-6, which show the actinide buildup as a function of time for both the major
and minor actinides. In the high and intermediate-pressure cores Pu239, Pu240, and
Pu241 approach the equilibrium concentration, whereas in the low-pressure core Pu241
and Am243 are approaching their equilibrium point. The reason for the difference in
actinides approaching their equilibrium point is the changes in spectrum between the core
designs. The harder spectrum core will burn plutonium compared to uranium faster than
the more thermal design, thus the trend for those isotopes to “peak out” in the
intermediate and high-pressure cores. In the low-pressure core the higher actinides
(americium and curium) are shown to approach equilibrium, except for Cm246 and
Cm248, because of the nature of the cross-sections in the epithermal regime. The higher-
pressure cores see an increase in actinides such as Am242 because there is a large drop in
the interaction cross section as the spectrum becomes hardens for those actinides
therefore actinides like Am242 are produced at a high rate, while maintaining a very low
depletion rate.
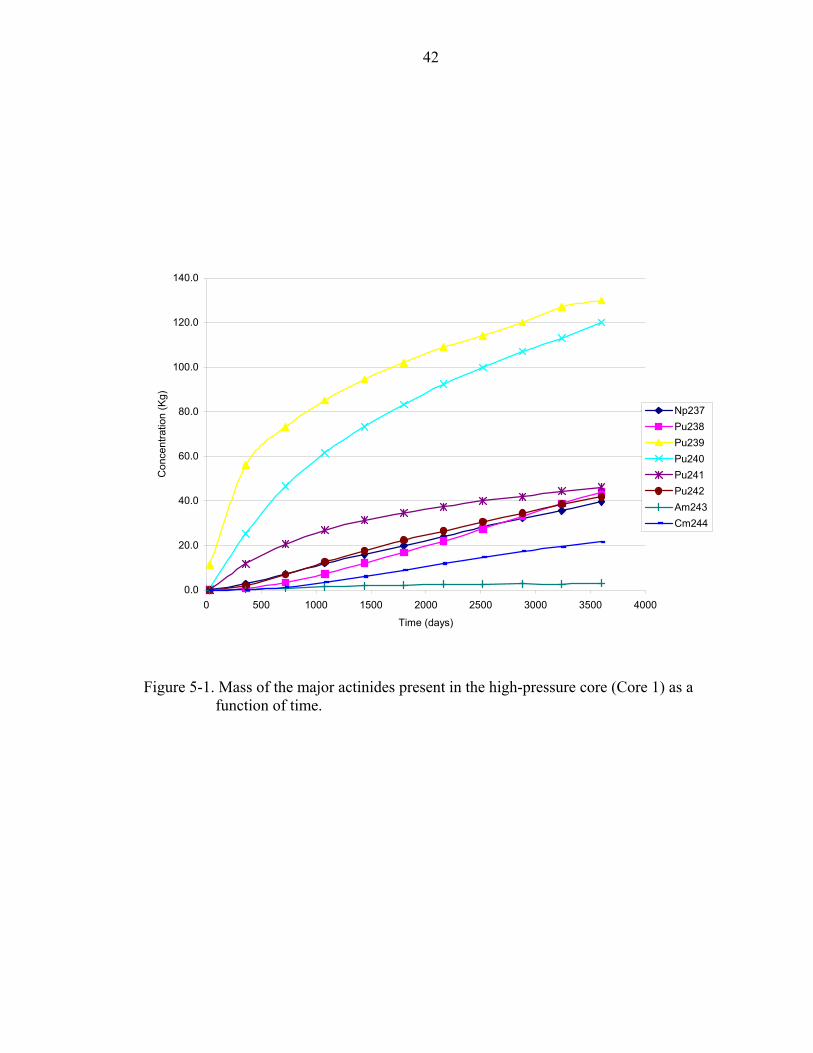
42
0.0
20.0
40.0
60.0
80.0
100.0
120.0
140.0
0 500 1000 1500 2000 2500 3000 3500 4000
Time (days)
Con
cent
ratio
n (K
g)
Np237Pu238Pu239Pu240Pu241Pu242Am243Cm244
Figure 5-1. Mass of the major actinides present in the high-pressure core (Core 1) as a function of time.
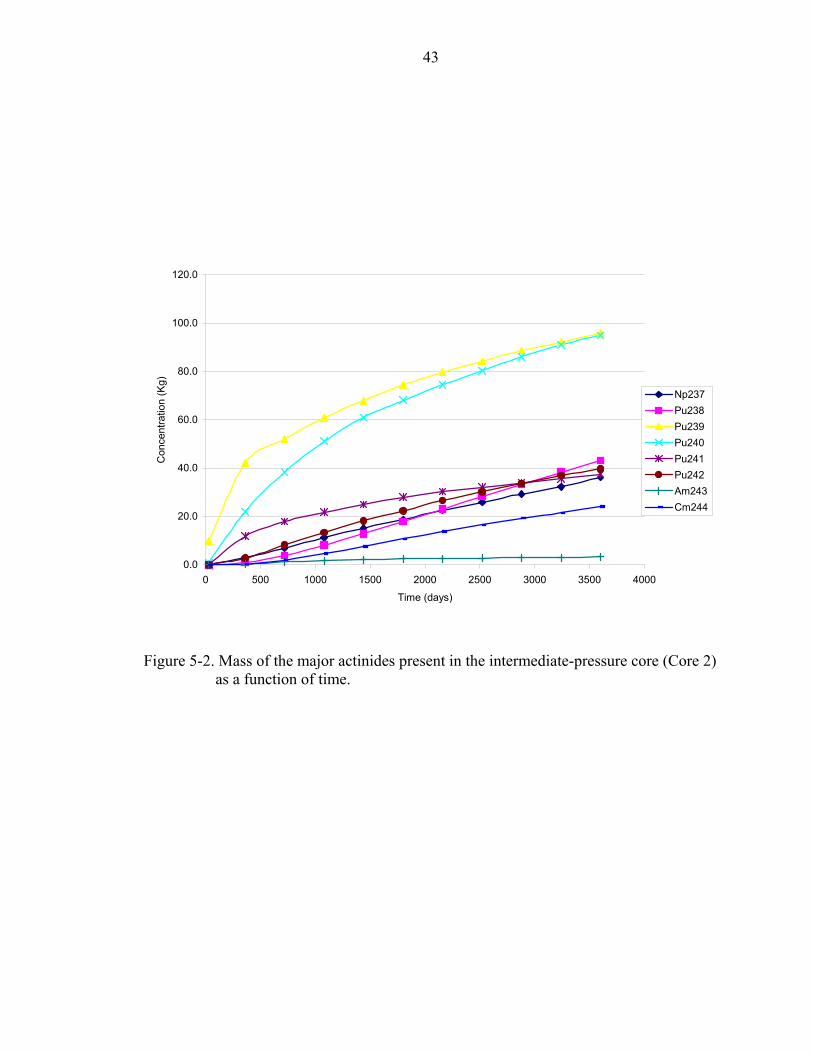
43
0.0
20.0
40.0
60.0
80.0
100.0
120.0
0 500 1000 1500 2000 2500 3000 3500 4000
Time (days)
Con
cent
ratio
n (K
g)
Np237Pu238Pu239Pu240Pu241Pu242Am243Cm244
Figure 5-2. Mass of the major actinides present in the intermediate-pressure core (Core 2) as a function of time.
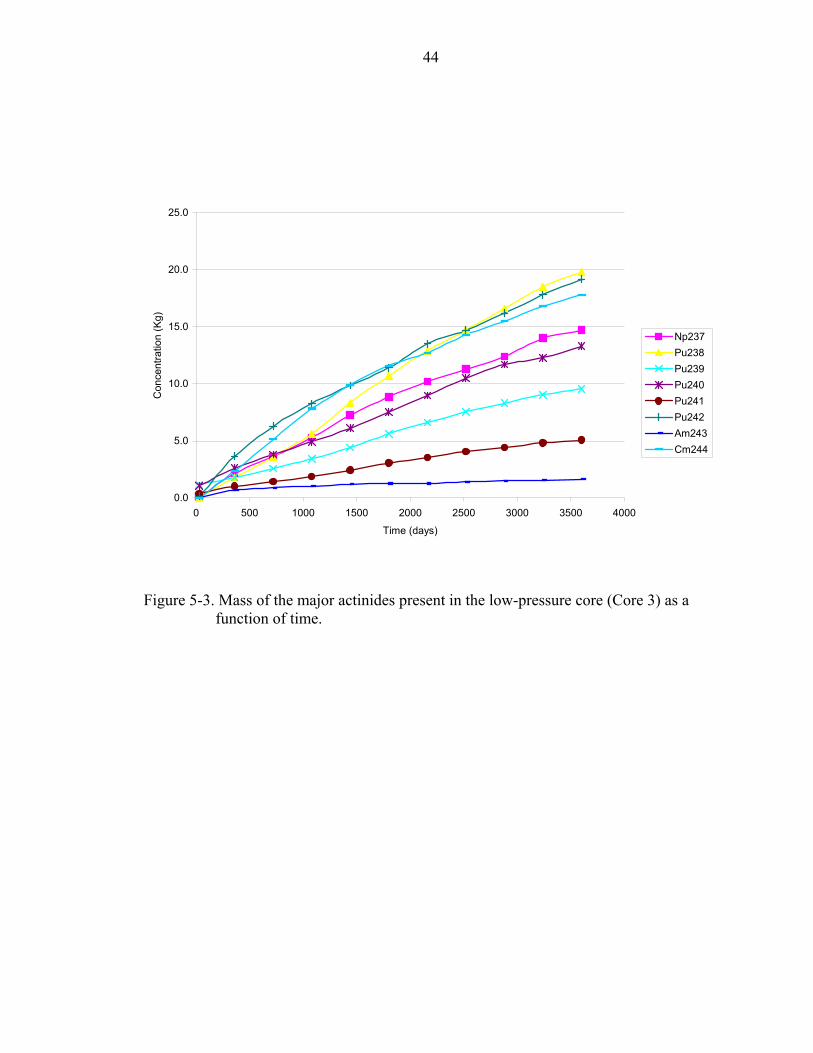
44
0.0
5.0
10.0
15.0
20.0
25.0
0 500 1000 1500 2000 2500 3000 3500 4000
Time (days)
Con
cent
ratio
n (K
g)
Np237Pu238Pu239Pu240Pu241Pu242Am243Cm244
Figure 5-3. Mass of the major actinides present in the low-pressure core (Core 3) as a function of time.
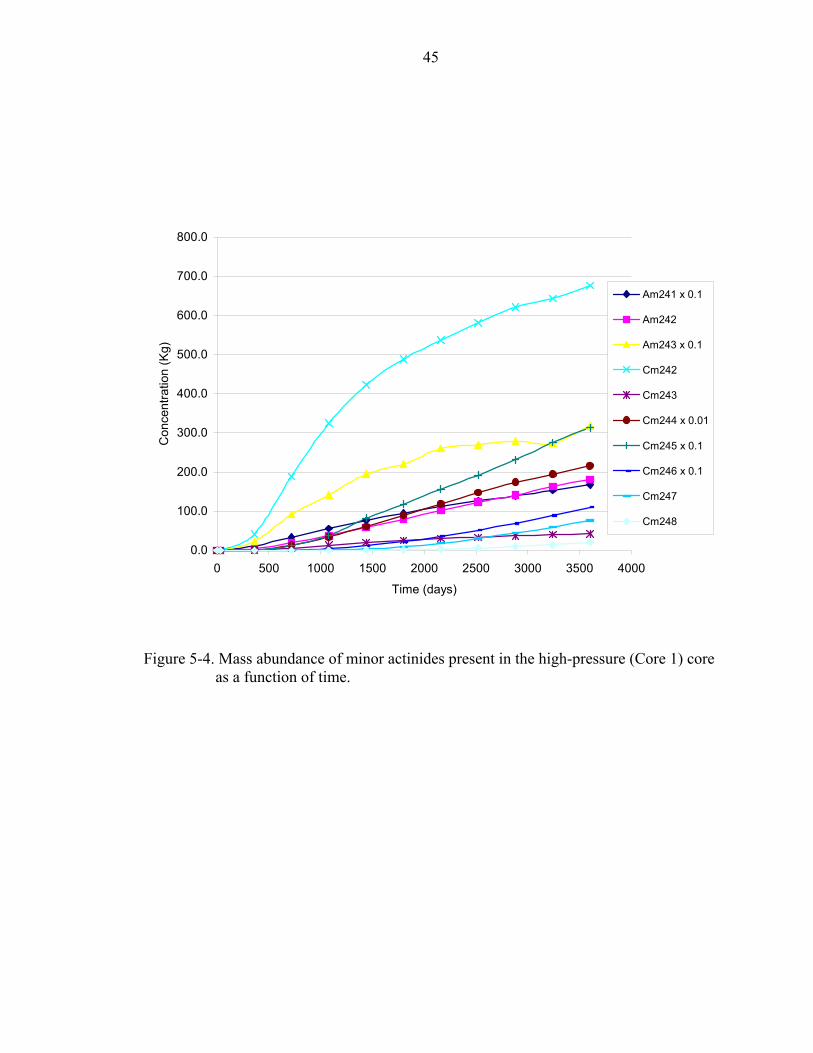
45
0.0
100.0
200.0
300.0
400.0
500.0
600.0
700.0
800.0
0 500 1000 1500 2000 2500 3000 3500 4000
Time (days)
Con
cent
ratio
n (K
g)
Am241 x 0.1
Am242
Am243 x 0.1
Cm242
Cm243
Cm244 x 0.01
Cm245 x 0.1
Cm246 x 0.1
Cm247
Cm248
Figure 5-4. Mass abundance of minor actinides present in the high-pressure (Core 1) core
as a function of time.
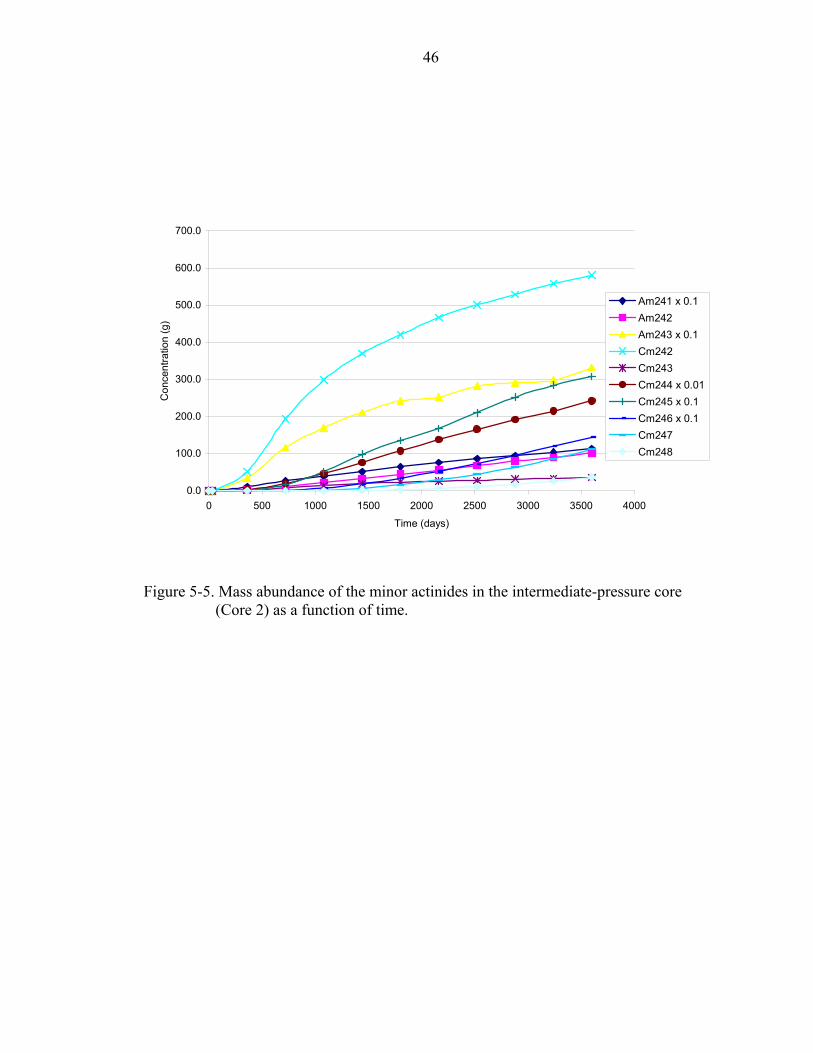
46
0.0
100.0
200.0
300.0
400.0
500.0
600.0
700.0
0 500 1000 1500 2000 2500 3000 3500 4000
Time (days)
Con
cent
ratio
n (g
)
Am241 x 0.1Am242Am243 x 0.1Cm242Cm243Cm244 x 0.01Cm245 x 0.1Cm246 x 0.1Cm247Cm248
Figure 5-5. Mass abundance of the minor actinides in the intermediate-pressure core (Core 2) as a function of time.
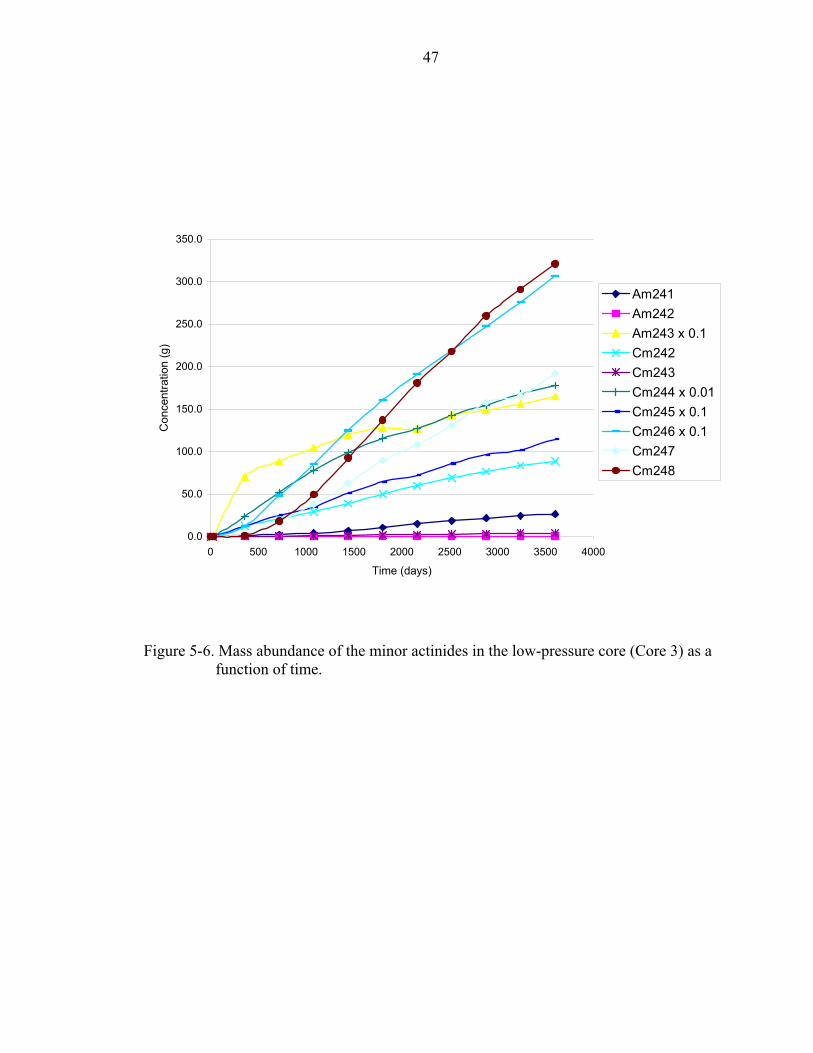
47
0.0
50.0
100.0
150.0
200.0
250.0
300.0
350.0
0 500 1000 1500 2000 2500 3000 3500 4000
Time (days)
Con
cent
ratio
n (g
)
Am241Am242Am243 x 0.1Cm242Cm243Cm244 x 0.01Cm245 x 0.1Cm246 x 0.1Cm247Cm248
Figure 5-6. Mass abundance of the minor actinides in the low-pressure core (Core 3) as a function of time.
48
Flux Calculations
The second part of the core evaluation is demonstrating a difference in the spectrum
for the GCRs, and to evaluate this effect on the overall actinide inventory. The limitation
for this part of the research is that the spectrum can only be analyzed at specific state-
points, and therefore only represents accurately the spectrum at a given time and material
composition. However this is assumed to be acceptable because each core is compared at
the same time (in terms of days as well as energy). The comparisons are also only made
in between GCRs, so using state-points to describe the flux is acceptable as the relative
values at state-points can give insight as to the effects on actinide production through
changes in average neutron energy.
The code package MCNP was also used to determine flux values for the core and
reflector for the design cases. The flux was separated into 648 groups, covering the total
energy spectrum. The group structure was chosen by evaluating the ACE files containing
the MCNP library cross section values, and determining an appropriate number of points
per energy decade. The points per decade were scaled according to the ACE file format
for the Be library, however the lower and upper energy bins were kept unchanged (i.e. for
energies less than 1E-08 MeV, the bin structure was kept constant as there were few bins
in the original ACE file). The flux in the thermal region is fairly smooth and does not
require a large number of points to describe the shape, while the flux in the resonance
region is rapidly changing and requires more grid points to accurately show the flux. The
reason for shrinking the number of energy grid points is to decrease CPU time required to
obtain results with sufficient accuracy and precision. Flux calculations were done for the
core (the core was separated into five cells to evaluate the spatial flux) and the reflector
using a cell flux tally in MCNP (f4:n tally) to obtain a cell averaged flux. Fluxes were
49
then used to calculate average energies for the cores. Average neutron energy was
calculated by weighting the flux with the energy for energies under 4 eV. The cutoff of
4ev was chosen based on thermal scattering for the operational temperature. The average
neutron energy for the high-pressure core is 0.49 eV, while the average neutron energy
for the low-pressure core is 0.293 eV. The disparity in energies shows the ease of which
the GCR can manipulate the neutron spectrum.
As shown in Figure 5-7 the low-pressure core exhibits a more thermal spectrum,
which of course has a lower fission to capture ratio for the actinides. However, U235 had
a higher fission to capture ratio for this spectrum compared to the harder neutron
spectrum core, thus causing less actinides to be produced from uranium. Once actinides
are produced, a harder spectrum is favorable to deplete them, however as shown in Table
5-2, the lower pressure core has a lower actinide inventory. The reason is the initial lack
of production in actinides from the uranium. Although the high-pressure core is better at
depleting actinides, the low-pressure core produces less, which appears to be the
dominant factor shown by this research.
The flux plots for the reflector region are similar, however the low-pressure core
again exhibits a more thermal spectrum as shown in Figure 5-8. The more thermal
spectrum results in less leakage from the reflector, thus lowering radiation damage to any
containment vessels and the surrounding environment. As the reactor will be remotely
operated this decrease in leakage will not drastically affect worker shielding (they will be
sealed off from the reactor so that almost no dose will reach them, regardless of leakage).
The spatial fluxes in the high and low-pressure cores are shown in Figure 5-9. and
Figure 5-10. respectively. . The core is broken up into 4 cells each with a different
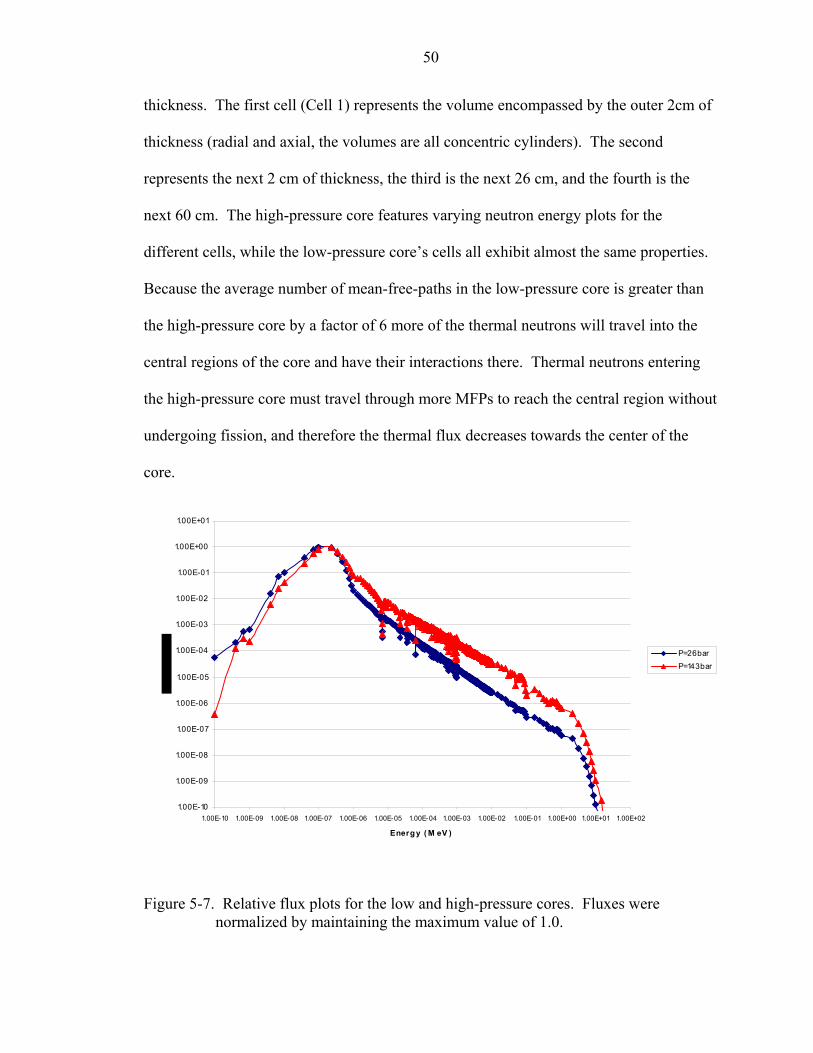
50
thickness. The first cell (Cell 1) represents the volume encompassed by the outer 2cm of
thickness (radial and axial, the volumes are all concentric cylinders). The second
represents the next 2 cm of thickness, the third is the next 26 cm, and the fourth is the
next 60 cm. The high-pressure core features varying neutron energy plots for the
different cells, while the low-pressure core’s cells all exhibit almost the same properties.
Because the average number of mean-free-paths in the low-pressure core is greater than
the high-pressure core by a factor of 6 more of the thermal neutrons will travel into the
central regions of the core and have their interactions there. Thermal neutrons entering
the high-pressure core must travel through more MFPs to reach the central region without
undergoing fission, and therefore the thermal flux decreases towards the center of the
core.
1.00E-10
1.00E-09
1.00E-08
1.00E-07
1.00E-06
1.00E-05
1.00E-04
1.00E-03
1.00E-02
1.00E-01
1.00E+00
1.00E+01
1.00E-10 1.00E-09 1.00E-08 1.00E-07 1.00E-06 1.00E-05 1.00E-04 1.00E-03 1.00E-02 1.00E-01 1.00E+00 1.00E+01 1.00E+02
Energ y ( M eV )
P=26barP=143bar
Figure 5-7. Relative flux plots for the low and high-pressure cores. Fluxes were normalized by maintaining the maximum value of 1.0.
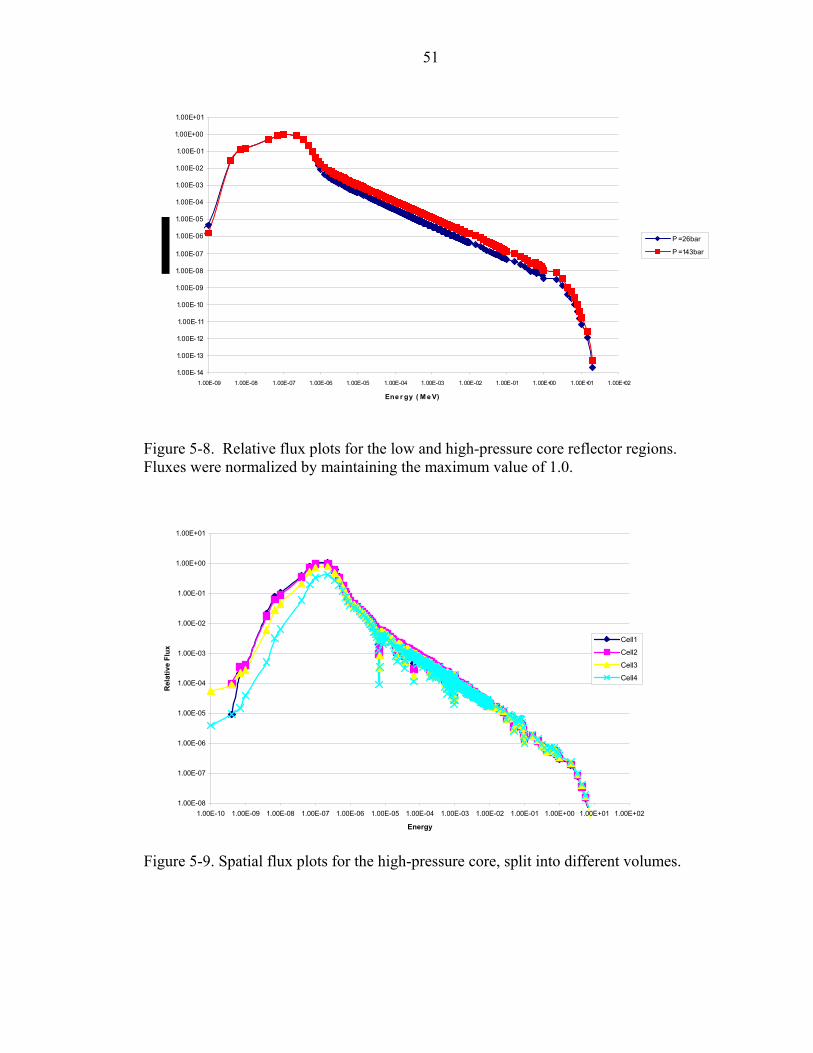
51
1.00E-14
1.00E-13
1.00E-12
1.00E-11
1.00E-10
1.00E-09
1.00E-08
1.00E-07
1.00E-06
1.00E-05
1.00E-04
1.00E-03
1.00E-02
1.00E-01
1.00E+00
1.00E+01
1.00E-09 1.00E-08 1.00E-07 1.00E-06 1.00E-05 1.00E-04 1.00E-03 1.00E-02 1.00E-01 1.00E+00 1.00E+01 1.00E+02
Ene r gy ( M e V)
P = 26bar
P = 143bar
Figure 5-8. Relative flux plots for the low and high-pressure core reflector regions. Fluxes were normalized by maintaining the maximum value of 1.0.
1.00E-08
1.00E-07
1.00E-06
1.00E-05
1.00E-04
1.00E-03
1.00E-02
1.00E-01
1.00E+00
1.00E+01
1.00E-10 1.00E-09 1.00E-08 1.00E-07 1.00E-06 1.00E-05 1.00E-04 1.00E-03 1.00E-02 1.00E-01 1.00E+00 1.00E+01 1.00E+02
Energy
Rel
ativ
e Fl
ux
Cell1
Cell2
Cell3
Cell4
Figure 5-9. Spatial flux plots for the high-pressure core, split into different volumes.
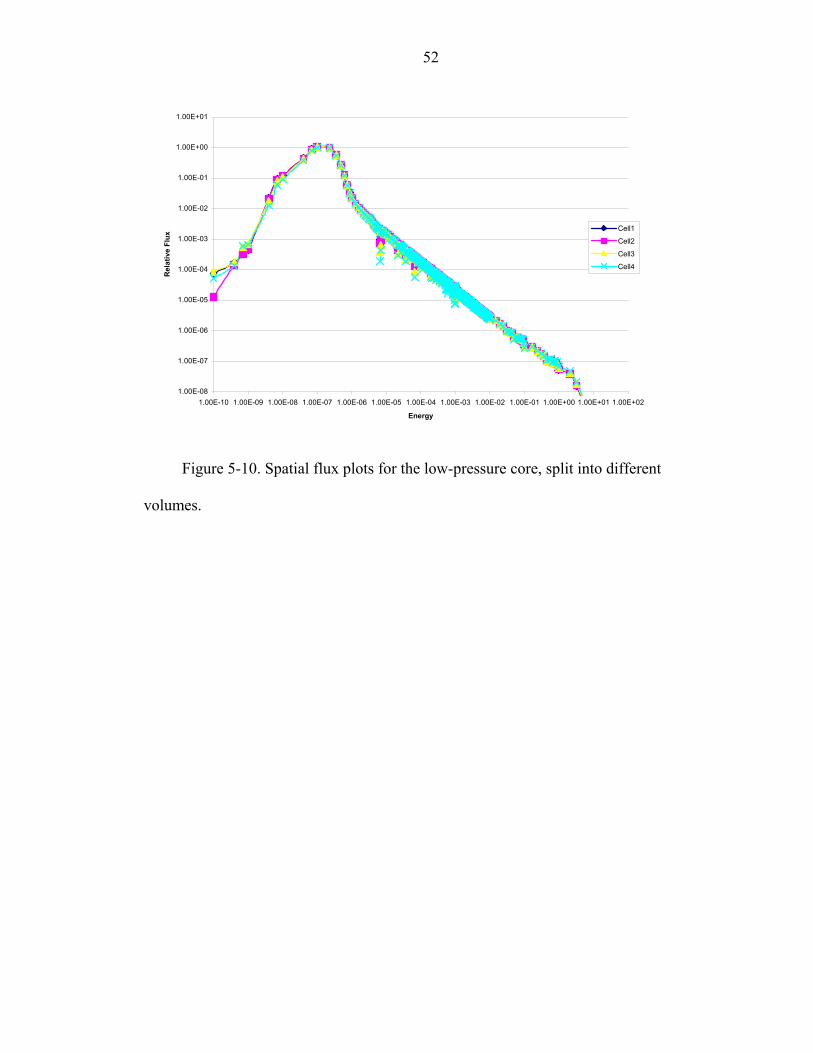
52
1.00E-08
1.00E-07
1.00E-06
1.00E-05
1.00E-04
1.00E-03
1.00E-02
1.00E-01
1.00E+00
1.00E+01
1.00E-10 1.00E-09 1.00E-08 1.00E-07 1.00E-06 1.00E-05 1.00E-04 1.00E-03 1.00E-02 1.00E-01 1.00E+00 1.00E+01 1.00E+02
Energy
Rel
ativ
e Fl
ux
Cell1
Cell2
Cell3
Cell4
Figure 5-10. Spatial flux plots for the low-pressure core, split into different
volumes.
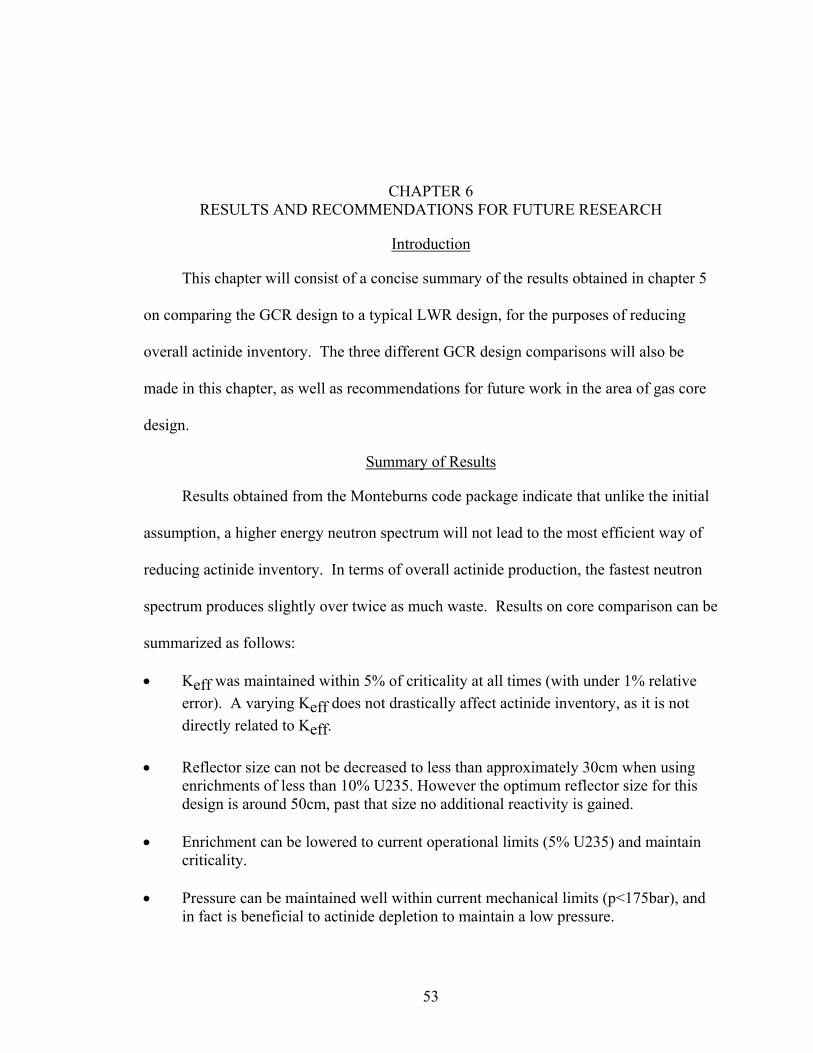
CHAPTER 6 RESULTS AND RECOMMENDATIONS FOR FUTURE RESEARCH
Introduction
This chapter will consist of a concise summary of the results obtained in chapter 5
on comparing the GCR design to a typical LWR design, for the purposes of reducing
overall actinide inventory. The three different GCR design comparisons will also be
made in this chapter, as well as recommendations for future work in the area of gas core
design.
Summary of Results
Results obtained from the Monteburns code package indicate that unlike the initial
assumption, a higher energy neutron spectrum will not lead to the most efficient way of
reducing actinide inventory. In terms of overall actinide production, the fastest neutron
spectrum produces slightly over twice as much waste. Results on core comparison can be
summarized as follows:
• Keff was maintained within 5% of criticality at all times (with under 1% relative error). A varying Keff does not drastically affect actinide inventory, as it is not directly related to Keff.
• Reflector size can not be decreased to less than approximately 30cm when using
enrichments of less than 10% U235. However the optimum reflector size for this design is around 50cm, past that size no additional reactivity is gained.
• Enrichment can be lowered to current operational limits (5% U235) and maintain
criticality. • Pressure can be maintained well within current mechanical limits (p<175bar), and
in fact is beneficial to actinide depletion to maintain a low pressure.
53

54
• Core size can be kept within current mechanical limitations, and in fact is beneficial to use a smaller core.
• The optimum spectrum for limiting actinide inventory is a more thermal spectrum,
resulting in half the waste produced compared to a faster neutron spectrum core. • Overall fuel inventory (inclusion of all actinides and fuel) is approximately 98
times greater in an LWR than a similar total power GCR (total electrical power produced). Accordingly almost 2 orders of magnitude less waste is produced by the GCR.
• Compared to LWRs the GCR design limits actinide production by a factor of 7.03. • Weapons grade plutonium in the GCR design is only 28.3% by atom of total
plutonium inventory, compared to 78.1% by atom of an LWR design. • Fuel efficiency is approximately 15 times greater in a GCR than in an LWR based
on burnup attainable. Burnup in a LWR is approximately 40GWD/MTU, whereas the GCR can surpass 600GWD/MTU (4% and 62% of theoretical limits respectively).
The most noticeable result should be the decrease in overall waste produced.
Decreasing the total waste by almost two orders of magnitude is a significant change in
waste material. The lower waste material produced results in significantly less storage
required, which is a problem current power reactors are facing. Spent fuel casks for
waste products are currently very expensive and not economically efficient. Even if
Yucca Mountain does go into operation it is predicted that it will only delay the spent fuel
problem for a few years. The GCR design effectively decreases the danger from waste
products as most of the waste products can be allowed to decay naturally. The half-lives
of U235 and U238 are in the orders of billions of years, and per reactor approximately
90MTU is unused at the end of a life cycle (life cycle meaning if the core is a three batch
cycle, then after the three batches are finished). The GCR effectively depletes almost all
of its U235 and U238 content while in operation. The GCR waste product could then be
solidified chemically and placed into storage the same as current LWR fuel is, except
55
requiring one percent of the space used by an LWR for the same electrical power. Also
many of the waste products could easily be separated and put to use in other areas of
research, such as Pu238 for space thermoelectric propulsion systems.
This research has shown that the GCR has the potential to set the upper limits in
performance in the areas of burnup and waste production. The GCR concept can be
considered a viable alternative to LWRs when dealing with fuel management and waste
products, as well as electrical efficiency and proliferation resistance.
Future work should include design parameters that were left out in this research, as
well as other code packages to benchmark results. Parameters that were left out include
material designs (liners and extra coolant materials), secondary side considerations
(fission product removal, flow rates, and online fuel feeding limitations), as well as
radiation damage to the core and mechanical parts. Currently MCNP is the only package
that uses a continuous energy spectrum to calculate interactions and fluxes, however it
should be acceptable to benchmark the code with a transport or diffusion package.
Recommendations for future ideas in this area of research include studying
continuous online fuel feeding designs, in this research it was limited to set intervals.
Continuous online fueling may turn out to not be a viable or workable method, however it
allows for higher burnups since the core can be more tightly controlled. More advanced
spectrum analysis would also be useful in determining the effectiveness of the GCR’s
ability to limit actinide inventories. The neutron energy spectrum is the fundamental
property affecting all waste production and depletion, and should therefore be studied in
depth. Cost estimate analysis should also be done on the GCR, to evaluate its viability in
the nuclear power production field.
56
Controlling the fuel mass flow rate and its subsequent effects on spectrum and
criticality should be studied. The code packages used in this research only allow for
steady state analysis as far as fuel location is concerned (the fuel can not be simulated as
flowing). As the mass flow rate can affect critically it may be shown that rotating BeO
columns are not necessary and the geometry used in this research (concentric cylinders)
could be used. This research did not study at all the effects of circulating fuel, and that
facet of GCR design needs to be more intricately examined, as it has a direct affect on the
viability of the system.
The last parameter area of future work should be done in the area of optimizing
enrichments. For the purpose of simplicity certain enrichments were not varied (the fuel
feed enrichment was kept the same as the average fuel depletion enrichment), and for the
purpose of legality the limits on enrichment were kept to within current standards. This
severely limits the effectiveness of the GCR, as increasing enrichment in a GCR does not
result in the same increase of proliferation danger as in a solid fuel reactor. Because the
fuel is gaseous and in exists in such low quantities compared to a solid fuel reactor, there
is no inherent proliferation danger from increasing the enrichment past five percent.
Increasing fuel enrichment is believed to decrease the plutonium production from U238
captures, therefore increasing the fission to capture ratio of the fuel. Increasing the ratio
of fissions to captures inevitably decreases the amount of waste products produced, thus
lowering the total actinide inventory.
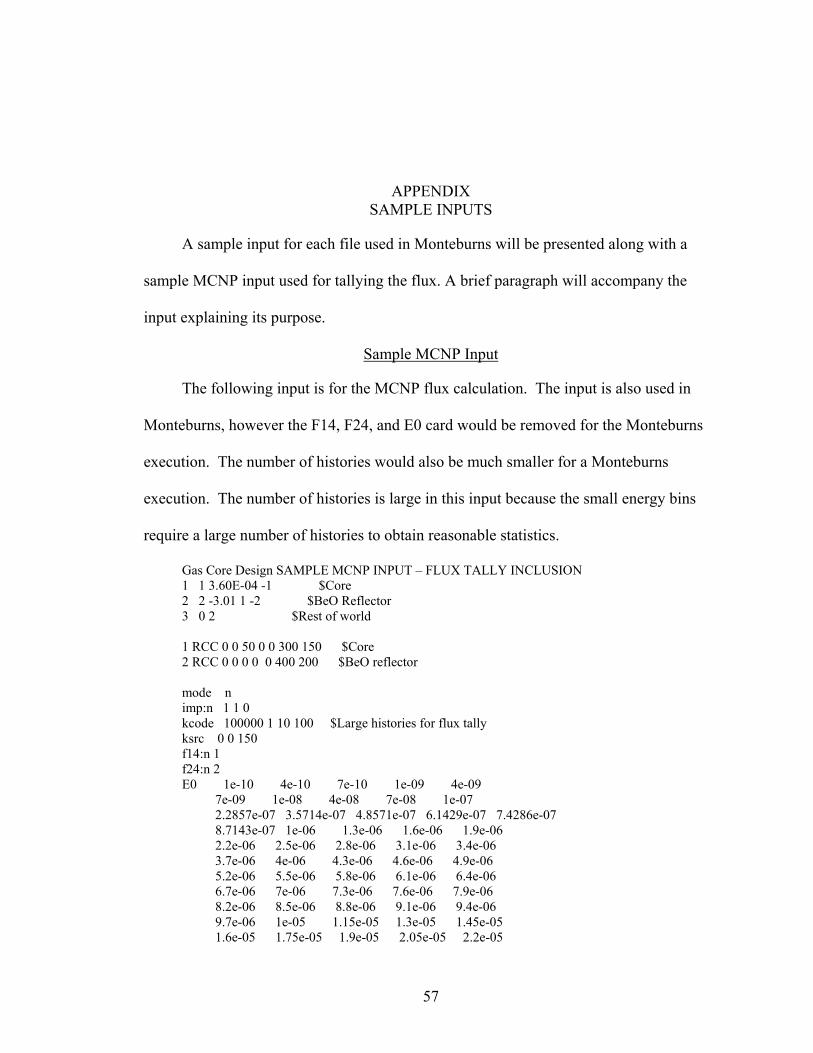
APPENDIX SAMPLE INPUTS
A sample input for each file used in Monteburns will be presented along with a
sample MCNP input used for tallying the flux. A brief paragraph will accompany the
input explaining its purpose.
Sample MCNP Input
The following input is for the MCNP flux calculation. The input is also used in
Monteburns, however the F14, F24, and E0 card would be removed for the Monteburns
execution. The number of histories would also be much smaller for a Monteburns
execution. The number of histories is large in this input because the small energy bins
require a large number of histories to obtain reasonable statistics.
Gas Core Design SAMPLE MCNP INPUT – FLUX TALLY INCLUSION 1 1 3.60E-04 -1 $Core 2 2 -3.01 1 -2 $BeO Reflector 3 0 2 $Rest of world 1 RCC 0 0 50 0 0 300 150 $Core 2 RCC 0 0 0 0 0 400 200 $BeO reflector mode n imp:n 1 1 0 kcode 100000 1 10 100 $Large histories for flux tally ksrc 0 0 150 f14:n 1 f24:n 2 E0 1e-10 4e-10 7e-10 1e-09 4e-09 7e-09 1e-08 4e-08 7e-08 1e-07 2.2857e-07 3.5714e-07 4.8571e-07 6.1429e-07 7.4286e-07 8.7143e-07 1e-06 1.3e-06 1.6e-06 1.9e-06 2.2e-06 2.5e-06 2.8e-06 3.1e-06 3.4e-06 3.7e-06 4e-06 4.3e-06 4.6e-06 4.9e-06 5.2e-06 5.5e-06 5.8e-06 6.1e-06 6.4e-06 6.7e-06 7e-06 7.3e-06 7.6e-06 7.9e-06 8.2e-06 8.5e-06 8.8e-06 9.1e-06 9.4e-06 9.7e-06 1e-05 1.15e-05 1.3e-05 1.45e-05 1.6e-05 1.75e-05 1.9e-05 2.05e-05 2.2e-05
57
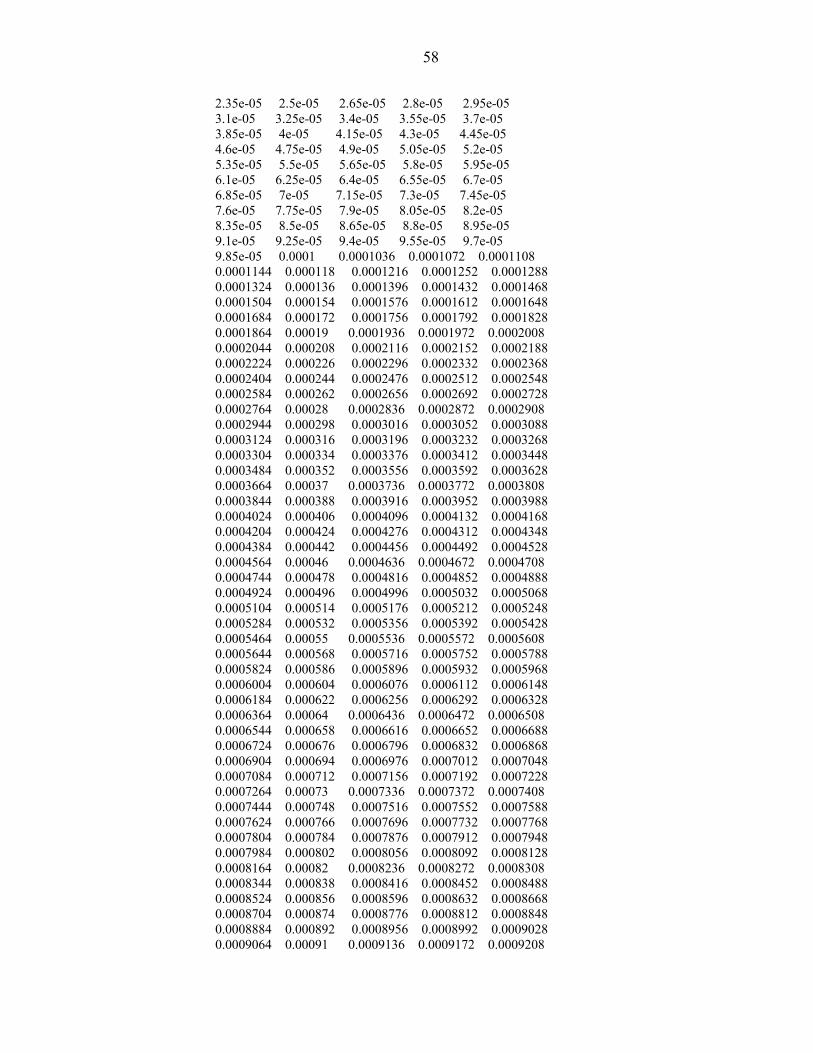
58
2.35e-05 2.5e-05 2.65e-05 2.8e-05 2.95e-05 3.1e-05 3.25e-05 3.4e-05 3.55e-05 3.7e-05 3.85e-05 4e-05 4.15e-05 4.3e-05 4.45e-05 4.6e-05 4.75e-05 4.9e-05 5.05e-05 5.2e-05 5.35e-05 5.5e-05 5.65e-05 5.8e-05 5.95e-05 6.1e-05 6.25e-05 6.4e-05 6.55e-05 6.7e-05 6.85e-05 7e-05 7.15e-05 7.3e-05 7.45e-05 7.6e-05 7.75e-05 7.9e-05 8.05e-05 8.2e-05 8.35e-05 8.5e-05 8.65e-05 8.8e-05 8.95e-05 9.1e-05 9.25e-05 9.4e-05 9.55e-05 9.7e-05 9.85e-05 0.0001 0.0001036 0.0001072 0.0001108 0.0001144 0.000118 0.0001216 0.0001252 0.0001288 0.0001324 0.000136 0.0001396 0.0001432 0.0001468 0.0001504 0.000154 0.0001576 0.0001612 0.0001648 0.0001684 0.000172 0.0001756 0.0001792 0.0001828 0.0001864 0.00019 0.0001936 0.0001972 0.0002008 0.0002044 0.000208 0.0002116 0.0002152 0.0002188 0.0002224 0.000226 0.0002296 0.0002332 0.0002368 0.0002404 0.000244 0.0002476 0.0002512 0.0002548 0.0002584 0.000262 0.0002656 0.0002692 0.0002728 0.0002764 0.00028 0.0002836 0.0002872 0.0002908 0.0002944 0.000298 0.0003016 0.0003052 0.0003088 0.0003124 0.000316 0.0003196 0.0003232 0.0003268 0.0003304 0.000334 0.0003376 0.0003412 0.0003448 0.0003484 0.000352 0.0003556 0.0003592 0.0003628 0.0003664 0.00037 0.0003736 0.0003772 0.0003808 0.0003844 0.000388 0.0003916 0.0003952 0.0003988 0.0004024 0.000406 0.0004096 0.0004132 0.0004168 0.0004204 0.000424 0.0004276 0.0004312 0.0004348 0.0004384 0.000442 0.0004456 0.0004492 0.0004528 0.0004564 0.00046 0.0004636 0.0004672 0.0004708 0.0004744 0.000478 0.0004816 0.0004852 0.0004888 0.0004924 0.000496 0.0004996 0.0005032 0.0005068 0.0005104 0.000514 0.0005176 0.0005212 0.0005248 0.0005284 0.000532 0.0005356 0.0005392 0.0005428 0.0005464 0.00055 0.0005536 0.0005572 0.0005608 0.0005644 0.000568 0.0005716 0.0005752 0.0005788 0.0005824 0.000586 0.0005896 0.0005932 0.0005968 0.0006004 0.000604 0.0006076 0.0006112 0.0006148 0.0006184 0.000622 0.0006256 0.0006292 0.0006328 0.0006364 0.00064 0.0006436 0.0006472 0.0006508 0.0006544 0.000658 0.0006616 0.0006652 0.0006688 0.0006724 0.000676 0.0006796 0.0006832 0.0006868 0.0006904 0.000694 0.0006976 0.0007012 0.0007048 0.0007084 0.000712 0.0007156 0.0007192 0.0007228 0.0007264 0.00073 0.0007336 0.0007372 0.0007408 0.0007444 0.000748 0.0007516 0.0007552 0.0007588 0.0007624 0.000766 0.0007696 0.0007732 0.0007768 0.0007804 0.000784 0.0007876 0.0007912 0.0007948 0.0007984 0.000802 0.0008056 0.0008092 0.0008128 0.0008164 0.00082 0.0008236 0.0008272 0.0008308 0.0008344 0.000838 0.0008416 0.0008452 0.0008488 0.0008524 0.000856 0.0008596 0.0008632 0.0008668 0.0008704 0.000874 0.0008776 0.0008812 0.0008848 0.0008884 0.000892 0.0008956 0.0008992 0.0009028 0.0009064 0.00091 0.0009136 0.0009172 0.0009208

59
0.0009244 0.000928 0.0009316 0.0009352 0.0009388 0.0009424 0.000946 0.0009496 0.0009532 0.0009568 0.0009604 0.000964 0.0009676 0.0009712 0.0009748 0.0009784 0.000982 0.0009856 0.0009892 0.0009928 0.0009964 0.001 0.001036 0.001072 0.001108 0.001144 0.00118 0.001216 0.001252 0.001288 0.001324 0.00136 0.001396 0.001432 0.001468 0.001504 0.00154 0.001576 0.001612 0.001648 0.001684 0.00172 0.001756 0.001792 0.001828 0.001864 0.0019 0.001936 0.001972 0.002008 0.002044 0.00208 0.002116 0.002152 0.002188 0.002224 0.00226 0.002296 0.002332 0.002368 0.002404 0.00244 0.002476 0.002512 0.002548 0.002584 0.00262 0.002656 0.002692 0.002728 0.002764 0.0028 0.002836 0.002872 0.002908 0.002944 0.00298 0.003016 0.003052 0.003088 0.003124 0.00316 0.003196 0.003232 0.003268 0.003304 0.00334 0.003376 0.003412 0.003448 0.003484 0.00352 0.003556 0.003592 0.003628 0.003664 0.0037 0.003736 0.003772 0.003808 0.003844 0.00388 0.003916 0.003952 0.003988 0.004024 0.00406 0.004096 0.004132 0.004168 0.004204 0.00424 0.004276 0.004312 0.004348 0.004384 0.00442 0.004456 0.004492 0.004528 0.004564 0.0046 0.004636 0.004672 0.004708 0.004744 0.00478 0.004816 0.004852 0.004888 0.004924 0.00496 0.004996 0.005032 0.005068 0.005104 0.00514 0.005176 0.005212 0.005248 0.005284 0.00532 0.005356 0.005392 0.005428 0.005464 0.0055 0.005536 0.005572 0.005608 0.005644 0.00568 0.005716 0.005752 0.005788 0.005824 0.00586 0.005896 0.005932 0.005968 0.006004 0.00604 0.006076 0.006112 0.006148 0.006184 0.00622 0.006256 0.006292 0.006328 0.006364 0.0064 0.006436 0.006472 0.006508 0.006544 0.00658 0.006616 0.006652 0.006688 0.006724 0.00676 0.006796 0.006832 0.006868 0.006904 0.00694 0.006976 0.007012 0.007048 0.007084 0.00712 0.007156 0.007192 0.007228 0.007264 0.0073 0.007336 0.007372 0.007408 0.007444 0.00748 0.007516 0.007552 0.007588 0.007624 0.00766 0.007696 0.007732 0.007768 0.007804 0.00784 0.007876 0.007912 0.007948 0.007984 0.00802 0.008056 0.008092 0.008128 0.008164 0.0082 0.008236 0.008272 0.008308 0.008344 0.00838 0.008416 0.008452 0.008488 0.008524 0.00856 0.008596 0.008632 0.008668 0.008704 0.00874 0.008776 0.008812 0.008848 0.008884 0.00892 0.008956 0.008992 0.009028 0.009064 0.0091 0.009136 0.009172 0.009208 0.009244 0.00928 0.009316 0.009352 0.009388 0.009424 0.00946 0.009496 0.009532 0.009568 0.009604 0.00964 0.009676 0.009712 0.009748 0.009784 0.00982 0.009856 0.009892 0.009928 0.009964 0.01 0.015 0.02 0.025 0.03 0.035 0.04 0.045 0.05
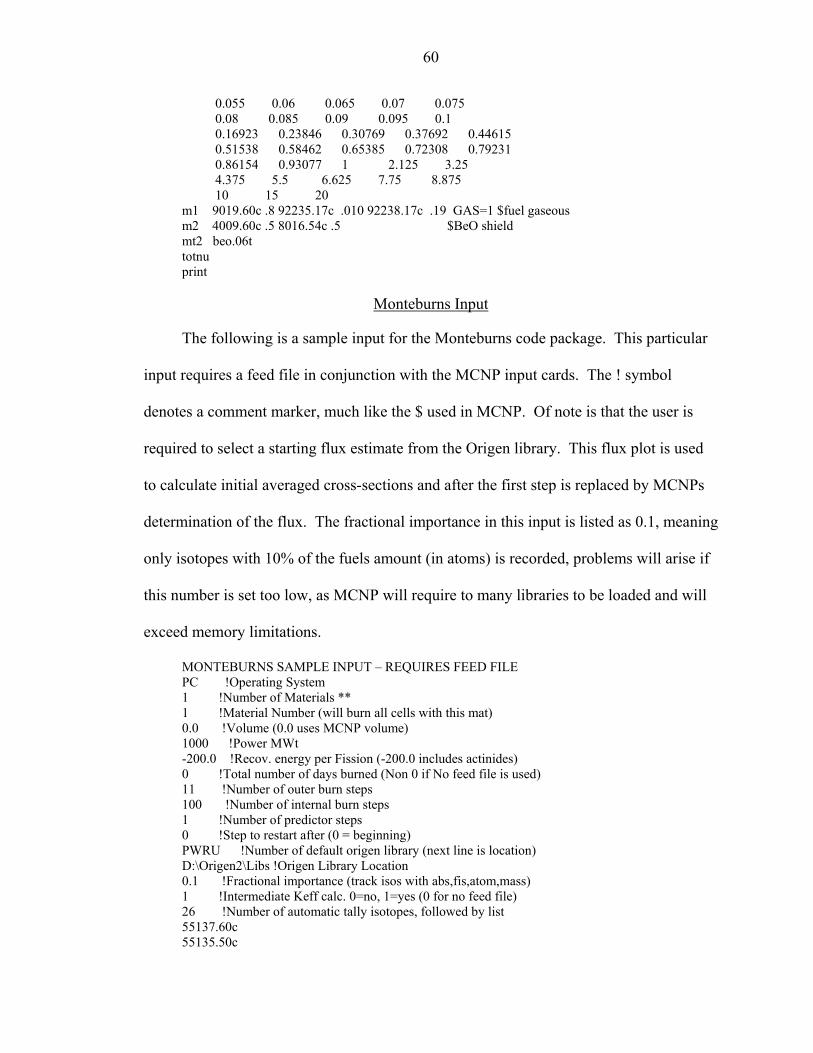
60
0.055 0.06 0.065 0.07 0.075 0.08 0.085 0.09 0.095 0.1 0.16923 0.23846 0.30769 0.37692 0.44615 0.51538 0.58462 0.65385 0.72308 0.79231 0.86154 0.93077 1 2.125 3.25 4.375 5.5 6.625 7.75 8.875 10 15 20 m1 9019.60c .8 92235.17c .010 92238.17c .19 GAS=1 $fuel gaseous m2 4009.60c .5 8016.54c .5 $BeO shield mt2 beo.06t totnu print
Monteburns Input
The following is a sample input for the Monteburns code package. This particular
input requires a feed file in conjunction with the MCNP input cards. The ! symbol
denotes a comment marker, much like the $ used in MCNP. Of note is that the user is
required to select a starting flux estimate from the Origen library. This flux plot is used
to calculate initial averaged cross-sections and after the first step is replaced by MCNPs
determination of the flux. The fractional importance in this input is listed as 0.1, meaning
only isotopes with 10% of the fuels amount (in atoms) is recorded, problems will arise if
this number is set too low, as MCNP will require to many libraries to be loaded and will
exceed memory limitations.
MONTEBURNS SAMPLE INPUT – REQUIRES FEED FILE PC !Operating System 1 !Number of Materials ** 1 !Material Number (will burn all cells with this mat) 0.0 !Volume (0.0 uses MCNP volume) 1000 !Power MWt -200.0 !Recov. energy per Fission (-200.0 includes actinides) 0 !Total number of days burned (Non 0 if No feed file is used) 11 !Number of outer burn steps 100 !Number of internal burn steps 1 !Number of predictor steps 0 !Step to restart after (0 = beginning) PWRU !Number of default origen library (next line is location) D:\Origen2\Libs !Origen Library Location 0.1 !Fractional importance (track isos with abs,fis,atom,mass) 1 !Intermediate Keff calc. 0=no, 1=yes (0 for no feed file) 26 !Number of automatic tally isotopes, followed by list 55137.60c 55135.50c
61
54135.50c 53135.50c 62149.50c 92234.35c 92235.17c 92236.60c 92237.35c 92238.17c 93237.60c 94238.35c 94239.60c 94240.50c 94241.60c 94242.50c 95241.50c 95242.50c 95243.50c 96242.60c 96243.60c 96244.50c 96245.60c 96246.60c 96247.60c 96248.60c
Monteburns Feed File
The feed file is used to inject or “feed” isotopes into the geometry, as well as
remove unwanted isotopes (in this case fuel is fed into the core, while fission products are
removed). A feed file is only required if the user wishes to inject or remove isotopes into
or from the core respectively during operation.
FEED FILE – No title card used in feed file, input starts with “Time”.
Time Days Power MBMat Feed Begin&EndRates Remov. Fraction F.P.Removed Step Burned Fract. # # grams/day Group# 1 30.00 1.000 1 1 2000.0 2000.0 1 1.000 ! 2 330.00 1.000 1 1 -1.0 1900.0 1 1.000 ! 3 360.00 1.000 1 1 -1.0 1900.0 1 1.000 ! 4 360.00 1.000 1 1 -1.0 1800.0 1 1.000 ! 5 360.00 1.000 1 1 -1.0 1850.0 1 1.000 ! 6 360.00 1.000 1 1 -1.0 1700.0 1 1.000 ! 7 360.00 1.000 1 1 -1.0 1500.0 1 1.000 ! 8 360.00 1.000 1 1 -1.0 1450.0 1 1.000 ! 9 360.00 1.000 1 1 -1.0 1350.0 1 1.000 ! 10 360.00 1.000 1 1 -1.0 1300.0 1 1.000 ! 11 360.00 1.000 1 1 -1.0 1300.0 1 1.000 ! 1 ! # of feed specs 2 ! # of isos in Feed Group 1 92235 .650000 92238 .350000
62
1 ! # of removal groups 1 ! # of ranges 28 68 ! range of atomic numbers
LIST OF REFERENCES
1. B. M. SMITH, S. ANGHAIE, T. W. KNIGHT, “Gas Core Reactor–MHD Power System with Cascading Power Cycle,” Proceedings of the International Congress on Advanced Nuclear Power Plants, June 9-13, Hollywood, Florida (2002).
2. S. D. KAHOOK, “Static and Dynamic Neutronic Analysis of the Uranium Tetra-Flouride, Ultrahigh Temperature, Vapor Core Reactor System,” University of Florida, Gainesville (1991).
3. T. TAKIZUKA, K. TSUJIMOTO, T. SASA, and H. TAKANO, “Dedicated Accelerator-Driven-System For Nuclear Waste Transmutation,” Center for Neutron Science, Japan Atomic Energy Research Institute, Tokai-Mura (1998)
4. J. R. LAMARSH, Introduction to Nuclear Engineering, Addison-Wesley Publishing Company, Upper Saddle River, New Jersey (1983).
5. E.T. DUGAN, “The Nuclear Piston Engine and Pulsed Gaseous Core Reactor Power System,” Ph.D. Dissertation, University of Florida, Gainesville (1976).
6. C. COLLINS, S. C-P. WANG, and S. ANGHAIE, “Investigation of High Temperature Materials for Uranium Fluoride Based Gas Core Reactor Systems,” Trans. Amer. Nuc. Soc., 56, (1988).
7. S. C-P., WANG, C.T. COLLINS and S. ANGHAIE, “An Overview of Compatible Materials for Uranium Fluoride Based Gas Core Reactor Systems,” Space Nuclear Power Systems, Vol. VIII, Orbit Book Company, Malabar, Florida (1989).
63
BIOGRAPHICAL SKETCH
Robert Edward Norring was born on January 7, 1980, in New Jersey. At the age of
10 he moved to Sarasota Florida and attended Gulf Gate Elementary School. One year
later he enrolled in Pine View School for the Gifted, where he stayed until his high
school graduation in 1998.
Robert Norring enrolled at the University of Florida in August of 1998, and
received his undergraduate degree in fall of 2002. During his undergraduate studies he
also enrolled as a graduate student at the University of Florida and began his thesis
research. During his work he attained the position of vice president of Alpha Nu Sigma
for the year of 2002.
Currently he is enrolled in the Nuclear and Radiological Engineering graduate
program at the University of Florida and is working on his doctorate degree.
64