optimum position of outrigger system for …ijates.com/images/short_pdf/1419411513_p326-339.pdf ·...
TRANSCRIPT
International Journal of Advanced Technology in Engineering and Science www.ijates.com
Volume No.02, Issue No. 12, December 2014 ISSN (online): 2348 – 7550
326 | P a g e
OPTIMUM POSITION OF OUTRIGGER SYSTEM FOR
HIGH RAISED RC BUILDINGS USING ETABS 2013.1.5
(PUSH OVER ANALYSIS)
Karthik.N.M1, N.Jayaramappa
2
1 Assistant Professor, Dept. of Civil Engineering
Chikka Muniyappa Reddy Institute of Technology (CMRIT), Bangalore, Karnataka, (India) 2 Assistant Professor, Dept. of Civil Engineering
University Visvesvaraya College of Engineering (UVCE), Bangalore, Karnataka, (India)
ABSTRACT
Pushover analysis is a non linear static analysis becoming a popular tool for seismic performance evaluation of
existing and new structures and used to determine the force-displacement relationship for a structural element.
To evaluate the performance of RC frame structure, a non linear static pushover analysis has been conducted by
using ETABS 9.13.5. To achieve this objective, eight RC frame structures with 30 stories 7X7bay, without and
with outriggers at different stories were analyzed. Compression study of the base force and displacement of RC
frame structure with 30 storie,s 7X7bay with outriggers at different stories.
Keywords: ETABS 9.13.5, Outrigger System, Non Linear Static Analysis, Pushover Analysis.
I. INTRODUCTION
The design of tall and slender structures is controlled by three governing factors, strength (material capacity),
stiffness (drift) and serviceability (motion perception and accelerations), produced by the action of lateral
loading. The overall geometry of a building often dictates which factor governs the overall design. As a building
becomes taller and more slender, drift considerations become more significant. Proportioning member
efficiency based on maximum lateral displacement supersedes design based on allowable stress criteria.
Innovative structural schemes are continuously being sought in the field. Structural Design of High Rise
Structures with the intention of limiting the Drift due to Lateral Loads to acceptable limits without paying a high
premium in steel tonnage. Various wind bracing techniques have been developed in this regard; one such is an
Outrigger System, in which the axial stiffness of the peripheral columns is invoked for increasing the resistance
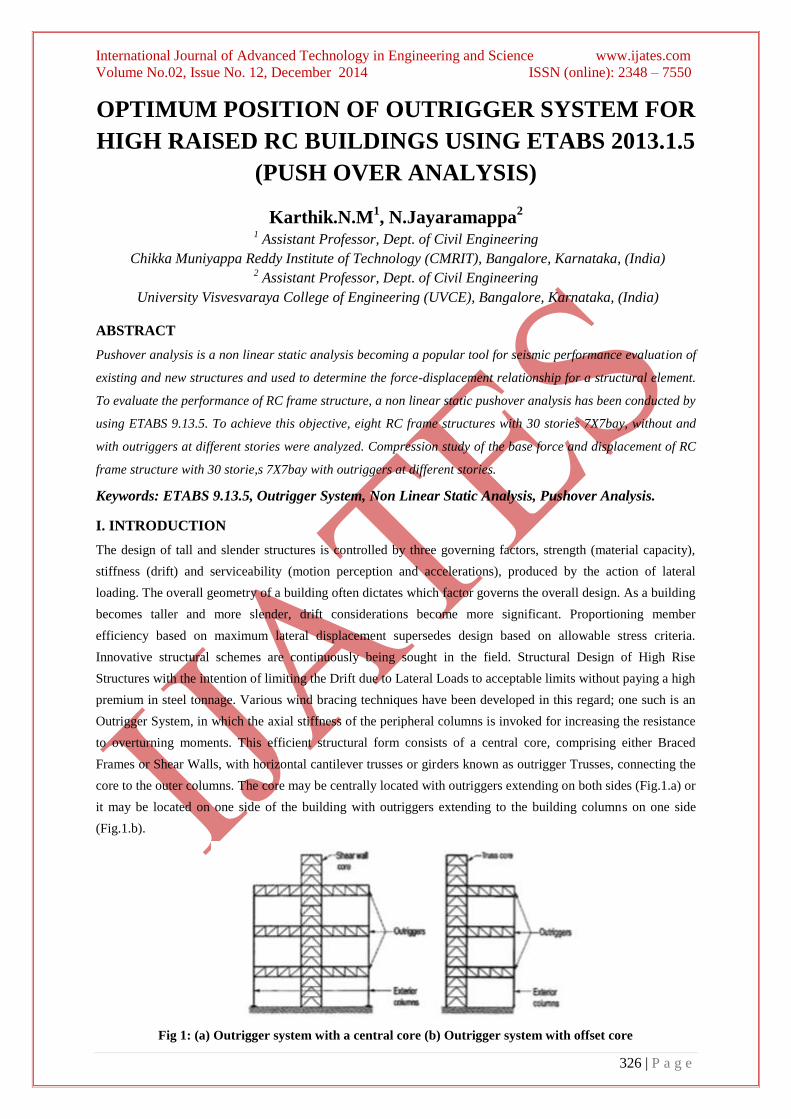
to overturning moments. This efficient structural form consists of a central core, comprising either Braced
Frames or Shear Walls, with horizontal cantilever trusses or girders known as outrigger Trusses, connecting the
core to the outer columns. The core may be centrally located with outriggers extending on both sides (Fig.1.a) or
it may be located on one side of the building with outriggers extending to the building columns on one side
(Fig.1.b).
Fig 1: (a) Outrigger system with a central core (b) Outrigger system with offset core
International Journal of Advanced Technology in Engineering and Science www.ijates.com
Volume No.02, Issue No. 12, December 2014 ISSN (online): 2348 – 7550
327 | P a g e
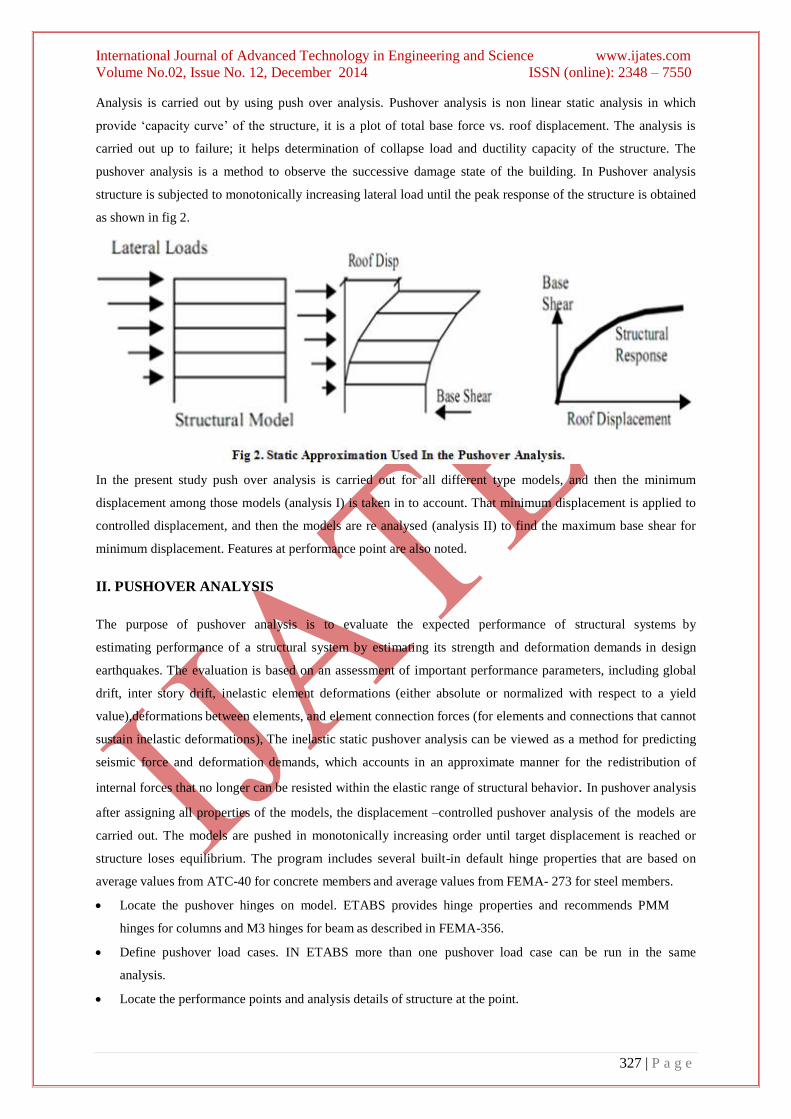
Analysis is carried out by using push over analysis. Pushover analysis is non linear static analysis in which
provide „capacity curve‟ of the structure, it is a plot of total base force vs. roof displacement. The analysis is
carried out up to failure; it helps determination of collapse load and ductility capacity of the structure. The
pushover analysis is a method to observe the successive damage state of the building. In Pushover analysis
structure is subjected to monotonically increasing lateral load until the peak response of the structure is obtained
as shown in fig 2.
In the present study push over analysis is carried out for all different type models, and then the minimum
displacement among those models (analysis I) is taken in to account. That minimum displacement is applied to
controlled displacement, and then the models are re analysed (analysis II) to find the maximum base shear for
minimum displacement. Features at performance point are also noted.
II. PUSHOVER ANALYSIS
The purpose of pushover analysis is to evaluate the expected performance of structural systems by
estimating performance of a structural system by estimating its strength and deformation demands in design
earthquakes. The evaluation is based on an assessment of important performance parameters, including global
drift, inter story drift, inelastic element deformations (either absolute or normalized with respect to a yield
value),deformations between elements, and element connection forces (for elements and connections that cannot
sustain inelastic deformations), The inelastic static pushover analysis can be viewed as a method for predicting
seismic force and deformation demands, which accounts in an approximate manner for the redistribution of
internal forces that no longer can be resisted within the elastic range of structural behavior. In pushover analysis
after assigning all properties of the models, the displacement –controlled pushover analysis of the models are
carried out. The models are pushed in monotonically increasing order until target displacement is reached or
structure loses equilibrium. The program includes several built-in default hinge properties that are based on
average values from ATC-40 for concrete members and average values from FEMA- 273 for steel members.
Locate the pushover hinges on model. ETABS provides hinge properties and recommends PMM
hinges for columns and M3 hinges for beam as described in FEMA-356.
Define pushover load cases. IN ETABS more than one pushover load case can be run in the same
analysis.
Locate the performance points and analysis details of structure at the point.

International Journal of Advanced Technology in Engineering and Science www.ijates.com
Volume No.02, Issue No. 12, December 2014 ISSN (online): 2348 – 7550
328 | P a g e
III. DATA TO BE USED
3.1 Material Properties
Grade of concrete = M40
Grade of steel = Fe-500
Number of stories: 30 stories
Building height: 120 mts
3.2 Description of Frame Structure
The RC frame structure 30 stories is considered in this study. In the modal, in X- direction and Y-direction, each
of 42m in length and the support condition was assumed to be fixed and soil condition was assumed as medium
soil. All slabs were assumed as Membrane element of 150 mm thickness. The typical floor height is 4m.The
details of beams and columns are shown below. Live load on slab is 3KN/m2.
COLUMN SIZE:
Square columns:
1000mm X 1000mm First to Third Floor
900mm X 900mm Fourth and Fifth Floor
800mm X 800mm Sixth to Eighth floor
700mm X 700mm Ninth to 12th Floor
600mm X 600mm 13th to 16th Floor
500mm X 500mm 17th to 30th Floor
BEAM SIZE:
300mmx600mm.
BRACING SIZE:
Square size of 300mmx300mm.
SHEAR WALL THICKNESS:
RC Building frame Brick wall thickness is
600mm.
GRID DATA: 7 X 7 Bay. 6 mts Spacing (fig 3)
3.3 Analysis Model Types
Bracing has been provided as the structure has been divided in to 1/3rd and 1/4th height of the buildings total
height.
Type 1: Bare frame with shear wall.
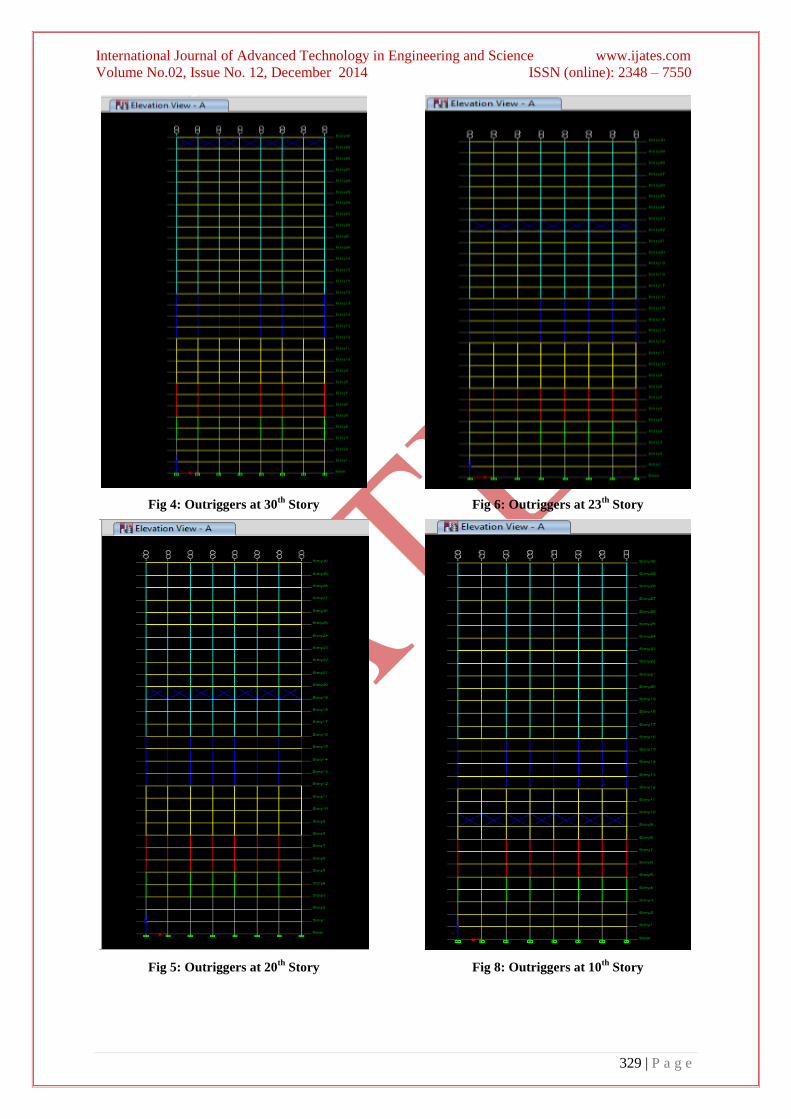
Type 2: Bracing at 30th story. (fig 4)
Type 3: Bracing at 23rd story. (fig 5)
Type 4: Bracing at 20th story. (fig 6)
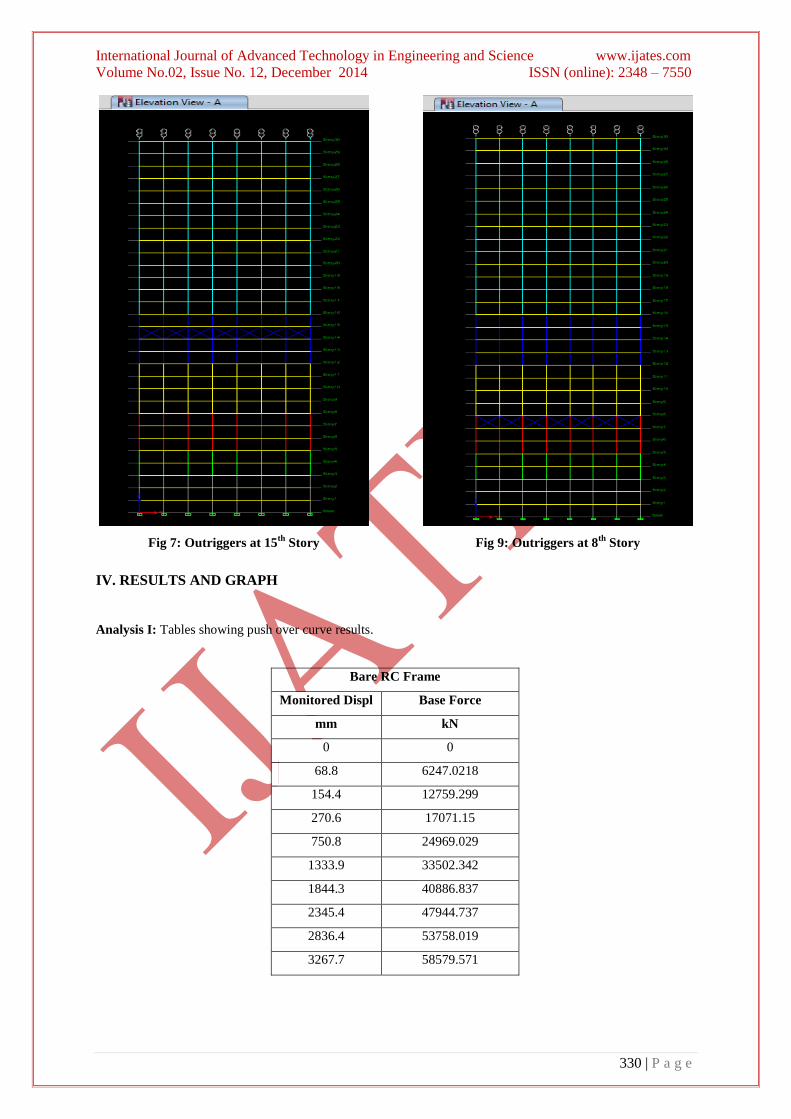
Type 5: Bracing at 15th story. (fig 7)
Type 6: Bracing at 10th story. (fig 8)
Type 7: Bracing at 8th story. (fig 9)
Fig -3: Plan of the Structure
International Journal of Advanced Technology in Engineering and Science www.ijates.com
Volume No.02, Issue No. 12, December 2014 ISSN (online): 2348 – 7550
329 | P a g e
Fig 4: Outriggers at 30th
Story
Fig 5: Outriggers at 20th
Story
Fig 6: Outriggers at 23th
Story
Fig 8: Outriggers at 10th
Story
International Journal of Advanced Technology in Engineering and Science www.ijates.com
Volume No.02, Issue No. 12, December 2014 ISSN (online): 2348 – 7550
330 | P a g e
Fig 7: Outriggers at 15th
Story
Fig 9: Outriggers at 8th
Story
IV. RESULTS AND GRAPH
Analysis I: Tables showing push over curve results.
Bare RC Frame
Monitored Displ Base Force
mm kN
0 0
68.8 6247.0218
154.4 12759.299
270.6 17071.15
750.8 24969.029
1333.9 33502.342
1844.3 40886.837
2345.4 47944.737
2836.4 53758.019
3267.7 58579.571

International Journal of Advanced Technology in Engineering and Science www.ijates.com
Volume No.02, Issue No. 12, December 2014 ISSN (online): 2348 – 7550
331 | P a g e
Table 1a: Push over Table for Bare RC Frame Structure.
Story 30 Story 23 Story 20
Monitored
Displ Base Force
Monitored
Displ Base Force
Monitored
Displ
Base
Force
mm kN mm kN mm kN
0 0 0 0 0 0
63.1 6385.5453 59.8 6680.8614 60.2 6986.4447
152.2 13752.651 542 35281.408 542.2 38367.658
637.7 32382.956 1027.7 57396.197 1038.4 62411.775
1132 49198.858 1095.3 60418.686 1289.8 74345.205
1619.3 65559.319
1640.4 66259.239
Table 1b: Push Over Table For Structure With Outriggers at Different Positions.
Story 15 Story 10 Story 8
Monitored Displ Base Force Monitored Displ Base Force Monitored Displ Base Force
mm kN mm kN mm kN
0 0 0 0 0 0
65.8 7848.5276 76.9 8836.8785 72.7 8055.1682
267.1 25651.768 193.5 19879.489 185.6 18247.17
763.7 49235.425 673.5 37288.521 677.6 33567.216
1040.6 61531.505 1156.8 52533.564 1206.8 47468.35
806.3 33899.617 866.3 20105.279 1298.8 49873.066
1298.8 49873.126
Table 1c: Push over Table for Structure with Outriggers at Different Positions.
Graph 1: Push Over Curve for Structure with Outriggers at Different Levels and Bare RC Frame
International Journal of Advanced Technology in Engineering and Science www.ijates.com
Volume No.02, Issue No. 12, December 2014 ISSN (online): 2348 – 7550
332 | P a g e
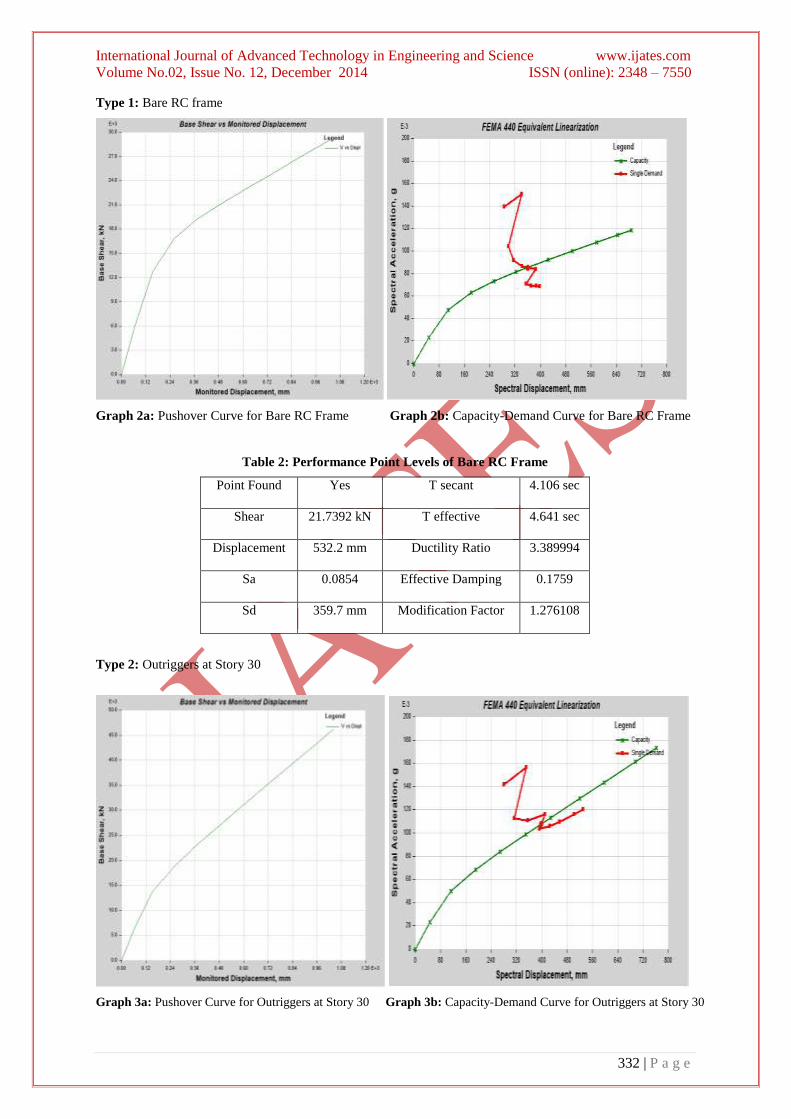
Type 1: Bare RC frame
Graph 2a: Pushover Curve for Bare RC Frame Graph 2b: Capacity-Demand Curve for Bare RC Frame
Table 2: Performance Point Levels of Bare RC Frame
Point Found Yes T secant 4.106 sec
Shear 21.7392 kN T effective 4.641 sec
Displacement 532.2 mm Ductility Ratio 3.389994
Sa 0.0854 Effective Damping 0.1759
Sd 359.7 mm Modification Factor 1.276108
Type 2: Outriggers at Story 30
Graph 3a: Pushover Curve for Outriggers at Story 30 Graph 3b: Capacity-Demand Curve for Outriggers at Story 30
International Journal of Advanced Technology in Engineering and Science www.ijates.com
Volume No.02, Issue No. 12, December 2014 ISSN (online): 2348 – 7550
333 | P a g e
Table 3: Performance Levels for Outriggers at Story 30
Point Found Yes T secant 3.851 sec
Shear 29.0268 kN T effective 4.843 sec
Displacement 540.4 mm Ductility Ratio 4.116782
Sa 0.107809 Effective Damping 0.197
Sd 398.2 mm Modification Factor 1.582307
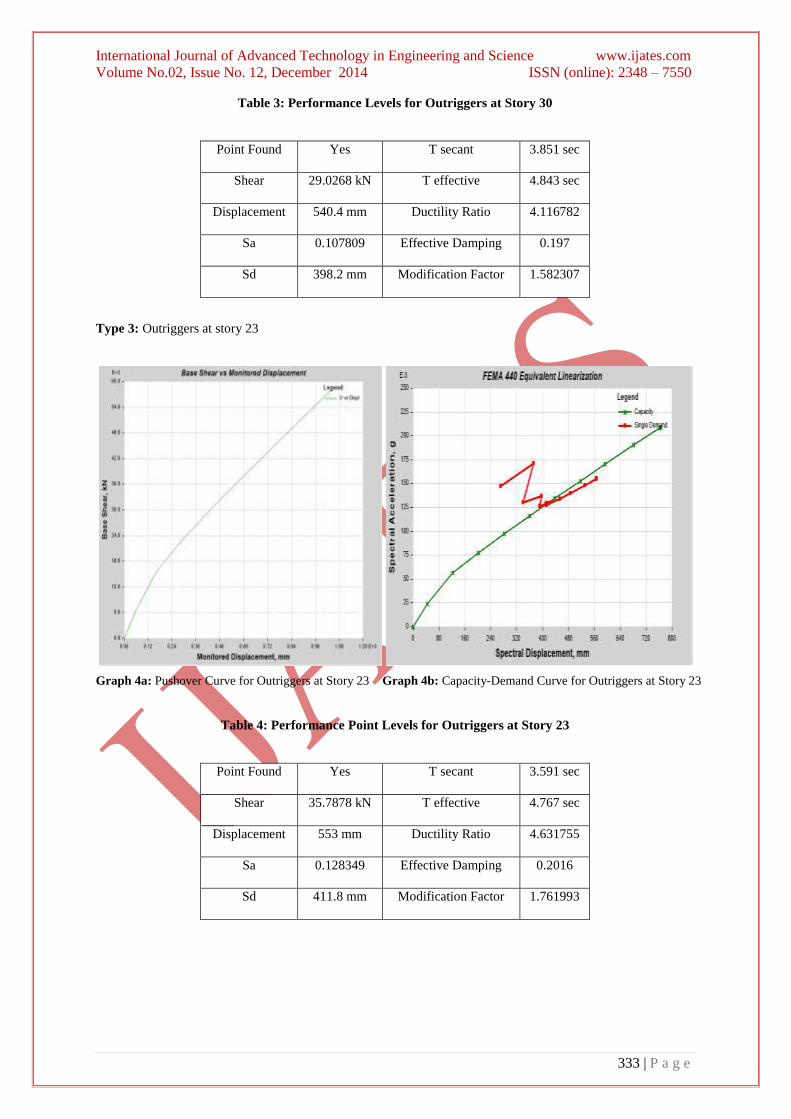
Type 3: Outriggers at story 23
Graph 4a: Pushover Curve for Outriggers at Story 23 Graph 4b: Capacity-Demand Curve for Outriggers at Story 23
Table 4: Performance Point Levels for Outriggers at Story 23
Point Found Yes T secant 3.591 sec
Shear 35.7878 kN T effective 4.767 sec
Displacement 553 mm Ductility Ratio 4.631755
Sa 0.128349 Effective Damping 0.2016
Sd 411.8 mm Modification Factor 1.761993
International Journal of Advanced Technology in Engineering and Science www.ijates.com
Volume No.02, Issue No. 12, December 2014 ISSN (online): 2348 – 7550
334 | P a g e
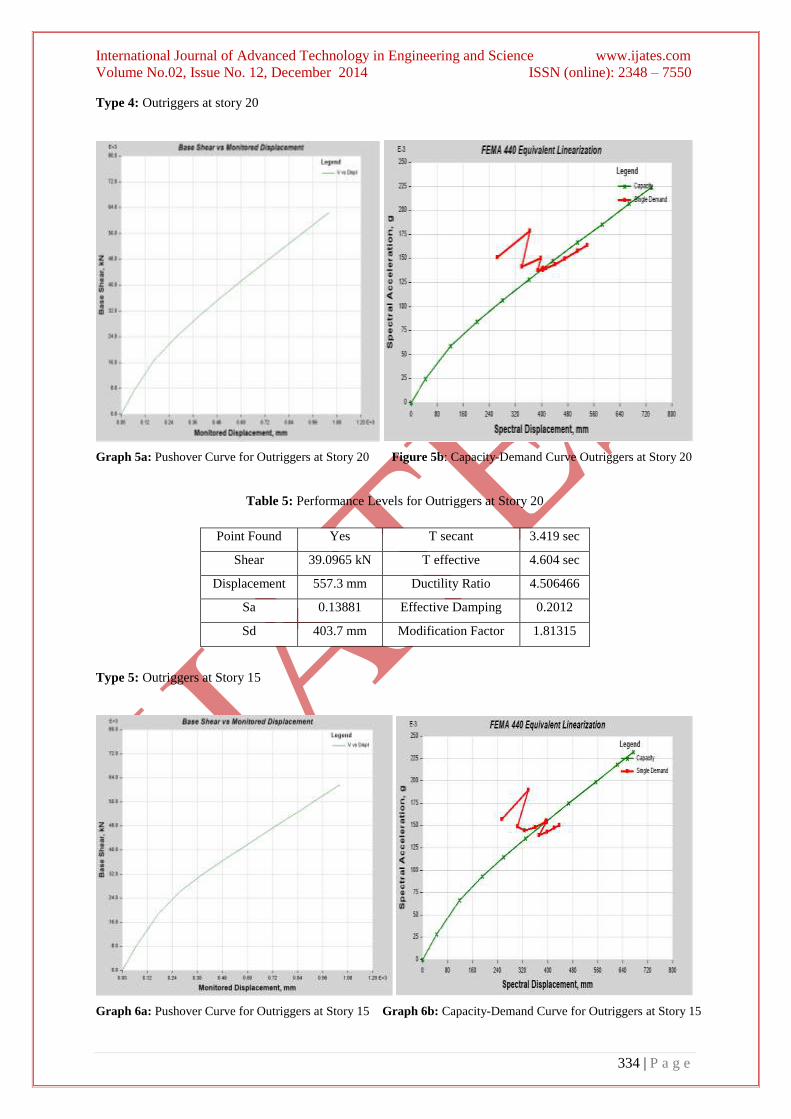
Type 4: Outriggers at story 20
Graph 5a: Pushover Curve for Outriggers at Story 20 Figure 5b: Capacity-Demand Curve Outriggers at Story 20
Table 5: Performance Levels for Outriggers at Story 20
Point Found Yes T secant 3.419 sec
Shear 39.0965 kN T effective 4.604 sec
Displacement 557.3 mm Ductility Ratio 4.506466
Sa 0.13881 Effective Damping 0.2012
Sd 403.7 mm Modification Factor 1.81315
Type 5: Outriggers at Story 15
Graph 6a: Pushover Curve for Outriggers at Story 15 Graph 6b: Capacity-Demand Curve for Outriggers at Story 15

International Journal of Advanced Technology in Engineering and Science www.ijates.com
Volume No.02, Issue No. 12, December 2014 ISSN (online): 2348 – 7550
335 | P a g e
Table 6: Performance Levels for Outriggers at Story 15
Point Found Yes T secant 3.212 sec
Shear 41.8445 kN T effective 4.384 sec
Displacement 598.8 mm Ductility Ratio 3.758616
Sa 0.154447 Effective Damping 0.1918
Sd 395.9 mm Modification Factor 1.862363
Type 6: Outriggers at Story 10
Graph 7a: Pushover Curve for Outriggers at Story 10 Graph 7b: Capacity-Demand Curve for Outriggers at Story 10
Table 7: Performance Levels for Outriggers at Story 10
Point Found Yes T secant 3.103 sec
Shear 30.053 kN T effective 3.479 sec
Displacement 447.4 mm Ductility Ratio 2.696378
Sa 0.121426 Effective Damping 0.1369
Sd 291.6 mm Modification Factor 1.256552
Type 7: Outriggers at Story 8
Graph 8a: Pushover Curve for Outriggers at Story 8 Graph 8b: Capacity-Demand Curve for Outriggers at Story 8
International Journal of Advanced Technology in Engineering and Science www.ijates.com
Volume No.02, Issue No. 12, December 2014 ISSN (online): 2348 – 7550
336 | P a g e
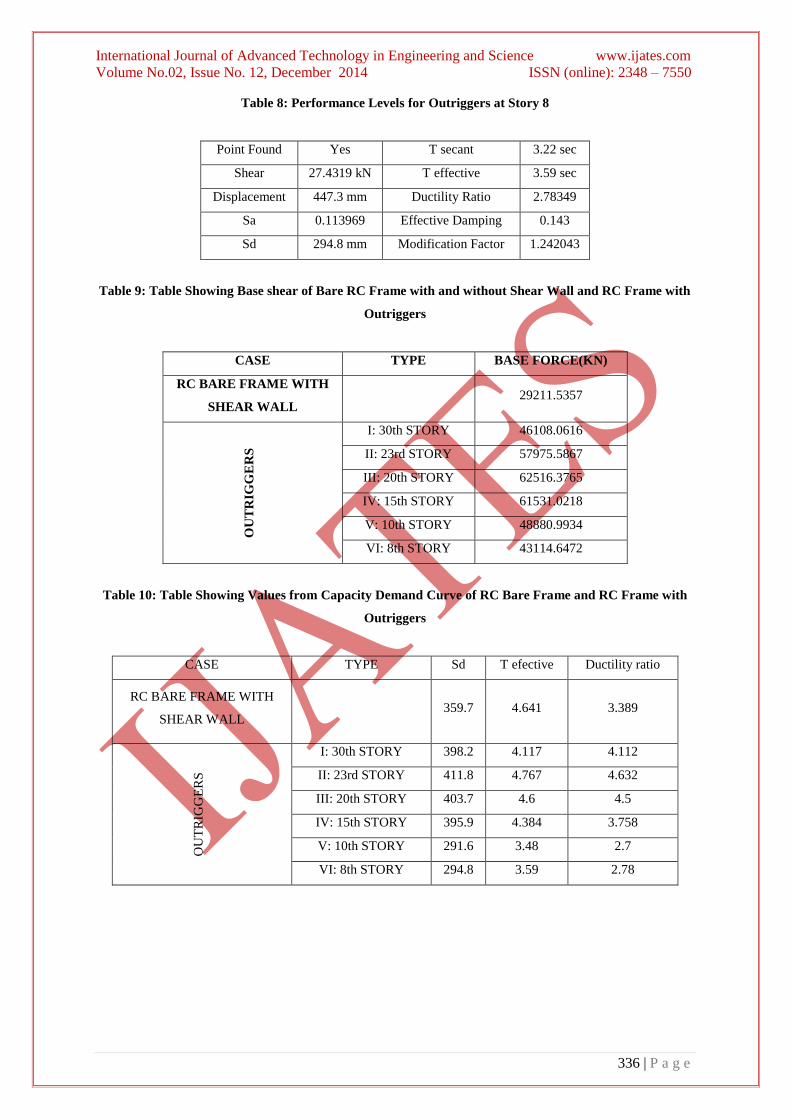
Table 8: Performance Levels for Outriggers at Story 8
Point Found Yes T secant 3.22 sec
Shear 27.4319 kN T effective 3.59 sec
Displacement 447.3 mm Ductility Ratio 2.78349
Sa 0.113969 Effective Damping 0.143
Sd 294.8 mm Modification Factor 1.242043
Table 9: Table Showing Base shear of Bare RC Frame with and without Shear Wall and RC Frame with
Outriggers
CASE TYPE BASE FORCE(KN)
RC BARE FRAME WITH
SHEAR WALL 29211.5357
OU
TR
IGG
ER
S
I: 30th STORY 46108.0616
II: 23rd STORY 57975.5867
III: 20th STORY 62516.3765
IV: 15th STORY 61531.0218
V: 10th STORY 48880.9934
VI: 8th STORY 43114.6472
Table 10: Table Showing Values from Capacity Demand Curve of RC Bare Frame and RC Frame with
Outriggers
CASE TYPE Sd T efective Ductility ratio
RC BARE FRAME WITH
SHEAR WALL 359.7 4.641 3.389
OU
TR
IGG
ER
S
I: 30th STORY 398.2 4.117 4.112
II: 23rd STORY 411.8 4.767 4.632
III: 20th STORY 403.7 4.6 4.5
IV: 15th STORY 395.9 4.384 3.758
V: 10th STORY 291.6 3.48 2.7
VI: 8th STORY 294.8 3.59 2.78
International Journal of Advanced Technology in Engineering and Science www.ijates.com
Volume No.02, Issue No. 12, December 2014 ISSN (online): 2348 – 7550
337 | P a g e
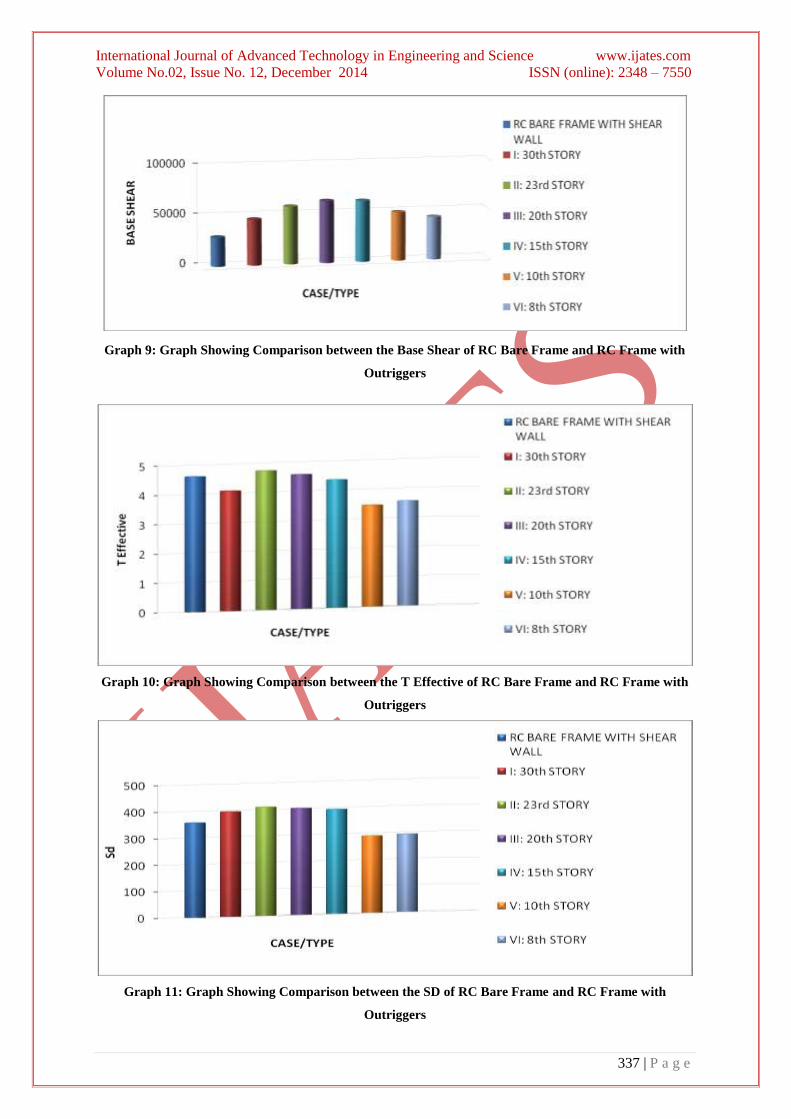
Graph 9: Graph Showing Comparison between the Base Shear of RC Bare Frame and RC Frame with
Outriggers
Graph 10: Graph Showing Comparison between the T Effective of RC Bare Frame and RC Frame with
Outriggers
Graph 11: Graph Showing Comparison between the SD of RC Bare Frame and RC Frame with
Outriggers
International Journal of Advanced Technology in Engineering and Science www.ijates.com
Volume No.02, Issue No. 12, December 2014 ISSN (online): 2348 – 7550
338 | P a g e
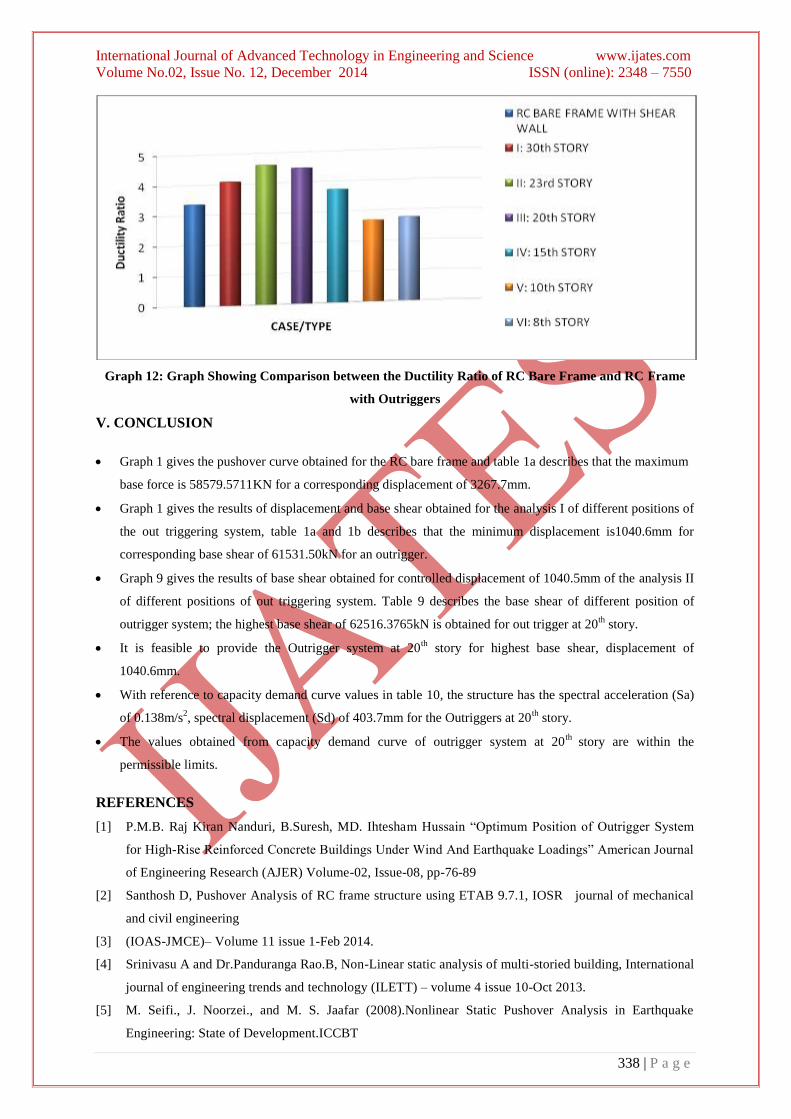
Graph 12: Graph Showing Comparison between the Ductility Ratio of RC Bare Frame and RC Frame
with Outriggers
V. CONCLUSION
Graph 1 gives the pushover curve obtained for the RC bare frame and table 1a describes that the maximum
base force is 58579.5711KN for a corresponding displacement of 3267.7mm.
Graph 1 gives the results of displacement and base shear obtained for the analysis I of different positions of
the out triggering system, table 1a and 1b describes that the minimum displacement is1040.6mm for
corresponding base shear of 61531.50kN for an outrigger.
Graph 9 gives the results of base shear obtained for controlled displacement of 1040.5mm of the analysis II
of different positions of out triggering system. Table 9 describes the base shear of different position of
outrigger system; the highest base shear of 62516.3765kN is obtained for out trigger at 20th
story.
It is feasible to provide the Outrigger system at 20th
story for highest base shear, displacement of
1040.6mm.
With reference to capacity demand curve values in table 10, the structure has the spectral acceleration (Sa)
of 0.138m/s2, spectral displacement (Sd) of 403.7mm for the Outriggers at 20
th story.
The values obtained from capacity demand curve of outrigger system at 20th
story are within the
permissible limits.
REFERENCES
[1] P.M.B. Raj Kiran Nanduri, B.Suresh, MD. Ihtesham Hussain “Optimum Position of Outrigger System
for High-Rise Reinforced Concrete Buildings Under Wind And Earthquake Loadings” American Journal
of Engineering Research (AJER) Volume-02, Issue-08, pp-76-89
[2] Santhosh D, Pushover Analysis of RC frame structure using ETAB 9.7.1, IOSR journal of mechanical
and civil engineering
[3] (IOAS-JMCE)– Volume 11 issue 1-Feb 2014.
[4] Srinivasu A and Dr.Panduranga Rao.B, Non-Linear static analysis of multi-storied building, International
journal of engineering trends and technology (ILETT) – volume 4 issue 10-Oct 2013.
[5] M. Seifi., J. Noorzei., and M. S. Jaafar (2008).Nonlinear Static Pushover Analysis in Earthquake
Engineering: State of Development.ICCBT

International Journal of Advanced Technology in Engineering and Science www.ijates.com
Volume No.02, Issue No. 12, December 2014 ISSN (online): 2348 – 7550
339 | P a g e
[6] Chopra AK.Dynamics of structure: theory and application to earthquake engineering.(ERnglewood
cliffs,NJ:1995)
[7] FEMA-273 (1997),” NEHRP guidelines for the seismic rehabilitation of buildings”, developed by the
building seismic safety council for the federal emergency management agency , Washington D.C
[8] FEMA-356 (2000), Prestandard and commentary for the seismic rehabilitation of buildings
[9] ATC(1996), “seismic evaluation and retrofit of concrete buildings”, volume 1, applied technology
council (report no 40), redwood city, California
[10] IS 456-2000, Plain and reinforced concrete code of practice.
[11] IS 1893 (part 1):2002,”criteria for earthquake resistant design of structures” part 1 general provisions and
buildings