optimum design of mass exchange networks using pinch technology
TRANSCRIPT

e PergamonComputers and Chemical Engineering Supplement (1999) 5165-5168
o 1999 Elsevier Science lid. All rights reservedPII: 50098·1354199100129·5
Optimum Design of Mass ExchangeNetworks using Pinch Technology
N Hallale· and D. M. Fraser
Departmentof Chemical Engineering, Universityof CapeTown, PrivateBag, Rondebosch, 770I, South Africa
ABSTRACT
This paper discusses a new method for targeting the minimum capital and total costs of mass exchange networks.This method makes it possible to optimise total cost with respect to minimum driving force ahead of design. Themethod is applied to four literature problems which had previously been optimised using a mathematicalprogrammingapproach and shows that substantial improvements are possible. Networks can be designed to closelyapproach the optimised total annual cost target. Designs for the four problems using the new approach have totalannual costs which achieve this and are consistently lower than those of previousoptimum designs.
Keywords: Mass exchange networks, PinchTechnology,Optimisation, Capital cost targets
INTRODUCTION
El-Halwagi and Manousiouthakis (1989) first appliedpinch technology to mass exchange networksynthesis (MENS). These authors introduced the useof a minimum composition difference, e, which is
analogous to the minimum approach temperature inheat exchanger network synthesis (HENS). Theyshowed how specifying the value of C locates themass transfer pinch, which is a thermodynamicbottleneck for mass transfer between streams. Thisallows a target for the minimum flow rate of externalmass-separating agent (MSA) required by a networkto be determined. This target is analogous to theenergy target in HENS. Avoiding the transfer of massacross the pinch ensures that the MSA target is met indesign.
However, until recently, there have been no targets forcapitalcosts. The use of the minimum numberof unitswas recommended in an attempt to minimise thecapital cost. However, this does not necessarily give aminimum cost. The absenceof capital cost targets alsomeant that optimisation of the total cost (operatingpluscapital)could not be achieved by targeting alone.
There have been two main approaches aimed atminimising the total cost. The first approach usedMSA targeting combined with repeated networkdesignand costingover a rangeof C values in order to
trade off capital and operating costs (EI-Halwagi andManousiouthakis, 1990). The second approachappliedmixed-integer non-linear programming (MINLP) tooptimise a hyperstructure of possible mass transferoptions (Papalexandri et ai, 1994). Both approacheshave some drawbacks, with the result being thatneither can guarantee optimality. This paper describesthe results of a new, pinch-based approach, which hasbeen developed by the current authors. This approachnot only determines the optimum but also generatesdesigns which closelyapproachit.
CAPITAL COST TARGETS
The new approach is based on the recent developmentof capital cost targets for mass exchange networks(Hallale and Fraser, 1998a). This method is based on anew graphical representation termedthe y-x compositecurve plot (Figure I). This is a plot of rich streamcomposition versus lean stream composition andconsists of a composite operating line and the masstransfer equilibrium line. This new representationallowstargets to be predicted for the minimum numberof stages for stagewise systems (as demonstrated inFigure I), as well as for the minimum height incontinuous-contact systems. Details are givenelsewhere (Hallale, 1998; Hallale and Fraser, 1998a).These targets can be used with cost correlations inorderto predict a minimum capitalcost target.
• Presentaddress: Departmentof Process Integration,UMIST,PO Box 88, Manchester,M60 IQD, U.K.

5166
0.05 ·
0.045
0.04 ·
0.035
Y 0.03 ·
0.025
0.02
0.015
0.01
0.005
0
0
Computers and Chemical Engineering Supplement (/999) S/65-S/68
0.005 0.01 0.015 0.02 0.025 0.03 0.035 0.04 0.045 0.05
X
Figure 1: They-x compositecurve plot for a mass exchangenetwork.
TOTAL COST TARGETING
The real strength of the new targets is the ability tooptimise the total network cost ahead of any design.This is achieved by targeting both MSA and capitalcosts and then adding them (on an annual basis) toyield a total annual cost (TAC) target. This is repeatedover a range of range of F:values in order to locate theoptimum as shown in Figure 2 (which is theoptimisation for the coke-oven gas sweeteningproblem to be dealt with in the next section). Specialdesign techniques have been developed (Hallale, 1998;Hallale and Fraser, 1998a) which then allow theseoptimised targets to be closely approached in design.These techniques are largely insight-based and drivenby the user.
APPLICATIONS
This method has been applied to four literatureproblems which had previously been optimised usingMINLP (Papalexandri et al, 1994). These problemscover a wide range of MENS problems: the copperrecovery problem involves two MSAs, the coke-oven
gas sweetening problem involves transferring multiplecomponents, the dephenolisation in coal conversionproblem involves simultaneous mass exchange andregeneration network design, and the rayon wastedesulphurisation problem involves reactive massexchangeand non-linearequilibria. The results for thecoke-ovengas sweetening problem will be shown hereto illustrate howthey differ fromthe MINLP results.
0.0005 0.001 0.0015 0.002 0.0025 0.003 0.0035 O.oot£;
700000
600000.
....?:> 500000~....
400000 .VI0utii
300000 .='cc<: 200000
100000
0
0
Optimum
I Operat ing
Annual capital
COpl
Figure 2: Optimisationof a mass exchange network beforedesign.
Computers and Chemical Engineering Supplement (1999) SJ65-SJ68 5167
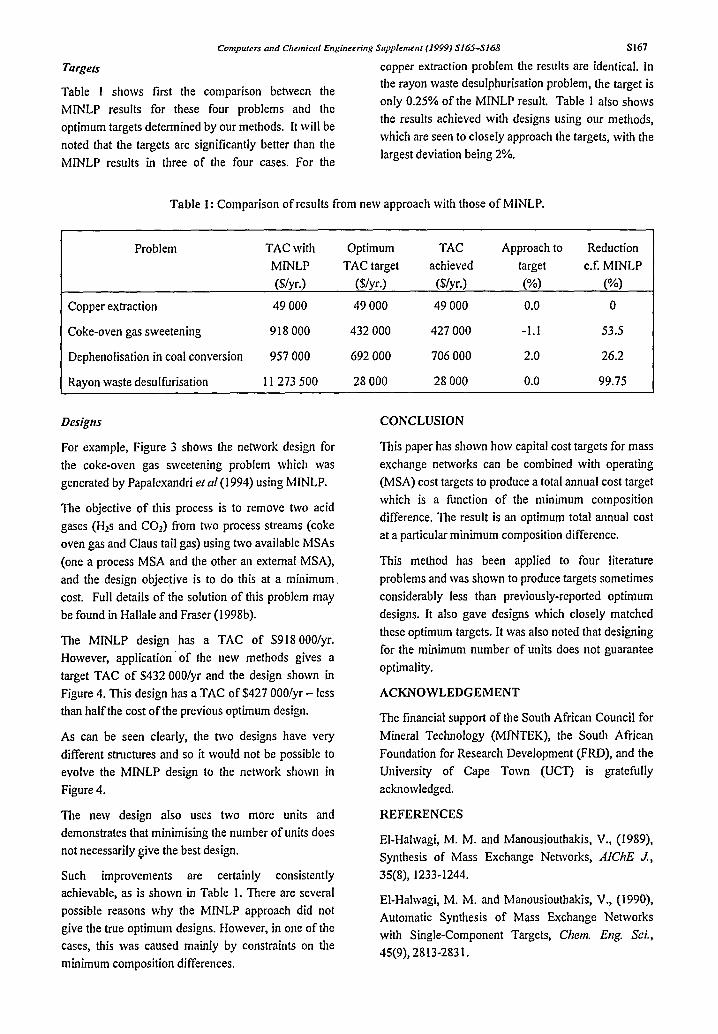
Targets
Table I shows first the comparison between the
MINLP results for these four problems and the
optimum targets determined by our methods. It will be
noted that the targets are significantly better than the
MINLP results in three of the four cases. For the
copper extraction problem the results are identical. In
the rayon waste desulphurisation problem, the target is
only 0.25% of the MINLP result. Table I also shows
the results achieved with designs using our methods,
which are seen to closely approach the targets, with the
largest deviation being 2%.
Table I: Comp arison ofresults from new approach with those of MINLP.
Problem TACwith Optimum TAC Approach to Reduction
MINLP TAC target achieved target c.f MINLP
($/yr.) ($/yr.) (S/yr.) (%) (%)
Copper extraction 49000 49000 49000 0.0 a
Coke-oven gas sweetening 918000 432 000 427 000 -I.l 53.5
Dephenolisation in coal conversion 957 000 692 000 706000 2.0 26.2
Rayon waste desulfurisation I 1273500 28000 28000 0.0 99.75
Designs
For example, Figure 3 shows the network design for
the coke-oven gas sweetening problem which was
generated by Papalexandri et of (1994) using MINLP.
The objective of this process is to remove two acid
gases (H2s and CO2) from two process streams (coke
oven gas and Claus tail gas) using two available MSAs
(one a process MSA and the other an external MSA),
and the design objective is to do this at a minimum .
cost. Full details of the solution of this problem may
be found in Hallale and Fraser (1998b) .
TIle MINLP design has a TAC of $918 aDO/yr.
However, application' of the new methods gives a
target TAC of $432 OOO/yr and the design shown in
Figure 4. This design has a TAC of$427 OOO/yr-less
than half the cost of the previous optimum design.
As can be seen clearly, the two designs have very
different structures and so it would not be possible to
evolve the MINLP design to the network shown in
Figure 4.
The new design also uses two more units and
demonstrates that minimising the number of units does
not necessarily give the best design.
Such improvements are certainly consistently
achievable, as is shown in Table l. There are several
possible reasons why the MINLP approach did not
give the true optimum designs. However, in one of the
cases, this was caused mainly by constraints on the
minimum composition differences.
CONCLUSION
This paper has shown how capital cost targets for mass
exchange networks can be combined with operating
(MSA) cost targets to produce a total annual cost target
which is a function of the minimum composition
difference. The result is an optimum total annual cost
at a particular minimum composition difference .
This method has been applied to four literature
problems and was shown to produce targets sometimes
considerably less than previously-reported optimum
designs. It also gave designs which closely matched
these optimum targets. It was also noted that designing
for the minimum number of units does not guarantee
optimality.
ACKNOWLEDGEMENT
The financial support of the South African Council for
Mineral Technology (MINTEK), the South African
Foundation for Research Development (FRO), and the
University of Cape Town (UCT) is gratefully
acknowledged.
REFERENCES
EI-Halwagi, M. M. and Manousiouthakis, V., (1989),
Synthesis of Mass Exchange Networks, A/ChE J.,
35(8), 1233-1244.
EI-Halwagi, M. M. and Manousiouthakis, V., (1990),
Automatic Synthesis of Mass Exchange Networks
with Single-Component Targets, Chern. Eng. Sci.,45(9),2813·283 I.

5\68 Computers and Chemical Engineering Supplement (1999) SI65--s168
Hallale, N., (1998), Capital Cost Targets for theOptimum Synthesisof Mass ExchangeNetworks, PhDThesis, Universityof Cape Town.
Hallale, N. and Fraser, D. M., (1998a), Capital CostTargets for Mass Exchange Networks - A SpecialCase: Water Minimisation, Chern. Eng. Sci., 53(2),
293-313.
Hallale, N, and Fraser, D. M., (199gb), Synthesis ofaCost-Optimum Gas treating Process Using PinchAnalysis,Advances in Environmental Research, 2(2),
167-178.
Papalexandri, K. P., Pistikopoulos, E. N., and Floudas,C. A., (1994), Mass Exchange Networks for WasteMinimisation: A Simultaneous Approach, Trans
/ChemE (Part A), 72, 279-294.
Flowrate
0.07 (kg/s)
0.060.9R.
0.0510.115 §] 0.1
0.0006 0.0251
SIa 0.023 2.3
0.0035 3 stages
0.003
ITAe =$918 OOO/yr·13.47
3}------------+--------
~--{ 2)--------------{
0.00010.0002
0.00030.00006
3 stages
Figur e 3: Optimum MINLP design for coke-oven gas sweeteningproblem (from Papalexandri et al, /99 4).
Flowrate
0.0003 0.0013 0:051(kg/s)
0.070.000058 0.00011 0.0103 0.06
~0.95 3
0.0001 0.0013 0.0510.000003 0.00011 0.115
4 2 Rz 0.1
0.D310.030
2.20
9 stages I stage
0.0035 9 stages0.00018 TargetTAC = $432 OOO/yr. 0.315
ActualTAC = $427 ODD/yr.
2 stages 4 stages
Figure 4: Design for coke-oven gas sweetening problem using newmethods.