optimizing your cloud applications in rightscale
TRANSCRIPT
Optimizing Your Cloud Applications in RightScale
October 13, 2011
Watch the video of this webinar

# 2
Your Panel TodayPresenting• Rafael H. Saavedra, VP Engineering, RightScale• Raphael Simon, Sr. Systems Architect, RightScale
Q&A • Jordan Evans, Account Manager, RightScale
Please use the “Questions” window to ask questions any time!
# 3
Agenda• Introduction• 3-tier application architecture• Vertical & horizontal scaling• RightScale monitoring and cluster graphs• New Relic RPM• Support for optimizing DB performance• Load testing
Please use the “Questions” window to ask questions any time!
# 4
• Multi-tenancy• Shared resource pooling• Geo-distribution and ubiquitous network access• Service oriented• Dynamic resource provisioning• Self-organizing• Utility based pricing
Cloud computing characteristics
# 5
• No upfront investment• Lowering operating costs• Highly scalable• Easy access• Reduces business risk and maintenance costs• Enables process automation
Cloud computing advantages
# 6
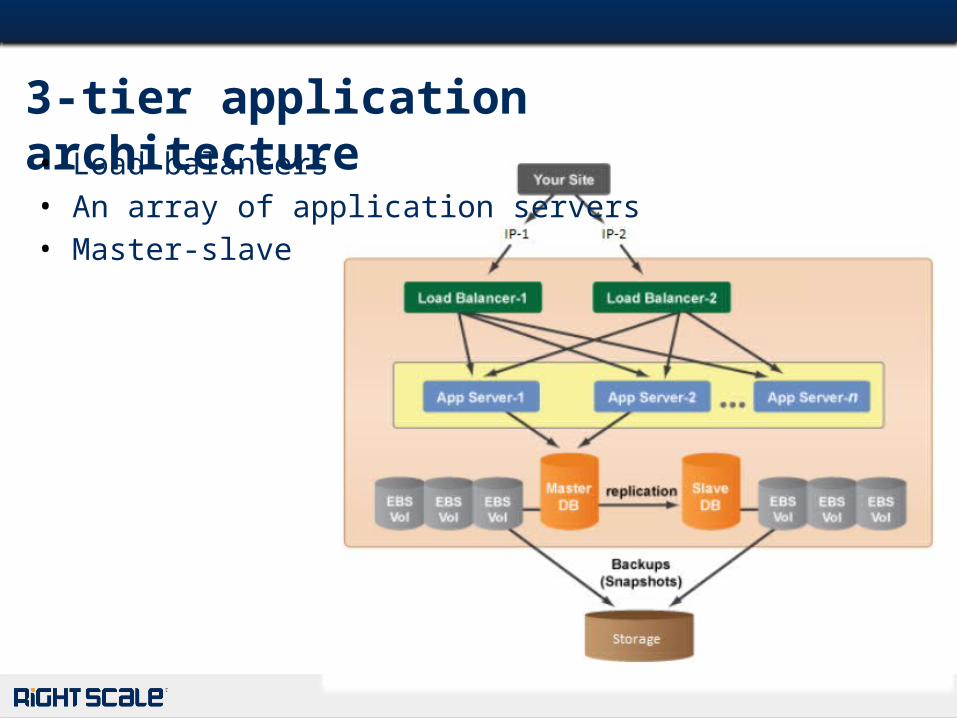
3-tier application architecture• Load balancers• An array of application servers• Master-slave
Optimizing Your Cloud Applications in RightScale
Vertical & Horizontal Scaling
# 8
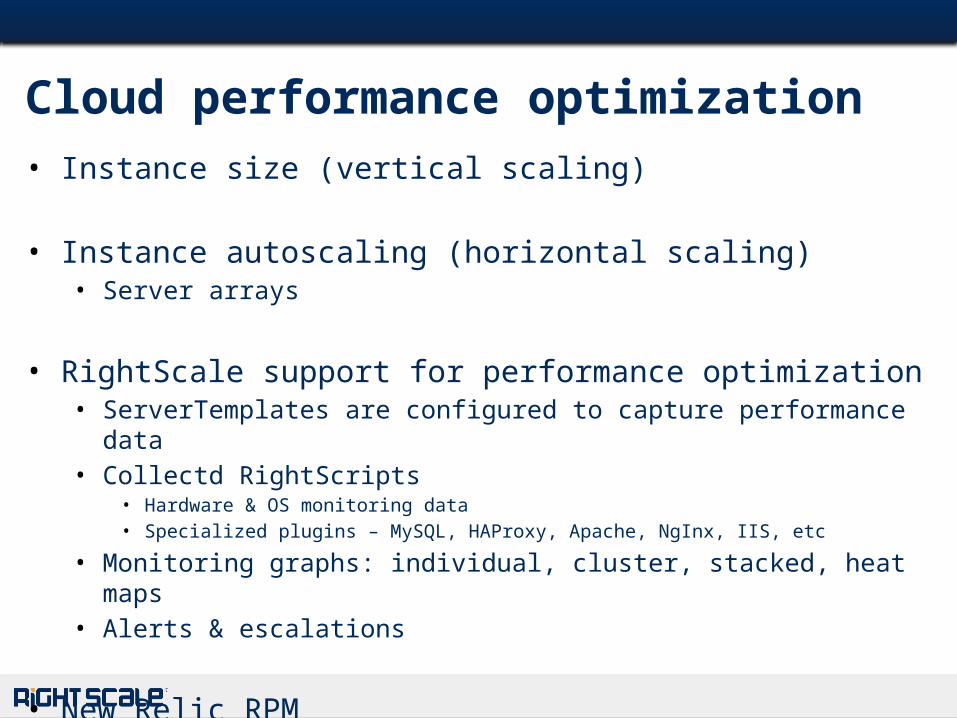
• Instance size (vertical scaling)
• Instance autoscaling (horizontal scaling)• Server arrays
• RightScale support for performance optimization• ServerTemplates are configured to capture performance data• Collectd RightScripts
• Hardware & OS monitoring data• Specialized plugins – MySQL, HAProxy, Apache, NgInx, IIS, etc
• Monitoring graphs: individual, cluster, stacked, heat maps• Alerts & escalations
• New Relic RPM
Cloud performance optimization
# 9
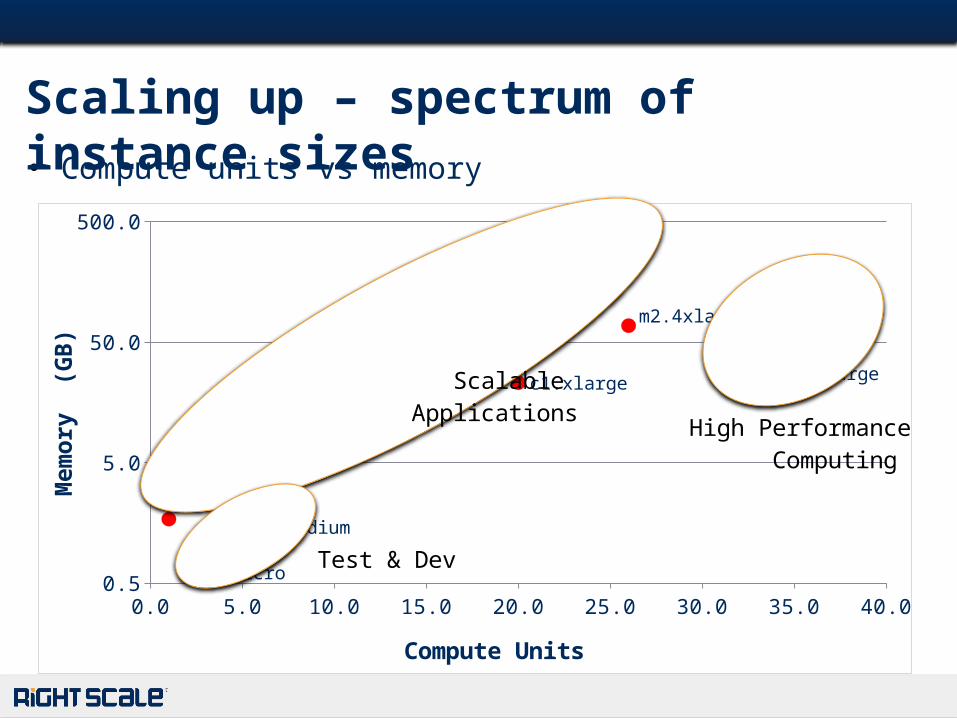
• Compute units vs memory
Scaling up – spectrum of instance sizes
0.0 5.0 10.0 15.0 20.0 25.0 30.0 35.0 40.00.5
5.0
50.0
500.0
t1.micro
m1.small
m1.large m1.xlarge
m2.xlarge
m2.2xlarge
m2.4xlarge
c1.medium
c1.xlargecc1/cg1.4xlarge
Compute Units
Mem
ory
(G
B)
High Performance Computing
Test & Dev
Scalable Applications
# 10
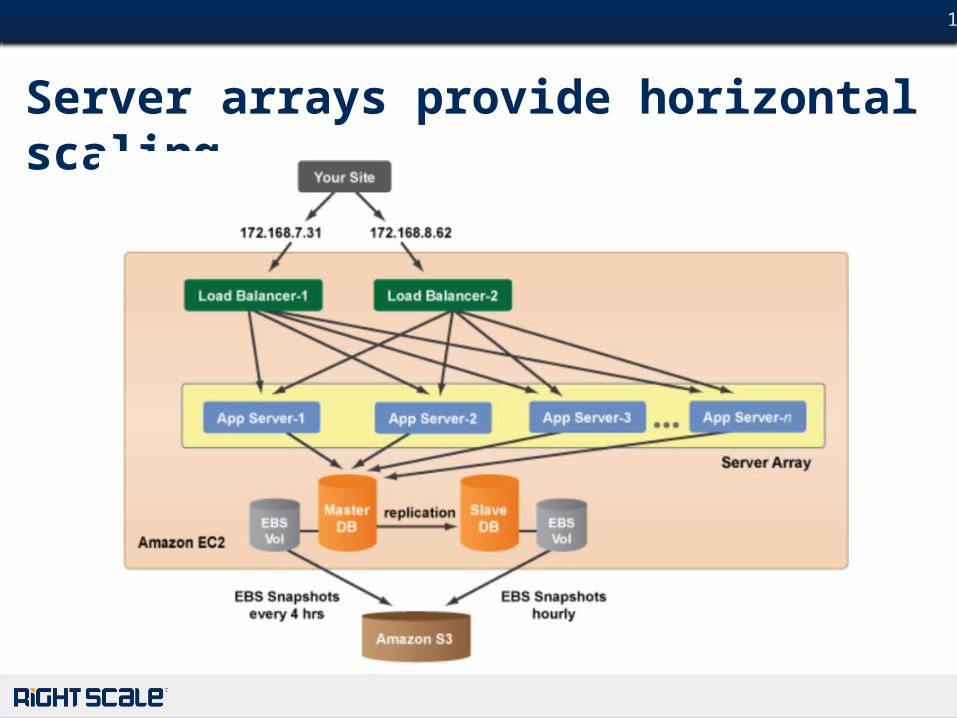
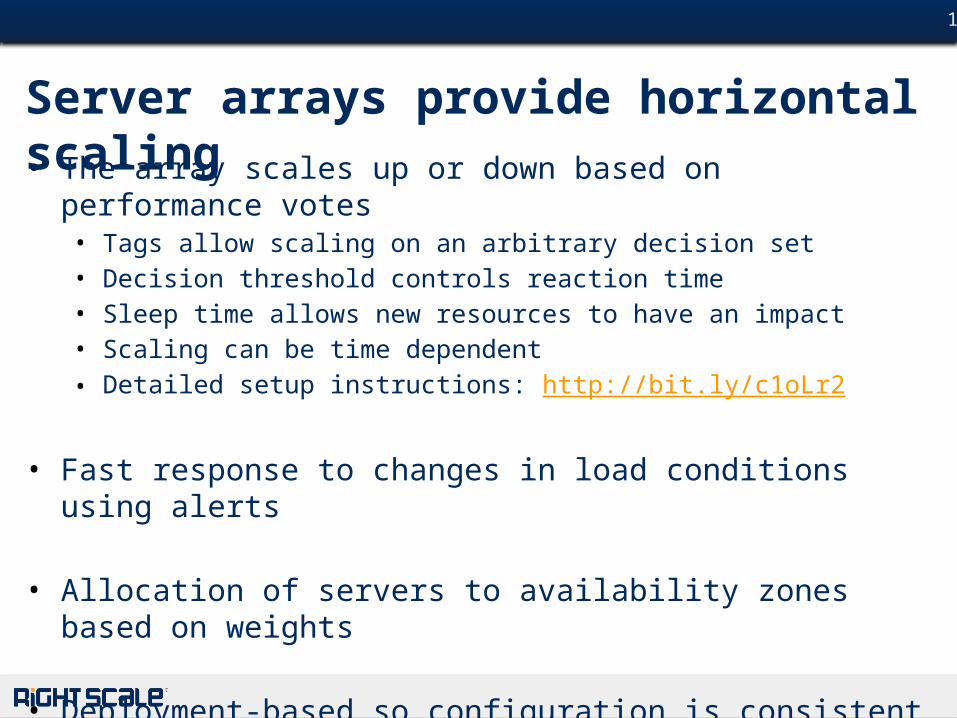
Server arrays provide horizontal scaling
# 11
• The array scales up or down based on performance votes• Tags allow scaling on an arbitrary decision set• Decision threshold controls reaction time• Sleep time allows new resources to have an impact• Scaling can be time dependent• Detailed setup instructions: http://bit.ly/c1oLr2
• Fast response to changes in load conditions using alerts
• Allocation of servers to availability zones based on weights
• Deployment-based so configuration is consistent
• Arrays can be pre-scaled to support anticipated demand
Server arrays provide horizontal scaling
Optimizing Your Cloud Applications in RightScale
Monitoring & Cluster Graphswith RightScale
# 13
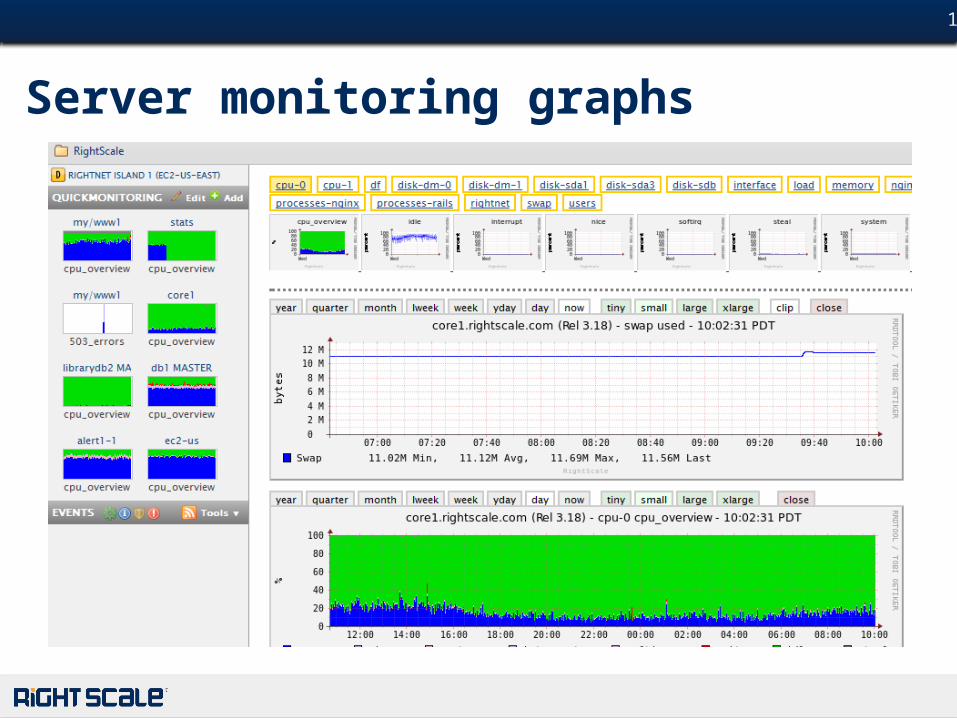
Server monitoring graphs
# 14
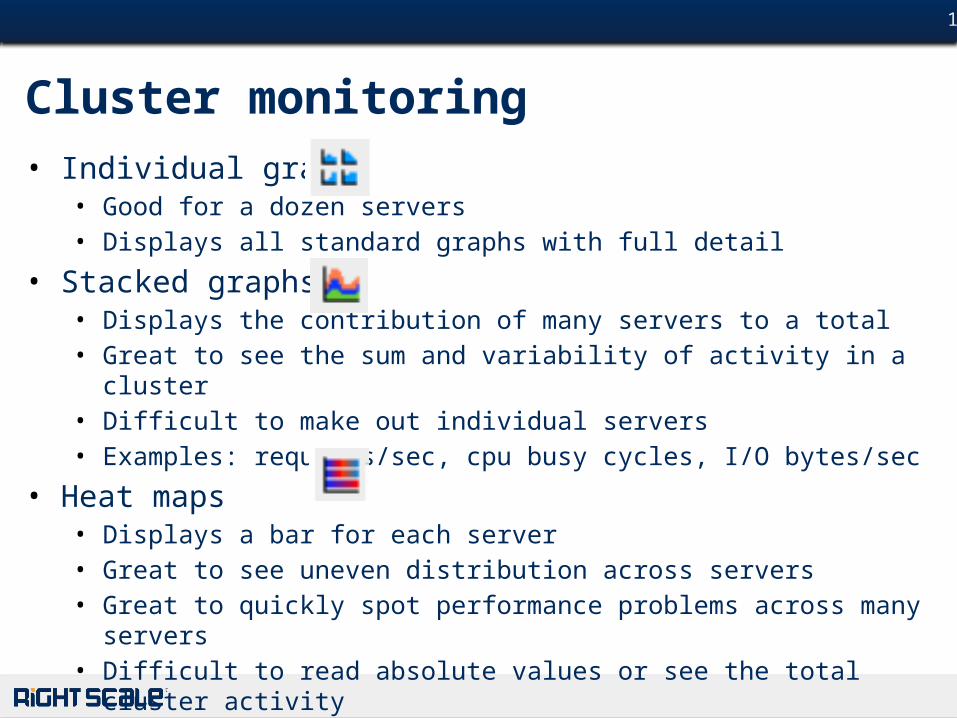
Cluster monitoring• Individual graphs
• Good for a dozen servers• Displays all standard graphs with full detail
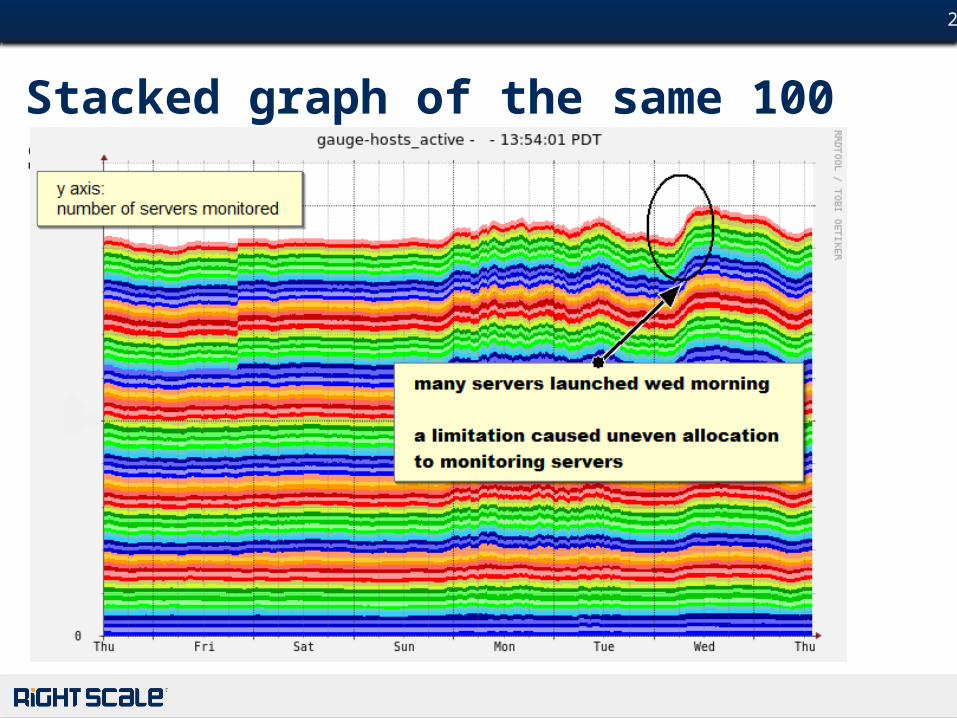
• Stacked graphs• Displays the contribution of many servers to a total• Great to see the sum and variability of activity in a cluster• Difficult to make out individual servers• Examples: requests/sec, cpu busy cycles, I/O bytes/sec
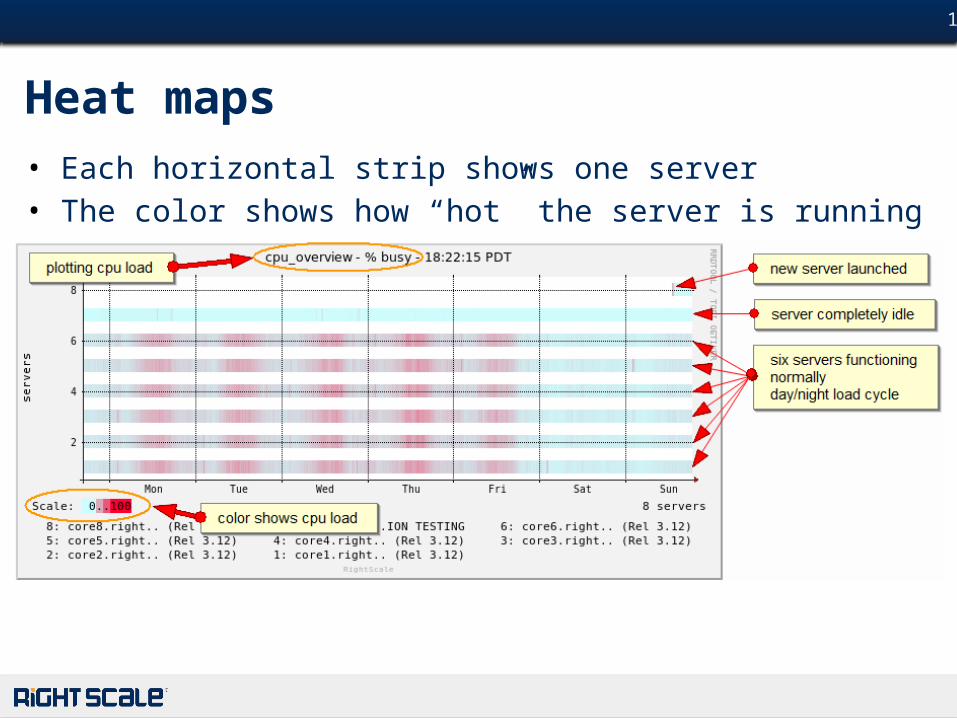
• Heat maps• Displays a bar for each server• Great to see uneven distribution across servers• Great to quickly spot performance problems across many servers• Difficult to read absolute values or see the total cluster activity
# 15
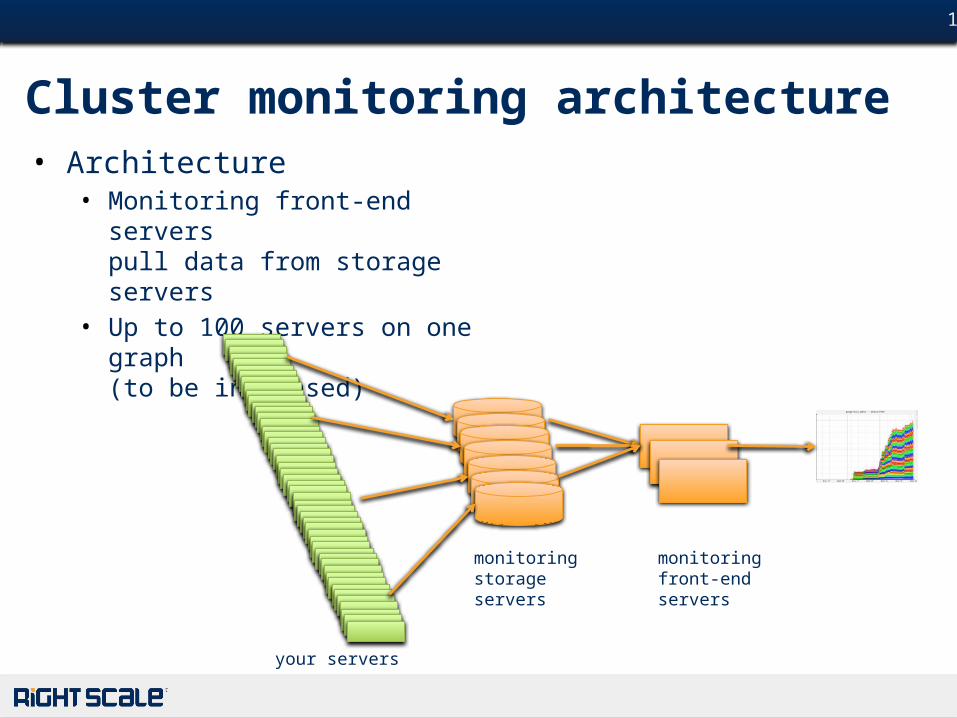
Cluster monitoring architecture• Architecture
• Monitoring front-end serverspull data from storage servers
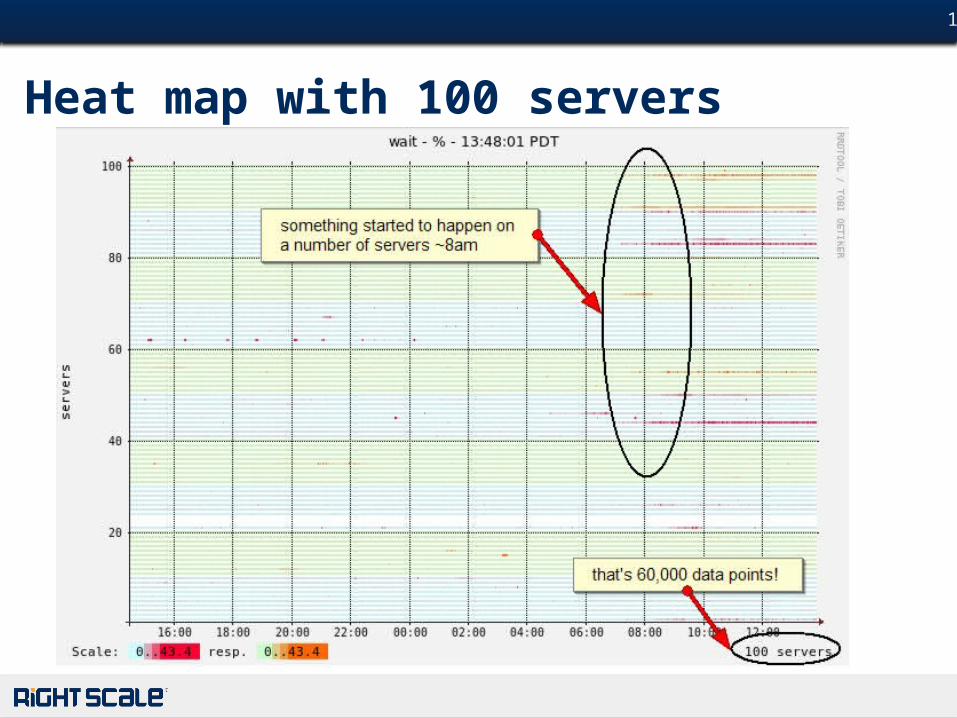
• Up to 100 servers on one graph(to be increased)
your servers
monitoringstorageservers
monitoringfront-endservers
# 16
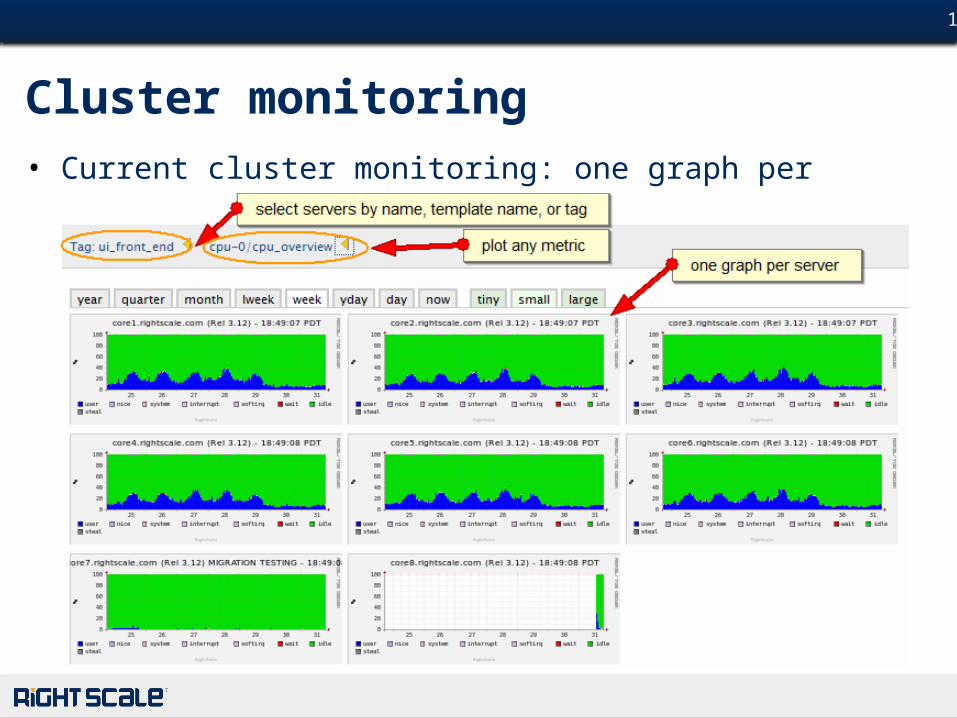
Cluster monitoring• Current cluster monitoring: one graph per server
# 17
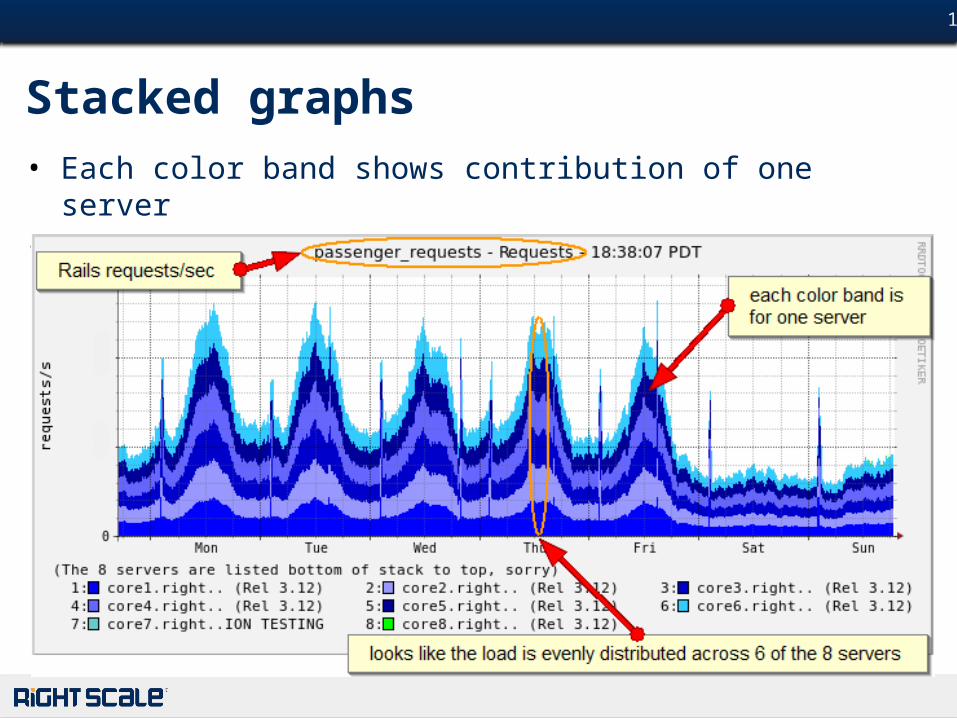
Stacked graphs• Each color band shows contribution of one server• Servers are stacked on top of one another
# 18
Heat maps• Each horizontal strip shows one server• The color shows how “hot” the server is running
# 19
Heat map with 100 servers
# 20
Stacked graph of the same 100 servers
Optimizing Your Cloud Applications in RightScale
Application Performance Analytics with New Relic
# 22
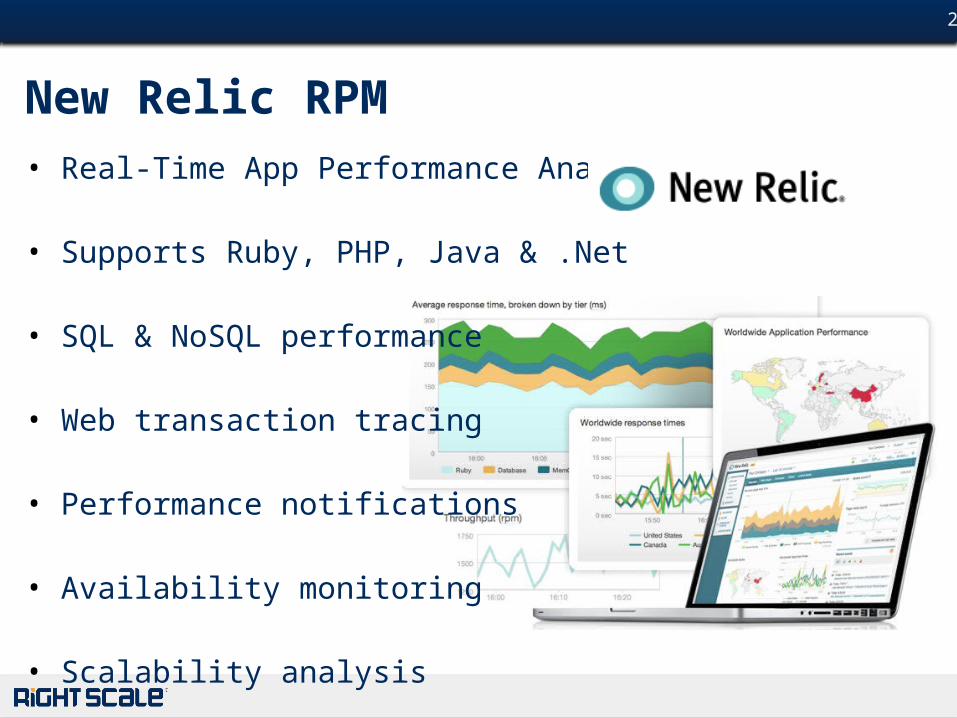
• Real-Time App Performance Analytics
• Supports Ruby, PHP, Java & .Net
• SQL & NoSQL performance
• Web transaction tracing
• Performance notifications
• Availability monitoring
• Scalability analysis
New Relic RPM
# 23
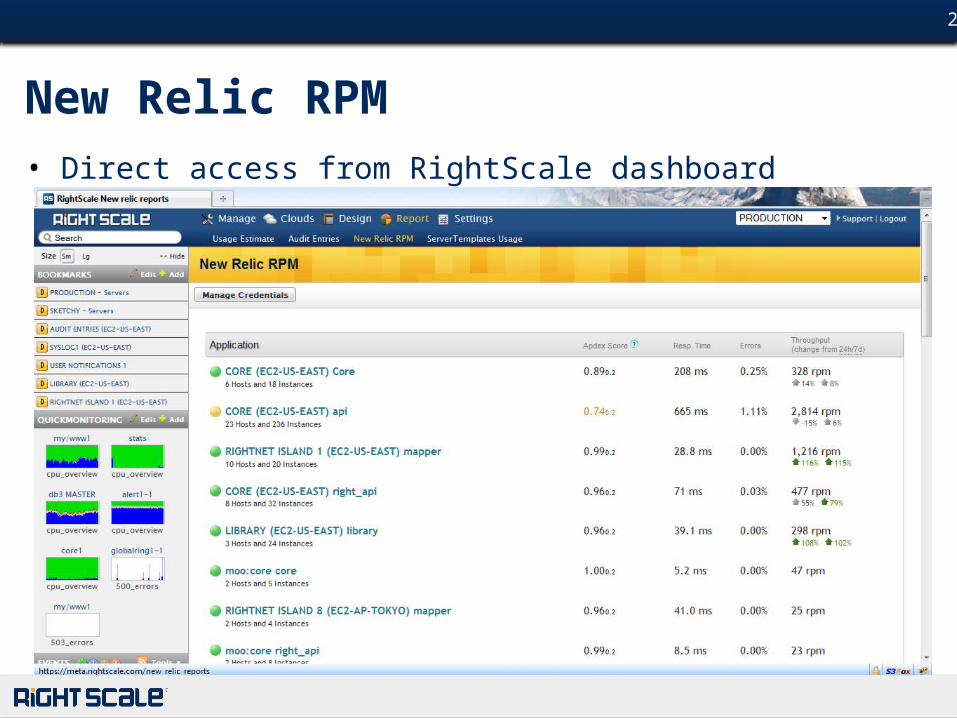
New Relic RPM• Direct access from RightScale dashboard
# 24
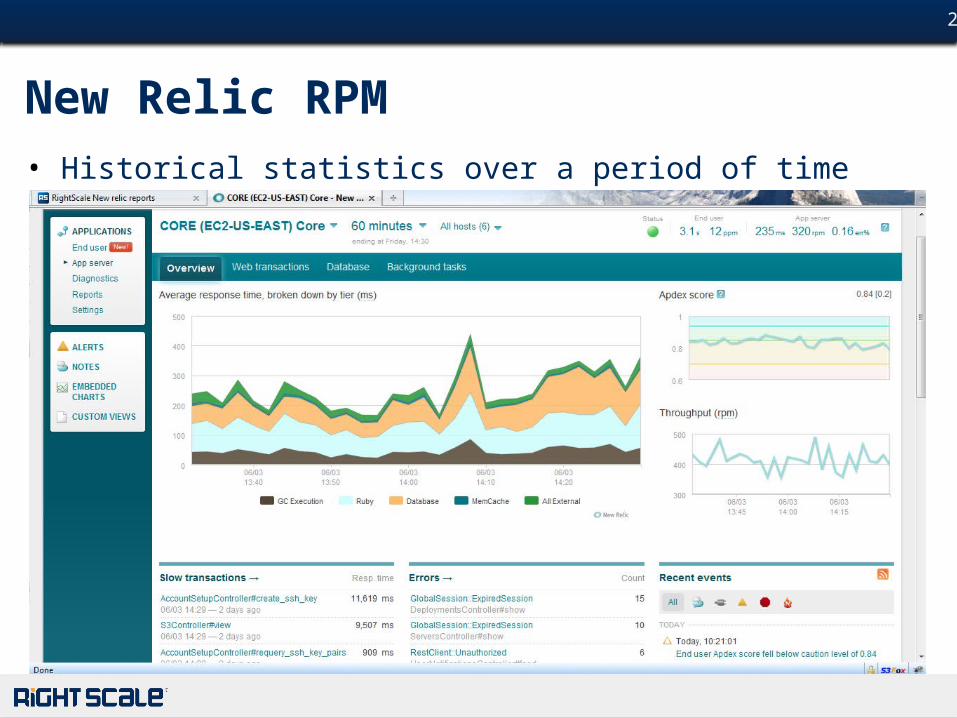
New Relic RPM• Historical statistics over a period of time
# 25
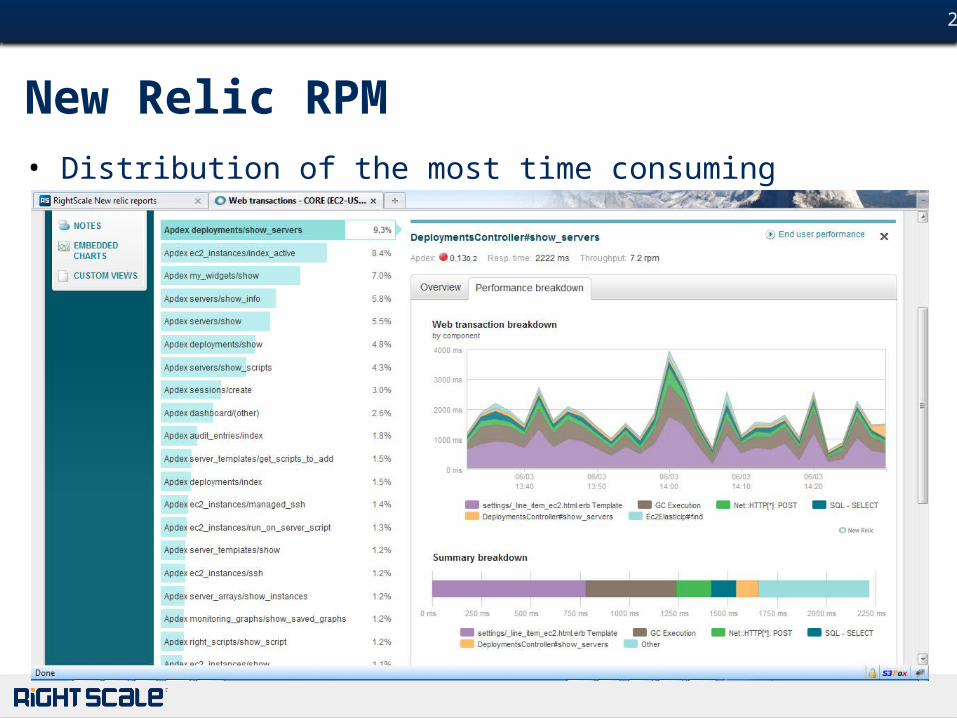
New Relic RPM• Distribution of the most time consuming requests
# 26
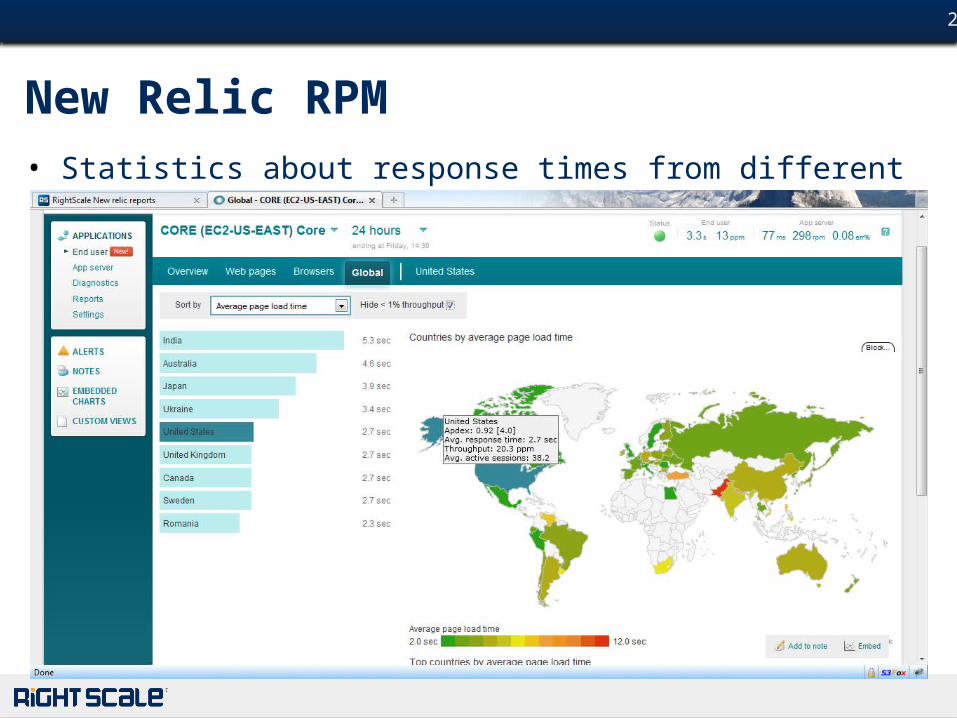
New Relic RPM• Statistics about response times from different countries
# 27
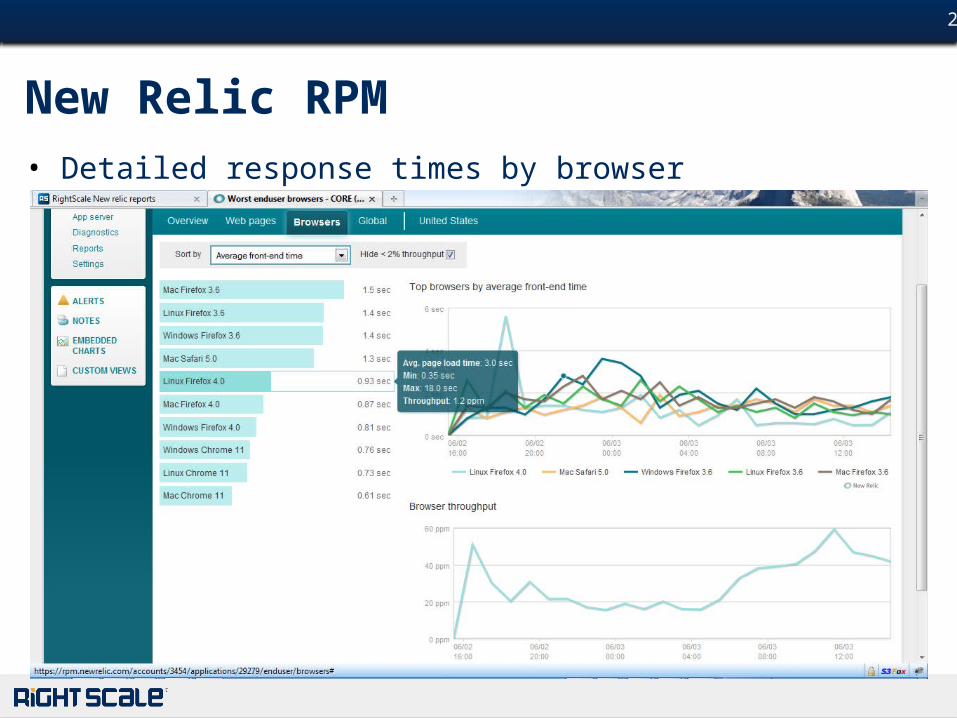
New Relic RPM• Detailed response times by browser
# 28
• An expensive query
• The N+1 query problem
New Relic RPM – 2 Examples
Optimizing Your Cloud Applications in RightScale
Optimizing Database Performance
# 30
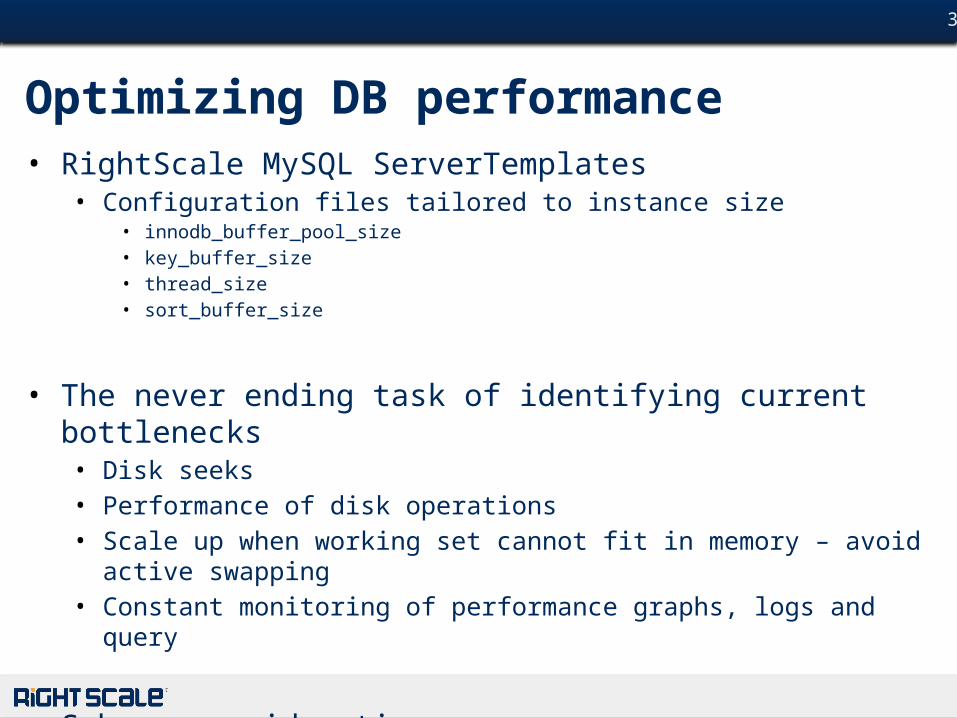
Optimizing DB performance• RightScale MySQL ServerTemplates
• Configuration files tailored to instance size• innodb_buffer_pool_size• key_buffer_size• thread_size• sort_buffer_size
• The never ending task of identifying current bottlenecks• Disk seeks• Performance of disk operations• Scale up when working set cannot fit in memory – avoid active swapping• Constant monitoring of performance graphs, logs and query
• Schema considerations
# 31
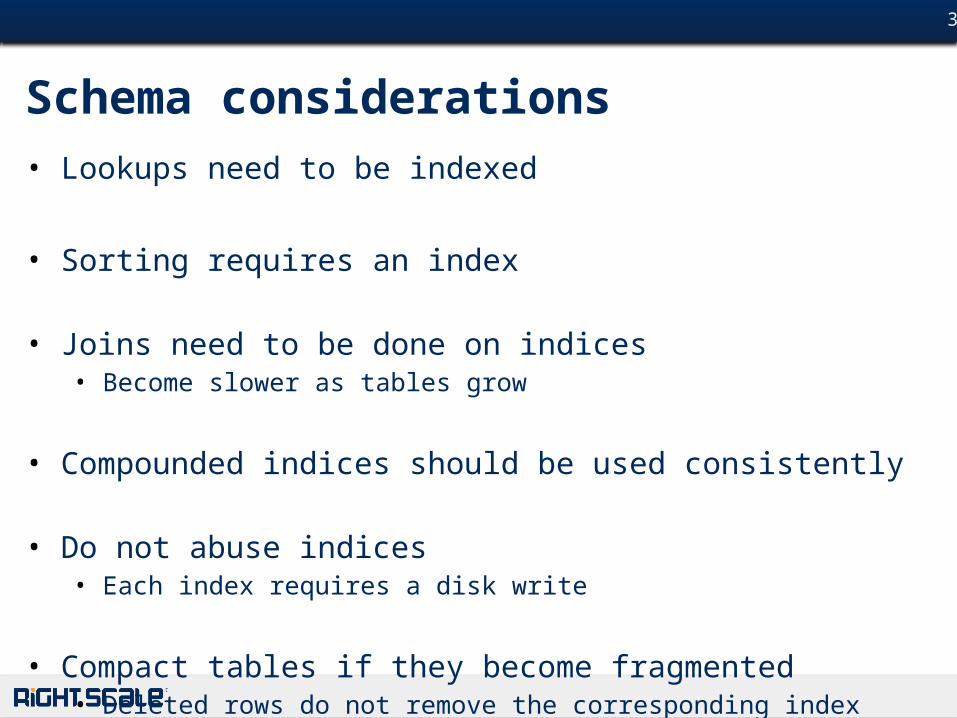
Schema considerations• Lookups need to be indexed
• Sorting requires an index
• Joins need to be done on indices• Become slower as tables grow
• Compounded indices should be used consistently
• Do not abuse indices• Each index requires a disk write
• Compact tables if they become fragmented• Deleted rows do not remove the corresponding index entries
# 32
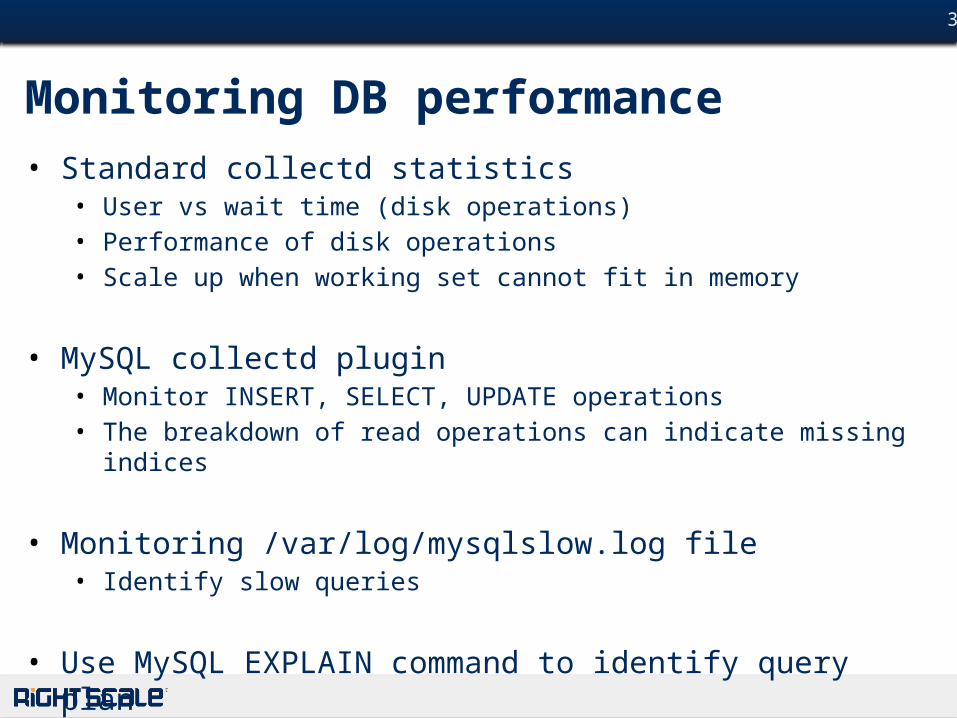
Monitoring DB performance• Standard collectd statistics
• User vs wait time (disk operations)• Performance of disk operations• Scale up when working set cannot fit in memory
• MySQL collectd plugin• Monitor INSERT, SELECT, UPDATE operations• The breakdown of read operations can indicate missing indices
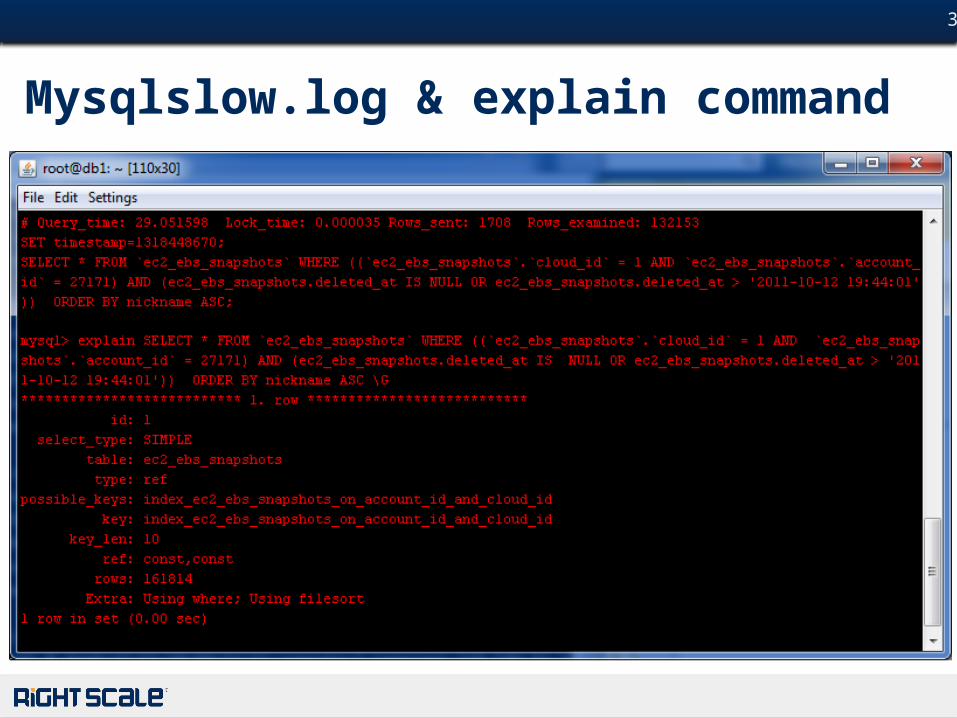
• Monitoring /var/log/mysqlslow.log file• Identify slow queries
• Use MySQL EXPLAIN command to identify query plan
# 33
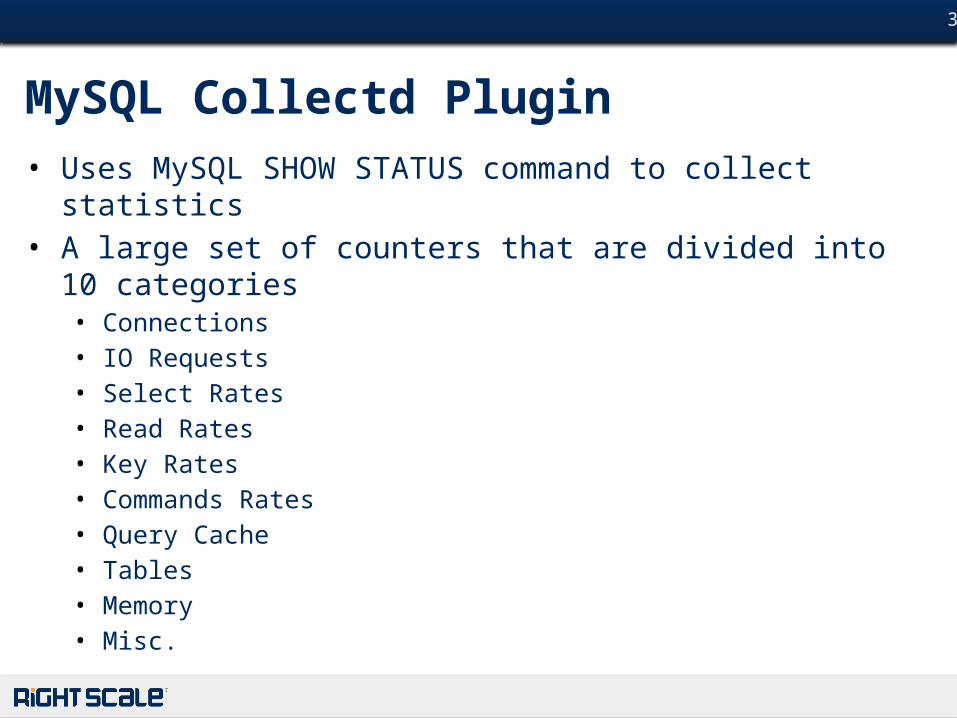
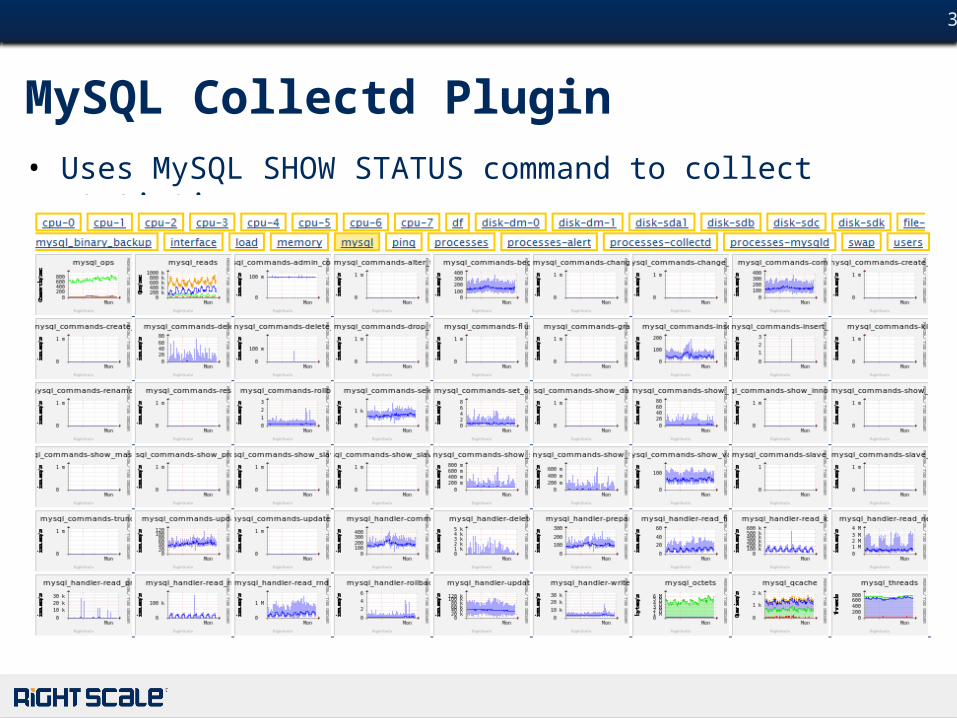
MySQL Collectd Plugin• Uses MySQL SHOW STATUS command to collect statistics• A large set of counters that are divided into 10 categories
• Connections• IO Requests• Select Rates• Read Rates• Key Rates• Commands Rates• Query Cache• Tables• Memory• Misc.
# 34
MySQL Collectd Plugin• Uses MySQL SHOW STATUS command to collect statistics
# 35
Mysqlslow.log & explain command
# 36
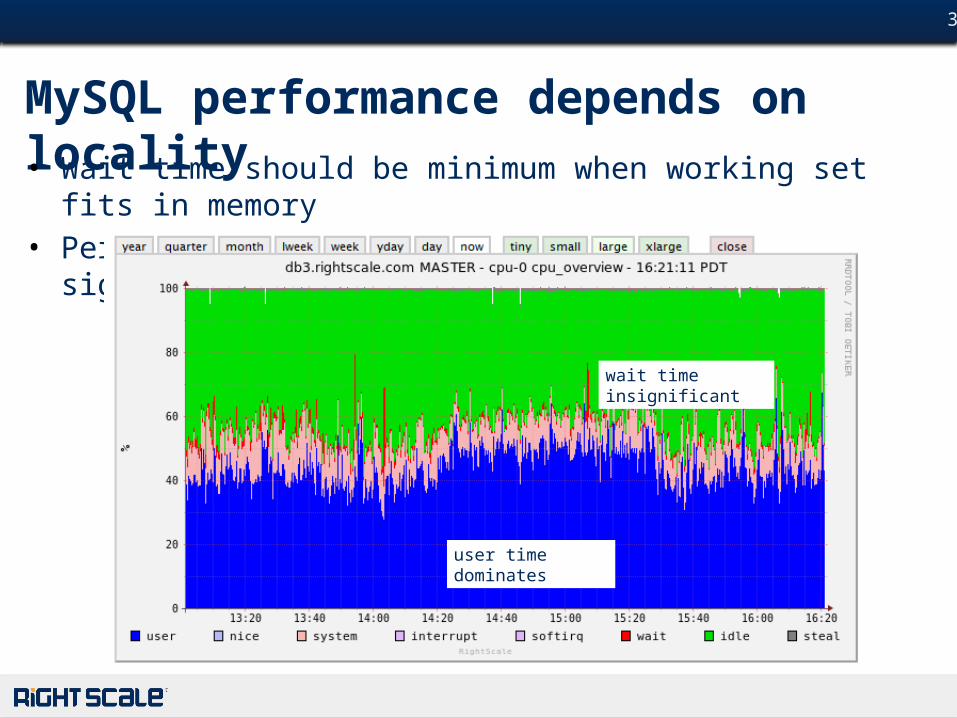
MySQL performance depends on locality• Wait time should be minimum when working set fits in memory• Performance degrades once wait time is significant
user time dominates
wait time insignificant
# 37
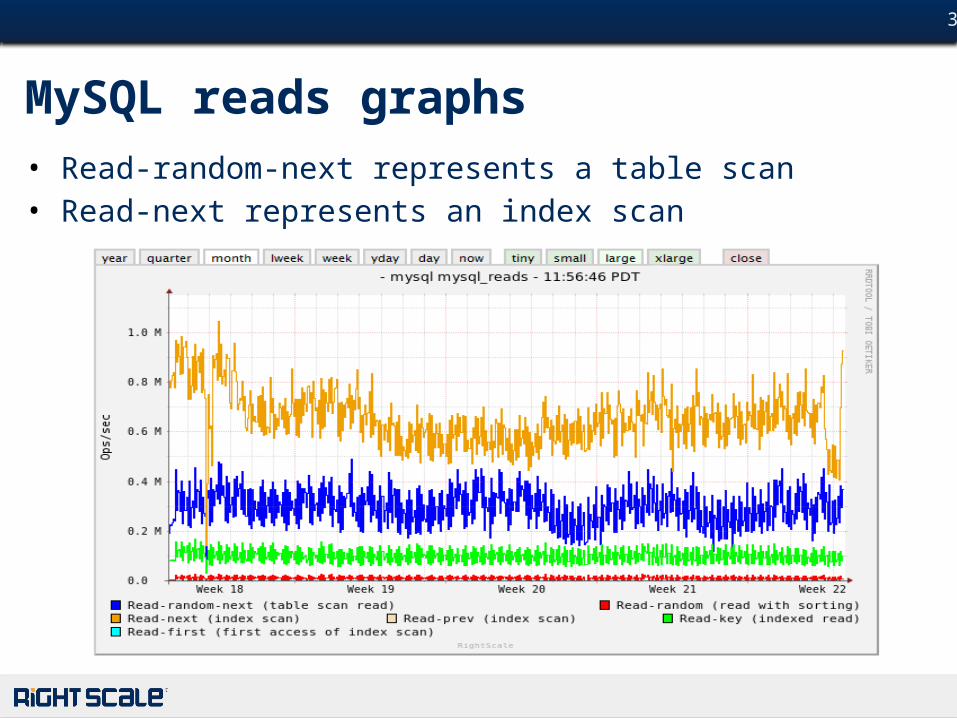
MySQL reads graphs• Read-random-next represents a table scan• Read-next represents an index scan
Optimizing Your Cloud Applications in RightScale
Load Testing
# 39
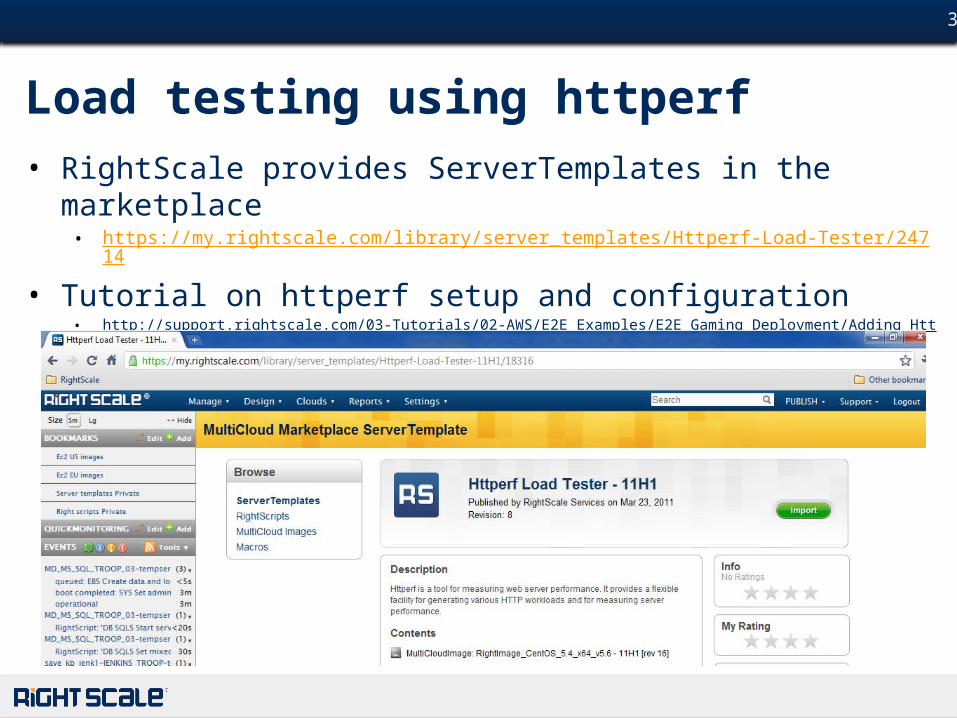
Load testing using httperf• RightScale provides ServerTemplates in the marketplace
• https://my.rightscale.com/library/server_templates/Httperf-Load-Tester/24714
• Tutorial on httperf setup and configuration• http://support.rightscale.com/03-Tutorials/02-AWS/E2E_Examples/E2E_Gaming_Deployment/Adding_Httperf_Load_Tester
# 40
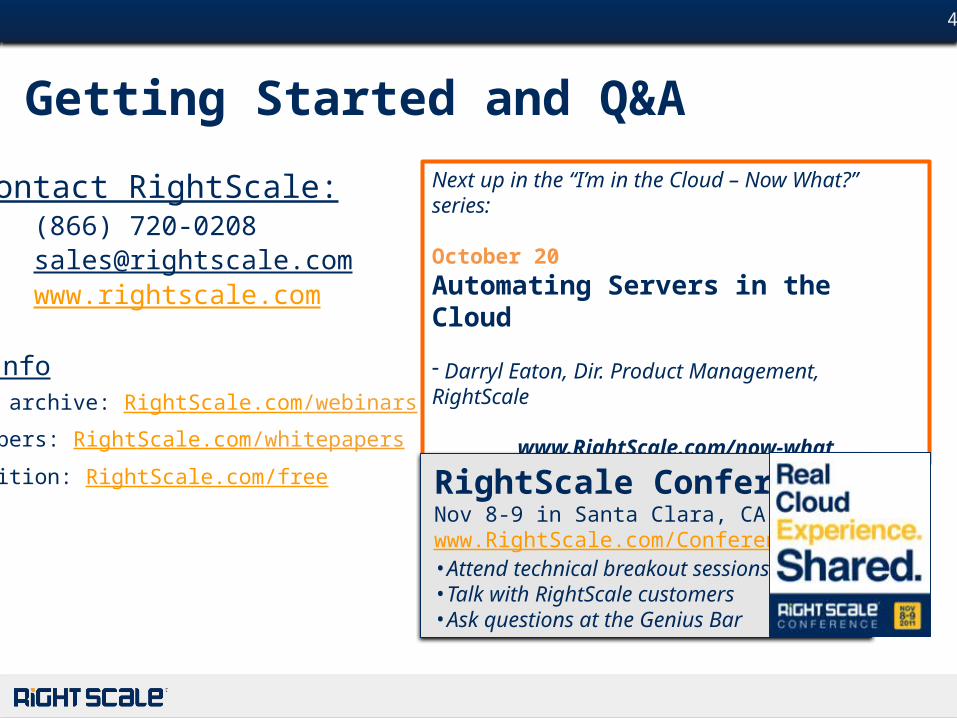
Getting Started and Q&A
Contact RightScale:(866) [email protected] www.rightscale.com
More InfoWebinar archive: RightScale.com/webinars
Whitepapers: RightScale.com/whitepapers
Free Edition: RightScale.com/free
Next up in the “I’m in the Cloud – Now What?” series:
October 20Automating Servers in the Cloud
- Darryl Eaton, Dir. Product Management, RightScale
www.RightScale.com/now-what
RightScale ConferenceNov 8-9 in Santa Clara, CAwww.RightScale.com/Conference•Attend technical breakout sessions•Talk with RightScale customers•Ask questions at the Genius Bar