optimizing the work environment using lean and …
TRANSCRIPT

OPTIMIZING THE WORK ENVIRONMENTUSING LEAN AND CONTINUOUSIMPROVEMENT TOOLS-PRINTING FLOOR
MANIVANNAN SAMPATHnovembro de 2018
OPTIMIZING THE WORK ENVIRONMENT USING LEAN AND
CONTINUOUS IMPROVEMENT TOOLS-PRINTING FLOOR
Manivannan Sampath
2018
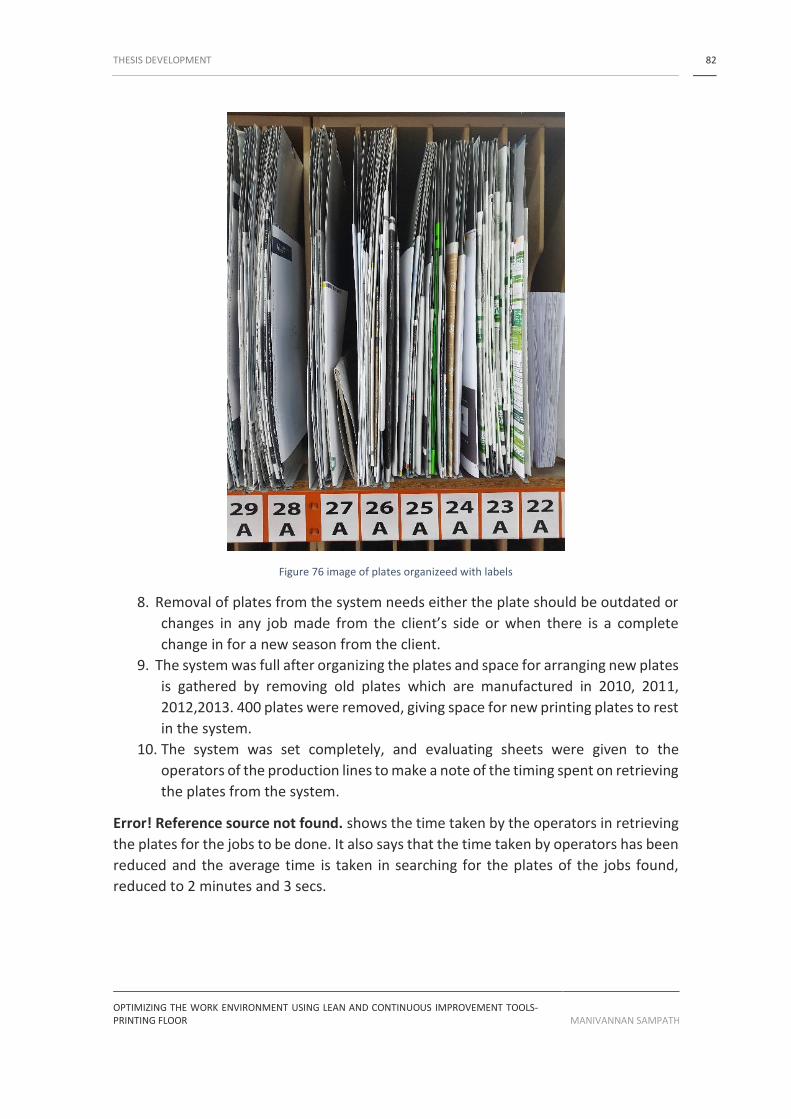
ISEP ndash School of Engineering Polytechnic of Porto
Department of Mechanical Engineering
OPTIMIZING THE WORK ENVIRONMENT USING LEAN AND
CONTINUOUS IMPROVEMENT TOOLS-PRINTING FLOOR
Manivannan Sampath
1160455
Dissertation presented to ISEP ndash School of Engineering to fulfill the requirements
necessary to obtain a masterrsquos degree in mechanical engineering carried out under the
guidance of Professor Raul Duarte Salgueiral Gomes Campilho and Professor Francisco
Jose Gomes da Silva
2018
ISEP ndash School of Engineering Polytechnic of Porto
Department of Mechanical Engineering
OPTIMIZING THE WORK ENVIRONMENT USING LEAN AND CONTINUOUS IMPROVEMENT TOOLS-PRINTING FLOOR MANIVANNAN SAMPATH
JURY
President
Sandra Cristina de Faria Ramos
Adjunct Professor ISEP
Supervisor
Raul Duarte Salgueiral Gomes Campilho
Adjunct professor ISEP
Second supervisor
Francisco Jose Gomes da Silva
Adjunct professor ISEP
Examiner
Ana Margarida Araujo Barros Fonseca
Associated Professor UFP
OPTIMIZING THE WORK ENVIRONMENT USING LEAN AND CONTINUOUS IMPROVEMENT TOOLS-PRINTING FLOOR MANIVANNAN SAMPATH
ACKNOWLEDGEMENTS
I would like to express my sincere gratitude to everyone who has contributed to the
completion of this work
Thanks to professor Raul Duarte Salgueiral Gomes Campilho for guiding in the
completion of the work company Marsil Graphic Arts Ltd Antoacutenio Andreacute da Costa
Moreira for giving me the opportunity as internship and finding help in the
implementation of works workers of Marsil
Finally I thank my friends and my family for the support and advice provided during the
completion of this Master thesis
ABSTRACT IX
OPTIMIZING THE WORK ENVIRONMENT USING LEAN AND CONTINUOUS IMPROVEMENT TOOLS-PRINTING FLOOR MANIVANNAN SAMPATH
KEYWORDS
5s PDCA SMED waste Muda lean and continuous improvement tools
ABSTRACT
The study aims at solving the problems reported by the management using lean tools
and continuous improvement tools The purpose of using a lean tool is to configure the
working process involved in production thereby reducing waste periodically The tool
also aims at improving the flow of process resulting in reducing the uneven workflow
throughout the floor The pull system from Kanban also found to improvise flow of
materials at the production floor The continuous improvement tool helps in
streamlining works related to implementing works and reducing waste In this work the
implementation of 5s has found its use in creating a tool room and tool chart along with
a pull system introduced for the tools at the pegboard The use of Kanban cards as pull
system at tool chart for the tool is to monitor the flow of tool to the production units at
the printing floor The implementation of 5s in paint room is to organize the ink tins used
for setup activity in the production process and to make the ink tins easier to find for
the operator PDCA (plan do check act) cycle one of the continuous improvement tools
implemented for organizing the printing plates into a system by creating and thereby
reducing the retrieval time of the plates by the operators SMED (single minute exchange
of die) performed on production units to find the activities involved in the setup
operations and reducing the time needed to perform the setup operations The results
of the implementations made found to be satisfying that the tool room kept periodically
and the use of Kanban cards on the tool chart for some tool being used through
inspections performed The systems implemented for organizing the printing plates
helped in retrieving the plates from the system for a setup operation seem to have
reduced from 17 minutes to 3 minutes The implementation of 5s at the paint room in
organizing the ink tins proven useful as the time needed for operators in obtaining the
ink tins and introducing it into the system a setup operation performed for production
purpose observed during SMED process
RESUMO XI
OPTIMIZING THE WORK ENVIRONMENT USING LEAN AND CONTINUOUS IMPROVEMENT TOOLS-PRINTING FLOOR MANIVANNAN SAMPATH
PALAVRAS CHAVE
5s PDCA SMED resiacuteduos Muda ferramentas de melhoria contiacutenua e enxuta
RESUMO
O objetivo do estudo eacute resolver os problemas relatados pelo gerenciamento utilizando
ferramentas enxutas e ferramentas de melhoria contiacutenua O propoacutesito de usar uma
ferramenta enxuta eacute configurar o processo de trabalho envolvido na produccedilatildeo
reduzindo assim o desperdiacutecio periodicamente A ferramenta tambeacutem visa melhorar o
fluxo do processo resultando na reduccedilatildeo do fluxo de trabalho irregular em todo o piso
O sistema de traccedilatildeo do Kanban tambeacutem descobriu improvisar o fluxo de materiais no
chatildeo de faacutebrica A ferramenta de melhoria contiacutenua ajuda na racionalizaccedilatildeo de trabalhos
relacionados agrave implementaccedilatildeo de obras e reduccedilatildeo de desperdiacutecio Neste trabalho a
implementaccedilatildeo do 5s encontrou seu uso na criaccedilatildeo de uma sala de ferramentas e um
graacutefico de ferramentas juntamente com um sistema de traccedilatildeo introduzido para as
ferramentas no pegboard O uso de cartotildees Kanban como sistema pull no quadro de
ferramentas da ferramenta eacute monitorar o fluxo da ferramenta para as unidades de
produccedilatildeo no chatildeo de impressatildeo A implementaccedilatildeo do 5s na sala de pintura eacute organizar
as latas de tingimento usadas para a atividade de configuraccedilatildeo no processo de produccedilatildeo
e tornar as latas de tingimento mais faacuteceis de encontrar para o operador O PDCA (plan
do check act) aciona uma das ferramentas de melhoria contiacutenua implementadas para
organizar as chapas de impressatildeo em um sistema criando e reduzindo o tempo de
recuperaccedilatildeo das chapas pelos operadores SMED (single minute exchange of die)
realizado nas unidades de produccedilatildeo para localizar as atividades envolvidas nas
operaccedilotildees de configuraccedilatildeo e reduzir o tempo necessaacuterio para executar as operaccedilotildees de
configuraccedilatildeo Os resultados das implementaccedilotildees realizadas demonstraram ser
satisfatoacuterios que a sala de ferramentas eacute mantida periodicamente e o uso de cartotildees
Kanban na tabela de ferramentas para alguma ferramenta sendo usada atraveacutes de
inspeccedilotildees realizadas Os sistemas implementados para organizar as chapas de
impressatildeo ajudaram a recuperar as chapas do sistema para que uma operaccedilatildeo de
configuraccedilatildeo parecesse ter reduzido de 17 minutos para 3 minutos A implementaccedilatildeo
de 5s na sala de pintura organizou as tintas de tingimento comprovadamente uacuteteis
como o tempo necessaacuterio para os operadores obterem as tintas de corante e introduzi-
las no sistema uma operaccedilatildeo de configuraccedilatildeo realizada para fins de produccedilatildeo
observada durante o processo SMED
LIST OF SYMBOLS AND ABBREVIATIONS XIII
OPTIMIZING THE WORK ENVIRONMENT USING LEAN AND CONTINUOUS IMPROVEMENT TOOLS-PRINTING FLOOR MANIVANNAN SAMPATH
LIST OF SYMBOLS AND ABBREVIATIONS
List of abbreviations
GSM Grams per Square Meter
NVAA Non-Value Added Activities
OEE Overall Equipment Effectiveness
PDCA Plan Do Check Act
SME Small Machine Enterprise
SMED Single Minute Exchange of DIE
SPH Sheets per Hour
TFM Total Flow Management
List of units
cm Centimeter
m Meter
mm Millimeter
OZ Ounces
List of symbols
euro Euro
FIGURES INDEX XV
OPTIMIZING THE WORK ENVIRONMENT USING LEAN AND CONTINUOUS IMPROVEMENT TOOLS-PRINTING FLOOR MANIVANNAN SAMPATH
FIGURES INDEX
Figure 1 Cities with printing in 1450 [4] 8
Figure 2 Cities with printing press from the 1500s to 1800s [4] 9
Figure 3 Flexography printing station [8] 11
Figure 4 Flexography printing application [8] 12
Figure 5 Letter printing station [10] 13
Figure 6 Screen printing station [11] 14
Figure 7 Gravure printing station [8] 15
Figure 8 Processing of data into printed image [12] 16
Figure 9 shows the image created using printing [12] 17
Figure 10 offset printing station [13] 18
Figure 11 Usage of offset printing for product lables [11] 19
Figure 12 Schematic Production System [17] 21
Figure 13 Manual assembly line [18] 21
Figure 14 combination of manual and automatic workstations [21] 22
Figure 15 A and B workplace sharing hybrid systems [22] 23
Figure 16 Inline Configuration of an automated production line [24] 24
Figure 17 L shaped layout [24] 24
Figure 18 U shaped production layout [24] 25
Figure 19 Rotary layout [24] 26
Figure 20 Welding process performed by platform robots [29] 27
Figure 21 Roles of robots [29] 27
Figure 22 Platform robots performing welding tasks [29] 27
Figure 23 Transporter robot on a track-motion device [29] 28
Figure 24 Hierarchy of workstation needs [33] 29
Figure 25 Represents the flow across enterprises [38] 32
Figure 26 Lean manufacturing tools and practices [44] 34
Figure 27 Function of Poke-Yoke [58] 36
FIGURES INDEX XVI
OPTIMIZING THE WORK ENVIRONMENT USING LEAN AND CONTINUOUS IMPROVEMENT TOOLS-PRINTING FLOOR MANIVANNAN SAMPATH
Figure 28 Types of waste [61] 37
Figure 29 The phases of SMED method [69] 40
Figure 30 5S method [73] 41
Figure 31 PDCA Cycle [77] 42
Figure 32 TFM model [83] 44
Figure 33 Total Flow Management Pillars [83] 44
Figure 34 OEE Timeline [87] 46
Figure 35 Offset printing SM74-5 unit at Marsil 51
Figure 36 Plate cleaning solution 52
Figure 37 Control systems of SM 74-5 52
Figure 38 Measuring devices 53
Figure 39 Products produced by SM74-5 53
Figure 40 Manual fork lifter 54
Figure 41 SM 52-2 54
Figure 42 SM 52-4 55
Figure 43 A and B control systems for Speedmaster 52-4 56
Figure 44 Goods produced at SM 52-4 56
Figure 45 Web-fed Printing unit 57
Figure 46 Products produced at the webfed unit 57
Figure 47 Heidelberg SORM-Z 58
Figure 48 Heidelberg GTO-52 58
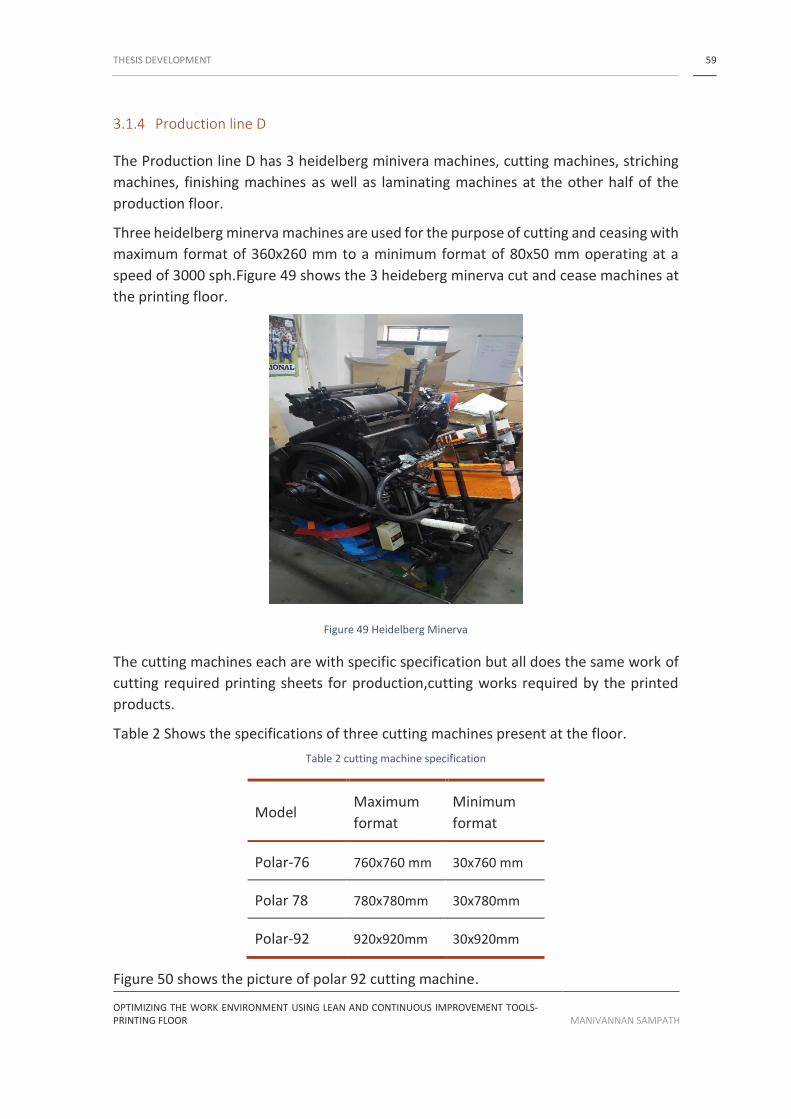
Figure 49 Heidelberg Minerva 59
Figure 50 Cutting machine polar 92 60
Figure 51 Heidelberg STAHL Ti-52 60
Figure 52 Double 600i 61
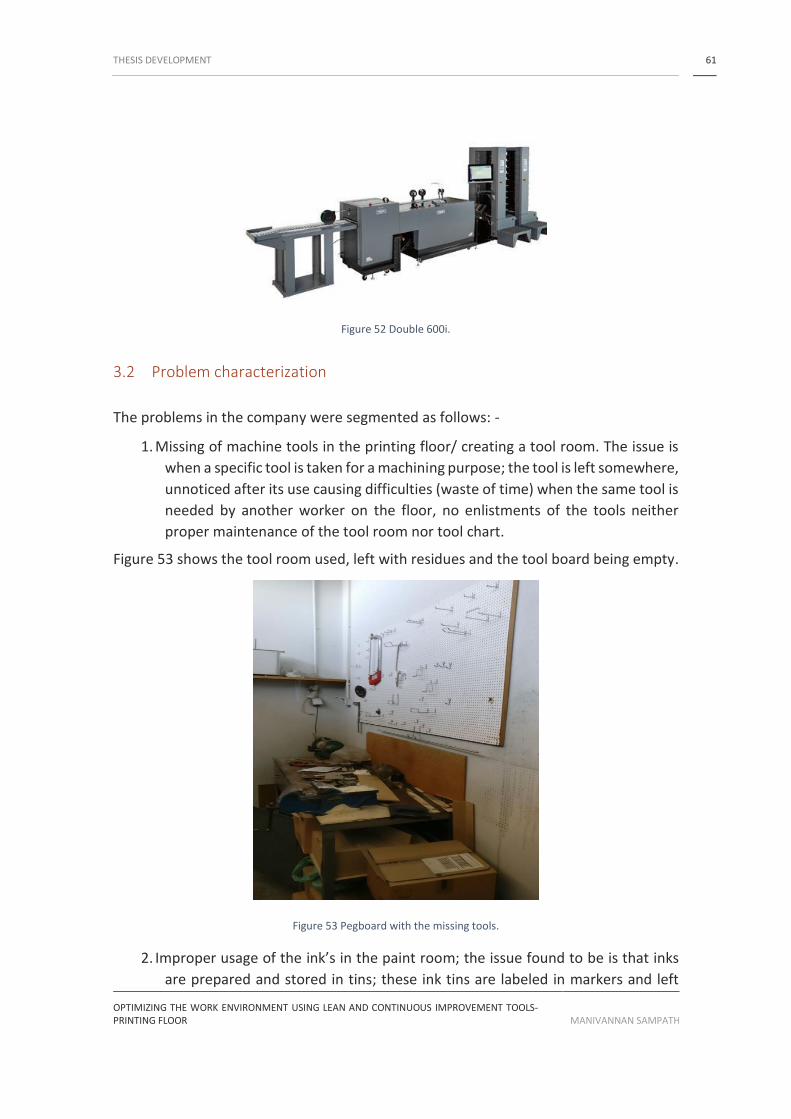
Figure 53 Pegboard with the missing tools 61
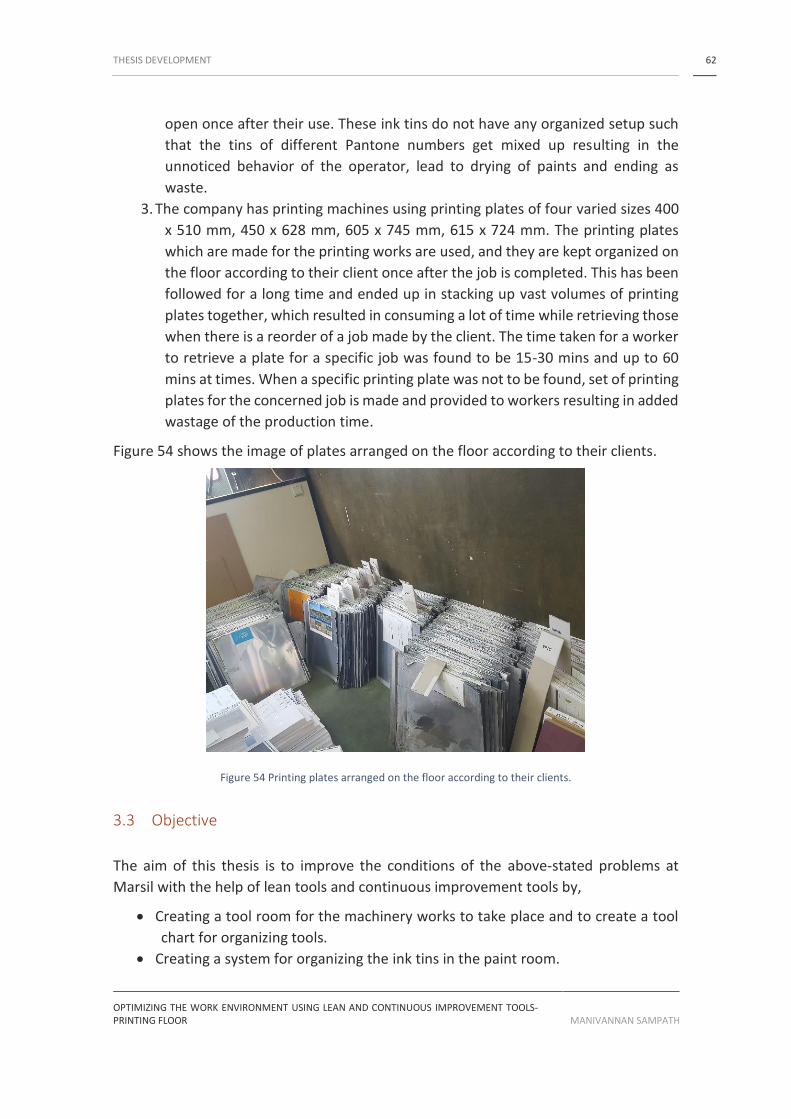
Figure 54 Printing plates arranged on the floor according to their clients 62
Figure 55 Cause and Effect diagram on missing tools and unmanaged paint room 63
Figure 56 Cause and effect diagram on unorganized ink tins 64
Figure 57 Cause and effect diagram on printing plate setup made by management 65
FIGURES INDEX XVII
OPTIMIZING THE WORK ENVIRONMENT USING LEAN AND CONTINUOUS IMPROVEMENT TOOLS-PRINTING FLOOR MANIVANNAN SAMPATH
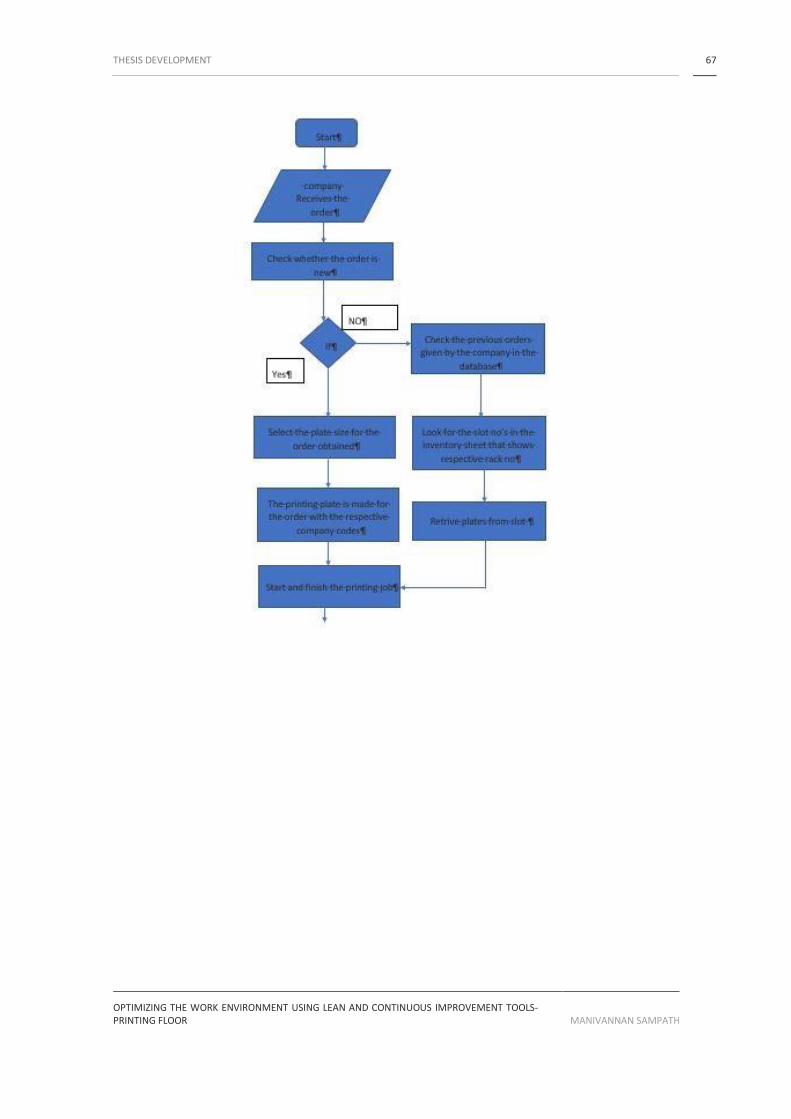
Figure 58 Flow chart 68
Figure 59 SWOT analysis on objective A 69
Figure 60 SWOT on objective B 70
Figure 61 SWOT on objective C 71
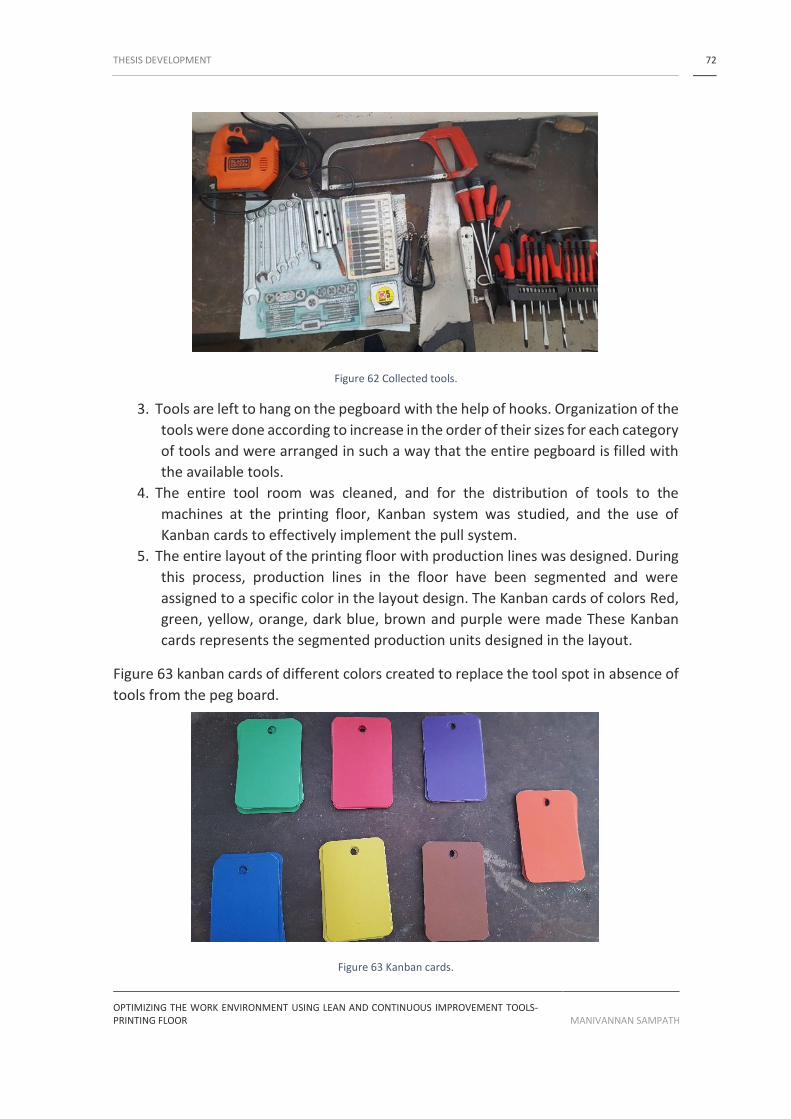
Figure 62 Collected tools 72
Figure 63 Kanban cards 72
Figure 64 Simple floor layout is highlighting the production units in colors 73
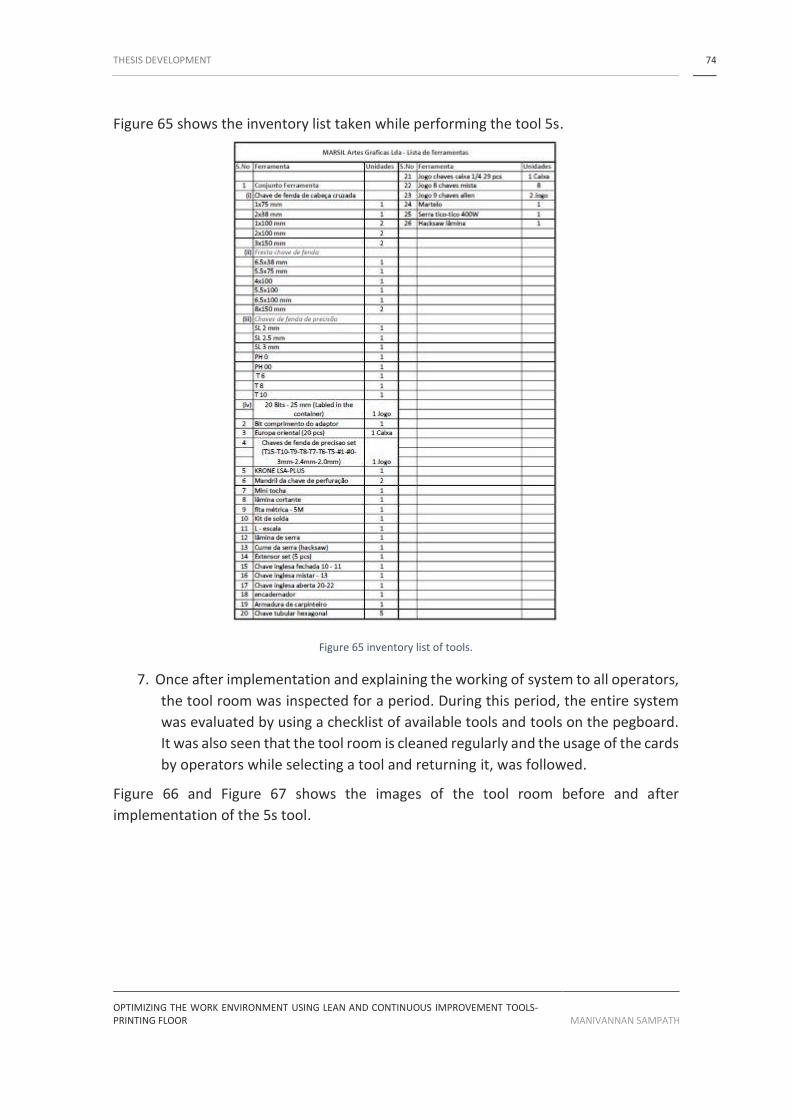
Figure 65 inventory list of tools 74
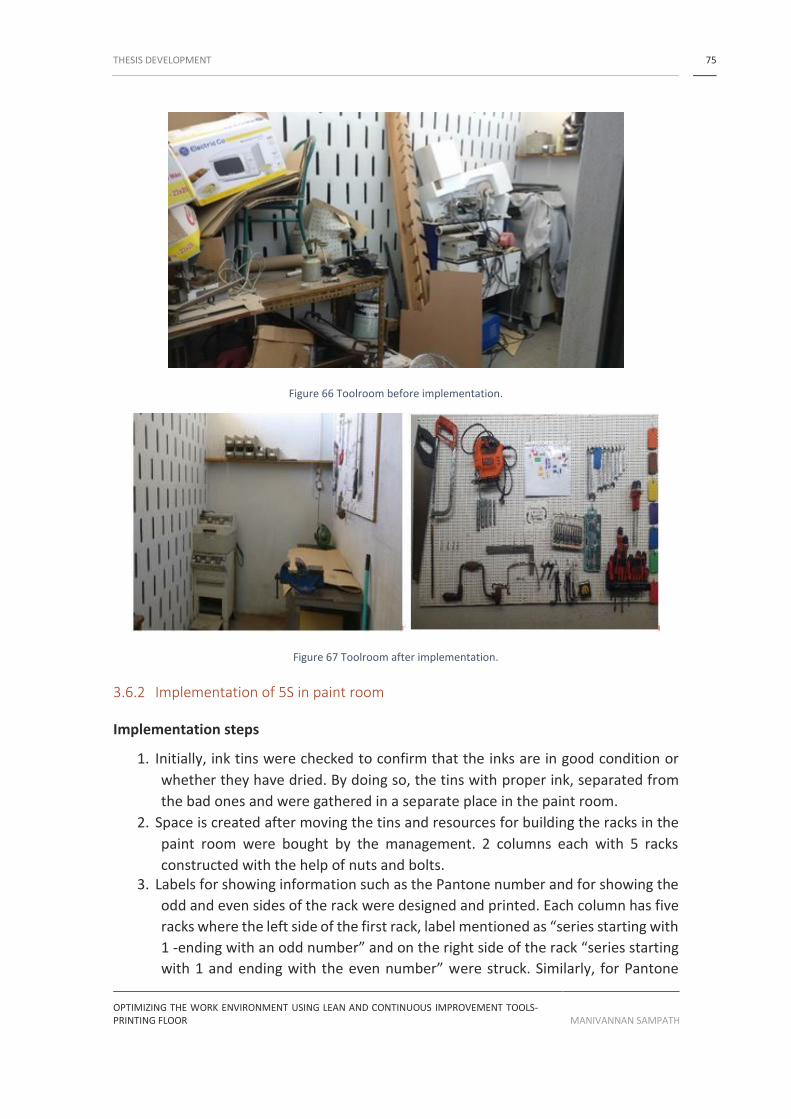
Figure 66 Toolroom before implementation 75
Figure 67 Toolroom after implementation 75
Figure 68 Labels as indicators 76
Figure 69 Lable for ink tins 76
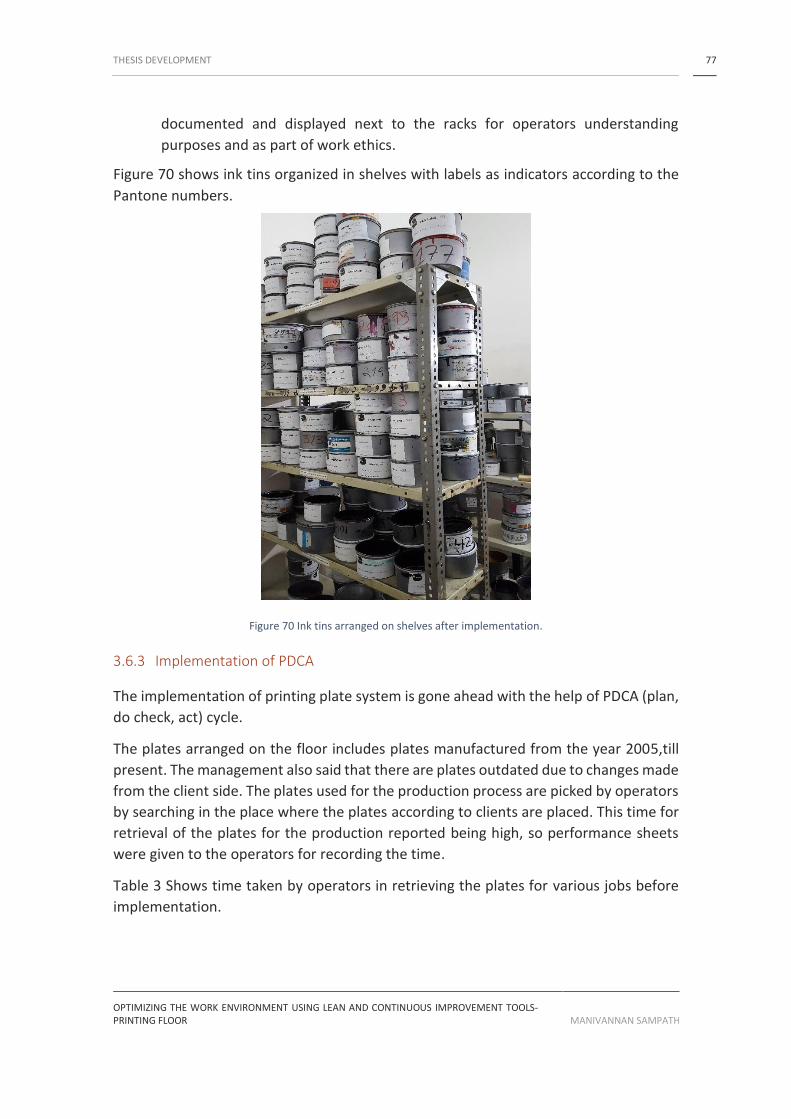
Figure 70 Ink tins arranged on shelves after implementation 77
Figure 71 Separation of plates in pallets 79
Figure 72 Information regarding captais socials 79
Figure 73 Information about the plate 80
Figure 74 Image taken during the creation of the prototype 80
Figure 75 Inventory list of the plates 81
Figure 76 image of plates organizeed with labels 82
Figure 77 Before implementation 84
Figure 78 After implementation 84
Figure 79 shows the space occupied by printed goods right near the printing machines 87
Figure 80 Shelves for storing purposes 88
TABLES INDEX XIX
OPTIMIZING THE WORK ENVIRONMENT USING LEAN AND CONTINUOUS IMPROVEMENT TOOLS-PRINTING FLOOR MANIVANNAN SAMPATH
TABLES INDEX
Table 1 printing equipment features [7] 10
Table 2 cutting machine specification 59
Table 3 Time taken before implementation 78
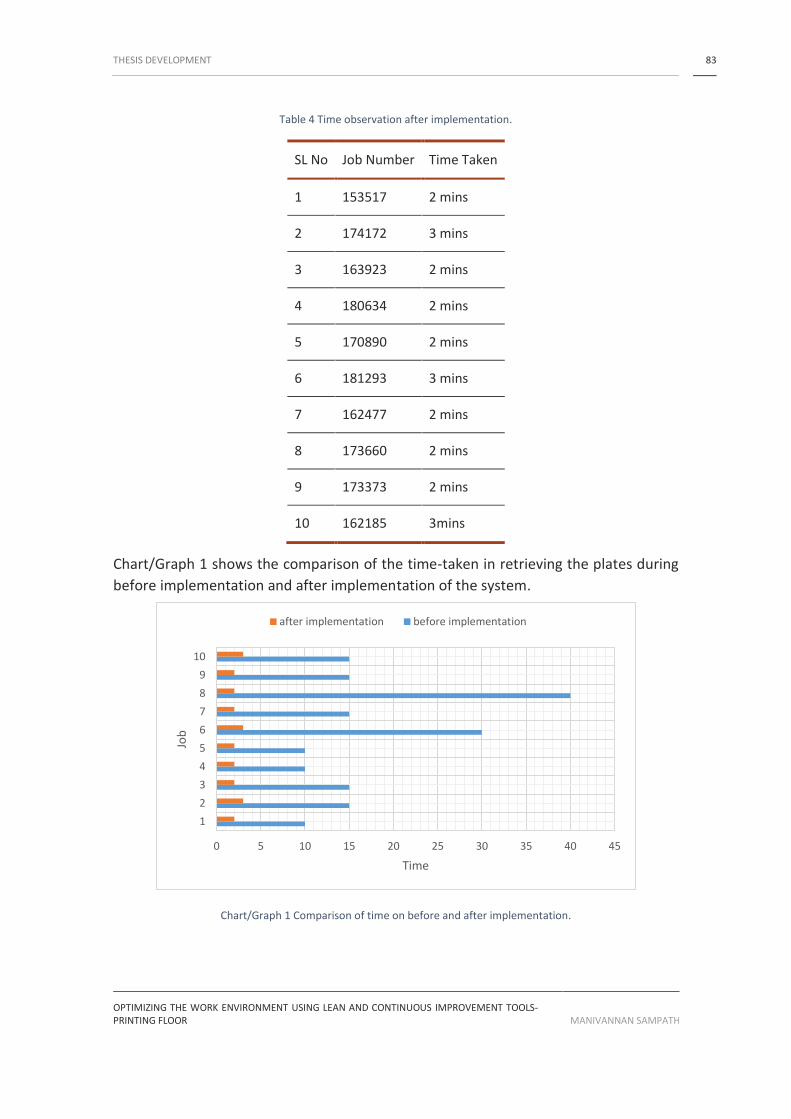
Table 4Time observation after implementation 83
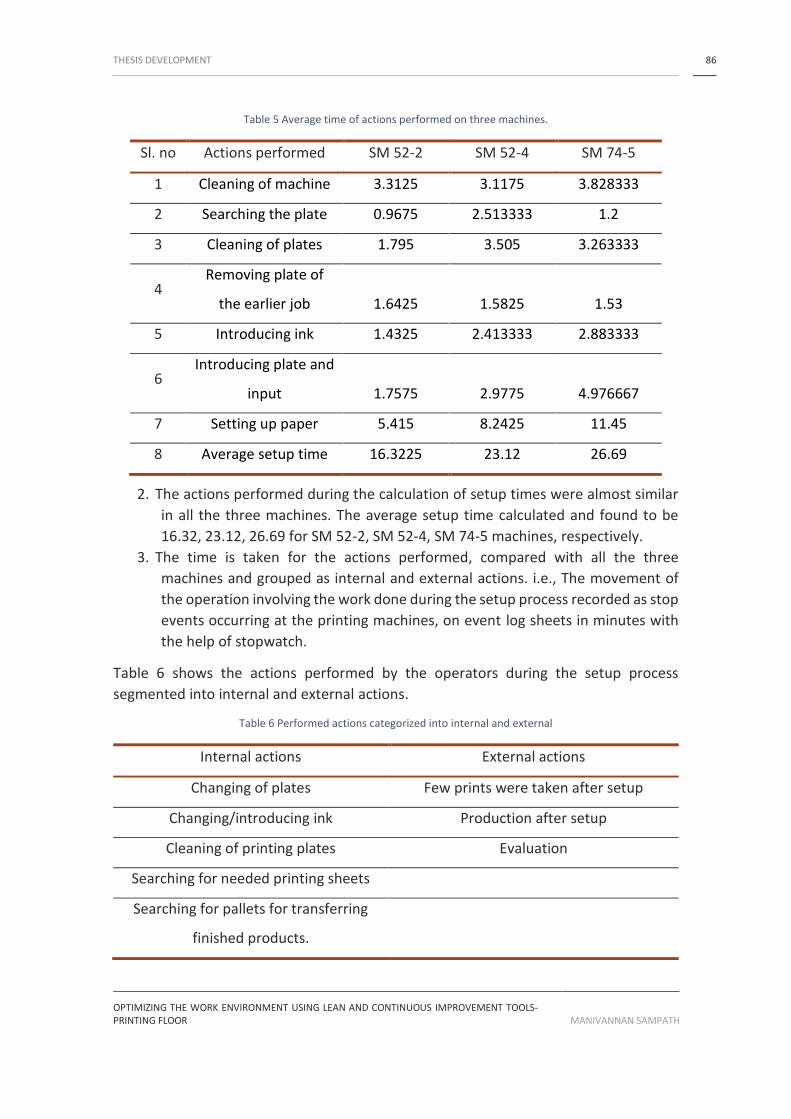
Table 5 Average time of actions performed on three machines 86
Table 6 Performed actions categorized into internal and external 86
INDEX XXI
OPTIMIZING THE WORK ENVIRONMENT USING LEAN AND CONTINUOUS IMPROVEMENT TOOLS-PRINTING FLOOR MANIVANNAN SAMPATH
INDEX
INTRODUCTION 1
11 Framework 1
12 Objectives 1
13 Methodology 1
14 Thesis structure 2
15 Host company 2
THEORETICAL BACKGROUND 7
21 The printing sector 7
211 Importance in the national and international economy 7
212 Types of printings 9
213 Printing equipment 10
214 Printing process description 11
2141 Flexography 11
2142 Letter press printing 12
2143 Screen printing 14
2144 Rotogravure 14
2145 Digital printing 15
2146 Offset lithography 17
215 Evolution of offset printing press 19
22 Production lines 20
221 Concept of production line 20
222 Types of production lines 21
2221 Manual production lines 21
2222 Semi automatic production lines 22
INDEX XXII
OPTIMIZING THE WORK ENVIRONMENT USING LEAN AND CONTINUOUS IMPROVEMENT TOOLS-PRINTING FLOOR MANIVANNAN SAMPATH
2223 Automated production lines 23
223 Management of production lines 28
2231 Workstations 28
2232 Line balancing 30
2233 Supply 31
23 Lean concepts and tools 33
231 Concept of waste 34
232 POKE-YOKE 35
233 MUDA 37
234 SMED 39
235 5S 40
24 Continuum improvement tools 42
241 PDCA 42
242 TFM 43
243 OEE 45
THESIS DEVELOPMENT 51
31 Production lines characterization 51
311 Production line A 51
312 Production line B 54
313 Production line C 58
314 Production line D 59
32 Problem characterization 61
33 Objective 62
34 Brainstorming 63
341 Objective A 63
342 Objective B 64
343 Objective C 65
INDEX XXIII
OPTIMIZING THE WORK ENVIRONMENT USING LEAN AND CONTINUOUS IMPROVEMENT TOOLS-PRINTING FLOOR MANIVANNAN SAMPATH
35 SWOT analysis of possible solutions 69
351 Objective A SWOT analysis 69
352 Objective B SWOT analysis 69
353 Objective C SWOT analysis 70
36 Implementation 71
361 Implementation of 5S 71
362 Implementation of 5S in paint room 75
363 Implementation of PDCA 77
SMED PRACTICE 85
CONCLUSIONS AND PROPOSALS OF FUTURE WORKS 91
51 CONCLUSIONS 91
52 PROPOSALS OF FUTURE WORKS 92
REFERENCES AND OTHER SOURCES OF INFORMATION 95
ANNEXES 105
71 ANNEX1 105
25
INTRODUCTION
11 Framework
12 Objectives
13 Methodology
14 Thesis structure
15 Host company
INTRODUCTION 1
OPTIMIZING THE WORK ENVIRONMENT USING LEAN AND CONTINUOUS IMPROVEMENT TOOLS-PRINTING FLOOR MANIVANNAN SAMPATH
INTRODUCTION
11 Framework
The graphic arts industry where the work is performed has production lines performing
jobs of everyday demands of the clients This includes process from creating the
products according to clientrsquos preference followed by cutting binding lamination until
the final product is met The working conditions are affected by busy long-term
production during various scenarios where the implementation of the lean tools and
continuous improvement tools are necessary to improve the working conditions
availability of resources and thereby increasing the productivity gradually
12 Objectives
The objective of this thesis is to improve the conditions at Marsil with the help of lean
tools and continuous improvement tools by
bull Creating a tool room for the machinery works to take place and to create a tool
chart for organizing tools
bull Creating a system for organizing the ink tins in the paint room
bull Implementing a system for the printing plates to be organized and quick retrieval
of the plates from the system for the printing jobs
13 Methodology
bull Study about the problem reported
bull Collection of data about the problem and proposing ideas in solving them
bull Study about the production floor and the included production units and their
works
bull Brainstorming on the problems in figuring out the possible causes and to get a
broader perspective in structuring the solutions
bull Selection of idea based on collected data available area resources
bull Implementation of an idea based on the adopted tool
bull Collection of data after implementation
bull Analyzing the data obtained
INTRODUCTION 2
OPTIMIZING THE WORK ENVIRONMENT USING LEAN AND CONTINUOUS IMPROVEMENT TOOLS-PRINTING FLOOR MANIVANNAN SAMPATH
14 Thesis structure
The thesis is structured by having it into two sections
bull The theoretical background is having the study of the printing sector the
importance of printing in the economy types of printing printing equipment
printing process with the description of each and their applications the
evolution of offset printing
Production lines include the concept of the production line types of production
lines and management of production lines
Lean tools and concept include waste concept poke-yoke method Muda single
minute exchange of ink 5s and continuous improvement tools has brief
explanation on PDCA (Plan do check act) TFM (Total flow management) OEE
(Overall Equipment Effectiveness) from various research papers journals books
and websites
bull The development section will have characteristics of the production lines
addressing the problems at the printing floor reported by the company goals
performing brainstorming actions on the problems by figuring out the elements
involved in the cause and suggesting out the actions SWOT (strengths
weakness opportunity and threats) involved in these actions Later the actions
implemented according to lean tools and continuous improvement tools
necessary
15 Host company
The company Marsil was founded in the year 1953 as a printing business licensed for the
manual cutter and a printing machine in the downtown of Porto Rua Conde de Vizela
No 76 In the early 80s after the formation of the company became the first customer
segmentation exercise and went on to emphasize to the institutional client initially
Banco Borges amp Brother followed by Banco Espiacuterito Santo The company now also has
a delegation in Lisbon initially at Av Infante Santo and later in Tower 2 of the Amoreiras
which still remains to provide the necessary personalized support to the customer
The company was awarded the prize of IAPMEI SME Excellence in 2000 and 2001 which
happened again in 2008 and 2009 with the awards SME Leader and SME Excellence
respectively
In 2006 Marsil started a new business area passing by incorporating value-added
services to the graphics product - the Bursar and Logistics Management with stock
management graphics delivering the quantity needed time limit and at the locations by
customers
INTRODUCTION 3
OPTIMIZING THE WORK ENVIRONMENT USING LEAN AND CONTINUOUS IMPROVEMENT TOOLS-PRINTING FLOOR MANIVANNAN SAMPATH
In 2008 it was inaugurated Mosteiroacute facilities with a park web presses and finishing lines
constituting the second productive hub and from 2010 onwards there is an ongoing
new customer segmentation exercise and exploration of new markets which has
allowed the Marsil increase the portfolio and even be honored with some awards and
prestigious honors in the field of Graphic Arts
Marsil currently has 1420 clients currently active and half of them made orders during
the year 2016 Noteworthy are clients like the Caixa Geral de Depoacutesitos Novo Banco
Millenium BCP SantaderTotta Banco BPI Euro big Pestana Group Hotels Hotels Minor
Tivoli Nau Hotels Group Eurostars Group Hospital da Luz among other clients in these
and other sectors such as footwear textiles etc The Marsil has forty-two employees
employed at present
5
ltTIacuteTULO DA TESEgt ltNOME DO AUTORgt
BIBLIOGRAPHIC WORK
21 The printing sector
22 Production lines
23 Lean concepts and tools
24 Continuum improvement tools
THEORETICAL BACKGROUND 7
OPTIMIZING THE WORK ENVIRONMENT USING LEAN AND CONTINUOUS IMPROVEMENT TOOLS-PRINTING FLOOR MANIVANNAN SAMPATH
THEORETICAL BACKGROUND
21 The printing sector
The printing industry covers the entire print process from creation through distribution
to other non-print services that it offers So any definition of the industry includes not
only the numerous firms that perform the actual printing but the companies that
provide binding and finishing services such as cutting trimming die to cut laminating
mounting and varnishing documents for their clients [1]
A wide range of products is produced in the printing industry In addition to magazines
books and some small newspapers other examples of printed products include direct
mail labels manuals and marketing material Less obvious printed goods include memo
pads business order forms checks maps T-shirts and packaging The industry also
includes establishments that give quick printing of documents for the consumer or
support services such as prepress embossing binding finishing and mailing [2]
211 Importance in the national and international economy
The printing press had enormous effects on the economy The printing press was an
invention that led to the flourishment of trade throughout all of Europe due to increased
demands This was a cause for a stronger economy Also a more natural way to print
books led to more affordable books this meant that now not only could the elite and
wealthy afford books but so could the poor More durable and well-made books grew
the market for books and strengthened the economy Newspaper on the other hand
were more everyday items created by the printing press which caused a massive burst
in demand for newspapers Frequent changing of prices downward made more
affordable books Books carried information for people to learn and create more jobs
Stores could now sell and buy books more rapidly The demand for books and
newspapers also led to more inventions for printing to grow the economy Lastly
printing became a massive industry and led to different companies to move into large
noisy factories meaning many for jobs to hire more books to make and more books to
sell [3]
Historians and studies suggest the printing press was one of the most revolutionary
inventions in human history as well the printing press eased these intellectual
developments the process of sharing and recombining ideas that economists have tied
to technological progress and the development of economic activities in which literacy
THEORETICAL BACKGROUND 8
OPTIMIZING THE WORK ENVIRONMENT USING LEAN AND CONTINUOUS IMPROVEMENT TOOLS-PRINTING FLOOR MANIVANNAN SAMPATH
numeracy and other intellectual skills were valuable Indeed there is an argument to
be made that (via its pervasive and fundamental impact on a wide range of economic
activities) printing technology may qualify as a general-purpose technology [4]
Printing cities enjoy helps due to agglomeration economies The printing press produced
new face-to-face interactions in addition to books and pamphlets Printers workshops
brought scholars merchants craftsmen and mechanics together for the first time in a
commercial environment eroding a pre-existing ldquotown and gown divide Bookshops
and the houses of printers became meeting places and temporary residences for
intellectuals Print technology also produced printing-scholars Adapt to handling
machines and marketing products finding learned societies promoting artists and
authors advancing new forms of data collection [5]
Cities with printing presses derived benefits from the technology that others did not
The costs of information and human capital accumulation were significantly lower in
cities with printing presses In part these advantages were due to transport costs Print
media is costly to transport because it is vast and a fragile commodity sensitive to damp
[6]
[4]Jeremiah Dittmar in comparing cities where printers set up presses to similar cities
where they did not conclude that ldquoprint technologies had very substantial effects in
European economic history through their impact on cities ldquoSome have concluded that
the economic impact of the printing press was limited
Figure 1 Cities with printing in 1450 [4]
THEORETICAL BACKGROUND 9
OPTIMIZING THE WORK ENVIRONMENT USING LEAN AND CONTINUOUS IMPROVEMENT TOOLS-PRINTING FLOOR MANIVANNAN SAMPATH
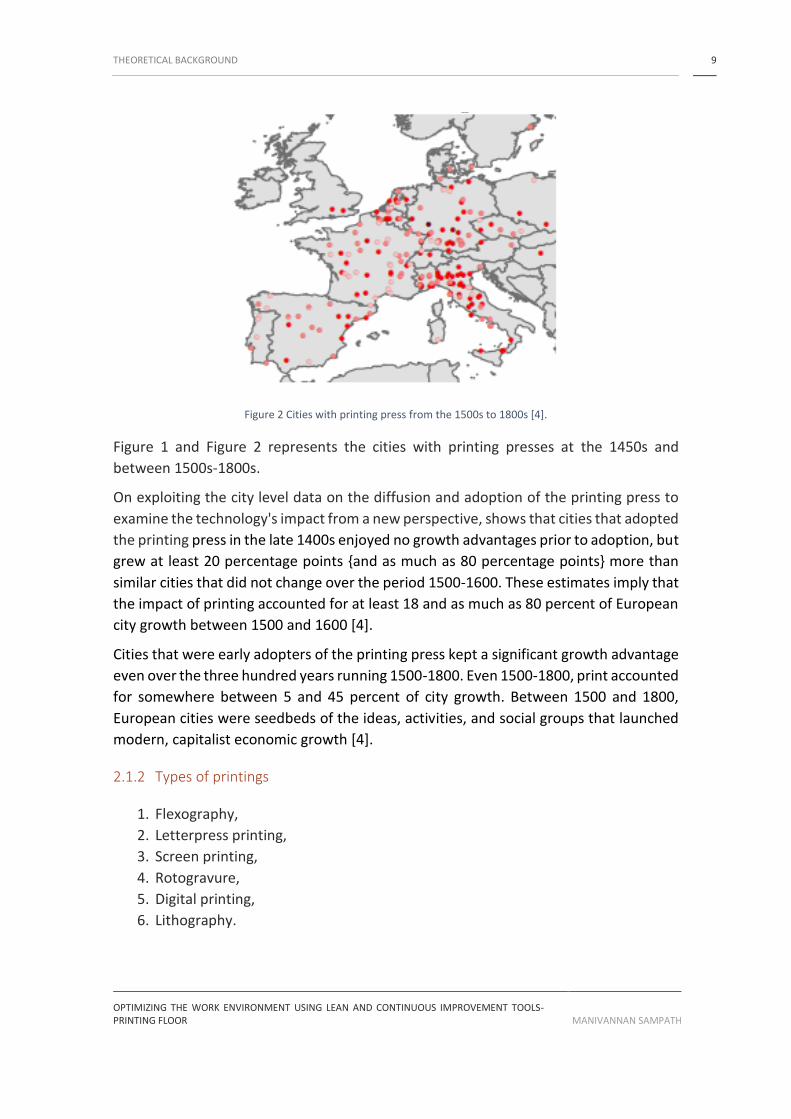
Figure 2 Cities with printing press from the 1500s to 1800s [4]
Figure 1 and Figure 2 represents the cities with printing presses at the 1450s and
between 1500s-1800s
On exploiting the city level data on the diffusion and adoption of the printing press to
examine the technologys impact from a new perspective shows that cities that adopted
the printing press in the late 1400s enjoyed no growth advantages prior to adoption but
grew at least 20 percentage points and as much as 80 percentage points more than
similar cities that did not change over the period 1500-1600 These estimates imply that
the impact of printing accounted for at least 18 and as much as 80 percent of European
city growth between 1500 and 1600 [4]
Cities that were early adopters of the printing press kept a significant growth advantage
even over the three hundred years running 1500-1800 Even 1500-1800 print accounted
for somewhere between 5 and 45 percent of city growth Between 1500 and 1800
European cities were seedbeds of the ideas activities and social groups that launched
modern capitalist economic growth [4]
212 Types of printings
1 Flexography
2 Letterpress printing
3 Screen printing
4 Rotogravure
5 Digital printing
6 Lithography
THEORETICAL BACKGROUND 10
OPTIMIZING THE WORK ENVIRONMENT USING LEAN AND CONTINUOUS IMPROVEMENT TOOLS-PRINTING FLOOR MANIVANNAN SAMPATH
213 Printing equipment
Industrial printing equipment and supplies include screen printing equipment digital
printing equipment label printing equipment offset printing equipment letterpress
printing equipment and flexographic printing equipment
Table 1 Describes various printing equipments and their associated equipments
Table 1 printing equipment features [7]
Serial
Number
Equipment used
for printing Definition Features
1
Flexographic
printing
equipment
Flexographic printing equipment uses rubber
cylinders that are easy to keep and repair
bull Viscosity control
systems
bull Ink pumps
bull Chamber doctor
blades
bull Video systems
bull Stroboscopes
bull Slitting and rewinding
machines
2
Letterpress
printing
equipment
Letterpress printing inks type that is pressed
onto the printing surface
bull Die cutters
bull Scorers
bull Engravers
bull Embossers
bull Foil stampers
bull Binders
3 Screen printing
equipment
Screen printing equipment uses rubber
cylinders that are easy to keep and repair
bull Racks
bull Stretchers
bull Transfer presses
bull Dip tanks
bull Dryers
4 Digital printing
equipment
Digital printing equipment produces printed
materials directly from a computer file and
does not use intermediate materials such as
film or plates
bull Variable imaging digital
presses (computer to
paper)
bull Digital desktop
printers
bull Digital copiers
bull Direct imaging presses
(computer to plate on
press)
THEORETICAL BACKGROUND 11
OPTIMIZING THE WORK ENVIRONMENT USING LEAN AND CONTINUOUS IMPROVEMENT TOOLS-PRINTING FLOOR MANIVANNAN SAMPATH
5 Offset printing
equipment
Offset printing equipment produces printed
images from plate to paper with the help of
inks and cylinders
bull Printers
bull Scanners
bull Folding machines
bull Joggers
bull Binding equipment
214 Printing process description
This section briefly explains the process involved in various printing techniques and their
uses in production activities
2141 Flexography
Process
Flexographic printing involves a ldquoplate cylinderrdquo covered in whole or in part with raised
flexible print media that carry ink for an image The media then deposit that ink onto
the substrate Initially the media made of rubber sheets pressed into rigid molds and
vulcanized shows the image of flexography printing unit and its working components
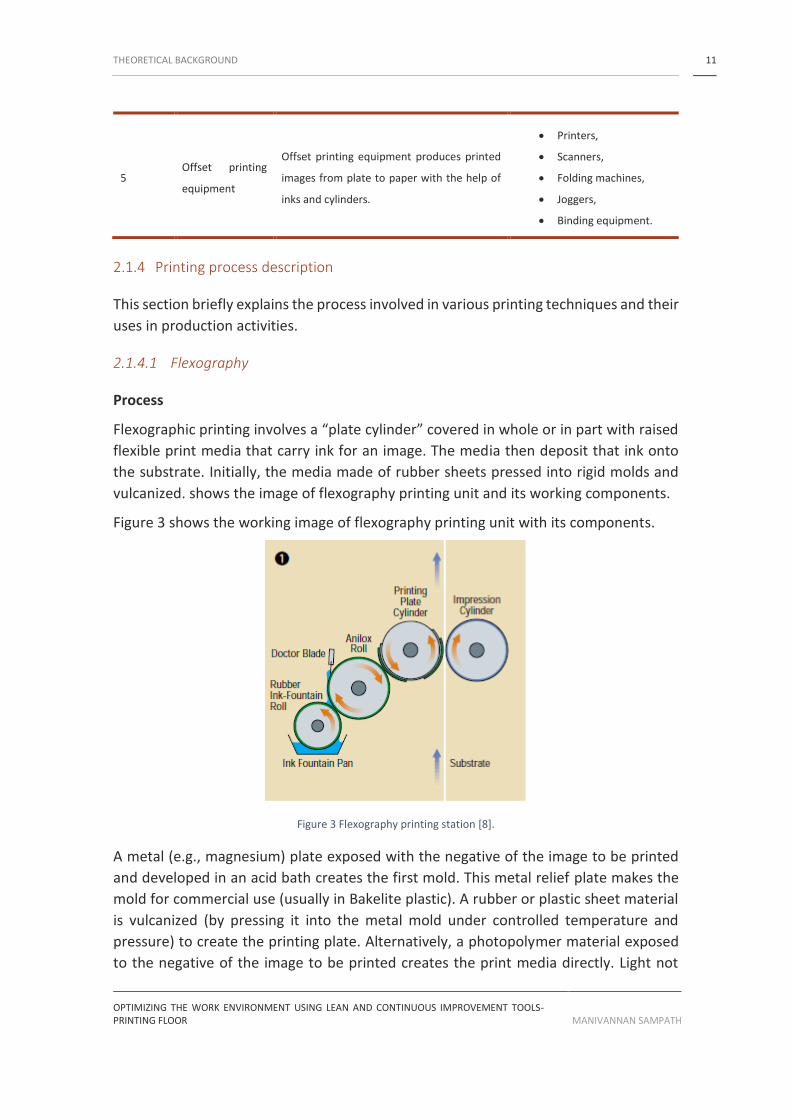
Figure 3 shows the working image of flexography printing unit with its components
Figure 3 Flexography printing station [8]
A metal (eg magnesium) plate exposed with the negative of the image to be printed
and developed in an acid bath creates the first mold This metal relief plate makes the
mold for commercial use (usually in Bakelite plastic) A rubber or plastic sheet material
is vulcanized (by pressing it into the metal mold under controlled temperature and
pressure) to create the printing plate Alternatively a photopolymer material exposed
to the negative of the image to be printed creates the print media directly Light not
THEORETICAL BACKGROUND 12
OPTIMIZING THE WORK ENVIRONMENT USING LEAN AND CONTINUOUS IMPROVEMENT TOOLS-PRINTING FLOOR MANIVANNAN SAMPATH
excluded by the negative image cross-links the polymer In the following step a liquid
bath removes the polymer not cross-linked during the exposure process Raised surfaces
of (crossed-linked) photopolymer material give the raised surfaces to carry ink Recently
direct laser light exposure of photopolymer material has been able to cut the need for
the intermediate contrary giving high reproducibility and quality [9]
The process was developed primarily for printing on packaging substrates board paper
foil and film Materials are supplied in roll form for feeding into form-fill over-wrapping
bag making and other continuous web processing machinery [8]
Flexography printing is an efficient cost-effective and versatile printing method by the
end of the 1990rsquos approximately one-quarter of all printing is flexographic in the
packing segment of the printing industry Flexography enjoys a market share of over
65 growth throughout the 1990rsquos has been steady [8]
Applications
Some typical applications for flexography are paper and plastic bags milk cartons
disposable cups and candy bar wrappers Flexography printing may also be used for
envelopes labels and newspapers [8] Figure 4 shows some of the applications where
flexographic printing is used The labels of the above-shown products are made through
flexographic printing
Figure 4 Flexography printing application [8]
2142 Letter press printing
Process
Letter-press printing consists printing of suitably aqueous ink onto a sheet or web from
surfaces in relief The printing form is usually a stereotype or electrotype plate or a type
form with or without etchings bearing designs etched in relief While various kinds of
THEORETICAL BACKGROUND 13
OPTIMIZING THE WORK ENVIRONMENT USING LEAN AND CONTINUOUS IMPROVEMENT TOOLS-PRINTING FLOOR MANIVANNAN SAMPATH
presses may be employed rotary presses are used for high-speed letter-press printing
as in the printing of books magazines newspapers In rotary letter-press operations a
supply of ink is maintained in an ink fountain at a consistency suitable for the printing
conditions and the ink is fed from the fountain and distributed onto the raised surfaces
of the rotating printing form by a series of transfer and inking rollers [10] The web to
be printed is passed into contact with the moving inked form to affect the printing
operation After one side of the web has been printed that is after the first impression
a second printing or second impression is usually made on the other side of the web
by continuous operation of another section of the same press In multi-color letter-press
printing a series of impressions are made with inks of assorted colors a plurality of
impressions being placed in adjacent or superimposed relation on the same side of the
sheet or web [10]
Figure 5 shows the working of letterpress printing unit and its components
Figure 5 Letter printing station [10]
Applications
Letterpress printing was the effective book-preparing process For four centuries it was
also the powerful printing technology for posters announcements printed matter for
churches government and businesses single or two paged local news sheets daily and
weekly newspapers as well as various simple print jobs now limited to specialty works
such as numbering embossing hot stamping and hot wax carbonizing (spot carbon
printing) It is also used for die cutting perforating slitting and scoring [11]
THEORETICAL BACKGROUND 14
OPTIMIZING THE WORK ENVIRONMENT USING LEAN AND CONTINUOUS IMPROVEMENT TOOLS-PRINTING FLOOR MANIVANNAN SAMPATH
2143 Screen printing
Screen printing is a process in which ink is forced through a screen The screen-printing
stencil serves as a printing plate The screen is a delicate fabric made of natural silk
plastic or metal fibersthreads Plastic or metal fabric is used nowadays Ink is
imprintedtransferred through the image-specific open mesh that is not covered by the
stencil The screen-printing plate is therefore a combination of screen and stencil It is
the material the fineness of the screen (the number of screen threads per centimeter
of fabric length) the thickness of the screen the distance between the top and bottom
sides of the screen and the degree of opening of the screen (the degree of screen
opening areas as a percentage describes the ratio of the total of all mesh openings to
the entire surface of the fabric) that determine the printing properties and Quality of
the fabric (screen) [11]
Applications
Textilesmaterials printed T-shirts printed toys fronts of televisions radios etc
automobile dashboards measuring equipment packaging (plastic bags) printed circuit
boards large-format advertising posters are the areas where screen printing have found
its use [11]
Figure 6 shows the image of the screen-printing process and involved components
Figure 6 Screen printing station [11]
2144 Rotogravure
Process
True intaglio or steel-die process prints from sunken lines or grooves are connected and
cross each other Ink is then applied to the engraved areas and doctored or wiped off
the flat nonimage areas The resulting ink image is then impressed on the substrate to
THEORETICAL BACKGROUND 15
OPTIMIZING THE WORK ENVIRONMENT USING LEAN AND CONTINUOUS IMPROVEMENT TOOLS-PRINTING FLOOR MANIVANNAN SAMPATH
be printed Paper currency is printed from steel dies capable of reproducing beautiful
lines that no other process can duplicate A rotogravure is a form of printing and prints
directly from unconnected cells engraved into the plate cylinder [8]
Figure 7 shows the image of Gravure printing process and its units in operation
Figure 7 Gravure printing station [8]
Applications
Gravure is used for packaging magazines newspapers and other specialty printing
applications It has been an outstanding choice for printing process color for mass-
circulation magazines and newspapers Gravure-printed postage stamps are another
example of the exceptional print results of rotogravure Many plants have blended
flexography with gravure to produce exceptional print results on packaging materials
[8]
2145 Digital printing
The basic concept is that digital means using numbers to represent something and
thatrsquos what a computer does A typical image is converted into numerical data (a long
string of ones and zeros) that describe or quantify each sample point or ldquopixelrdquo (short
for picture element the basic unit of image information) in terms of specific attributes
such as color and intensity This data can be stored manipulated and transformed with
digital printing technologies back into a customarily viewed image [12]
THEORETICAL BACKGROUND 16
OPTIMIZING THE WORK ENVIRONMENT USING LEAN AND CONTINUOUS IMPROVEMENT TOOLS-PRINTING FLOOR MANIVANNAN SAMPATH
Process
Compared to traditional printing techniques digital printing is different However there
is no pressure or impact and there is no physical matrix The matrix now sits in the
computer in the form of digital data that can be converted repeatedly with or without
any variation into a print by any image-maker who either does his own printing (ldquoself-
printingrdquo) or who uses an outside printing service lab or retailer [12]
Figure 8 shows the process in which data is created stored and finally processed to
produce printed image on sheet
Figure 8 Processing of data into printed image [12]
Digital imaging and printing have changed the rules of visual communication Making
original prints or reproductions (see below) especially at an enormous size and in color
used to be costly cumbersome or difficult for any individual photographer or artist [12]
Figure 9 shows the image created using digital printing
THEORETICAL BACKGROUND 17
OPTIMIZING THE WORK ENVIRONMENT USING LEAN AND CONTINUOUS IMPROVEMENT TOOLS-PRINTING FLOOR MANIVANNAN SAMPATH
Figure 9 shows the image created using printing [12]
Advantages
The advantages of digital printing are clear in terms of cost consistency storage
flexibility
bull Some of the digital printing technologies are line printing mdash where pre-formed
characters are applied to the paper by lines
bull daisy wheel mdash where pre-formed characters are applied individually
bull dot-matrix mdash which produces arbitrary patterns of dots with an array of printing
studs
bull heat transfer mdash like early fax machines or modern receipt printers that apply heat
to special paper which turns black to form the printed image
bull blueprint mdash and related chemical technologies
bull inkjet mdash including bubble-jet mdash where ink is sprayed onto the paper to create the
desired image
bull laser mdash where toner consisting primarily of polymer with the pigment of the
desired colors are melted and applied directly to the paper to create the desired
image
bull 3D printing
2146 Offset lithography
Process
In offset lithographic printing the Printing ink is supplied to the inking rollers via a
reservoir (duct) Greater and lesser amounts of ink can be fed to the inking rollers by
opening and closing duct keys The inking rollers transfer the required amount of ink to
the printing plate The printing image is then transferred (or offset) from the plate to
THEORETICAL BACKGROUND 18
OPTIMIZING THE WORK ENVIRONMENT USING LEAN AND CONTINUOUS IMPROVEMENT TOOLS-PRINTING FLOOR MANIVANNAN SAMPATH
the blanket` and then to the paper on the impression cylinder The printed sheet is then
passed into the next printing unit via the transfer cylinder Each color must have a
separate printing unit The printing plate is made from aluminum and backed with a
sensitive coating The plate has two distinct areas the image area and the non-image
area Ink is accepted by the image areas of the plate while the non-image areas accept
a water-based mix called a damper solution When applied to the plate the solution
repels ink from the non-image area [13]
There are two types of lithographic printing they are
bull Sheet-fed
Sheet-fed press prints an image on single sheets of paper as they are fed individually
into the press The print quality and sheet to sheet registration are often better than
web-fed printing but it is often more economical to produce huge runs on web presses
because of their higher running speeds
bull Web-fed
A web-fed press prints images on a continuous web of paper fed into the press from a large roll of paper The web of paper is then cut into individual sheets after printing or as with continuous business form applications it is left in web form and is perforated for later separation into individual sheets
Figure 10 shows the working of offset printing machine along with parts involved in
producing prints
Figure 10 offset printing station [13]
Applications
The highest printing quality for packaging is achieved with offset printing Accordingly
printing of expensive luxury packaging for individual spirits chocolates perfumes and
cosmetics and even embossing in the correct register is always done on sheet-fed offset
THEORETICAL BACKGROUND 19
OPTIMIZING THE WORK ENVIRONMENT USING LEAN AND CONTINUOUS IMPROVEMENT TOOLS-PRINTING FLOOR MANIVANNAN SAMPATH
presses The printing of many other cardboard products and folding boxes for the
packaging of frozen food ice cream cigarettes drugs and cosmetics as well as many
other products in the food and non-food areas remains the almost exclusive domain of
offset printing technology [11]
Figure 11 shows the usage of offset printing on various products
Figure 11 Usage of offset printing for product lables [11]
215 Evolution of offset printing press
This section shows the evolution of offset printing technology and inventions made over
the past 100 years [14] [15]
1875
The first press to use offset lithography and the offset printing process is invented in
England The offset cylinder was covered with specially treated cardboard that
transferred the printed image from the litho stone to the surface of the metal
1880
The cardboard covering of the offset cylinder was changed to rubber which is still the
most commonly used material
1903
Ira Washington Rubel of the United States used the offset process to print on paper
Rubel noticed that whenever a sheet of paper was not fed into his lithographic press
during operation the stone printed its image to the rubber-covered impression cylinder
and the next impression had an image on both sides direct litho on the front and an
image from the rubber blanket on the back and discovered that images were printed
sharply by printing from the stone to the blanket and then to the paper
THEORETICAL BACKGROUND 20
OPTIMIZING THE WORK ENVIRONMENT USING LEAN AND CONTINUOUS IMPROVEMENT TOOLS-PRINTING FLOOR MANIVANNAN SAMPATH
1911
Albert Harris observed the process discovered by Rubel at about the same time and
developed an offset printing press for the Harris Automatic Press Company
1950
During the 1950s offset printing became the most popular form of commercial printing
as improvements were made in plates inks and paper maximizing the techniques
superior production speed and plate durability Today most of the printing including
newspapers is done by the offset printing process
1960
Increasingly newspaper printers begin replacing their outdated letterpress machines
with offset presses
1962
Heidelberg begins development for offset printing presses This came after decades of
resistance by management Technicians were able to convince them that this was the
way of the future
22 Production lines
221 Concept of production line
A production line is a set of the sequential process set up on an industrial shop floor A
production process or a manufacturing process is the transformation of raw materials
or components into finished products The stages of a production process involve
procurement fabrication assembly testing packaging and distribution The
production or manufacturing lines in industries can be categories into three typersquos ie
automated production lines semi-automated production lines and standard
production lines The nature of a production line depends on the complexity of the
manufacturing parts the production volume the sensitivity of the product and cost [16]
The production system has the following characteristics
1 Production is an organized activity so every production system has an aim
2 The system transforms the various inputs into useful outputs
3 It does not run in isolation from the other organization system
4 There exists feedback about the activities which is essential to control and
improve system performance [17]
THEORETICAL BACKGROUND 21
OPTIMIZING THE WORK ENVIRONMENT USING LEAN AND CONTINUOUS IMPROVEMENT TOOLS-PRINTING FLOOR MANIVANNAN SAMPATH
Figure 12 shows the inputs go through the transformation process and finally the output
of a production system
Figure 12 Schematic Production System [17]
222 Types of production lines
2221 Manual production lines
It consists of multiple workstations in which the assembly work is carried out as the
product (subassembly) is passed from station to station along the line At each
workstation one or more human workers perform a part of the total assembly work on
the product by adding one or more components to the existing subassembly Manual
lines are especially common where workpieces are fragile or if workpieces need to be
gripped often as industrial robots often lack the necessary accuracy In countries where
wage costs are low manual labor can also be a cost-efficient alternative to expensive
automated machinery [18]
Figure 13 depicts the manual assembly line setup
Figure 13 Manual assembly line [18]
THEORETICAL BACKGROUND 22
OPTIMIZING THE WORK ENVIRONMENT USING LEAN AND CONTINUOUS IMPROVEMENT TOOLS-PRINTING FLOOR MANIVANNAN SAMPATH
Manual operations are used in the assembly of complex work elements as well as when
product demand is unstable or where the use of specialized machines and equipment is
unjustifiably expensive Thus caution must be exercised in the design of a manual
assembly line with respect to the volume flexibility with uncertain production demand
To achieve this situation needs adjusting the number of workers or the system
configuration according to the changes in product demand Hence a manual assembly
line is more flexible than automated machine assembly systems in adapting to the
changes in production demand [19]
Manual assembly lines are used in high-production situations where the work to be
performed can be divided into small tasks and tasks assigned to the workstations on the
line A key advantage of using manual assembly line is a specialization of labor is by
giving each worker a limited set of tasks to do repeatedly According to Shtub [19] lack
of motivation and low level of satisfaction which is typically caused by the high
repetitiveness of elementary operations have been considered as a significant
disadvantage of assembly production
2222 Semi automatic production lines
Semi-automation describes a system in which a human operator or a small production
line feeds a product to a robot the robot performs a single task on that product and
then the human operator removes the product and completes the task
ldquoWork characteristic of a machine that only needs some degree of support from a manrdquo
In contrast to a completely automated system semi-automation does not achieve
complete relief from work for the worker [20] Ie the technical system usually achieves
the control of the individual functions Program control which means the start end and
succession of the individual functions is accomplished by manrdquo
Figure 14 shows the integration of manual and automatic workstations
Figure 14 combination of manual and automatic workstations [21]
Utilizing robotic and human capabilities at their best is obtained in an assembly system
where there is a sequential division of tasks The simple tasks suited for robots are found
THEORETICAL BACKGROUND 23
OPTIMIZING THE WORK ENVIRONMENT USING LEAN AND CONTINUOUS IMPROVEMENT TOOLS-PRINTING FLOOR MANIVANNAN SAMPATH
upstream in the line The complex often varied tasks that give the assembled products
human operators downstream perform their individual features Such hybrid lines have
been used to advantage in the industry for more than two decades [21]
Figure 15 shows the workstation been shared by the worker and an automated machine
in a line
A
B
Figure 15 A and B workplace sharing hybrid systems [22]
In this scenario several components must be assembled on a sheet metal part which is
supplied by a conveyor system The human worker must grip the components out of
bins to transport these parts towards the conveyor system (handling time) and to put
the components on the sheet metal parts (assembly) Afterward the robot must screw
these components into the sheet metal part (assembly) If the worker is too slow the
robot will wait until the worker has finished his tasks [23]
2223 Automated production lines
An automated production line has multiple workstations that are automated and linked
together by a work handling system that transfers parts from one station to the next
The automated production may consist of automated workstations manual
workstations and inspection stationsThere are different types of configurations layouts
available for automated production lines
bull In line
bull Segmented In-Line
bull Rotary
In-line layout
THEORETICAL BACKGROUND 24
OPTIMIZING THE WORK ENVIRONMENT USING LEAN AND CONTINUOUS IMPROVEMENT TOOLS-PRINTING FLOOR MANIVANNAN SAMPATH
Raw materials enter the automated production line and undergo a system of automated
processing at various workstations along the fixed production line the parts are passed
from workstation to workstation by means of a mechanized work transport system until
the wholly processed parts pass out of the automated production line after the last
process occurs to the part at the final workstation in the system [24]
Figure 16 describes the process of the In-line automated production line
Figure 16 Inline Configuration of an automated production line [24]
The conditions that decide the use of automated production lines include high product
demand stable product design long product life and multiple operations
Segmented In-line
L shaped layout
This layout allows fitting in a lengthy series of operations into limited space The feeding
cells start on an aisle and end at the point of use This May allow isolation of dangerous
or costly-to-move equipment in the elbow with savings in implementation cost andor
two directions for expansion It is easy to segregate the in-flow and outflow of physically
different materials products supplies and special services [24] Figure 17 shows the L-
shaped production layout with assembly stations to perform work
Figure 17 L shaped layout [24]
THEORETICAL BACKGROUND 25
OPTIMIZING THE WORK ENVIRONMENT USING LEAN AND CONTINUOUS IMPROVEMENT TOOLS-PRINTING FLOOR MANIVANNAN SAMPATH
U- shaped layout
U-shaped production lines were conceived as a solution in lean production
environments for waste elimination and for getting the full use of workerrsquos capabilities
Waste removal is usually achieved by the introduction of pull systems one-piece flow
leveling and ldquojidokardquo while fully utilizing workersrsquo capabilities requires a system of
respect for people based on minimizing wasted movements ensuring their safety and
giving them greater responsibility in running and improving their jobs [25]
Figure 18 shows u shaped production line system In U shaped lines the entrance and
the exit of the line system are remarkably close to each other Operators may handle
work-pieces both on the front and back of the line What operators found in crossover
workstations can perform tasks from both the front and back of the line Thus idle times
are reduced and resource use is increased thanks to the crossover stations found in
between the front and back of the U line [26]
Figure 18 U shaped production layout [24]
Rotary
Consists of a circular worktable around which work parts are fixed to work holders The
worktable rotates to move each work part in turn into each automated workstation
which is found around the circumference of the worktable The worktable is often called
a dial and the equipment is referred to as a dial indexing machine or simply indexing
machine
Figure 19 shows the image of a rotary layout design
THEORETICAL BACKGROUND 26
OPTIMIZING THE WORK ENVIRONMENT USING LEAN AND CONTINUOUS IMPROVEMENT TOOLS-PRINTING FLOOR MANIVANNAN SAMPATH
Figure 19 Rotary layout [24]
Limited to smaller work parts and few workstations and they cannot readily
accommodate buffer Robotic production lines storage capacity However they need less
floor space and are less expensive than other configurations [24]
Robots are being used extensively in assembly lines to perform the tasks and these
assembly lines are called robotic assembly lines [27] The robots are programmed to
perform different types of tasks and it can be used to work 24 hrs without worries of
fatigue Different types of robots are available in the market to do the same task with
different capabilities and efficiencies Therefore there is a requirement of reasonable
allocation of robots to workstations with the sure specific aim These robots need to be
re-assigned whenever there is a new product is planned for assembly [28]
Michels [29] consider that a robotic assembly line is composed of platform stations and
transporter robots to displace work-pieces between these platforms Multiple robots
may be assigned to each platform station By defining each transporter or platform as a
station and assuming the line starts and finishes with a transporter robot the
configuration results in line with an odd number of stations in an alternating pattern of
platform-fixed and transporter robots
Figure 20 shows the robotic line design model forming 13 serial stations (S1 to S13)
There are 24 robots in total composed of 17 platform robots (15 performing geometry
and finishing welding tasks and 2 performing stud tasks) and 7 transporter robots (4
performing finishing welding tasks 1 performing stud tasks (S9) and 2 for work-pieces
handling in the entrance and S11)
THEORETICAL BACKGROUND 27
OPTIMIZING THE WORK ENVIRONMENT USING LEAN AND CONTINUOUS IMPROVEMENT TOOLS-PRINTING FLOOR MANIVANNAN SAMPATH
Figure 20 Welding process performed by platform robots [29]
Figure 21 shows the types of the robot and their roles where they are being used in the
assembly line
Figure 21 Roles of robots [29]
Figure 22 shows the welding process performed by platform robots
Figure 22 Platform robots performing welding tasks [29]
THEORETICAL BACKGROUND 28
OPTIMIZING THE WORK ENVIRONMENT USING LEAN AND CONTINUOUS IMPROVEMENT TOOLS-PRINTING FLOOR MANIVANNAN SAMPATH
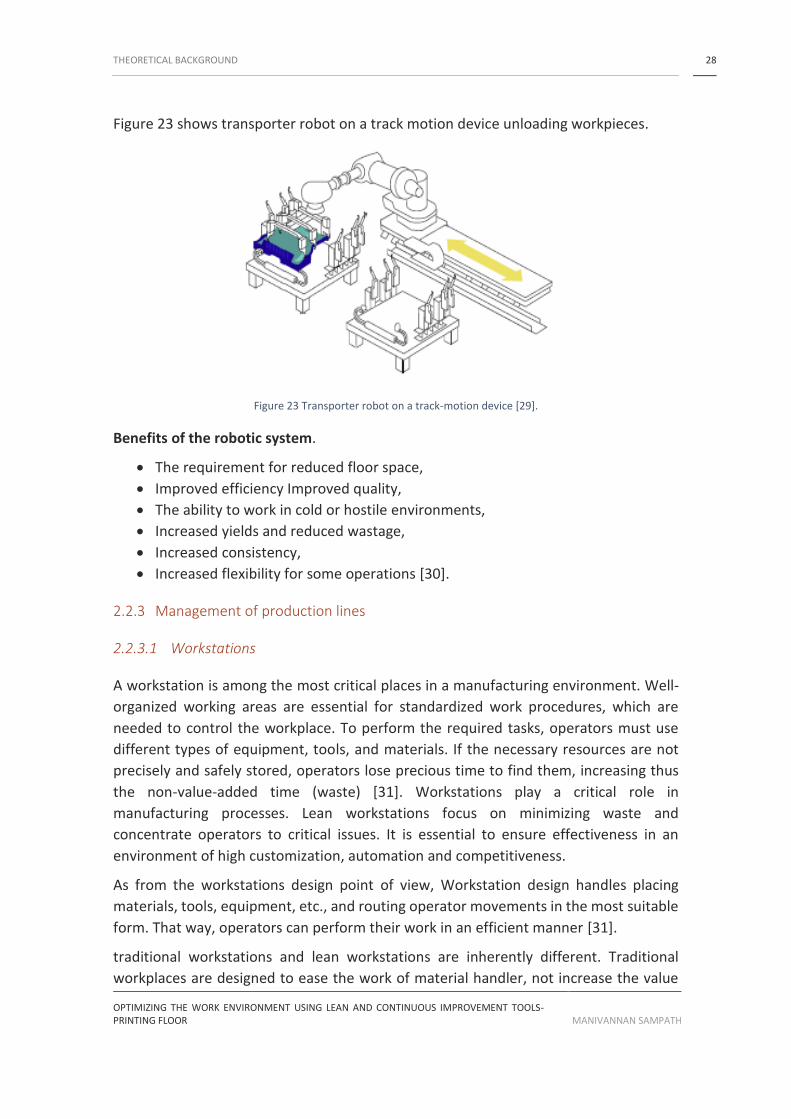
Figure 23 shows transporter robot on a track motion device unloading workpieces
Figure 23 Transporter robot on a track-motion device [29]
Benefits of the robotic system
bull The requirement for reduced floor space
bull Improved efficiency Improved quality
bull The ability to work in cold or hostile environments
bull Increased yields and reduced wastage
bull Increased consistency
bull Increased flexibility for some operations [30]
223 Management of production lines
2231 Workstations
A workstation is among the most critical places in a manufacturing environment Well-
organized working areas are essential for standardized work procedures which are
needed to control the workplace To perform the required tasks operators must use
different types of equipment tools and materials If the necessary resources are not
precisely and safely stored operators lose precious time to find them increasing thus
the non-value-added time (waste) [31] Workstations play a critical role in
manufacturing processes Lean workstations focus on minimizing waste and
concentrate operators to critical issues It is essential to ensure effectiveness in an
environment of high customization automation and competitiveness
As from the workstations design point of view Workstation design handles placing
materials tools equipment etc and routing operator movements in the most suitable
form That way operators can perform their work in an efficient manner [31]
traditional workstations and lean workstations are inherently different Traditional
workplaces are designed to ease the work of material handler not increase the value
THEORETICAL BACKGROUND 29
OPTIMIZING THE WORK ENVIRONMENT USING LEAN AND CONTINUOUS IMPROVEMENT TOOLS-PRINTING FLOOR MANIVANNAN SAMPATH
added by the operator A lean workstation is designed focused on operator concerns
such as safety and ergonomics and minimal wasted motion with the goal to get parts
efficiently and find tools quickly Assembly materials tools or parts should be
strategically positioned to allow the operator to reach it instantaneously without
interfering with operatorsrsquo safety and comfortability [32]
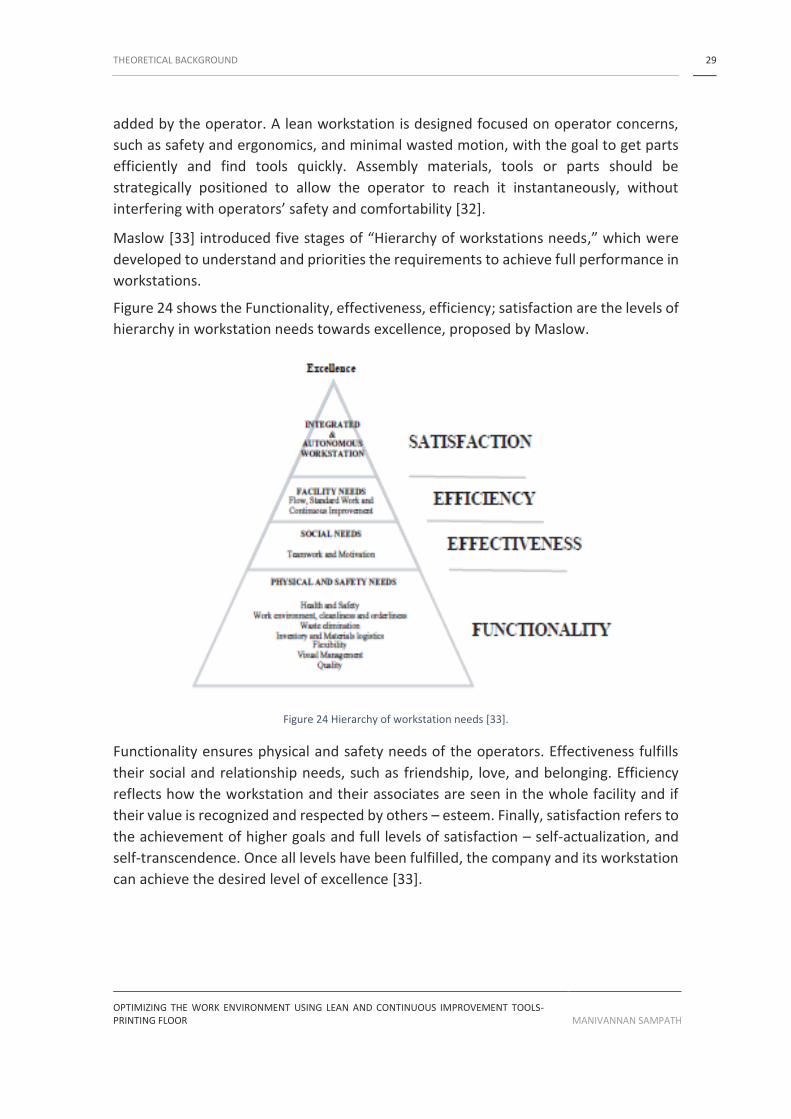
Maslow [33] introduced five stages of ldquoHierarchy of workstations needsrdquo which were
developed to understand and priorities the requirements to achieve full performance in
workstations
Figure 24 shows the Functionality effectiveness efficiency satisfaction are the levels of
hierarchy in workstation needs towards excellence proposed by Maslow
Figure 24 Hierarchy of workstation needs [33]
Functionality ensures physical and safety needs of the operators Effectiveness fulfills
their social and relationship needs such as friendship love and belonging Efficiency
reflects how the workstation and their associates are seen in the whole facility and if
their value is recognized and respected by others ndash esteem Finally satisfaction refers to
the achievement of higher goals and full levels of satisfaction ndash self-actualization and
self-transcendence Once all levels have been fulfilled the company and its workstation
can achieve the desired level of excellence [33]
THEORETICAL BACKGROUND 30
OPTIMIZING THE WORK ENVIRONMENT USING LEAN AND CONTINUOUS IMPROVEMENT TOOLS-PRINTING FLOOR MANIVANNAN SAMPATH
2232 Line balancing
Line balancing is a technique used in connection with the design of product layout or
lsquolsquolinesrsquorsquo The term lsquolsquobalancingrsquorsquo is used because one of its main aims is to minimize the
idle time and spread it as evenly as possible across the workstations [34] It is also used
to minimize imbalance betweenamong workers and workloads to achieve the required
run rate Therefore the line should be analyzed in terms of the assembly process
workstations layout and workstation cycle time [35]
When balancing a line the following factors need to be taken into account
bull the required output rate or cycle time (which depends on the demand for the
product)
bull precedence constraints (these are restrictions on the order in which tasks can be
done in other words specific tasks will have lsquolsquopredecessor tasksrsquorsquo that must be
done first)
bull zoning constraints (these are restrictions on where specific tasks or combinations
of tasks should or should not take place)
bull duplication of workstations are done in case when a task takes longer cycle time
than the available cycle time [34]
The line-balancing problem forms two aspects
bull Determination of the required number of stations and
bull The assignment of tasks to each station with the aim of maximizing efficiency (by
minimizing idle time and spreading it evenly across workstations)
Formulation
Equation 1 Represents the formulations involved in line balancing
Equation 1 Formulations involved in line balancing
119888119910119888119897119890119905119894119898119890 ∶= (119901119903119900119889119906119888119905119894119900119899119906119899119894119905119905119894119898119890)(119889119890119898119886119899119889119906119899119894119905119905119894119898119890)
119873119906119898119887119890119903 119900119891 119908119900119903119896 119904119905119886119905119894119900119899119904 ∶= 119879119886119904119896 119905119894119898119890 119862119910119888119897119890 119905119894119898119890frasl
119864119891119891119894119888119894119890119899119888119910 ∶= 119879119886119904119896 119905119894119898119890 119860119888119905119906119886119897 119899119906119898119887119890119903 119900119891 119908119900119903119896119904119905119886119905119894119900119899119904frasl
The effectiveness of the balance decision is measured by the lsquolsquobalance lossrsquorsquo of the line
The balance loss is the time invested in making one product that is lost through
imbalance expressed as a percentage of the total time investment
For a paced n stage line the time lost through imbalance is the cumulative difference
between the stationsrsquo distributed work times and the cycle time allowed by the pacing
of the line For unpacked lines it is the cumulative difference between each stagersquos work
THEORETICAL BACKGROUND 31
OPTIMIZING THE WORK ENVIRONMENT USING LEAN AND CONTINUOUS IMPROVEMENT TOOLS-PRINTING FLOOR MANIVANNAN SAMPATH
time and that of the stage with the most significant work time (this effectively governs
the cycle time of the whole line)
An amazingly simple line-balancing problem may be solved by lsquolsquotrial and errorrsquorsquo Most
practical problems however are extremely complex needing thousands of tasks to be
assigned across hundreds of workstations and with many precedences and zoning
constraints to be taken into account Many heuristic algorithms have been developed
such as the Kilbridge and Wester method and the ranked positional weights technique
Being based on heuristics or lsquolsquorulesrsquorsquo that have been tested empirically such techniques
can provide useful although not necessarily best results [34]
Kilbridge and Wester method
bull It is a heuristic procedure which selects work elements for assignment to stations
according to their position in the precedence diagram
bull elements at the end of the precedence diagram might be the first candidates to
be considered just because their values are significant
Procedure
Construct the precedence diagram so those nodes being work elements of the same
precedence are arranged vertically in columns
1 List the elements in order of their columns column I at the top of the list If an
element can be in more than one column list all columns by the element to show
the transferability of the element
2 To assign elements to workstations start with the column I elements Continue
the assignment procedure in order of column number until the cycle time is
reached [36]
2233 Supply
The supply chain is defined as a network of facilities and distribution options that performs
three tasks One is procurement second is manufacturing or transformation of these
materials into products and the third is distribution which is to deliver the manufactured
products to the ultimate or end customer [37]
Figure 25 shows the set of suppliers and then there is the manufacturing or the
organization produced goods are sent to customers through a channel so it could be a
distribution channel and from there it goes to the final customer
THEORETICAL BACKGROUND 32
OPTIMIZING THE WORK ENVIRONMENT USING LEAN AND CONTINUOUS IMPROVEMENT TOOLS-PRINTING FLOOR MANIVANNAN SAMPATH
Figure 25 Represents the flow across enterprises [38]
There are four primary uses of the term lsquosupply chain managementrsquo [38]
bull First the internal supply chain that integrates business functions involved in the
flow of materials and information from inbound to outbound ends of the
business
bull Secondly the management of two-party relationships with immediate suppliers
bull Thirdly the management of a chain of businesses including a supplier a supplierrsquos
suppliers a customer and a customerrsquos customer and so on
bull Fourthly the management of a network of interconnected businesses involved in
the ultimate provision of product and service packages needed by end
customers
Performance in supply chain management
Network performance
Easton [39] investigated performance differences between single-sourcing and multiple-
sourcing networks They proposed that single-sourcing networks would be more rigid
and stronger as there would be dense flows of exchanges within them It would also be
easier to keep confidentiality in single sourcing However the advantages of multi-
source or extensive networks included an ability to adapt to changes in the environment
through switching and a broader base to generate innovation from advocated multiple
sourcing as an essential strategy for firms who needed to reduce uncertainty in
purchasing
Chain performance
Logistics research into chain performance has focused primarily on improving speed and
cost performance Improvements in speed and cost may relate to the physical supply
THEORETICAL BACKGROUND 33
OPTIMIZING THE WORK ENVIRONMENT USING LEAN AND CONTINUOUS IMPROVEMENT TOOLS-PRINTING FLOOR MANIVANNAN SAMPATH
chain through which materials are converted and goods flow to end customers or to
the process chain of orders and demand transmission [40]
Relationship performance
Recent purchasing literature emphasizes the increasing importance of measuring and
monitoring performance within relationships because of the increased dependency
between the parties A performance measurement system implemented by the
purchasing party can enhance the buy-sell relationship However most performance
measurement systems in use do not do this for three main reasons First they
incorporate mostly hard objective measures which may not be proper for measuring
softer features of capability and performance Secondly the measurement systems are
usually designed by the purchasing organization for the purchasing organization rather
than for the relationship as a quasi-organization [41]
23 Lean concepts and tools
Lean is a management philosophy that focuses on reconfiguring organizational
processes to continually reduce and eliminate waste over time thereby contributing to
efficiency and value creation for the customer [42]
The concept of lean is the Toyota way promoted by Toyota which helps in improving
the flow of a process in a system is by dropping any uneven workflow throughout the
system Tools namely pull system by ldquoKanbanrdquo and production smoothing or ldquoheijunkardquo
are used for improving the flow in a system
Womack and Jones [43] stated lean is a management philosophy that focuses on
reconfiguring organizational processes to continually reduce and cut waste over time
thereby contributing to efficiency and value creation for the customer To this end Lean
applies specialist analytical tools and techniques
The concept helps in reducing waste (Muda) in any organization without affecting its
products or services which also includes the waste occurred due to overburden (muri)
and uneven workload (Mura) scenarios which are considered as significant causes of
creating losses Several tools and practices have been developed to achieve lean
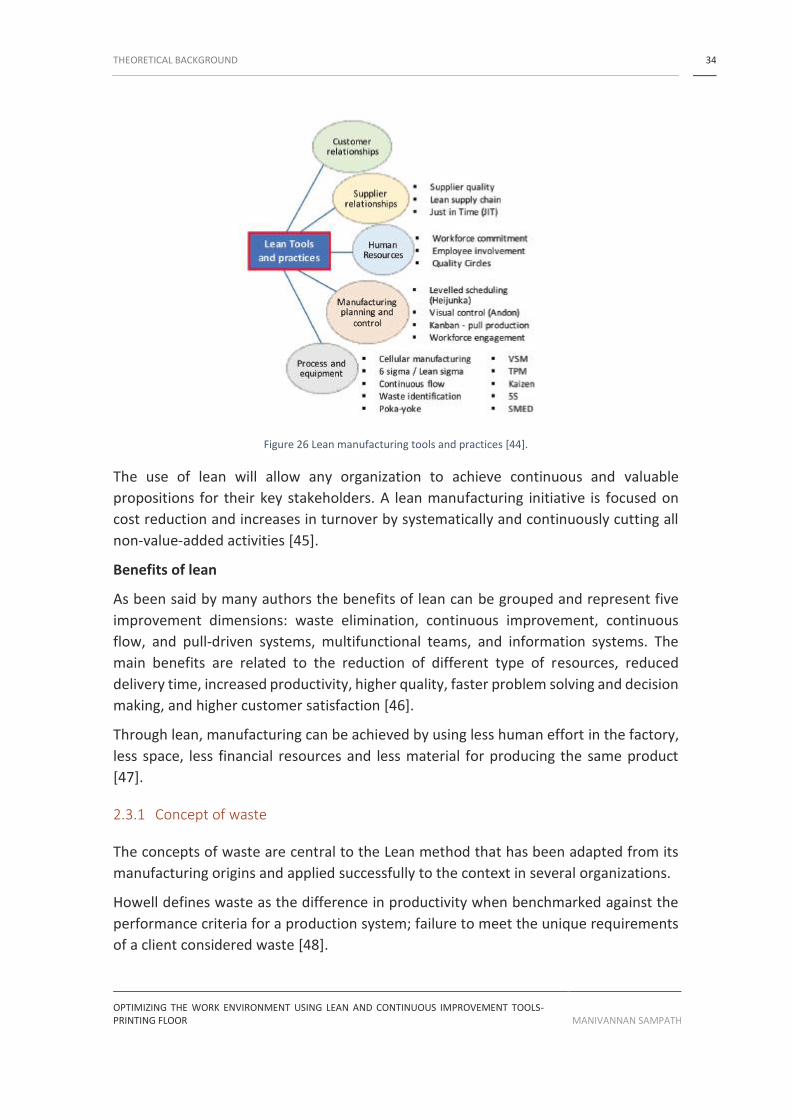
Figure 26 presents the classification of the tools as suggested by Salonitis and
Tsinopoulos [44]
THEORETICAL BACKGROUND 34
OPTIMIZING THE WORK ENVIRONMENT USING LEAN AND CONTINUOUS IMPROVEMENT TOOLS-PRINTING FLOOR MANIVANNAN SAMPATH
Figure 26 Lean manufacturing tools and practices [44]
The use of lean will allow any organization to achieve continuous and valuable
propositions for their key stakeholders A lean manufacturing initiative is focused on
cost reduction and increases in turnover by systematically and continuously cutting all
non-value-added activities [45]
Benefits of lean
As been said by many authors the benefits of lean can be grouped and represent five
improvement dimensions waste elimination continuous improvement continuous
flow and pull-driven systems multifunctional teams and information systems The
main benefits are related to the reduction of different type of resources reduced
delivery time increased productivity higher quality faster problem solving and decision
making and higher customer satisfaction [46]
Through lean manufacturing can be achieved by using less human effort in the factory
less space less financial resources and less material for producing the same product
[47]
231 Concept of waste
The concepts of waste are central to the Lean method that has been adapted from its
manufacturing origins and applied successfully to the context in several organizations
Howell defines waste as the difference in productivity when benchmarked against the
performance criteria for a production system failure to meet the unique requirements
of a client considered waste [48]
THEORETICAL BACKGROUND 35
OPTIMIZING THE WORK ENVIRONMENT USING LEAN AND CONTINUOUS IMPROVEMENT TOOLS-PRINTING FLOOR MANIVANNAN SAMPATH
Waste also defined as ldquoAnything that does not add value to the customer is a wasterdquo
Waste adds to time and cost This definition captures the thinking behind operations
management most effectively because it takes into consideration not just the material
wastes but also other resources like time and labor to which we can assign some form
of value [49]
Waste can be in the form of additional output input or processing It can be in the form
of materials stocks equipment facilities manhours utilities documents expenses
motion and other activities that do not add value [50]
Muda Muri Mura are three different types of wastes
Muda
Muda means waste or uselessness This type of waste characterized by using time
money and resources while not adding any value to the customer The goal of finding
Muda is to recognize which steps are necessary for the process and which need to be
reduced or eliminated [51]
bull Type I Muda Non-value-added tasks which seem to be essential Business
conditions need to be changed to cut this type of waste
bull Type II Muda Non-value-added tasks which can be eliminated at once
Taiichi Ohno the author of Toyota Production System devised seven manufacturing
wastes Overproduction Inventory Over-processing Correction Waiting Conveyance
and Motion [52]
Muri
Muri means overburden or unreasonableness (waste of overloading equipment facility
or people resources beyond its ability)
Mura
Mura means variation or unevenness It refers to waste of unevenness in production
volume It may take two different forms variation in production scheduling uneven
production workload and pace of work
232 POKE-YOKE
In 1961 Shigeo Shingo introduced Poka-Yoke method when he is one of the engineers at
Toyota Motor Corporation This method in other words is to prevent defects and errors
originating in the mistake [53]
The basis for poke yoke is that defects occur because of worker errors Although poke
yokes may be used for mistake-proofing any process poke yokes are usually targeted to
repetitive tasks where the potential for human error is more likely [54] Poka-Yoke
design can dramatically decrease the risk of producing defectives again [55] The aim of
THEORETICAL BACKGROUND 36
OPTIMIZING THE WORK ENVIRONMENT USING LEAN AND CONTINUOUS IMPROVEMENT TOOLS-PRINTING FLOOR MANIVANNAN SAMPATH
Poka-Yoke method is to eliminate or minimize human errors in manufacturing processes
and management because of mental and physical human imperfections [53]
DTommelein [56] after performing mistake-proofing in an AEC (Architecture
Engineering construction) industry stated that mistake-proofing could be practiced
within a specialty (eg plumbing electrical or mechanical work) it can be practiced by
designers manufacturers or fabricators to benefit a product as it is being constructed or
throughout its lifecycle performance or it can be practiced by designers to benefit a
system
Poke-yoke inspection methods
Successive self and source inspection can be achieved using poke yoke methods Poke-
yoke achieves 100 percent inspection through mechanical or physical control [57]
Regulatory functions of poke yoke
There are two ways where poke yoke can be used to correct mistakes
bull Control type
The control poke-yoke is the most robust corrective device because it shuts
down the process until the poor condition has been corrected [57]
bull Warning type
The warning poke-yoke allows defective processing to continue if workers do not
respond to the warning [57]
Figure 27 shows the two types poke yoke methods
Figure 27 Function of Poke-Yoke [58]
The decision to implement a poke-yoke must be made based on a cost-benefit analysis
The control poke-yoke is the more effective in most cases [57]
There are three types of control poke-yoke
bull The contact method finds defects by slight changes in product shape or dimension
are sometimes introduced deliberately to make defects easier to find color
differences
bull The fixed value method decides whether a given number of movements is made
THEORETICAL BACKGROUND 37
OPTIMIZING THE WORK ENVIRONMENT USING LEAN AND CONTINUOUS IMPROVEMENT TOOLS-PRINTING FLOOR MANIVANNAN SAMPATH
bull The motion step method decides whether the established steps or motions of a
procedure are followed [57]
The Poka-Yoke is a technique for avoiding human error at work A defect exists in either
of two states the defect either has already occurred calling for defect detection or is
about to occur calling for defect prediction [59]
Step by step process in applying poka-yoke
bull Find the operation or process
bull Analyze and understand the ways in which a process can fail
bull Decide the right Poka-yoke approach such as using a
o Control Type Preventing an error being made
o Warning Type Highlighting that an error has been made
bull Determine whether a Contact Method Constant Number or Counting Method
Motion-Sequence Method
bull Trial the method and see if it works
bull Train the operator review performance and measure success [60]
233 MUDA
There are two types of waste (Muda)
Muda Type I non-value adding but necessary for end-customers These are usually
harder to eliminate because while classified as non-value adding they may still be
necessary For example while an end-customer might not view quality inspection in car
assembly as value-adding it is necessary to ensure the car meets safety standards
Muda Type II non-value is adding and unnecessary for end-customers These contribute
to waste incur hidden costs and should be eliminated
Figure 28 shows the seven types of waste by Taiichi Ohno
Figure 28 Types of waste [61]
THEORETICAL BACKGROUND 38
OPTIMIZING THE WORK ENVIRONMENT USING LEAN AND CONTINUOUS IMPROVEMENT TOOLS-PRINTING FLOOR MANIVANNAN SAMPATH
Transportation
Transport is an inseparable part of the production processes which cannot be removed
However it does not give any value to the final product and this is why the aim is to
reduce it to the lowest possible level [61]
Inventory
Inventory wastes come from the purchasing storage of excess or excessive supplies
materials and other resources This waste can also be caused by overproduction as
excess materials and work-in-process are accumulated Inventory waste is often due to
a lack of planning and failure to match purchases with the actual consumption or usage
rate of a resource [50]
Motion
Unnecessary movements in the manufacturing environment will result in processing
delays Other unutilized talents are employee lost time excellent skills employee ideas
and recommendations for simplifying the process [62]
Waiting
Some common wait time is caused by processing delays machine or system downtime
response time and signature needed for approval wait time Delay usually caused by the
loading and unloading the workpiece in the machines The operatorrsquos time allocation is
more than that of the actual processing time This excess time allocation for the
operators to do the job increases the overall wait time and delay in the process [63]
Over-production
Making more of a product that is needed results in several forms of waste typically
caused by production in large batches The customers needs often change over the time
it takes to produce a larger batch Over-production has been described as the subdue
waste
Over-processing
Doing more to a product that is needed by the end-customer results in it taking longer
and costing more to produce They do not answer to a real need adding more value to
the service than the customers are willing to pay for Design or build a work that presents
an oversized performance if compared with real demand [64]
Defects
Whenever defects occur extra costs are incurred by reworking the part rescheduling
production etc [61]
THEORETICAL BACKGROUND 39
OPTIMIZING THE WORK ENVIRONMENT USING LEAN AND CONTINUOUS IMPROVEMENT TOOLS-PRINTING FLOOR MANIVANNAN SAMPATH
234 SMED
The SMED method was developed by Shingo (1985) who described it as a scientific
approach to reduce setup times and which can be applied to any industrial unit and to
any machine
SMED is defined as the minimum amount of time necessary to change the type of
production activity taking into consideration the moment in which the last piece of a
previous lot was produced to the first piece produced by the subsequent lot [65]
SMED helps to reduce machine setup times by cutting wastes and unnecessary setup
processes and helps to improve current setup processes and manufacturing flexibility
[66]
By focusing on the elimination of the waste associated with tool changeovers in the
setup phase SMED allows for the reduction of lot sizes and enables one to meet the
fluctuation of demand It further cuts the waste inherent to stock buildup and enhances
a reduction in lead time [67]
The SMED method in association to other Lean tools on a seat-cable assembly line at
the automotive sector company showed a reduction in setup time by at least 583
corresponding to 210 min in a week [68]
A fundamental aspect of the SMED method relates to its features of internal and
external activities
External activities
All the setup activities which do not interfere directly with the equipment and which
can be carried out without interrupting production are designated as being external
activities
Internal activities
Those who imply a stoppage in the equipment running are described as internal
activities The correct separation of the two is what fundamentally contributes to a
reduction in setup times [67]
Figure 29 shows the different phases of a SMED process
THEORETICAL BACKGROUND 40
OPTIMIZING THE WORK ENVIRONMENT USING LEAN AND CONTINUOUS IMPROVEMENT TOOLS-PRINTING FLOOR MANIVANNAN SAMPATH
Figure 29 The phases of SMED method [69]
In sum the SMED method consists of four phases when aiming to reduce setup times
bull PHASE A - In this phase there is not a clear separation between activities that
must be performed while the equipment is stopped (activities that are not
making parts or internal activities) and the ones that can be done while
equipment is running (activities making parts or external activities) In this
phase the involvement of everyone is critical and should be specifically assured
bull PHASE B - This phase refers to the detailed characterization organization and
separation of the operations in internal or external Shingo (1985) considers this
the most crucial phase from which the setup can be reduced from 30 to 50
bull PHASE C - a new analysis of all operations should be done to verify the
classification done in the phase B and focus effort should be directed to convert
internal operations into external The implementation of this phase should
allow an improvement from 10 to 30 in the total time of internal setup of
the phase B [65]
bull PHASE D ndashthe primary goal is to reduce the time of internal and external
operations through the application of the identified solutions that will allow an
easy fast and secure performance
Benefits of Single Minute Exchange of die
bull The reduction of inventory the increase in production flexibility and the
rationalization of tools is among the indirect benefits
bull The direct benefits include the reduction of setup time the reduction of time
spent with fine-tuning the machines the reduction of errors during
changeovers the improvement of product quality and increased safety [65]
235 5S
The 5S lean tool was developed in Japan by Sakichi Toyoda Kishiro Toyoda and Taiichi
Ohno in 1960 [70] 5S is a method of organizing the workspace in a clean efficient and
safe manner to achieve a productive work environment The 5S is a starting point for
THEORETICAL BACKGROUND 41
OPTIMIZING THE WORK ENVIRONMENT USING LEAN AND CONTINUOUS IMPROVEMENT TOOLS-PRINTING FLOOR MANIVANNAN SAMPATH
any company that wants to be recognized as a responsible producer worthy of world-
class status [71]
Implementation of the five levels can reduce the amount of waste and errors and
increase productivity improve safety and quality of products or services [72]
Figure 30 shows the 5 stages of 5s as implementation steps
Figure 30 5S method [73]
The method consists of the sequential following of five steps
bull Seiri (Sort)
The workplace should only have what is needed to perform the activities
Remove all unnecessary tools and parts Go through all tools materials and so
forth in the plant and work area Keep only essential items
bull Seiton (Set in order)
There must be a place for everything and everything should be in its place Quick
and visual identification of tools and areas saves time and eases processes
bull Seiso (Shine)
To keep everything clean and neat One aspect of ldquoSeisordquo is to design and
implement effective methods which must be integrated into the operatorsacute daily
maintenance tasks
bull Seiketsu (Standardize)
Documenting and standardizing the method using standard procedures
Standards should be very communicative clear and easy to understand
bull Shinseki (Sustain)
The last step consists of developing a method to ensure the 5S technique is
followed It needs discipline and focus Usually audits are performed to assure
the sustainability of the method
The implementation of 5s in automotive cable production plant and its case study
concludes that implementing and maintaining 5S method and standards in the company
THEORETICAL BACKGROUND 42
OPTIMIZING THE WORK ENVIRONMENT USING LEAN AND CONTINUOUS IMPROVEMENT TOOLS-PRINTING FLOOR MANIVANNAN SAMPATH
led to improved performances increase of the productivity of the organization the
safety at workplace and the product quality has been increased [73]
5S bring several benefits to a company being the most relevant one the decrease in a
waste of time and space According to Hirano the rewards of applying 5S are extended
to quality security and hygiene [74]
24 Continuum improvement tools
Continuous improvement or Kaizen is a method for finding opportunities for
streamlining work and reducing waste The practice was formalized by the popularity of
Lean Agile Kaizen in manufacturing and business and it is now being used by
thousands of companies all over the world to find savings opportunities Many of these
ideologies can be combined for excellent results For example Kaizen and Kanban can
go hand-in-hand to facilitate continuous improvement
241 PDCA
Deming introduced PDCA to Japanese enterprises in 1950 according to which quality
improvements take place through four significant steps Plan-Do-Check-Act Since then
Japan has become the world leader in quality management [75] PDCA is a successive
cycle which starts off small to test potential effects on processes but then gradually
leads to more substantial and more targeted change [76] It consists of a logical
sequence of four repetitive steps for continuous improvement and learning These all
four steps are repeated over and over as part of a never-ending cycle for improvement
[77] Figure 31 shows the process of the PDCA cycle in a clockwise direction
Figure 31 PDCA Cycle [77]
THEORETICAL BACKGROUND 43
OPTIMIZING THE WORK ENVIRONMENT USING LEAN AND CONTINUOUS IMPROVEMENT TOOLS-PRINTING FLOOR MANIVANNAN SAMPATH
According to Gorenflo and Moran [78] [79] the phases of PDCA can be understood as
follows
bull Plan In this phase opportunities for improvement are found and prioritized the
current situation of the process is investigated through consistent data the
causes of the problem are determined and possible actions to mitigate the
issues are chalked out
bull Do The purpose of this step is to implement the action plan select and document
data voluntarily and note the unexpected events lessons learned and
knowledge gained
bull Check At this point the results of the actions are analyzed The new situation is
compared to the old verifying if there were improvements and whether aims
were met For this various graph support tools are used
bull Action At this stage the team involved develops methods that will standardize
the improvement (if the result has been reached) repeats the test to collect new
data and re-evaluate the intervention (if the collected data is insufficient or
circumstances have changed) or abandon the project and make another
beginning from stage 1 (if the actions taken have not generated useful
improvements)
The application of PDCA has seen various improvements in different scenarios where
they were performed According to PDCA Processes can be improved with changes in
workplace layout material handling system workplace arrangement and
Standardization of operations [80]
The PDCA cycle ensures two types of corrective action ndash temporary and permanent The
short action is aimed at practically tackling and fixing the problem The permanent
corrective action consists of investigation and cutting the root causes and thus targets
the sustainability of the improved process [81]
242 TFM
TFM is then defined as an integrated concept to increase Process Flow and Effectiveness
(Pull) across the Totality of a Supply Chain The targets are the reduction of the total lead
time in the SC Reducing lead time also drops Muda of waiting and really means creating
a material flow [82]
Primarily it is necessary to create an internal pull flow in maximum operational
efficiency and free of non-value added activities (NVAA) then consider the extension to
the valley (the delivery side ie customers) and upstream (the source side ie the
suppliers)
Figure 32 shows the TFM model having the internal pull flow having the suppliers
customers as for source and destination respectively
THEORETICAL BACKGROUND 44
OPTIMIZING THE WORK ENVIRONMENT USING LEAN AND CONTINUOUS IMPROVEMENT TOOLS-PRINTING FLOOR MANIVANNAN SAMPATH
Figure 32 TFM model [83]
The flow of materials can be considered as a repeated sequence of four types of
transaction namely transport inspection waiting and transformation the only value-
added activities The primary objective is the reduction of total lead time as regular
coverage of stocks eliminating Muda process creating benefits in terms of cost
reduction and working capital increased productivity and quality in order to achieve a
higher level of service provided to customers and to improve therefore the satisfaction
[84]
Figure 33 shows the TFM pillars and the strategies involved in each pillar
Figure 33 Total Flow Management Pillars [83]
THEORETICAL BACKGROUND 45
OPTIMIZING THE WORK ENVIRONMENT USING LEAN AND CONTINUOUS IMPROVEMENT TOOLS-PRINTING FLOOR MANIVANNAN SAMPATH
TFM is a model that can trigger a breakthrough in the performance of any Supply Chain
and that embodies the power of a complete lean transformation [83]
The flow of information and materials found through the analysis of logistic loop can be
grouped into three pillars of TFM Figure 33
bull Production Flow
bull Internal coordination flow
bull External coordination flow
In a Total Flow Management optics each of these flows must be analyzed and perfected
by applying the principles of Lean and Kaizen tools
The first step is to improve the production flow which ranks as aims the implementation
of the one-piece flow increased flexibility by adjusting the setup and an increase in
operational efficiency and supply
The improvement actions are divided into these categories
Redesign of the layout and lines in one-piece optical flow redesign of the perimeter of
the line for the efficiency of supply definition of standard work for operational
efficiency SMED technique for flexibility in setup low-cost automation to reduce the
walls
The second step is the optimization of internal logistics flows including all the
movements of small containers inside the plant but also the related information flows
The improvement actions are divided into these categories
bull A system to simplify and streamline internal transport of the material to the point
of use synchronization as coordination between supply and production leveling
productivity of the lines and equipment in relation to the takt time pull
production planning by the actual customer orders
Finally the third step is the optimization of external logistics flows ie the handling of
materials and products generally parceled out in pallet from the factory to customers
and suppliers to the plant
bull In this case the categories of intervention are redesign of the stores and
warehouses creation of the milk run ie an external flow of transport physical
flows in (inbound) and outgoing (outbound) through small containers and
pallets planning pull the logistics to handle the material withdrawals according
to the royal orders of consumers
243 OEE
Overall Equipment Effectiveness (OEE) is a crucial measurement of efficiency in
manufacturing processes (at the machine manufacturing cell or assembly line levels)
THEORETICAL BACKGROUND 46
OPTIMIZING THE WORK ENVIRONMENT USING LEAN AND CONTINUOUS IMPROVEMENT TOOLS-PRINTING FLOOR MANIVANNAN SAMPATH
[9] It is defined as the ratio of producing goods of approved quality to the scheduled
production time (loading time) [85] The OEE has been applied as a measurement tool
and decision-making aid for improving productivity by improving equipment [86] In
general OEE is decided according to each machine used in a production process to
identify its availability quality and performance contributions and to observe the
possible relationships between the different parameters of influence
Equation 2 Represents the formulas involved in calculating OEE
Equation 2 formulations in calculating OEE
119860119907119886119894119897119886119887119894119897119894119905119910(119860) ∶= 119874119901119890119903119886119905119894119898119890 119905119894119898119890 119871119900119886119889119894119899119892 119905119894119898119890frasl
119875119890119903119891119900119903119898119886119899119888119890(119875) ∶= 119873119890119905 119900119901119890119903119886119905119894119899119892 119905119894119898119890 119874119901119890119903119886119905119894119899119892 119905119894119898119890frasl
119876119906119886119897119894119905119910(119876) ∶= 119907119886119897119906119886119887119897119890 119900119901119890119903119886119905119894119899119892 119905119894119898119890 119873119890119905 119900119901119890119903119886119905119894119899119892 119905119894119898119890frasl
119874119907119890119903119886119897119897 119864119902119906119894119901119898119890119899119905 119864119891119891119890119888119905119894119907119890119899119890119904119904 ∶= 119860119907119886119894119897119886119887119894119897119894119905119910 lowast 119875119890119903119891119900119903119898119886119899119888119890 lowast 119876119906119886119897119894119905119910
Figure 34 shows the six significant losses divided into the three categories such as
availability performance and quality where (A) availability is defined as a ratio of
planned production time minus downtime (breakdowns and changeovers) over planned
production time (P) Performance efficiency is the ideal cycle time times the number of
products produced over the actual runtime The (Q) quality rate is the ratio between
accepted products over several products produced
Figure 34 OEE Timeline [87]
Nakajima [86] defines the six significant losses in production as in three categories [85]
THEORETICAL BACKGROUND 47
OPTIMIZING THE WORK ENVIRONMENT USING LEAN AND CONTINUOUS IMPROVEMENT TOOLS-PRINTING FLOOR MANIVANNAN SAMPATH
Downtime losses
1 Equipment failures are categorized as time losses when productivity is reduced
and quantity losses caused by defective products
2 Setup and adjustment time losses result from downtime and defective products
that occur when the production of one item ends and the equipment is adjusted
to meet the requirements of another item
Speed losses
3 Idling and minor stop losses occur when the production is interrupted by a
temporary malfunction or when a machine is idling
4 Reduced speed losses refer to the difference between equipment design speed
and actual operating speed
Quality losses
5 Reduced yield occurs during the initial stages of production from machine startup
to until stabilization
6 Quality defects and rework are losses in quality caused by malfunctioning
production equipment
World class level of OEE is in the range of 85ndash92 for non-process industry [88]
49
ltTIacuteTULO DA TESEgt ltNOME DO AUTORgt
THESIS DEVELOPMENT
31 Production lines characterization
32 Problem characterization
33 Objective
34 Brainstorming
35 SWOT analysis of possible solutions
36 Implementation
THESIS DEVELOPMENT 51
OPTIMIZING THE WORK ENVIRONMENT USING LEAN AND CONTINUOUS IMPROVEMENT TOOLS-PRINTING FLOOR MANIVANNAN SAMPATH
THESIS DEVELOPMENT
31 Production lines characterization
In this section the characteristics of production lines where the work was
performed are briefed and picturized
311 Production line A
There are two printing machines used at this production line they are Heidelberg
Speedmaster 74-5 Heidelberg Speedmaster 52-2 having 5 and 2 printing bodies
respectively each produces products of small batches prints at 15000 sph The machines
are positioned in between the marked yellow line giving enough space for the
production activity to be carried out
Explaining the process in Heidelberg Speedmaster 74-5 production starts by receiving
the order and obtaining required raw materials such as the specified size of printing
paper inks printing plates as per specified in the job sheet
Figure 35 shows the picture of Heidelberg Speedmaster 74-5 printing unit at Marsil
Figure 35 Offset printing SM74-5 unit at Marsil
The inks for the production are introduced into the inking rollers through the reservoir
ducts present at heads of the printing bodies by the machine operator and are evenly
THESIS DEVELOPMENT 52
OPTIMIZING THE WORK ENVIRONMENT USING LEAN AND CONTINUOUS IMPROVEMENT TOOLS-PRINTING FLOOR MANIVANNAN SAMPATH
spread out and so the printing machines are made to run for the inks to reach the
cylinders inside each printing bodies The printing plates are cleaned by cleaning
solutions and introduced into printing bodies in between the plate cylinder and the
impression cylinder(blanket) as the machines grab the plates and set them up through
the press of a button specified at each printing bodies
Figure 36 shows the cleaning solution used for cleaning plates during the production
process
Figure 36 Plate cleaning solution
Control system
Selection of size of the printing area the intensity of the colors to be printed the
thickness of the printing paper size of the production is made through the control
system specified for that printing unit Figure 37 A and B shows the control system
images of Speedmaster 74-5 at the printing unit
A
B
Figure 37 Control systems of SM 74-5
The printing process begins after setup for the production is complete and several prints
for the job being printed and evaluated The evaluation performed through a device that
measures the intensity of the ink printed on the paper and the results compared to the
THESIS DEVELOPMENT 53
OPTIMIZING THE WORK ENVIRONMENT USING LEAN AND CONTINUOUS IMPROVEMENT TOOLS-PRINTING FLOOR MANIVANNAN SAMPATH
expected level by the operator The operator performs a few more prints by changing
the intensity level on the control system and the operation repeated until the operator
has a superior quality of prints for the job This shows that the production unit is partially
automatedFigure 38 A and B shows the image of measuring devices used at every
production unit during preparation operations
A
B
Figure 38 Measuring devices
Figure 39 Shows the image of goods produced by speedmaster 74-5 arraged on pallets
Figure 39 Products produced by SM74-5
The produced goods are then transferred to the next production unit with help of
manual fork lifters where the final goods are produced according to requirements
Figure 40 shows the image of manual fork lifter used for transferring goods
THESIS DEVELOPMENT 54
OPTIMIZING THE WORK ENVIRONMENT USING LEAN AND CONTINUOUS IMPROVEMENT TOOLS-PRINTING FLOOR MANIVANNAN SAMPATH
Figure 40 Manual fork lifter
The speedmaster 52-2p having 2 printing bodies performs printing through two colors
using plates sizing 459x525 mm The setup for the production is the same as the
Speedmaster 74-5 The produced prints are corrected visually by comparing the prints
produced to an ideal print copy and the required intensities of ink to be printed changed
by changing the knob present at the heads of the printing bodies of the machine This
shows that the printing machine is partially automated
Figure 41 shows the image of Speedmaster master 52-2 with control system along with
the printing machine
Figure 41 SM 52-2
312 Production line B
The production line B has two production units speedmaster 52-4 and web-fed offset
printing machine
THESIS DEVELOPMENT 55
OPTIMIZING THE WORK ENVIRONMENT USING LEAN AND CONTINUOUS IMPROVEMENT TOOLS-PRINTING FLOOR MANIVANNAN SAMPATH
Figure 42 shows the image of Speedmaster 52-4 at the production line
Figure 42 SM 52-4
The speedmaster 52-4 has 4 printing bodies using 4 colors for the printing process with
the printing plates sizing 459x525 mm The produced prints are corrected at the
workstation which also has a control station The setup for the production is the same
as the Speedmaster 74-5 The printing machine has a control system separately with the
work station
THESIS DEVELOPMENT 56
OPTIMIZING THE WORK ENVIRONMENT USING LEAN AND CONTINUOUS IMPROVEMENT TOOLS-PRINTING FLOOR MANIVANNAN SAMPATH
Control system
The control system for speedmaster 52 4 is provided with the workstation where the
evaluation works are performed and the input is fed accordingly For example the
thickness of the sheet dimensions of the printing area adjustments of the margins the
flow of die and much more can be performed
Figure 43 shows the images of the control systems for Speedmaster 52-4
Figure 43 A and B control systems for Speedmaster 52-4
Figure 44 shows the image of goods produced by the printing machine SM 52-4
Figure 44 Goods produced at SM 52-4
The next printing unit in this line is the didde web offset printing machine with 4 printing
bodies capable of printing 80m minute Sheets of the maximum length of 340mm to a
minimum of 100mm can be printed The machine is installed spatially along with the
other 3 machines
THESIS DEVELOPMENT 57
OPTIMIZING THE WORK ENVIRONMENT USING LEAN AND CONTINUOUS IMPROVEMENT TOOLS-PRINTING FLOOR MANIVANNAN SAMPATH
Figure 45 shows the picture of didde web-fed printing unit at Marsil
Figure 45 Web-fed Printing unit
Control system
The control systems at these production units assigned along with the printing bodies
The usage of the printing bodies adjusted according to the work needs by removing one
of the gears at a specific printing body that is not involved in the working of the printing
machine
Figure 46 shows the image of goods produced by didde webfed printing machine
Figure 46 Products produced at the webfed unit
THESIS DEVELOPMENT 58
OPTIMIZING THE WORK ENVIRONMENT USING LEAN AND CONTINUOUS IMPROVEMENT TOOLS-PRINTING FLOOR MANIVANNAN SAMPATH
313 Production line C
The Production line c has two printing machines they are heidelberg SORM-Z and
heidelberg GTO 52
The heidelberg SORM-Z semi automated printing machine consists of 2 printing bodies
uses printing plates with size 720x540 mm capable of printing 30 million copies having
printing format maximum of 720x540 mm and minimum of 280x210 mm The machine
is positioned patially along with heidelberg GTO The control system is provided along
with the machine Each machine at the production floor is provided with fire
extinguishers as safety precautions
Figure 47 shows the image of heidelberg SORM-Z at the printing floor
Figure 47 Heidelberg SORM-Z
The heidelberg GTO- 52 capable of printing sheets maximum of 520x360 mm to
minimum of 160x80 mm with two printing bodies printing 8000 sph The control system
for GTO-52 comes along with the printing machine
Figure 48 shows the image of heidelberg GTO-52 at the printing floor
Figure 48 Heidelberg GTO-52
THESIS DEVELOPMENT 59
OPTIMIZING THE WORK ENVIRONMENT USING LEAN AND CONTINUOUS IMPROVEMENT TOOLS-PRINTING FLOOR MANIVANNAN SAMPATH
314 Production line D
The Production line D has 3 heidelberg minivera machines cutting machines striching
machines finishing machines as well as laminating machines at the other half of the
production floor
Three heidelberg minerva machines are used for the purpose of cutting and ceasing with
maximum format of 360x260 mm to a minimum format of 80x50 mm operating at a
speed of 3000 sphFigure 49 shows the 3 heideberg minerva cut and cease machines at
the printing floor
Figure 49 Heidelberg Minerva
The cutting machines each are with specific specification but all does the same work of
cutting required printing sheets for productioncutting works required by the printed
products
Table 2 Shows the specifications of three cutting machines present at the floor
Table 2 cutting machine specification
Model Maximum
format
Minimum
format
Polar-76 760x760 mm 30x760 mm
Polar 78 780x780mm 30x780mm
Polar-92 920x920mm 30x920mm
Figure 50 shows the picture of polar 92 cutting machine
THESIS DEVELOPMENT 60
OPTIMIZING THE WORK ENVIRONMENT USING LEAN AND CONTINUOUS IMPROVEMENT TOOLS-PRINTING FLOOR MANIVANNAN SAMPATH
Figure 50 Cutting machine polar 92
There are two finishing machines at the floor they heidelberg STAHL Ti-52 and Double
600i
Heidelberg STAHL Ti-52 performs actions such as creasing perforating and cutting jobs
in the folder It increases fold quality and allows for a multi-up processing having
processing speed of 200 mminute and 10 mminute as maximum and minimum speed
respectively This machine is used for creating magazines which includes all the above
mentioned actions
Figure 51 shows the image of heidelberg STAHL Ti-52 finishing machine
Figure 51 Heidelberg STAHL Ti-52
The double 600i finishing maching with maximum format of 660x330 mm to a minimum
of 120x180mm performing at a speed of 3750 sph performs the same actions as of
heidelberg STAHL Ti
Figure 52 shows the image of double 600i finishing machine at the printing floor
THESIS DEVELOPMENT 61
OPTIMIZING THE WORK ENVIRONMENT USING LEAN AND CONTINUOUS IMPROVEMENT TOOLS-PRINTING FLOOR MANIVANNAN SAMPATH
Figure 52 Double 600i
32 Problem characterization
The problems in the company were segmented as follows -
1 Missing of machine tools in the printing floor creating a tool room The issue is
when a specific tool is taken for a machining purpose the tool is left somewhere
unnoticed after its use causing difficulties (waste of time) when the same tool is
needed by another worker on the floor no enlistments of the tools neither
proper maintenance of the tool room nor tool chart
Figure 53 shows the tool room used left with residues and the tool board being empty
Figure 53 Pegboard with the missing tools
2 Improper usage of the inkrsquos in the paint room the issue found to be is that inks
are prepared and stored in tins these ink tins are labeled in markers and left
THESIS DEVELOPMENT 62
OPTIMIZING THE WORK ENVIRONMENT USING LEAN AND CONTINUOUS IMPROVEMENT TOOLS-PRINTING FLOOR MANIVANNAN SAMPATH
open once after their use These ink tins do not have any organized setup such
that the tins of different Pantone numbers get mixed up resulting in the
unnoticed behavior of the operator lead to drying of paints and ending as
waste
3 The company has printing machines using printing plates of four varied sizes 400
x 510 mm 450 x 628 mm 605 x 745 mm 615 x 724 mm The printing plates
which are made for the printing works are used and they are kept organized on
the floor according to their client once after the job is completed This has been
followed for a long time and ended up in stacking up vast volumes of printing
plates together which resulted in consuming a lot of time while retrieving those
when there is a reorder of a job made by the client The time taken for a worker
to retrieve a plate for a specific job was found to be 15-30 mins and up to 60
mins at times When a specific printing plate was not to be found set of printing
plates for the concerned job is made and provided to workers resulting in added
wastage of the production time
Figure 54 shows the image of plates arranged on the floor according to their clients
Figure 54 Printing plates arranged on the floor according to their clients
33 Objective
The aim of this thesis is to improve the conditions of the above-stated problems at
Marsil with the help of lean tools and continuous improvement tools by
bull Creating a tool room for the machinery works to take place and to create a tool
chart for organizing tools
bull Creating a system for organizing the ink tins in the paint room
THESIS DEVELOPMENT 63
OPTIMIZING THE WORK ENVIRONMENT USING LEAN AND CONTINUOUS IMPROVEMENT TOOLS-PRINTING FLOOR MANIVANNAN SAMPATH
bull Implementing a system for the printing plates to be organized and quick retrieval
of the plates from the system for the printing jobs
34 Brainstorming
Brainstorming is a process of generating ideas and solutions through fast thinking and
group discussion In this section brainstorming is made on the problems said by the
management and possible solutions and ideas were reached
341 Objective A
Brainstorming sessions were made on the creating a tool room consisting of a tool-chart
The problem seen was the tool room stuffed with many printed goods machines and
with residues of works performed in the room
Figure 55 shows various causes that led to the missing of tools on the production floor
as well as unmanaged tool room
Figure 55 Cause and Effect diagram on missing tools and unmanaged paint room
Researches were done on the process of creating a system that keeps tracks on the
usage of tools and controlling the flow of resources from the pegboard Kanban pull
system is studied where the goal of such a system is to replace what has been consumed
at that time when resources are needed or asked Here in this system color cards
(Kanban cards) of different colors will be used to show the availability of the resource in
the clipboard Layout of the working floor made by showing the production lines and the
working areas as blocks in different colors The color of each production line shows the
color card or the Kanban card assigned to it
THESIS DEVELOPMENT 64
OPTIMIZING THE WORK ENVIRONMENT USING LEAN AND CONTINUOUS IMPROVEMENT TOOLS-PRINTING FLOOR MANIVANNAN SAMPATH
In preparing setting up the system the documentation of the work which includes the
checklists of the available tools and machinery should be made and checked the working
of the system is then explained to all the operators in the printing floor and the system
should be studied regularly
342 Objective B
The issue said to be the lack in the organization of ink tins in the paint room Inks are
prepared according to the production needs ie when the job sheet reaches the
respective production unit on the printing floor press operator decides to make the
required ink for the production use for that specific job The ink is prepared with the
help of the Pantone matching system which shows the required quantity of colors to be
mixed in creating that ink which is then stored in tins
After the production process in preparing the prints of a job is completed tin consisting
the remaining quantity of ink is labeled with Pantone number by markers as indicators
and are stored in the paint room These paint tins are left unnoticed due lack of proper
arrangement which is left to dry and is not used again to solve this issue discussions
were made and an idea was proposed in arranging the ink tins according to Pantone
series
Figure 56 shows the various causes their part leads to unorganized ink tins and drying
of paints
Figure 56 Cause and effect diagram on unorganized ink tins
Discussions were made and ideas were explored on areas of warehouse codification
and arranging the ink tins in a better way for easy accessibility and labeling of the ink
tins
THESIS DEVELOPMENT 65
OPTIMIZING THE WORK ENVIRONMENT USING LEAN AND CONTINUOUS IMPROVEMENT TOOLS-PRINTING FLOOR MANIVANNAN SAMPATH
343 Objective C
The problems told by the management before working on the printing plates were the
operators spend much longer time in searching for the printing plates when there is a
job that needs printing plates produced before as because many clientrsquos requests
reorder and they do not have a system for organizing the printing plates
The first scenario was printing plates kept on the floor according to the clients with
support to the wall Since the company provide service to many clients there exist many
printing plates associated to many job numbers The workers receive the order sheet
have the order made by the client which consists of the order number size of the plate
number of plates to be used for the specific job and a preview copy of the same job that
was done long before The order sheet also includes the work of the previous jobs
carried on the same work with few variations So this ensures that there are many job
sheets of different order numbers of the same work The management also told that if
there are changes in a job that has been done before the plate manufacturer prepares
the new plates for job updates the order sheet of the job This order sheet and the plate
along with plates is received by the operator and the job is carried out The plates are
arranged along with other plates that were made for the same client The operators in
the printing floor said that it might take them 30-45 mins or even more when they are
trying to retrieve plates for reorders
Figure 57 shows the cause and effect diagram on setup made by the organization
Figure 57 Cause and effect diagram on printing plate setup made by management
THESIS DEVELOPMENT 66
OPTIMIZING THE WORK ENVIRONMENT USING LEAN AND CONTINUOUS IMPROVEMENT TOOLS-PRINTING FLOOR MANIVANNAN SAMPATH
Discussions made with operators and the management about a system for the
organization and retrieving the plates in a short span of time Researches made onto
check types of storing systems available in the market for organizing the plates Results
were found with systems capable of hanging the plates to it with the help of hooks with
covers for the plates and found to be expensive Hence disagreed by the management
In minimize the usage of production time in searching for the printing plates for an
order the organization suggested arranging the printed plates inside the cardboard
boxes(boxes of the printing plates when bought newly) The method proposed to be
simple that involves arranging the plates inside the boxes and specifying a number on
the boxes that will be written in the order sheet that the operators receive The capacity
of each box found to be 60 and arranging 60 plates in those will be seeming to be
congested and will be difficult for the operators in retrieving the necessary plates
needed for a job and will consume a lot of space and requires work to be done while
arranging them in boxes
The printing plates have information such as the companyrsquos name model number job
number sheet number date of manufacturing the plates So all these need to be
considered while designing the system for the organization of the printing plates
The company had resources in implementing three racks with the length of 240 cm The
idea was to divide the rack of length 240 cm into 54 slots with separators between each
slot The thickness of the separators is 04 cm and the width of each slot is 4cm a rough
estimation of 35-40 plates each of 450 x 628 mm shall be placed into those slots and a
total of 2160 plates can organize into these 54 slots divided from 240 cm length rack
Identification of the plates can be made by code which has a combination of an alphabet
and number The codification will be made by assigning an alphabet to each row and a
number to each slot Here the alphabets A B C assigned to the three racks and the
numbers from 1- 54 assigned to the slots Hence the plates can be arranged into the
slots which give the slot locations as A1 A2 A3 119860119899etc
Figure 58 below-mentioned flowchart shows the flow of work from receiving the order
manufacturing the printing plates operators receiving the plates for production
management decision on saving the plates or throwing them away as thrash
THESIS DEVELOPMENT 67
OPTIMIZING THE WORK ENVIRONMENT USING LEAN AND CONTINUOUS IMPROVEMENT TOOLS-PRINTING FLOOR MANIVANNAN SAMPATH
THESIS DEVELOPMENT 68
OPTIMIZING THE WORK ENVIRONMENT USING LEAN AND CONTINUOUS IMPROVEMENT TOOLS-PRINTING FLOOR MANIVANNAN SAMPATH
Figure 58 Flow chart
THESIS DEVELOPMENT 69
OPTIMIZING THE WORK ENVIRONMENT USING LEAN AND CONTINUOUS IMPROVEMENT TOOLS-PRINTING FLOOR MANIVANNAN SAMPATH
35 SWOT analysis of possible solutions
In this section SWOT analysis is made on the ideas proposed for the aim to understand
the strength weakness opportunities and threats involved in implementing the ideas
351 Objective A SWOT analysis
The SWOT analysis made on the idea to be implemented in creating a tool chart
distribution of tools to all the units at the printing floor and in the maintenance of the
tool room
Figure 59 shows the SWOT analysis of Strength weakness opportunity and threats
involved in implementing the tool 5s and in creating the tool chart
Figure 59 SWOT analysis on objective A
352 Objective B SWOT analysis
The SWOT analysis performed on organizing the ink tins on shelves shows various
strengths weakness opportunities threats gathered giving enough support in
implementing the system
Figure 60 shows the strength weakness opportunity and threat involved in creating a
system for organized ink tins
THESIS DEVELOPMENT 70
OPTIMIZING THE WORK ENVIRONMENT USING LEAN AND CONTINUOUS IMPROVEMENT TOOLS-PRINTING FLOOR MANIVANNAN SAMPATH
Figure 60 SWOT on objective B
353 Objective C SWOT analysis
The SWOT analysis structured on the idea of creating a system in organizing the printing
plates into it The positive effects in using the continuous improvement tool in
implementing the system and gathering of data about the plates and configuring them
in working together to work efficiently
Figure 61 shows the Strength weakness opportunity and threats involved in creating
two systems for organizing the plates
THESIS DEVELOPMENT 71
OPTIMIZING THE WORK ENVIRONMENT USING LEAN AND CONTINUOUS IMPROVEMENT TOOLS-PRINTING FLOOR MANIVANNAN SAMPATH
Figure 61 SWOT on objective C
36 Implementation
This section shows the practice of the continuous improvement and other lean tools on
each of the objectives and their procedures in implementing the steps and achieving the
results
361 Implementation of 5S
Implementation steps
1 The tool room was initially seen filled with printed goods and with other finished
materials These printed materials were considered waste by the company since
they were outdated and did not add any value Hence they were cleared from
the tool room
2 Tools except machinery tools (tools that came along with the machine) were
collected from every production line and an inventory list of the available tools
in the printing floor was made Tools that were needed or requested by any
operator were bought so the missing tools were covered
Figure 62 shows the image of tools collected as being a step in implementing 5s
THESIS DEVELOPMENT 72
OPTIMIZING THE WORK ENVIRONMENT USING LEAN AND CONTINUOUS IMPROVEMENT TOOLS-PRINTING FLOOR MANIVANNAN SAMPATH
Figure 62 Collected tools
3 Tools are left to hang on the pegboard with the help of hooks Organization of the
tools were done according to increase in the order of their sizes for each category
of tools and were arranged in such a way that the entire pegboard is filled with
the available tools
4 The entire tool room was cleaned and for the distribution of tools to the
machines at the printing floor Kanban system was studied and the use of
Kanban cards to effectively implement the pull system
5 The entire layout of the printing floor with production lines was designed During
this process production lines in the floor have been segmented and were
assigned to a specific color in the layout design The Kanban cards of colors Red
green yellow orange dark blue brown and purple were made These Kanban
cards represents the segmented production units designed in the layout
Figure 63 kanban cards of different colors created to replace the tool spot in absence of
tools from the peg board
Figure 63 Kanban cards
THESIS DEVELOPMENT 73
OPTIMIZING THE WORK ENVIRONMENT USING LEAN AND CONTINUOUS IMPROVEMENT TOOLS-PRINTING FLOOR MANIVANNAN SAMPATH
Figure 64 shows the simple layout of the printing floor with the position of production
units defined in colors to show the Kanban cards assigned to those units
Figure 64 Simple floor layout is highlighting the production units in colors
6 The designed printing floor layout along with the Kanban cards left to hang
alongside with the pegboard to visually help the operator to understand the
system
Working of the system
The system works with the help of the color cards
bull When an operator needs a tool for a specific work to be performed the operator
should check the layout designed which shows the production line and the
associated color
bull The next step is pick up a color card of the production line and place it in the place
where the tools are rested in the pegboard Placing the color card in the tool place
shows that the tool is in use
bull The tool that is taken for performing work is returned by dropping down the color
card from the pegboard and replacing it with the tool that is taken
Standardized procedures have been written on the working of the system usage of the
5s method and were explained to the workers using the Kanban card system
implemented This also includes the documentation work on the inventory list of all the
available tools on the clipboards and their quantities This stage of 5s educates everyone
on the printing floor about the implemented method and to increase awareness about
the maintenance of the tool room and about the usage of the tools
THESIS DEVELOPMENT 74
OPTIMIZING THE WORK ENVIRONMENT USING LEAN AND CONTINUOUS IMPROVEMENT TOOLS-PRINTING FLOOR MANIVANNAN SAMPATH
Figure 65 shows the inventory list taken while performing the tool 5s
Figure 65 inventory list of tools
7 Once after implementation and explaining the working of system to all operators
the tool room was inspected for a period During this period the entire system
was evaluated by using a checklist of available tools and tools on the pegboard
It was also seen that the tool room is cleaned regularly and the usage of the cards
by operators while selecting a tool and returning it was followed
Figure 66 and Figure 67 shows the images of the tool room before and after
implementation of the 5s tool
THESIS DEVELOPMENT 75
OPTIMIZING THE WORK ENVIRONMENT USING LEAN AND CONTINUOUS IMPROVEMENT TOOLS-PRINTING FLOOR MANIVANNAN SAMPATH
Figure 66 Toolroom before implementation
Figure 67 Toolroom after implementation
362 Implementation of 5S in paint room
Implementation steps
1 Initially ink tins were checked to confirm that the inks are in good condition or
whether they have dried By doing so the tins with proper ink separated from
the bad ones and were gathered in a separate place in the paint room
2 Space is created after moving the tins and resources for building the racks in the
paint room were bought by the management 2 columns each with 5 racks
constructed with the help of nuts and bolts 3 Labels for showing information such as the Pantone number and for showing the
odd and even sides of the rack were designed and printed Each column has five
racks where the left side of the first rack label mentioned as ldquoseries starting with
1 -ending with an odd numberrdquo and on the right side of the rack ldquoseries starting
with 1 and ending with the even numberrdquo were struck Similarly for Pantone
THESIS DEVELOPMENT 76
OPTIMIZING THE WORK ENVIRONMENT USING LEAN AND CONTINUOUS IMPROVEMENT TOOLS-PRINTING FLOOR MANIVANNAN SAMPATH
series 2 till Pantone series 10 labels are struck on both sides of the rack showing
the odd and even sides of the series
Figure 68 shows label struck on shelf as indicators for organizing the ink tins
Figure 68 Labels as indicators
4 After indicators were struck on the racks labels for showing Pantone number
were struck on the ink tins and the Pantone number is written on them The
Pantone number is written to show the ink associated with it and ink tins were
organized according to indicators on the racks For example consider a ink tin
labeled with Pantone number 8442 which starts with series 8 and ends with an
even number so this ink tin should be placed on the side of the rack labeled
ldquoseries starting with 1 and ending with the even numberrdquo The process was
carried out for all tins and were organized on the racks
Figure 69 shows the label designed for ink tins
Figure 69 Lable for ink tins
5 Later the room was cleaned and method of organizing ink tins on the racks were
explained to the press operators Procedures on how to use the racks were
THESIS DEVELOPMENT 77
OPTIMIZING THE WORK ENVIRONMENT USING LEAN AND CONTINUOUS IMPROVEMENT TOOLS-PRINTING FLOOR MANIVANNAN SAMPATH
documented and displayed next to the racks for operators understanding
purposes and as part of work ethics
Figure 70 shows ink tins organized in shelves with labels as indicators according to the
Pantone numbers
Figure 70 Ink tins arranged on shelves after implementation
363 Implementation of PDCA
The implementation of printing plate system is gone ahead with the help of PDCA (plan
do check act) cycle
The plates arranged on the floor includes plates manufactured from the year 2005till
present The management also said that there are plates outdated due to changes made
from the client side The plates used for the production process are picked by operators
by searching in the place where the plates according to clients are placed This time for
retrieval of the plates for the production reported being high so performance sheets
were given to the operators for recording the time
Table 3 Shows time taken by operators in retrieving the plates for various jobs before
implementation
THESIS DEVELOPMENT 78
OPTIMIZING THE WORK ENVIRONMENT USING LEAN AND CONTINUOUS IMPROVEMENT TOOLS-PRINTING FLOOR MANIVANNAN SAMPATH
Table 3 Time taken before implementation
SL No Job Number Time-Taken
1 173815 10 mins
2 173780 15 mins
3 173791 15 mins
4 180085 10 mins
5 171060 10 mins
6 174604 30 mins
7 174546 15 mins
8 180018 40 mins
9 174117 15 mins
10 174085 15 mins
Jobs are carried out after wasting the production time in searching for plates and the
average time in searching the plates for these ten jobs is 17 min and 5 seconds
Implementation steps
1 By obtaining a list of companies that have made changes the separation process
will begin The changes include updated logo of the clients updated capitais
sociais most of the clients were private banks having new capitais sociais
number The separation process started by looking at the information on each
plate and the preview sheet attached to it Around 1000 plates considered waste
during the process of separation
THESIS DEVELOPMENT 79
OPTIMIZING THE WORK ENVIRONMENT USING LEAN AND CONTINUOUS IMPROVEMENT TOOLS-PRINTING FLOOR MANIVANNAN SAMPATH
Figure 71 shows the image of plates segregated while taking inventory and arranged on
pallets
Figure 71 Separation of plates in pallets
Figure 72 shows the image consisting data about capitais socials of various clients
Figure 72 Information regarding captais socials
2 The printing plates with information regarding client job number model number
and date of manufacturing of the plates etc used in creating a list of inventories
of all the plates in Microsoft Excel
THESIS DEVELOPMENT 80
OPTIMIZING THE WORK ENVIRONMENT USING LEAN AND CONTINUOUS IMPROVEMENT TOOLS-PRINTING FLOOR MANIVANNAN SAMPATH
Figure 73 shows information about the plate used in creating the inventory list of all the
plates
Figure 73 Information about the plate
3 The company had resources where three racks each of 240 cm in length stacked
one upon the other for the plates sizing 450 x 628 mm and another three racks
of the same length for the plates sizing 605 x 745 mm were installed
respectively The design of the system was discussed with a local carpenter and
the dimensions recorded for the creation of a prototype
Figure 74 shows the image of the prototype being created by placing the separators in
between the slots for plates to be stored
Figure 74 Image taken during the creation of the prototype
THESIS DEVELOPMENT 81
OPTIMIZING THE WORK ENVIRONMENT USING LEAN AND CONTINUOUS IMPROVEMENT TOOLS-PRINTING FLOOR MANIVANNAN SAMPATH
4 The prototype of length 240 cm consisting of 27 slots each of 4 cm in width with
separators in between the slots was designed and installed The prototype was
inspected by placing 35-40 plates of few job numbers on single slot and
operators on the working floor were asked to pick a specific job from the plates
that were kept in the slot The operators were able to pick the specific job plates
in the noticeably time span of 2 mins finally the entire system was made and
installed for 450 x 628 mm and 605x745 mm size plates
5 Plates belonging to a set of job numbers were placed into the slots and their
position in the system is mentioned in the inventory list The position of the
plates will be decided by an alphabet that stands for each row and the numbers
for each slot Considering a random job number 180176 say has 6 plates and they
are kept in the 15th slot of row A so the position of the plates of that specific job
number will be A15 Similarly all plates were arranged into the system and their
positions are updated in the inventory list
Figure 75 shows the information about the plates organized in the system and their
positions mentioned as slot numbers
Figure 75 Inventory list of the plates
6 Apart from the plates that were organized into a system there are plates that will
be manufactured for new jobs or any changes to the previous job will be
regarded as new plates Here the new plates will replace the plates of the
previous job and the job number is updated in the inventory list
7 The system will become full by adding new plates and this makes the system to
be congested and difficult for operators to handle to avoid this situation some
plates must be removed from the system
Figure 76 shows the image of plates into the system with lables for identifying the plates
at the respective slots
THESIS DEVELOPMENT 82
OPTIMIZING THE WORK ENVIRONMENT USING LEAN AND CONTINUOUS IMPROVEMENT TOOLS-PRINTING FLOOR MANIVANNAN SAMPATH
Figure 76 image of plates organizeed with labels
8 Removal of plates from the system needs either the plate should be outdated or
changes in any job made from the clientrsquos side or when there is a complete
change in for a new season from the client
9 The system was full after organizing the plates and space for arranging new plates
is gathered by removing old plates which are manufactured in 2010 2011
20122013 400 plates were removed giving space for new printing plates to rest
in the system
10 The system was set completely and evaluating sheets were given to the
operators of the production lines to make a note of the timing spent on retrieving
the plates from the system
Error Reference source not found shows the time taken by the operators in retrieving
the plates for the jobs to be done It also says that the time taken by operators has been
reduced and the average time is taken in searching for the plates of the jobs found
reduced to 2 minutes and 3 secs
THESIS DEVELOPMENT 83
OPTIMIZING THE WORK ENVIRONMENT USING LEAN AND CONTINUOUS IMPROVEMENT TOOLS-PRINTING FLOOR MANIVANNAN SAMPATH
Table 4 Time observation after implementation
SL No Job Number Time Taken
1 153517 2 mins
2 174172 3 mins
3 163923 2 mins
4 180634 2 mins
5 170890 2 mins
6 181293 3 mins
7 162477 2 mins
8 173660 2 mins
9 173373 2 mins
10 162185 3mins
ChartGraph 1 shows the comparison of the time-taken in retrieving the plates during
before implementation and after implementation of the system
ChartGraph 1 Comparison of time on before and after implementation
0 5 10 15 20 25 30 35 40 45
1
2
3
4
5
6
7
8
9
10
Time
Job
after implementation before implementation
THESIS DEVELOPMENT 84
OPTIMIZING THE WORK ENVIRONMENT USING LEAN AND CONTINUOUS IMPROVEMENT TOOLS-PRINTING FLOOR MANIVANNAN SAMPATH
Figure 77 shows the image of plates organized on floor before implementation of the
system for storing plates
Figure 77 Before implementation
Figure 78 shows the image of plates organized into the systems created with labels as
indicators for slots and racks
Figure 78 After implementation
11 Systems of organizing plates for the plates sizing 459x525 mm and 605x745 mm
having a capacity of 6800 and 4000 were setup respectively
12 The system is reviewed often such that it does not overflow and causing the
workers to adapt to the earlier situation of arranging the plates on the floor
Inspections are made to check whether there are old plates
The cost of material used in making the system is 300euro
Labour cost in creating the system according to the specifications is 1700euro
Total cost in creating systems for 2 different sizes is 2000 euro
THESIS DEVELOPMENT 85
OPTIMIZING THE WORK ENVIRONMENT USING LEAN AND CONTINUOUS IMPROVEMENT TOOLS-PRINTING FLOOR MANIVANNAN SAMPATH
It is the responsibility of the management to be updated in the orders of the clients at
each season and to follow the cycle to keep the system working
SMED Practice
The Single Minute Exchange of die (SMED) tool is performed when the setup process
for the jobs seem to consume a lot of production timeAt the end of each production
the products produced unloaded to a pallet and the operator continues for the next
setup process of productionOperator looking at the job sheet searches for required
printing plates or the operator will receive the plates in case if the job is new
Activities carried out before the setup operation are mentioned below-
bull The setup process includes cleaningchanging of plates
bull Changing ink at the printing bodies of the printing machine
bull filling up the paper tray at the feeding unit of the printing machine
bull cleaning of impression cylinder(rubber) in each printing body
bull changing the ink absorbing cloth at each head for every 24 jobs
Implementation steps
1 The tool was performed on speedmaster 52-4 speedmaster 74-5 and the
speedmaster 52-2 and data about the setup times for different jobs are
gathered
Table 5 shows the performed actions during the setup phase and their time averages
THESIS DEVELOPMENT 86
OPTIMIZING THE WORK ENVIRONMENT USING LEAN AND CONTINUOUS IMPROVEMENT TOOLS-PRINTING FLOOR MANIVANNAN SAMPATH
Table 5 Average time of actions performed on three machines
Sl no Actions performed SM 52-2 SM 52-4 SM 74-5
1 Cleaning of machine 33125 31175 3828333
2 Searching the plate 09675 2513333 12
3 Cleaning of plates 1795 3505 3263333
4 Removing plate of
the earlier job 16425 15825 153
5 Introducing ink 14325 2413333 2883333
6 Introducing plate and
input 17575 29775 4976667
7 Setting up paper 5415 82425 1145
8 Average setup time 163225 2312 2669
2 The actions performed during the calculation of setup times were almost similar
in all the three machines The average setup time calculated and found to be
1632 2312 2669 for SM 52-2 SM 52-4 SM 74-5 machines respectively
3 The time is taken for the actions performed compared with all the three
machines and grouped as internal and external actions ie The movement of
the operation involving the work done during the setup process recorded as stop
events occurring at the printing machines on event log sheets in minutes with
the help of stopwatch
Table 6 shows the actions performed by the operators during the setup process
segmented into internal and external actions
Table 6 Performed actions categorized into internal and external
Internal actions External actions
Changing of plates Few prints were taken after setup
Changingintroducing ink Production after setup
Cleaning of printing plates Evaluation
Searching for needed printing sheets
Searching for pallets for transferring
finished products
THESIS DEVELOPMENT 87
OPTIMIZING THE WORK ENVIRONMENT USING LEAN AND CONTINUOUS IMPROVEMENT TOOLS-PRINTING FLOOR MANIVANNAN SAMPATH
4 The next step is the conversion of possible internal elements into external
elements ie actions performed during off state of the machine performed
when the machine is running
5 The total time spent on performing the internal actions is higher than the time
spent on the external actions Here the possible internal actions that can be
performed during machine operation are searching searching for needed
printing sheets An average of 5415 8241145 minutes spent in printing
machines SM 52-2 SM 52-4 SM 74-5 respectivelyin searching for new printing
sheets and to get printed samples
6 The average time spent on searching for the plates for the jobs is 251 in case of
SM 54-5 and being less in the other two machines is because of new jobs In the
case of new jobs plates are produced and handed over to the printing operators
in prior
7 The time on searching for new printing sheets and as well as cutting can be solved
by having the right material flow to all the printing machines in the printing floor
In explaining the scenario places next to the printing machines of SM 52-2 and SM 52-4
are occupied by printed stock materials
Figure 79 shows the picture of finished goods to be used for production stored at the
production floor
Figure 79 shows the space occupied by printed goods right near the printing machines
Goods are mostly printed materials of invite cards designation cards documented
forms of many clients stored on pallets The space occupied by these goods can be used
for storing the printing sheets needed by the printing machines The printed materials
for production use can be stored at the huge shelves made for organizing the printing
materials like coated papers and papers of different GSMs These shelves must be
categorized labelled and organize printing papers according to their availability during
production process
Figure 80 shows the image of shelves for storing purposes near the loading area at the
printing floor
THESIS DEVELOPMENT 88
OPTIMIZING THE WORK ENVIRONMENT USING LEAN AND CONTINUOUS IMPROVEMENT TOOLS-PRINTING FLOOR MANIVANNAN SAMPATH
Figure 80 Shelves for storing purposes
The proposal is by hiring a worker performing the internal activities like searching of the
plate cleaning of plates searching for needed papers ink for production from the paint
room and every other possible helps that an machine operator requires
In the total production time of 10 hrsday 2 hrs is spent on internal activities by the
operators
In justifying the above-mentioned proposal in hiring an employee
Total production time wasted on the printing floorday = 120 mins
Production cost hr on Speedmaster 522=30 euro
Production cost hr on Speedmaster 524 = 30 euro
Production cost hr on Speedmaster 745 = 60 euro
The operators from SM 522 and SM 524 together and SM 74-5 consume 1 hour each
respectively in doing all the internal operation for a day
Total production loss day =120 euro
Total production loss month =12020=2400 euro
The minimum wage of an employee in Portugal =67667 euro
Total savings by hiring an employee for a month=2400-67667=172333euro
So by hiring an employee for all the printing machines time spent in searching of the
plate cleaning of plates cutting required papers ink for production from the paint
room moving finished products to loading area can be conserved thereby increasing
productivity in the company
89
ltTIacuteTULO DA TESEgt ltNOME DO AUTORgt
CONCLUSIONS
51 CONCLUSIONS
52 PROPOSALS OF FUTURE WORKS
CONCLUSIONS 91
OPTIMIZING THE WORK ENVIRONMENT USING LEAN AND CONTINUOUS IMPROVEMENT TOOLS-PRINTING FLOOR MANIVANNAN SAMPATH
CONCLUSIONS AND PROPOSALS OF FUTURE WORKS
51 CONCLUSIONS
The study of lean tools and continuous improvement tools at the literature part of this
thesis proves to be significant support in terms of knowledge about understanding
waste and its different forms in the organization The terms regarded as waste as
discussed in section 2324 The problems faced by the company at each scenario
proven to contribute a considerable amount of time wastage in the setup process of the
production
The use of Ishikawa(fishbone diagram) a quality tool in addressing the root causes of the
issues was proven useful and helped in providing a guideway in solving those causes
see section 341342343 The benefits observed in using Ishikawa were Understood
and issues ewere analysed Identify the root cause of the issue Provide ways to improve
the process related to the issue In-depth in discussion of issue Helps in prioritizing the
analysis made and choosing corrective actions The corrective actions are analyzed by
categorizing them according to strengths- results that can be achieved using the
corrective actions weakness- possible scenario where it can go wrong opportunity to
introduce something new that can improve the operation and threats involving the
possible events where the actions reaches bottleneck and required inspections to be
followed periodically This helped in studying the system implemented in complete and
futher update in working of the system Section 351352353
The implementation section 36 explains the corrective actions performed periodically
for each problem reported by the organization of the company Each implementation
process is carried out following the steps involved in the tool adopted The creation of
tool room and tool chart involves the use of 5s along with Kanban shows the distribution
management of the tools at the production floor and management of tool room This
created awareness about the use of tools availability of the tools returning them to the
pegboard and cleanliness of the tool room after use The arrangement of ink tins in
shelves according to the Pantone number found to be helping the operators in obtaining
the required ink tins quickly Inspections gave improving results in following the
procedure for arranging the tins by the operator when they have the need to create
another Pantone color in a separate tin The creation of systems for the arrangement of
printing plates involves the use of PDCA during implementation which helped in
planning the system with available resources the capability of the system as well as the
design of the system according to two different plate sizes Results obtained after
CONCLUSIONS 92
OPTIMIZING THE WORK ENVIRONMENT USING LEAN AND CONTINUOUS IMPROVEMENT TOOLS-PRINTING FLOOR MANIVANNAN SAMPATH
implementation found to be satisfying that the time taken for retrieving the plates from
the systems has been reduced from an average of 17 minutes to 3 minutes Minimized
space in arranging the plates records of the plates existing the system updating the
system whenever changes with clients occur are the improvements made regarding the
printing plates Finally SMED is performed in figuring out the setup activities and time
involved in performing those activities where the results of the setup times regarding
the printing plates and ink from the paint room found to have contributed in the setup
time of jobs carried at production units but there are other activities like searching for
required printing sheets for production consumes an average of 5415 8241145
minutes and seconds were recorded for the machine namely SM 52-2 SM 52-4 SM 74-
5 respectively see section 4 Proposals for solving the issue about acquiring required
printing sheets mentioned in section 52
The use of lean tools and continuous improvement tools have proven to have made
changes in terms of space occupied the time taken in performing actions effective
management of tool room tool chart and insight in solving other actions in the setup
process
52 PROPOSALS OF FUTURE WORKS
The work will be done for reducing the time needed to receive the printing sheet at each
machine This can be achieved by taking inventory of the goods present on the printing
floor and then moving them in pallets to a separate place ThePrinted goods are then
moved to the storage room created giving free space for the supply of printing sheets
for the production processon the printing floor The created space will be segmented
for allowing the required printing sheets for the job and for storing the finished products
temporarily
93
ltTIacuteTULO DA TESEgt ltNOME DO AUTORgt
REFERENCES AND OTHER
SOURCES OF INFORMATION
REFERENCES AND OTHER SOURCES OF INFORMATION 95
OPTIMIZING THE WORK ENVIRONMENT USING LEAN AND CONTINUOUS IMPROVEMENT TOOLS-PRINTING FLOOR MANIVANNAN SAMPATH
REFERENCES AND OTHER SOURCES OF INFORMATION
[1] C C Yew and E Tan The Print Industry An Overview Information Services
Division National Library Board 2005
[2] [Online] Available ttpscollegegradcomindustriesprinting
[3] weebly [Online] Available httpsinvention-of-the-printing-
pressweeblycomeconomic-impacthtml
[4] J Dittmar Information Technology and Economic Change The Impact of the
Printing Press 2010
[5] E L Eisenstein The Printing Press as an Agent of Change Communications and
Cultural Transformations in Early-Modern Europe Cambridge University
Press 1979
[6] J-F Gilmont Printing at the dawn of the sixteenth centuary in The
Reformation and the Book Ashgate Aldershot 1998
[7] Engineering 360 by IEEE Global Spec [Online] Available
httpswwwglobalspeccomlearnmorematerial_handling_packaging_equi
pmentpackaging_labelingindustrial_printing_equipment [Accessed 25
september 2018]
[8] Flexography principles and practices Foundation of Flexographic Technical
Association
[9] T Dunn Manufacturing Flexible Packaging
[10] H Walter Process of letterpress printing
httpspatentsgooglecompatentUS2268594Aen Patent US2268594A
1939
REFERENCES AND OTHER SOURCES OF INFORMATION 96
OPTIMIZING THE WORK ENVIRONMENT USING LEAN AND CONTINUOUS IMPROVEMENT TOOLS-PRINTING FLOOR MANIVANNAN SAMPATH
[11] H Kipphan Hand book of Print Media technology and production methods
Springer-Verlag
[12] H Johnson and C D Tobie Digital printing startup guide Stacy L Hiquet 2005
[13] FACT SHEET SERIES-OFFSET PRINTING Print amp Copy Bureau Roger Stevens
Building University of Leeds
[14] offset pressman [Online] Available
httpoffsetpressmanblogspotcom201109short-history-of-offset-
printinghtml
[15] GRISO Print Solutions [Online] Available httpwwwgriso-
chemiecomenservicegeschichte-offsetdruck
[16] S H H Y Y A H H S K SUBRAMANIAM Machine efficiency and man
power utilization on production lines in 8th WSEAS Int Conf on
ELECTRONICS HARDWARE WIRELESS and OPTICAL COMMUNICATIONS
[17] N SAni kumar production and operations management New Age
International Publishers
[18] L B T Abdel-Malek A framework for the economic evaluation of production
system and product design alternatives for robot assembly International
Journal of Production Research vol 23 p 197ndash208 1985
[19] M S Y Y K K I a S N Yoshimura A rapid analysis method for production
line design International Journal of Production Research vol 44 no 6
2006
[20] D B M a B W Spath Springer Handbook of Automation Springer 2009
[21] R G S G B M K T Bley H Appropriate Human Involvement in Assembly and
Disassembly CIRP Annals ndash Manufacturing Technology 2009
[22] T L A V J Kruumlger Cooperation of human and machines in assembly lines
[23] T L A V J Kruuml ger Cooperation of human and machines in assembly lines
CIRP Annals - Manufacturing Technology 2009
REFERENCES AND OTHER SOURCES OF INFORMATION 97
OPTIMIZING THE WORK ENVIRONMENT USING LEAN AND CONTINUOUS IMPROVEMENT TOOLS-PRINTING FLOOR MANIVANNAN SAMPATH
[24] N Galway unit 13 automated production lines in Production lines NUI
Galway p 33
[25] J Liker The Toyota Way 14 Management Principles from the Worldrsquos Greatest
Manufacturer New York McGraw-Hill 2004
[26] G a W J Miltenburg The u-line line balancing problem Management
Science vol 40 no 10 1994
[27] J S L W L G M Gao An efficient approach for type II robotic assembly line
balancing problems Computer and Industrial Engineering 2009
[28] G R J S B Levitin A genetic algorithm for robotic assembly line balancing
European Journal of operational Research 2006
[29] T C L C G S S L M Adalberto Sato Michels The Robotic Assembly Line
Design (RALD) problem Model and case studies with practical extensions
Computers amp Industrial Engineering 2018
[30] P j Wallin Robotics in the Food Industry An update Trends in Food Science
amp Technology 1997
[31] J a H M Bicheno The Lean toolbox Buckingham PICSIE Books 2016
[32] A Weber Lean Workstations Organized for Productivity 2005
[33] A Maslow A theory of human motivation Psychological review 1943
[34] S a G R Ghosh A comprehensive literature review and analysis of the design
balancing and scheduling of assembly systems International Journal of
Production Research vol 27 no 4 1989
[35] L T D C D K N H B Tran Minh Canh A case study in Whittier woods
furniture in 13th International Conference Việt Nam 2013
[36] W L Kilbridge M A heuristic method of assembly line balancing Journal of
Industrial Engineering vol 24 no 2 p 292 1961
[37] G Srinivasan Operations and Supply Chain Management Department of
Management Studies Indian Institute of Technology Madras Chennai
REFERENCES AND OTHER SOURCES OF INFORMATION 98
OPTIMIZING THE WORK ENVIRONMENT USING LEAN AND CONTINUOUS IMPROVEMENT TOOLS-PRINTING FLOOR MANIVANNAN SAMPATH
[38] C M Harland Supply Chain Management Relationships Chains and
Networks British Academy of Management 1996
[39] G a M Q Easton Single and Multiple Network Sourcing - Network
Implications in 6th IMP Conference Milan 1990
[40] M G Christopher Logistics and Suppry Chain Management LondonUK
Pitman Publishing 1992
[41] L M Ellram lsquoSupply Chain Management The Industrial Organisation
Perspective International Journal of Physical Distribution and Logistics
Management vol 21 no 1 pp 13-22 1991
[42] T P b G M Daniel E Ufua a Systemic Lean Intervention Enhancing Lean
with Community Operational Research European Journal of Operational
Research 2017
[43] J amp J D T Womack Lean Thinking Banish Waste and Create Wealth for Your
Corporation New York Simon and Schuster 1996
[44] T C Salonitis K Drivers and Barriers of Lean Implementation in the Greek
Manufacturing Sector Procedia CIRP 7189ndash194 2016
[45] J A F Joliveira continuous improvement through lean tools An application
in a mechanical company Manufacturing Engineering Society International
Conference 2017 MESIC 2017 28-30 June 2017
[46] M V Ramunė Čiarnienėa An Empirical Study of Lean Concept Manifestation
11th International Strategic Management Conference 2015 2015
[47] K S Y X Mudhafar Alefari The role of leadership in implementing lean
manufacturing The 50th CIRP Conference on Manufacturing Systems 2017
[48] G Howell rdquoWhat is Lean Constructionrdquo Proceeding Seventh annual
Conference of the International Group for Lean Construction 1999
[49] C Ohaegbunam AN OPERATIONS MANAGEMENT PERSPECTIVE ON WASTE
MANAGEMENT IN A FOOD PROCESSING FACTORY Tampere University of
Applied Sciences 2015
REFERENCES AND OTHER SOURCES OF INFORMATION 99
OPTIMIZING THE WORK ENVIRONMENT USING LEAN AND CONTINUOUS IMPROVEMENT TOOLS-PRINTING FLOOR MANIVANNAN SAMPATH
[50] P R T Domingo Identifying and Eliminating The Seven Wastes or Muda
Asian Institute of Management
[51] M Pieńkowski WASTE MEASUREMENT TECHNIQUES FOR LEAN COMPANIES
International journal of lean Thinking vol 5 2014
[52] T Ohno Toyota Production System Beyond Large-Scale Production diamond
Inc 1978
[53] D S M Dudek-Burlikowska The Poka-Yoke method as an improving quality
tool of operations in the process journal of Achivements in Materials and
Manufacturing Enginnering vol 36 no 1 2009
[54] K V Scyoc Process safety improvementmdashQuality and target zero Journal of
Hazardous Materials 159 (2008) 42ndash48 2008
[55] A D Shigeo Shingo ldquoZero Quality Control Source Inspection and the Poka-Yoke
Systemrdquo Productivity Press 1986
[56] D Tommelein lsquoPOKA YOKErsquo OR QUALITY BY MISTAKE PROOFING DESIGN AND
CONSTRUCTION SYSTEMS Proceedings for the 16th Annual Conference of
the International Group for Lean Construction
[57] S Shingo A study of the toyota production system japan management
association
[58] D N S Yash Dave a IMPLEMENTATION OF POKA-YOKE TECHNIQUE IN A GEAR
INDUSTRY -A CASE STUDY International Journal of Latest Research in Science
and Technology 2015
[59] M D-B H 1048800achajczyk Quality continuous improvement of company with
usage the Poka-Yoke methods PSKN 72006
[60] S S Zero Quality Control Source Inspection and the Pokandash Yoke System
Cambridge Productivity Press 1986
[61] M G Marta Kučerovaacute Eliminating waste in the production process using tools
and methods of industrial engineering 28 11 2015
REFERENCES AND OTHER SOURCES OF INFORMATION 100
OPTIMIZING THE WORK ENVIRONMENT USING LEAN AND CONTINUOUS IMPROVEMENT TOOLS-PRINTING FLOOR MANIVANNAN SAMPATH
[62] A G P Arunagiria Identification of Major Lean Production Waste in
Automobile Industries using Weighted Average Method 12th GLOBAL
CONGRESS ON MANUFACTURING AND MANAGEMENT GCMM 2014 2014
[63] G A Arunagiri P Investigation on Critical Factors Assessment of the Lean
Production Systems in Industrial Environment Elsevier Science and
Technology 2013
[64] I G-R A S-L E Andreacutes-Loacutepeza Lean Service Reassessment of Lean
Manufacturing for Service Activities The Manufacturing Engineering Society
International Conference MESIC 2015 2015
[65] S SHINGO A Revolution in ManufacturingThe SMED System Productivity
Press 1985
[66] D L M Silvia Pellegrini Study and Implementation of Single Minute Exchange
of Die (SMED) Methodology in a Setup Reduction Kaizen Proceedings of the
2012 International Conference on Industrial 2012
[67] A R RSundara A Review on Lean Manufacturing Implementation
Techniques 12th GLOBAL CONGRESS ON MANUFACTURING AND
MANAGEMENT GCMM 2014 2014
[68] F L F R CRosa SMED Methodology The reduction of setup times for steel
wire-rope assembly lines in the automotive industry Manufacturing
Engineering Society International Conference 2017 MESIC 2017 28-30 June
2017 Vigo (Pontevedra) Spain 2017
[69] P M T G Antoacutenio Carrizo Moreira Implementation of the Single Minute
Exchange of Die (SMED) Methodology in Small to Medium-sized Enterprises
A Portuguese Case Study International Journal of Management vol 30 no
1 2013
[70] T Ohno Toyota Production System Beyond Large-Scale Production New York
Productivity Press 1988
[71] M Imai Gemba Kaizen A Practical Approach to a Continuous Improvement
Strategy Kaizen Publishing House vol 2 2013
REFERENCES AND OTHER SOURCES OF INFORMATION 101
OPTIMIZING THE WORK ENVIRONMENT USING LEAN AND CONTINUOUS IMPROVEMENT TOOLS-PRINTING FLOOR MANIVANNAN SAMPATH
[72] R W Beata GALA PROBLEMS OF IMPLEMENTATION 5S PRACTICES IN AN
INDUSTRIAL COMPANY Management Systems in Production Engineering
vol 12 no 4 pp 8-14 2013
[73] wwwleanproductseu [Online]
[74] H Hirano The Complete Guide to Just-In-Time Manufacturing Waste and the
5S s Productivity press 2009
[75] D W Edwards The new economics for industry government and education
Cambridge Mass MIT Press 1993
[76] KACHANDRAKANTH PLAN DO CHECK ACT (PDCA) IMPROVING QUALITY
THROUGH AGILE ACCOUNTABILITY TEKTRONIX ENGINEERING
DEVELOPMENT INDIA PRIVATE LIMITED BANGALORE
[77] V A D Pratik M Patel Application Of Plan-Do-Check-Act Cycle For Quality And
Productivity Improvement - A Review International Journal for Research in
Applied Science amp Engineering Technology (IJRASET) vol 5 no 1 2017
[78] H Kanri The Strategic Approach to Continuous Improvement Gower
Publishing Limited 2008
[79] G a J W Moran The ABCs of PDCA 2009
[80] D SLOVIĆ D STOJANOVIĆ2 and I TOMAŠEVIĆ Productivity Upswing Through
Two-Phase Continuous Process Improvement Model The Case Of Apparel
Manufacturer Journal of Textile amp Apparel Tekstil ve Konfeksiyon vol 25
no 2 2015
[81] P S T Mr Madan M Jagtap International Journal on Recent Technologies in
Mechanical and Electrical Engineering (IJRMEE) ISSN 2349-7947 vol 2 no
4
[82] E Coimbra The Total Flow Management Model Kaizen forum 2008
[83] E Coimbra TheTotal Flow Management Model KAIZEN FORUM vol 3 pp 1-
4 2008
[84] E A Coimbra Total Flow Management Achieving Excellence with Kaizen and
Lean Supply Chains KAIZEN INSTITUTE (2012)
REFERENCES AND OTHER SOURCES OF INFORMATION 102
OPTIMIZING THE WORK ENVIRONMENT USING LEAN AND CONTINUOUS IMPROVEMENT TOOLS-PRINTING FLOOR MANIVANNAN SAMPATH
[85] S Nakajima Introduction to TPM total productive maintenance Cambridge
MA Productivity Press 1988
[86] P Muchiri and L Pintelon Performance measurement using overall
equipment effectiveness (OEE) Literature review and practical application
discussion International journal of Production Research vol 46 no 13
2008
[87] b J S a J R M-T c C J Andres Mu~noz-Villamizar a Using OEE to evaluate
the effectiveness of urban freight transportation systems A case study
International Journal of Production Economics 2018
[88] B J The new lean toolbox towards fast flexible flow PICSIEBooks Moreton
Press 2004
103
ltTIacuteTULO DA TESEgt ltNOME DO AUTORgt
ANNEXES
71 ANNEX1
ANNEXES 105
OPTIMIZING THE WORK ENVIRONMENT USING LEAN AND CONTINUOUS IMPROVEMENT TOOLS-PRINTING FLOOR MANIVANNAN SAMPATH
ANNEXES
This section consist of the supported documents involved in implementation of the tools
as well as corrective actions carried out in solving the prblems reported by the
organization
71 ANNEX1
ANNEXES 106
OPTIMIZING THE WORK ENVIRONMENT USING LEAN AND CONTINUOUS IMPROVEMENT TOOLS-PRINTING FLOOR MANIVANNAN SAMPATH
ANNEXES 107
OPTIMIZING THE WORK ENVIRONMENT USING LEAN AND CONTINUOUS IMPROVEMENT TOOLS-PRINTING FLOOR MANIVANNAN SAMPATH
ANNEXES 108
OPTIMIZING THE WORK ENVIRONMENT USING LEAN AND CONTINUOUS IMPROVEMENT TOOLS-PRINTING FLOOR MANIVANNAN SAMPATH
OPTIMIZING THE WORK ENVIRONMENT USING LEAN AND
CONTINUOUS IMPROVEMENT TOOLS-PRINTING FLOOR
Manivannan Sampath
2018
ISEP ndash School of Engineering Polytechnic of Porto
Department of Mechanical Engineering
OPTIMIZING THE WORK ENVIRONMENT USING LEAN AND
CONTINUOUS IMPROVEMENT TOOLS-PRINTING FLOOR
Manivannan Sampath
1160455
Dissertation presented to ISEP ndash School of Engineering to fulfill the requirements
necessary to obtain a masterrsquos degree in mechanical engineering carried out under the
guidance of Professor Raul Duarte Salgueiral Gomes Campilho and Professor Francisco
Jose Gomes da Silva
2018
ISEP ndash School of Engineering Polytechnic of Porto
Department of Mechanical Engineering
OPTIMIZING THE WORK ENVIRONMENT USING LEAN AND CONTINUOUS IMPROVEMENT TOOLS-PRINTING FLOOR MANIVANNAN SAMPATH
JURY
President
Sandra Cristina de Faria Ramos
Adjunct Professor ISEP
Supervisor
Raul Duarte Salgueiral Gomes Campilho
Adjunct professor ISEP
Second supervisor
Francisco Jose Gomes da Silva
Adjunct professor ISEP
Examiner
Ana Margarida Araujo Barros Fonseca
Associated Professor UFP
OPTIMIZING THE WORK ENVIRONMENT USING LEAN AND CONTINUOUS IMPROVEMENT TOOLS-PRINTING FLOOR MANIVANNAN SAMPATH
ACKNOWLEDGEMENTS
I would like to express my sincere gratitude to everyone who has contributed to the
completion of this work
Thanks to professor Raul Duarte Salgueiral Gomes Campilho for guiding in the
completion of the work company Marsil Graphic Arts Ltd Antoacutenio Andreacute da Costa
Moreira for giving me the opportunity as internship and finding help in the
implementation of works workers of Marsil
Finally I thank my friends and my family for the support and advice provided during the
completion of this Master thesis
ABSTRACT IX
OPTIMIZING THE WORK ENVIRONMENT USING LEAN AND CONTINUOUS IMPROVEMENT TOOLS-PRINTING FLOOR MANIVANNAN SAMPATH
KEYWORDS
5s PDCA SMED waste Muda lean and continuous improvement tools
ABSTRACT
The study aims at solving the problems reported by the management using lean tools
and continuous improvement tools The purpose of using a lean tool is to configure the
working process involved in production thereby reducing waste periodically The tool
also aims at improving the flow of process resulting in reducing the uneven workflow
throughout the floor The pull system from Kanban also found to improvise flow of
materials at the production floor The continuous improvement tool helps in
streamlining works related to implementing works and reducing waste In this work the
implementation of 5s has found its use in creating a tool room and tool chart along with
a pull system introduced for the tools at the pegboard The use of Kanban cards as pull
system at tool chart for the tool is to monitor the flow of tool to the production units at
the printing floor The implementation of 5s in paint room is to organize the ink tins used
for setup activity in the production process and to make the ink tins easier to find for
the operator PDCA (plan do check act) cycle one of the continuous improvement tools
implemented for organizing the printing plates into a system by creating and thereby
reducing the retrieval time of the plates by the operators SMED (single minute exchange
of die) performed on production units to find the activities involved in the setup
operations and reducing the time needed to perform the setup operations The results
of the implementations made found to be satisfying that the tool room kept periodically
and the use of Kanban cards on the tool chart for some tool being used through
inspections performed The systems implemented for organizing the printing plates
helped in retrieving the plates from the system for a setup operation seem to have
reduced from 17 minutes to 3 minutes The implementation of 5s at the paint room in
organizing the ink tins proven useful as the time needed for operators in obtaining the
ink tins and introducing it into the system a setup operation performed for production
purpose observed during SMED process
RESUMO XI
OPTIMIZING THE WORK ENVIRONMENT USING LEAN AND CONTINUOUS IMPROVEMENT TOOLS-PRINTING FLOOR MANIVANNAN SAMPATH
PALAVRAS CHAVE
5s PDCA SMED resiacuteduos Muda ferramentas de melhoria contiacutenua e enxuta
RESUMO
O objetivo do estudo eacute resolver os problemas relatados pelo gerenciamento utilizando
ferramentas enxutas e ferramentas de melhoria contiacutenua O propoacutesito de usar uma
ferramenta enxuta eacute configurar o processo de trabalho envolvido na produccedilatildeo
reduzindo assim o desperdiacutecio periodicamente A ferramenta tambeacutem visa melhorar o
fluxo do processo resultando na reduccedilatildeo do fluxo de trabalho irregular em todo o piso
O sistema de traccedilatildeo do Kanban tambeacutem descobriu improvisar o fluxo de materiais no
chatildeo de faacutebrica A ferramenta de melhoria contiacutenua ajuda na racionalizaccedilatildeo de trabalhos
relacionados agrave implementaccedilatildeo de obras e reduccedilatildeo de desperdiacutecio Neste trabalho a
implementaccedilatildeo do 5s encontrou seu uso na criaccedilatildeo de uma sala de ferramentas e um
graacutefico de ferramentas juntamente com um sistema de traccedilatildeo introduzido para as
ferramentas no pegboard O uso de cartotildees Kanban como sistema pull no quadro de
ferramentas da ferramenta eacute monitorar o fluxo da ferramenta para as unidades de
produccedilatildeo no chatildeo de impressatildeo A implementaccedilatildeo do 5s na sala de pintura eacute organizar
as latas de tingimento usadas para a atividade de configuraccedilatildeo no processo de produccedilatildeo
e tornar as latas de tingimento mais faacuteceis de encontrar para o operador O PDCA (plan
do check act) aciona uma das ferramentas de melhoria contiacutenua implementadas para
organizar as chapas de impressatildeo em um sistema criando e reduzindo o tempo de
recuperaccedilatildeo das chapas pelos operadores SMED (single minute exchange of die)
realizado nas unidades de produccedilatildeo para localizar as atividades envolvidas nas
operaccedilotildees de configuraccedilatildeo e reduzir o tempo necessaacuterio para executar as operaccedilotildees de
configuraccedilatildeo Os resultados das implementaccedilotildees realizadas demonstraram ser
satisfatoacuterios que a sala de ferramentas eacute mantida periodicamente e o uso de cartotildees
Kanban na tabela de ferramentas para alguma ferramenta sendo usada atraveacutes de
inspeccedilotildees realizadas Os sistemas implementados para organizar as chapas de
impressatildeo ajudaram a recuperar as chapas do sistema para que uma operaccedilatildeo de
configuraccedilatildeo parecesse ter reduzido de 17 minutos para 3 minutos A implementaccedilatildeo
de 5s na sala de pintura organizou as tintas de tingimento comprovadamente uacuteteis
como o tempo necessaacuterio para os operadores obterem as tintas de corante e introduzi-
las no sistema uma operaccedilatildeo de configuraccedilatildeo realizada para fins de produccedilatildeo
observada durante o processo SMED
LIST OF SYMBOLS AND ABBREVIATIONS XIII
OPTIMIZING THE WORK ENVIRONMENT USING LEAN AND CONTINUOUS IMPROVEMENT TOOLS-PRINTING FLOOR MANIVANNAN SAMPATH
LIST OF SYMBOLS AND ABBREVIATIONS
List of abbreviations
GSM Grams per Square Meter
NVAA Non-Value Added Activities
OEE Overall Equipment Effectiveness
PDCA Plan Do Check Act
SME Small Machine Enterprise
SMED Single Minute Exchange of DIE
SPH Sheets per Hour
TFM Total Flow Management
List of units
cm Centimeter
m Meter
mm Millimeter
OZ Ounces
List of symbols
euro Euro
FIGURES INDEX XV
OPTIMIZING THE WORK ENVIRONMENT USING LEAN AND CONTINUOUS IMPROVEMENT TOOLS-PRINTING FLOOR MANIVANNAN SAMPATH
FIGURES INDEX
Figure 1 Cities with printing in 1450 [4] 8
Figure 2 Cities with printing press from the 1500s to 1800s [4] 9
Figure 3 Flexography printing station [8] 11
Figure 4 Flexography printing application [8] 12
Figure 5 Letter printing station [10] 13
Figure 6 Screen printing station [11] 14
Figure 7 Gravure printing station [8] 15
Figure 8 Processing of data into printed image [12] 16
Figure 9 shows the image created using printing [12] 17
Figure 10 offset printing station [13] 18
Figure 11 Usage of offset printing for product lables [11] 19
Figure 12 Schematic Production System [17] 21
Figure 13 Manual assembly line [18] 21
Figure 14 combination of manual and automatic workstations [21] 22
Figure 15 A and B workplace sharing hybrid systems [22] 23
Figure 16 Inline Configuration of an automated production line [24] 24
Figure 17 L shaped layout [24] 24
Figure 18 U shaped production layout [24] 25
Figure 19 Rotary layout [24] 26
Figure 20 Welding process performed by platform robots [29] 27
Figure 21 Roles of robots [29] 27
Figure 22 Platform robots performing welding tasks [29] 27
Figure 23 Transporter robot on a track-motion device [29] 28
Figure 24 Hierarchy of workstation needs [33] 29
Figure 25 Represents the flow across enterprises [38] 32
Figure 26 Lean manufacturing tools and practices [44] 34
Figure 27 Function of Poke-Yoke [58] 36
FIGURES INDEX XVI
OPTIMIZING THE WORK ENVIRONMENT USING LEAN AND CONTINUOUS IMPROVEMENT TOOLS-PRINTING FLOOR MANIVANNAN SAMPATH
Figure 28 Types of waste [61] 37
Figure 29 The phases of SMED method [69] 40
Figure 30 5S method [73] 41
Figure 31 PDCA Cycle [77] 42
Figure 32 TFM model [83] 44
Figure 33 Total Flow Management Pillars [83] 44
Figure 34 OEE Timeline [87] 46
Figure 35 Offset printing SM74-5 unit at Marsil 51
Figure 36 Plate cleaning solution 52
Figure 37 Control systems of SM 74-5 52
Figure 38 Measuring devices 53
Figure 39 Products produced by SM74-5 53
Figure 40 Manual fork lifter 54
Figure 41 SM 52-2 54
Figure 42 SM 52-4 55
Figure 43 A and B control systems for Speedmaster 52-4 56
Figure 44 Goods produced at SM 52-4 56
Figure 45 Web-fed Printing unit 57
Figure 46 Products produced at the webfed unit 57
Figure 47 Heidelberg SORM-Z 58
Figure 48 Heidelberg GTO-52 58
Figure 49 Heidelberg Minerva 59
Figure 50 Cutting machine polar 92 60
Figure 51 Heidelberg STAHL Ti-52 60
Figure 52 Double 600i 61
Figure 53 Pegboard with the missing tools 61
Figure 54 Printing plates arranged on the floor according to their clients 62
Figure 55 Cause and Effect diagram on missing tools and unmanaged paint room 63
Figure 56 Cause and effect diagram on unorganized ink tins 64
Figure 57 Cause and effect diagram on printing plate setup made by management 65
FIGURES INDEX XVII
OPTIMIZING THE WORK ENVIRONMENT USING LEAN AND CONTINUOUS IMPROVEMENT TOOLS-PRINTING FLOOR MANIVANNAN SAMPATH
Figure 58 Flow chart 68
Figure 59 SWOT analysis on objective A 69
Figure 60 SWOT on objective B 70
Figure 61 SWOT on objective C 71
Figure 62 Collected tools 72
Figure 63 Kanban cards 72
Figure 64 Simple floor layout is highlighting the production units in colors 73
Figure 65 inventory list of tools 74
Figure 66 Toolroom before implementation 75
Figure 67 Toolroom after implementation 75
Figure 68 Labels as indicators 76
Figure 69 Lable for ink tins 76
Figure 70 Ink tins arranged on shelves after implementation 77
Figure 71 Separation of plates in pallets 79
Figure 72 Information regarding captais socials 79
Figure 73 Information about the plate 80
Figure 74 Image taken during the creation of the prototype 80
Figure 75 Inventory list of the plates 81
Figure 76 image of plates organizeed with labels 82
Figure 77 Before implementation 84
Figure 78 After implementation 84
Figure 79 shows the space occupied by printed goods right near the printing machines 87
Figure 80 Shelves for storing purposes 88
TABLES INDEX XIX
OPTIMIZING THE WORK ENVIRONMENT USING LEAN AND CONTINUOUS IMPROVEMENT TOOLS-PRINTING FLOOR MANIVANNAN SAMPATH
TABLES INDEX
Table 1 printing equipment features [7] 10
Table 2 cutting machine specification 59
Table 3 Time taken before implementation 78
Table 4Time observation after implementation 83
Table 5 Average time of actions performed on three machines 86
Table 6 Performed actions categorized into internal and external 86
INDEX XXI
OPTIMIZING THE WORK ENVIRONMENT USING LEAN AND CONTINUOUS IMPROVEMENT TOOLS-PRINTING FLOOR MANIVANNAN SAMPATH
INDEX
INTRODUCTION 1
11 Framework 1
12 Objectives 1
13 Methodology 1
14 Thesis structure 2
15 Host company 2
THEORETICAL BACKGROUND 7
21 The printing sector 7
211 Importance in the national and international economy 7
212 Types of printings 9
213 Printing equipment 10
214 Printing process description 11
2141 Flexography 11
2142 Letter press printing 12
2143 Screen printing 14
2144 Rotogravure 14
2145 Digital printing 15
2146 Offset lithography 17
215 Evolution of offset printing press 19
22 Production lines 20
221 Concept of production line 20
222 Types of production lines 21
2221 Manual production lines 21
2222 Semi automatic production lines 22
INDEX XXII
OPTIMIZING THE WORK ENVIRONMENT USING LEAN AND CONTINUOUS IMPROVEMENT TOOLS-PRINTING FLOOR MANIVANNAN SAMPATH
2223 Automated production lines 23
223 Management of production lines 28
2231 Workstations 28
2232 Line balancing 30
2233 Supply 31
23 Lean concepts and tools 33
231 Concept of waste 34
232 POKE-YOKE 35
233 MUDA 37
234 SMED 39
235 5S 40
24 Continuum improvement tools 42
241 PDCA 42
242 TFM 43
243 OEE 45
THESIS DEVELOPMENT 51
31 Production lines characterization 51
311 Production line A 51
312 Production line B 54
313 Production line C 58
314 Production line D 59
32 Problem characterization 61
33 Objective 62
34 Brainstorming 63
341 Objective A 63
342 Objective B 64
343 Objective C 65
INDEX XXIII
OPTIMIZING THE WORK ENVIRONMENT USING LEAN AND CONTINUOUS IMPROVEMENT TOOLS-PRINTING FLOOR MANIVANNAN SAMPATH
35 SWOT analysis of possible solutions 69
351 Objective A SWOT analysis 69
352 Objective B SWOT analysis 69
353 Objective C SWOT analysis 70
36 Implementation 71
361 Implementation of 5S 71
362 Implementation of 5S in paint room 75
363 Implementation of PDCA 77
SMED PRACTICE 85
CONCLUSIONS AND PROPOSALS OF FUTURE WORKS 91
51 CONCLUSIONS 91
52 PROPOSALS OF FUTURE WORKS 92
REFERENCES AND OTHER SOURCES OF INFORMATION 95
ANNEXES 105
71 ANNEX1 105
25
INTRODUCTION
11 Framework
12 Objectives
13 Methodology
14 Thesis structure
15 Host company
INTRODUCTION 1
OPTIMIZING THE WORK ENVIRONMENT USING LEAN AND CONTINUOUS IMPROVEMENT TOOLS-PRINTING FLOOR MANIVANNAN SAMPATH
INTRODUCTION
11 Framework
The graphic arts industry where the work is performed has production lines performing
jobs of everyday demands of the clients This includes process from creating the
products according to clientrsquos preference followed by cutting binding lamination until
the final product is met The working conditions are affected by busy long-term
production during various scenarios where the implementation of the lean tools and
continuous improvement tools are necessary to improve the working conditions
availability of resources and thereby increasing the productivity gradually
12 Objectives
The objective of this thesis is to improve the conditions at Marsil with the help of lean
tools and continuous improvement tools by
bull Creating a tool room for the machinery works to take place and to create a tool
chart for organizing tools
bull Creating a system for organizing the ink tins in the paint room
bull Implementing a system for the printing plates to be organized and quick retrieval
of the plates from the system for the printing jobs
13 Methodology
bull Study about the problem reported
bull Collection of data about the problem and proposing ideas in solving them
bull Study about the production floor and the included production units and their
works
bull Brainstorming on the problems in figuring out the possible causes and to get a
broader perspective in structuring the solutions
bull Selection of idea based on collected data available area resources
bull Implementation of an idea based on the adopted tool
bull Collection of data after implementation
bull Analyzing the data obtained
INTRODUCTION 2
OPTIMIZING THE WORK ENVIRONMENT USING LEAN AND CONTINUOUS IMPROVEMENT TOOLS-PRINTING FLOOR MANIVANNAN SAMPATH
14 Thesis structure
The thesis is structured by having it into two sections
bull The theoretical background is having the study of the printing sector the
importance of printing in the economy types of printing printing equipment
printing process with the description of each and their applications the
evolution of offset printing
Production lines include the concept of the production line types of production
lines and management of production lines
Lean tools and concept include waste concept poke-yoke method Muda single
minute exchange of ink 5s and continuous improvement tools has brief
explanation on PDCA (Plan do check act) TFM (Total flow management) OEE
(Overall Equipment Effectiveness) from various research papers journals books
and websites
bull The development section will have characteristics of the production lines
addressing the problems at the printing floor reported by the company goals
performing brainstorming actions on the problems by figuring out the elements
involved in the cause and suggesting out the actions SWOT (strengths
weakness opportunity and threats) involved in these actions Later the actions
implemented according to lean tools and continuous improvement tools
necessary
15 Host company
The company Marsil was founded in the year 1953 as a printing business licensed for the
manual cutter and a printing machine in the downtown of Porto Rua Conde de Vizela
No 76 In the early 80s after the formation of the company became the first customer
segmentation exercise and went on to emphasize to the institutional client initially
Banco Borges amp Brother followed by Banco Espiacuterito Santo The company now also has
a delegation in Lisbon initially at Av Infante Santo and later in Tower 2 of the Amoreiras
which still remains to provide the necessary personalized support to the customer
The company was awarded the prize of IAPMEI SME Excellence in 2000 and 2001 which
happened again in 2008 and 2009 with the awards SME Leader and SME Excellence
respectively
In 2006 Marsil started a new business area passing by incorporating value-added
services to the graphics product - the Bursar and Logistics Management with stock
management graphics delivering the quantity needed time limit and at the locations by
customers
INTRODUCTION 3
OPTIMIZING THE WORK ENVIRONMENT USING LEAN AND CONTINUOUS IMPROVEMENT TOOLS-PRINTING FLOOR MANIVANNAN SAMPATH
In 2008 it was inaugurated Mosteiroacute facilities with a park web presses and finishing lines
constituting the second productive hub and from 2010 onwards there is an ongoing
new customer segmentation exercise and exploration of new markets which has
allowed the Marsil increase the portfolio and even be honored with some awards and
prestigious honors in the field of Graphic Arts
Marsil currently has 1420 clients currently active and half of them made orders during
the year 2016 Noteworthy are clients like the Caixa Geral de Depoacutesitos Novo Banco
Millenium BCP SantaderTotta Banco BPI Euro big Pestana Group Hotels Hotels Minor
Tivoli Nau Hotels Group Eurostars Group Hospital da Luz among other clients in these
and other sectors such as footwear textiles etc The Marsil has forty-two employees
employed at present
5
ltTIacuteTULO DA TESEgt ltNOME DO AUTORgt
BIBLIOGRAPHIC WORK
21 The printing sector
22 Production lines
23 Lean concepts and tools
24 Continuum improvement tools
THEORETICAL BACKGROUND 7
OPTIMIZING THE WORK ENVIRONMENT USING LEAN AND CONTINUOUS IMPROVEMENT TOOLS-PRINTING FLOOR MANIVANNAN SAMPATH
THEORETICAL BACKGROUND
21 The printing sector
The printing industry covers the entire print process from creation through distribution
to other non-print services that it offers So any definition of the industry includes not
only the numerous firms that perform the actual printing but the companies that
provide binding and finishing services such as cutting trimming die to cut laminating
mounting and varnishing documents for their clients [1]
A wide range of products is produced in the printing industry In addition to magazines
books and some small newspapers other examples of printed products include direct
mail labels manuals and marketing material Less obvious printed goods include memo
pads business order forms checks maps T-shirts and packaging The industry also
includes establishments that give quick printing of documents for the consumer or
support services such as prepress embossing binding finishing and mailing [2]
211 Importance in the national and international economy
The printing press had enormous effects on the economy The printing press was an
invention that led to the flourishment of trade throughout all of Europe due to increased
demands This was a cause for a stronger economy Also a more natural way to print
books led to more affordable books this meant that now not only could the elite and
wealthy afford books but so could the poor More durable and well-made books grew
the market for books and strengthened the economy Newspaper on the other hand
were more everyday items created by the printing press which caused a massive burst
in demand for newspapers Frequent changing of prices downward made more
affordable books Books carried information for people to learn and create more jobs
Stores could now sell and buy books more rapidly The demand for books and
newspapers also led to more inventions for printing to grow the economy Lastly
printing became a massive industry and led to different companies to move into large
noisy factories meaning many for jobs to hire more books to make and more books to
sell [3]
Historians and studies suggest the printing press was one of the most revolutionary
inventions in human history as well the printing press eased these intellectual
developments the process of sharing and recombining ideas that economists have tied
to technological progress and the development of economic activities in which literacy
THEORETICAL BACKGROUND 8
OPTIMIZING THE WORK ENVIRONMENT USING LEAN AND CONTINUOUS IMPROVEMENT TOOLS-PRINTING FLOOR MANIVANNAN SAMPATH
numeracy and other intellectual skills were valuable Indeed there is an argument to
be made that (via its pervasive and fundamental impact on a wide range of economic
activities) printing technology may qualify as a general-purpose technology [4]
Printing cities enjoy helps due to agglomeration economies The printing press produced
new face-to-face interactions in addition to books and pamphlets Printers workshops
brought scholars merchants craftsmen and mechanics together for the first time in a
commercial environment eroding a pre-existing ldquotown and gown divide Bookshops
and the houses of printers became meeting places and temporary residences for
intellectuals Print technology also produced printing-scholars Adapt to handling
machines and marketing products finding learned societies promoting artists and
authors advancing new forms of data collection [5]
Cities with printing presses derived benefits from the technology that others did not
The costs of information and human capital accumulation were significantly lower in
cities with printing presses In part these advantages were due to transport costs Print
media is costly to transport because it is vast and a fragile commodity sensitive to damp
[6]
[4]Jeremiah Dittmar in comparing cities where printers set up presses to similar cities
where they did not conclude that ldquoprint technologies had very substantial effects in
European economic history through their impact on cities ldquoSome have concluded that
the economic impact of the printing press was limited
Figure 1 Cities with printing in 1450 [4]
THEORETICAL BACKGROUND 9
OPTIMIZING THE WORK ENVIRONMENT USING LEAN AND CONTINUOUS IMPROVEMENT TOOLS-PRINTING FLOOR MANIVANNAN SAMPATH
Figure 2 Cities with printing press from the 1500s to 1800s [4]
Figure 1 and Figure 2 represents the cities with printing presses at the 1450s and
between 1500s-1800s
On exploiting the city level data on the diffusion and adoption of the printing press to
examine the technologys impact from a new perspective shows that cities that adopted
the printing press in the late 1400s enjoyed no growth advantages prior to adoption but
grew at least 20 percentage points and as much as 80 percentage points more than
similar cities that did not change over the period 1500-1600 These estimates imply that
the impact of printing accounted for at least 18 and as much as 80 percent of European
city growth between 1500 and 1600 [4]
Cities that were early adopters of the printing press kept a significant growth advantage
even over the three hundred years running 1500-1800 Even 1500-1800 print accounted
for somewhere between 5 and 45 percent of city growth Between 1500 and 1800
European cities were seedbeds of the ideas activities and social groups that launched
modern capitalist economic growth [4]
212 Types of printings
1 Flexography
2 Letterpress printing
3 Screen printing
4 Rotogravure
5 Digital printing
6 Lithography
THEORETICAL BACKGROUND 10
OPTIMIZING THE WORK ENVIRONMENT USING LEAN AND CONTINUOUS IMPROVEMENT TOOLS-PRINTING FLOOR MANIVANNAN SAMPATH
213 Printing equipment
Industrial printing equipment and supplies include screen printing equipment digital
printing equipment label printing equipment offset printing equipment letterpress
printing equipment and flexographic printing equipment
Table 1 Describes various printing equipments and their associated equipments
Table 1 printing equipment features [7]
Serial
Number
Equipment used
for printing Definition Features
1
Flexographic
printing
equipment
Flexographic printing equipment uses rubber
cylinders that are easy to keep and repair
bull Viscosity control
systems
bull Ink pumps
bull Chamber doctor
blades
bull Video systems
bull Stroboscopes
bull Slitting and rewinding
machines
2
Letterpress
printing
equipment
Letterpress printing inks type that is pressed
onto the printing surface
bull Die cutters
bull Scorers
bull Engravers
bull Embossers
bull Foil stampers
bull Binders
3 Screen printing
equipment
Screen printing equipment uses rubber
cylinders that are easy to keep and repair
bull Racks
bull Stretchers
bull Transfer presses
bull Dip tanks
bull Dryers
4 Digital printing
equipment
Digital printing equipment produces printed
materials directly from a computer file and
does not use intermediate materials such as
film or plates
bull Variable imaging digital
presses (computer to
paper)
bull Digital desktop
printers
bull Digital copiers
bull Direct imaging presses
(computer to plate on
press)
THEORETICAL BACKGROUND 11
OPTIMIZING THE WORK ENVIRONMENT USING LEAN AND CONTINUOUS IMPROVEMENT TOOLS-PRINTING FLOOR MANIVANNAN SAMPATH
5 Offset printing
equipment
Offset printing equipment produces printed
images from plate to paper with the help of
inks and cylinders
bull Printers
bull Scanners
bull Folding machines
bull Joggers
bull Binding equipment
214 Printing process description
This section briefly explains the process involved in various printing techniques and their
uses in production activities
2141 Flexography
Process
Flexographic printing involves a ldquoplate cylinderrdquo covered in whole or in part with raised
flexible print media that carry ink for an image The media then deposit that ink onto
the substrate Initially the media made of rubber sheets pressed into rigid molds and
vulcanized shows the image of flexography printing unit and its working components
Figure 3 shows the working image of flexography printing unit with its components
Figure 3 Flexography printing station [8]
A metal (eg magnesium) plate exposed with the negative of the image to be printed
and developed in an acid bath creates the first mold This metal relief plate makes the
mold for commercial use (usually in Bakelite plastic) A rubber or plastic sheet material
is vulcanized (by pressing it into the metal mold under controlled temperature and
pressure) to create the printing plate Alternatively a photopolymer material exposed
to the negative of the image to be printed creates the print media directly Light not
THEORETICAL BACKGROUND 12
OPTIMIZING THE WORK ENVIRONMENT USING LEAN AND CONTINUOUS IMPROVEMENT TOOLS-PRINTING FLOOR MANIVANNAN SAMPATH
excluded by the negative image cross-links the polymer In the following step a liquid
bath removes the polymer not cross-linked during the exposure process Raised surfaces
of (crossed-linked) photopolymer material give the raised surfaces to carry ink Recently
direct laser light exposure of photopolymer material has been able to cut the need for
the intermediate contrary giving high reproducibility and quality [9]
The process was developed primarily for printing on packaging substrates board paper
foil and film Materials are supplied in roll form for feeding into form-fill over-wrapping
bag making and other continuous web processing machinery [8]
Flexography printing is an efficient cost-effective and versatile printing method by the
end of the 1990rsquos approximately one-quarter of all printing is flexographic in the
packing segment of the printing industry Flexography enjoys a market share of over
65 growth throughout the 1990rsquos has been steady [8]
Applications
Some typical applications for flexography are paper and plastic bags milk cartons
disposable cups and candy bar wrappers Flexography printing may also be used for
envelopes labels and newspapers [8] Figure 4 shows some of the applications where
flexographic printing is used The labels of the above-shown products are made through
flexographic printing
Figure 4 Flexography printing application [8]
2142 Letter press printing
Process
Letter-press printing consists printing of suitably aqueous ink onto a sheet or web from
surfaces in relief The printing form is usually a stereotype or electrotype plate or a type
form with or without etchings bearing designs etched in relief While various kinds of
THEORETICAL BACKGROUND 13
OPTIMIZING THE WORK ENVIRONMENT USING LEAN AND CONTINUOUS IMPROVEMENT TOOLS-PRINTING FLOOR MANIVANNAN SAMPATH
presses may be employed rotary presses are used for high-speed letter-press printing
as in the printing of books magazines newspapers In rotary letter-press operations a
supply of ink is maintained in an ink fountain at a consistency suitable for the printing
conditions and the ink is fed from the fountain and distributed onto the raised surfaces
of the rotating printing form by a series of transfer and inking rollers [10] The web to
be printed is passed into contact with the moving inked form to affect the printing
operation After one side of the web has been printed that is after the first impression
a second printing or second impression is usually made on the other side of the web
by continuous operation of another section of the same press In multi-color letter-press
printing a series of impressions are made with inks of assorted colors a plurality of
impressions being placed in adjacent or superimposed relation on the same side of the
sheet or web [10]
Figure 5 shows the working of letterpress printing unit and its components
Figure 5 Letter printing station [10]
Applications
Letterpress printing was the effective book-preparing process For four centuries it was
also the powerful printing technology for posters announcements printed matter for
churches government and businesses single or two paged local news sheets daily and
weekly newspapers as well as various simple print jobs now limited to specialty works
such as numbering embossing hot stamping and hot wax carbonizing (spot carbon
printing) It is also used for die cutting perforating slitting and scoring [11]
THEORETICAL BACKGROUND 14
OPTIMIZING THE WORK ENVIRONMENT USING LEAN AND CONTINUOUS IMPROVEMENT TOOLS-PRINTING FLOOR MANIVANNAN SAMPATH
2143 Screen printing
Screen printing is a process in which ink is forced through a screen The screen-printing
stencil serves as a printing plate The screen is a delicate fabric made of natural silk
plastic or metal fibersthreads Plastic or metal fabric is used nowadays Ink is
imprintedtransferred through the image-specific open mesh that is not covered by the
stencil The screen-printing plate is therefore a combination of screen and stencil It is
the material the fineness of the screen (the number of screen threads per centimeter
of fabric length) the thickness of the screen the distance between the top and bottom
sides of the screen and the degree of opening of the screen (the degree of screen
opening areas as a percentage describes the ratio of the total of all mesh openings to
the entire surface of the fabric) that determine the printing properties and Quality of
the fabric (screen) [11]
Applications
Textilesmaterials printed T-shirts printed toys fronts of televisions radios etc
automobile dashboards measuring equipment packaging (plastic bags) printed circuit
boards large-format advertising posters are the areas where screen printing have found
its use [11]
Figure 6 shows the image of the screen-printing process and involved components
Figure 6 Screen printing station [11]
2144 Rotogravure
Process
True intaglio or steel-die process prints from sunken lines or grooves are connected and
cross each other Ink is then applied to the engraved areas and doctored or wiped off
the flat nonimage areas The resulting ink image is then impressed on the substrate to
THEORETICAL BACKGROUND 15
OPTIMIZING THE WORK ENVIRONMENT USING LEAN AND CONTINUOUS IMPROVEMENT TOOLS-PRINTING FLOOR MANIVANNAN SAMPATH
be printed Paper currency is printed from steel dies capable of reproducing beautiful
lines that no other process can duplicate A rotogravure is a form of printing and prints
directly from unconnected cells engraved into the plate cylinder [8]
Figure 7 shows the image of Gravure printing process and its units in operation
Figure 7 Gravure printing station [8]
Applications
Gravure is used for packaging magazines newspapers and other specialty printing
applications It has been an outstanding choice for printing process color for mass-
circulation magazines and newspapers Gravure-printed postage stamps are another
example of the exceptional print results of rotogravure Many plants have blended
flexography with gravure to produce exceptional print results on packaging materials
[8]
2145 Digital printing
The basic concept is that digital means using numbers to represent something and
thatrsquos what a computer does A typical image is converted into numerical data (a long
string of ones and zeros) that describe or quantify each sample point or ldquopixelrdquo (short
for picture element the basic unit of image information) in terms of specific attributes
such as color and intensity This data can be stored manipulated and transformed with
digital printing technologies back into a customarily viewed image [12]
THEORETICAL BACKGROUND 16
OPTIMIZING THE WORK ENVIRONMENT USING LEAN AND CONTINUOUS IMPROVEMENT TOOLS-PRINTING FLOOR MANIVANNAN SAMPATH
Process
Compared to traditional printing techniques digital printing is different However there
is no pressure or impact and there is no physical matrix The matrix now sits in the
computer in the form of digital data that can be converted repeatedly with or without
any variation into a print by any image-maker who either does his own printing (ldquoself-
printingrdquo) or who uses an outside printing service lab or retailer [12]
Figure 8 shows the process in which data is created stored and finally processed to
produce printed image on sheet
Figure 8 Processing of data into printed image [12]
Digital imaging and printing have changed the rules of visual communication Making
original prints or reproductions (see below) especially at an enormous size and in color
used to be costly cumbersome or difficult for any individual photographer or artist [12]
Figure 9 shows the image created using digital printing
THEORETICAL BACKGROUND 17
OPTIMIZING THE WORK ENVIRONMENT USING LEAN AND CONTINUOUS IMPROVEMENT TOOLS-PRINTING FLOOR MANIVANNAN SAMPATH
Figure 9 shows the image created using printing [12]
Advantages
The advantages of digital printing are clear in terms of cost consistency storage
flexibility
bull Some of the digital printing technologies are line printing mdash where pre-formed
characters are applied to the paper by lines
bull daisy wheel mdash where pre-formed characters are applied individually
bull dot-matrix mdash which produces arbitrary patterns of dots with an array of printing
studs
bull heat transfer mdash like early fax machines or modern receipt printers that apply heat
to special paper which turns black to form the printed image
bull blueprint mdash and related chemical technologies
bull inkjet mdash including bubble-jet mdash where ink is sprayed onto the paper to create the
desired image
bull laser mdash where toner consisting primarily of polymer with the pigment of the
desired colors are melted and applied directly to the paper to create the desired
image
bull 3D printing
2146 Offset lithography
Process
In offset lithographic printing the Printing ink is supplied to the inking rollers via a
reservoir (duct) Greater and lesser amounts of ink can be fed to the inking rollers by
opening and closing duct keys The inking rollers transfer the required amount of ink to
the printing plate The printing image is then transferred (or offset) from the plate to
THEORETICAL BACKGROUND 18
OPTIMIZING THE WORK ENVIRONMENT USING LEAN AND CONTINUOUS IMPROVEMENT TOOLS-PRINTING FLOOR MANIVANNAN SAMPATH
the blanket` and then to the paper on the impression cylinder The printed sheet is then
passed into the next printing unit via the transfer cylinder Each color must have a
separate printing unit The printing plate is made from aluminum and backed with a
sensitive coating The plate has two distinct areas the image area and the non-image
area Ink is accepted by the image areas of the plate while the non-image areas accept
a water-based mix called a damper solution When applied to the plate the solution
repels ink from the non-image area [13]
There are two types of lithographic printing they are
bull Sheet-fed
Sheet-fed press prints an image on single sheets of paper as they are fed individually
into the press The print quality and sheet to sheet registration are often better than
web-fed printing but it is often more economical to produce huge runs on web presses
because of their higher running speeds
bull Web-fed
A web-fed press prints images on a continuous web of paper fed into the press from a large roll of paper The web of paper is then cut into individual sheets after printing or as with continuous business form applications it is left in web form and is perforated for later separation into individual sheets
Figure 10 shows the working of offset printing machine along with parts involved in
producing prints
Figure 10 offset printing station [13]
Applications
The highest printing quality for packaging is achieved with offset printing Accordingly
printing of expensive luxury packaging for individual spirits chocolates perfumes and
cosmetics and even embossing in the correct register is always done on sheet-fed offset
THEORETICAL BACKGROUND 19
OPTIMIZING THE WORK ENVIRONMENT USING LEAN AND CONTINUOUS IMPROVEMENT TOOLS-PRINTING FLOOR MANIVANNAN SAMPATH
presses The printing of many other cardboard products and folding boxes for the
packaging of frozen food ice cream cigarettes drugs and cosmetics as well as many
other products in the food and non-food areas remains the almost exclusive domain of
offset printing technology [11]
Figure 11 shows the usage of offset printing on various products
Figure 11 Usage of offset printing for product lables [11]
215 Evolution of offset printing press
This section shows the evolution of offset printing technology and inventions made over
the past 100 years [14] [15]
1875
The first press to use offset lithography and the offset printing process is invented in
England The offset cylinder was covered with specially treated cardboard that
transferred the printed image from the litho stone to the surface of the metal
1880
The cardboard covering of the offset cylinder was changed to rubber which is still the
most commonly used material
1903
Ira Washington Rubel of the United States used the offset process to print on paper
Rubel noticed that whenever a sheet of paper was not fed into his lithographic press
during operation the stone printed its image to the rubber-covered impression cylinder
and the next impression had an image on both sides direct litho on the front and an
image from the rubber blanket on the back and discovered that images were printed
sharply by printing from the stone to the blanket and then to the paper
THEORETICAL BACKGROUND 20
OPTIMIZING THE WORK ENVIRONMENT USING LEAN AND CONTINUOUS IMPROVEMENT TOOLS-PRINTING FLOOR MANIVANNAN SAMPATH
1911
Albert Harris observed the process discovered by Rubel at about the same time and
developed an offset printing press for the Harris Automatic Press Company
1950
During the 1950s offset printing became the most popular form of commercial printing
as improvements were made in plates inks and paper maximizing the techniques
superior production speed and plate durability Today most of the printing including
newspapers is done by the offset printing process
1960
Increasingly newspaper printers begin replacing their outdated letterpress machines
with offset presses
1962
Heidelberg begins development for offset printing presses This came after decades of
resistance by management Technicians were able to convince them that this was the
way of the future
22 Production lines
221 Concept of production line
A production line is a set of the sequential process set up on an industrial shop floor A
production process or a manufacturing process is the transformation of raw materials
or components into finished products The stages of a production process involve
procurement fabrication assembly testing packaging and distribution The
production or manufacturing lines in industries can be categories into three typersquos ie
automated production lines semi-automated production lines and standard
production lines The nature of a production line depends on the complexity of the
manufacturing parts the production volume the sensitivity of the product and cost [16]
The production system has the following characteristics
1 Production is an organized activity so every production system has an aim
2 The system transforms the various inputs into useful outputs
3 It does not run in isolation from the other organization system
4 There exists feedback about the activities which is essential to control and
improve system performance [17]
THEORETICAL BACKGROUND 21
OPTIMIZING THE WORK ENVIRONMENT USING LEAN AND CONTINUOUS IMPROVEMENT TOOLS-PRINTING FLOOR MANIVANNAN SAMPATH
Figure 12 shows the inputs go through the transformation process and finally the output
of a production system
Figure 12 Schematic Production System [17]
222 Types of production lines
2221 Manual production lines
It consists of multiple workstations in which the assembly work is carried out as the
product (subassembly) is passed from station to station along the line At each
workstation one or more human workers perform a part of the total assembly work on
the product by adding one or more components to the existing subassembly Manual
lines are especially common where workpieces are fragile or if workpieces need to be
gripped often as industrial robots often lack the necessary accuracy In countries where
wage costs are low manual labor can also be a cost-efficient alternative to expensive
automated machinery [18]
Figure 13 depicts the manual assembly line setup
Figure 13 Manual assembly line [18]
THEORETICAL BACKGROUND 22
OPTIMIZING THE WORK ENVIRONMENT USING LEAN AND CONTINUOUS IMPROVEMENT TOOLS-PRINTING FLOOR MANIVANNAN SAMPATH
Manual operations are used in the assembly of complex work elements as well as when
product demand is unstable or where the use of specialized machines and equipment is
unjustifiably expensive Thus caution must be exercised in the design of a manual
assembly line with respect to the volume flexibility with uncertain production demand
To achieve this situation needs adjusting the number of workers or the system
configuration according to the changes in product demand Hence a manual assembly
line is more flexible than automated machine assembly systems in adapting to the
changes in production demand [19]
Manual assembly lines are used in high-production situations where the work to be
performed can be divided into small tasks and tasks assigned to the workstations on the
line A key advantage of using manual assembly line is a specialization of labor is by
giving each worker a limited set of tasks to do repeatedly According to Shtub [19] lack
of motivation and low level of satisfaction which is typically caused by the high
repetitiveness of elementary operations have been considered as a significant
disadvantage of assembly production
2222 Semi automatic production lines
Semi-automation describes a system in which a human operator or a small production
line feeds a product to a robot the robot performs a single task on that product and
then the human operator removes the product and completes the task
ldquoWork characteristic of a machine that only needs some degree of support from a manrdquo
In contrast to a completely automated system semi-automation does not achieve
complete relief from work for the worker [20] Ie the technical system usually achieves
the control of the individual functions Program control which means the start end and
succession of the individual functions is accomplished by manrdquo
Figure 14 shows the integration of manual and automatic workstations
Figure 14 combination of manual and automatic workstations [21]
Utilizing robotic and human capabilities at their best is obtained in an assembly system
where there is a sequential division of tasks The simple tasks suited for robots are found
THEORETICAL BACKGROUND 23
OPTIMIZING THE WORK ENVIRONMENT USING LEAN AND CONTINUOUS IMPROVEMENT TOOLS-PRINTING FLOOR MANIVANNAN SAMPATH
upstream in the line The complex often varied tasks that give the assembled products
human operators downstream perform their individual features Such hybrid lines have
been used to advantage in the industry for more than two decades [21]
Figure 15 shows the workstation been shared by the worker and an automated machine
in a line
A
B
Figure 15 A and B workplace sharing hybrid systems [22]
In this scenario several components must be assembled on a sheet metal part which is
supplied by a conveyor system The human worker must grip the components out of
bins to transport these parts towards the conveyor system (handling time) and to put
the components on the sheet metal parts (assembly) Afterward the robot must screw
these components into the sheet metal part (assembly) If the worker is too slow the
robot will wait until the worker has finished his tasks [23]
2223 Automated production lines
An automated production line has multiple workstations that are automated and linked
together by a work handling system that transfers parts from one station to the next
The automated production may consist of automated workstations manual
workstations and inspection stationsThere are different types of configurations layouts
available for automated production lines
bull In line
bull Segmented In-Line
bull Rotary
In-line layout
THEORETICAL BACKGROUND 24
OPTIMIZING THE WORK ENVIRONMENT USING LEAN AND CONTINUOUS IMPROVEMENT TOOLS-PRINTING FLOOR MANIVANNAN SAMPATH
Raw materials enter the automated production line and undergo a system of automated
processing at various workstations along the fixed production line the parts are passed
from workstation to workstation by means of a mechanized work transport system until
the wholly processed parts pass out of the automated production line after the last
process occurs to the part at the final workstation in the system [24]
Figure 16 describes the process of the In-line automated production line
Figure 16 Inline Configuration of an automated production line [24]
The conditions that decide the use of automated production lines include high product
demand stable product design long product life and multiple operations
Segmented In-line
L shaped layout
This layout allows fitting in a lengthy series of operations into limited space The feeding
cells start on an aisle and end at the point of use This May allow isolation of dangerous
or costly-to-move equipment in the elbow with savings in implementation cost andor
two directions for expansion It is easy to segregate the in-flow and outflow of physically
different materials products supplies and special services [24] Figure 17 shows the L-
shaped production layout with assembly stations to perform work
Figure 17 L shaped layout [24]
THEORETICAL BACKGROUND 25
OPTIMIZING THE WORK ENVIRONMENT USING LEAN AND CONTINUOUS IMPROVEMENT TOOLS-PRINTING FLOOR MANIVANNAN SAMPATH
U- shaped layout
U-shaped production lines were conceived as a solution in lean production
environments for waste elimination and for getting the full use of workerrsquos capabilities
Waste removal is usually achieved by the introduction of pull systems one-piece flow
leveling and ldquojidokardquo while fully utilizing workersrsquo capabilities requires a system of
respect for people based on minimizing wasted movements ensuring their safety and
giving them greater responsibility in running and improving their jobs [25]
Figure 18 shows u shaped production line system In U shaped lines the entrance and
the exit of the line system are remarkably close to each other Operators may handle
work-pieces both on the front and back of the line What operators found in crossover
workstations can perform tasks from both the front and back of the line Thus idle times
are reduced and resource use is increased thanks to the crossover stations found in
between the front and back of the U line [26]
Figure 18 U shaped production layout [24]
Rotary
Consists of a circular worktable around which work parts are fixed to work holders The
worktable rotates to move each work part in turn into each automated workstation
which is found around the circumference of the worktable The worktable is often called
a dial and the equipment is referred to as a dial indexing machine or simply indexing
machine
Figure 19 shows the image of a rotary layout design
THEORETICAL BACKGROUND 26
OPTIMIZING THE WORK ENVIRONMENT USING LEAN AND CONTINUOUS IMPROVEMENT TOOLS-PRINTING FLOOR MANIVANNAN SAMPATH
Figure 19 Rotary layout [24]
Limited to smaller work parts and few workstations and they cannot readily
accommodate buffer Robotic production lines storage capacity However they need less
floor space and are less expensive than other configurations [24]
Robots are being used extensively in assembly lines to perform the tasks and these
assembly lines are called robotic assembly lines [27] The robots are programmed to
perform different types of tasks and it can be used to work 24 hrs without worries of
fatigue Different types of robots are available in the market to do the same task with
different capabilities and efficiencies Therefore there is a requirement of reasonable
allocation of robots to workstations with the sure specific aim These robots need to be
re-assigned whenever there is a new product is planned for assembly [28]
Michels [29] consider that a robotic assembly line is composed of platform stations and
transporter robots to displace work-pieces between these platforms Multiple robots
may be assigned to each platform station By defining each transporter or platform as a
station and assuming the line starts and finishes with a transporter robot the
configuration results in line with an odd number of stations in an alternating pattern of
platform-fixed and transporter robots
Figure 20 shows the robotic line design model forming 13 serial stations (S1 to S13)
There are 24 robots in total composed of 17 platform robots (15 performing geometry
and finishing welding tasks and 2 performing stud tasks) and 7 transporter robots (4
performing finishing welding tasks 1 performing stud tasks (S9) and 2 for work-pieces
handling in the entrance and S11)
THEORETICAL BACKGROUND 27
OPTIMIZING THE WORK ENVIRONMENT USING LEAN AND CONTINUOUS IMPROVEMENT TOOLS-PRINTING FLOOR MANIVANNAN SAMPATH
Figure 20 Welding process performed by platform robots [29]
Figure 21 shows the types of the robot and their roles where they are being used in the
assembly line
Figure 21 Roles of robots [29]
Figure 22 shows the welding process performed by platform robots
Figure 22 Platform robots performing welding tasks [29]
THEORETICAL BACKGROUND 28
OPTIMIZING THE WORK ENVIRONMENT USING LEAN AND CONTINUOUS IMPROVEMENT TOOLS-PRINTING FLOOR MANIVANNAN SAMPATH
Figure 23 shows transporter robot on a track motion device unloading workpieces
Figure 23 Transporter robot on a track-motion device [29]
Benefits of the robotic system
bull The requirement for reduced floor space
bull Improved efficiency Improved quality
bull The ability to work in cold or hostile environments
bull Increased yields and reduced wastage
bull Increased consistency
bull Increased flexibility for some operations [30]
223 Management of production lines
2231 Workstations
A workstation is among the most critical places in a manufacturing environment Well-
organized working areas are essential for standardized work procedures which are
needed to control the workplace To perform the required tasks operators must use
different types of equipment tools and materials If the necessary resources are not
precisely and safely stored operators lose precious time to find them increasing thus
the non-value-added time (waste) [31] Workstations play a critical role in
manufacturing processes Lean workstations focus on minimizing waste and
concentrate operators to critical issues It is essential to ensure effectiveness in an
environment of high customization automation and competitiveness
As from the workstations design point of view Workstation design handles placing
materials tools equipment etc and routing operator movements in the most suitable
form That way operators can perform their work in an efficient manner [31]
traditional workstations and lean workstations are inherently different Traditional
workplaces are designed to ease the work of material handler not increase the value
THEORETICAL BACKGROUND 29
OPTIMIZING THE WORK ENVIRONMENT USING LEAN AND CONTINUOUS IMPROVEMENT TOOLS-PRINTING FLOOR MANIVANNAN SAMPATH
added by the operator A lean workstation is designed focused on operator concerns
such as safety and ergonomics and minimal wasted motion with the goal to get parts
efficiently and find tools quickly Assembly materials tools or parts should be
strategically positioned to allow the operator to reach it instantaneously without
interfering with operatorsrsquo safety and comfortability [32]
Maslow [33] introduced five stages of ldquoHierarchy of workstations needsrdquo which were
developed to understand and priorities the requirements to achieve full performance in
workstations
Figure 24 shows the Functionality effectiveness efficiency satisfaction are the levels of
hierarchy in workstation needs towards excellence proposed by Maslow
Figure 24 Hierarchy of workstation needs [33]
Functionality ensures physical and safety needs of the operators Effectiveness fulfills
their social and relationship needs such as friendship love and belonging Efficiency
reflects how the workstation and their associates are seen in the whole facility and if
their value is recognized and respected by others ndash esteem Finally satisfaction refers to
the achievement of higher goals and full levels of satisfaction ndash self-actualization and
self-transcendence Once all levels have been fulfilled the company and its workstation
can achieve the desired level of excellence [33]
THEORETICAL BACKGROUND 30
OPTIMIZING THE WORK ENVIRONMENT USING LEAN AND CONTINUOUS IMPROVEMENT TOOLS-PRINTING FLOOR MANIVANNAN SAMPATH
2232 Line balancing
Line balancing is a technique used in connection with the design of product layout or
lsquolsquolinesrsquorsquo The term lsquolsquobalancingrsquorsquo is used because one of its main aims is to minimize the
idle time and spread it as evenly as possible across the workstations [34] It is also used
to minimize imbalance betweenamong workers and workloads to achieve the required
run rate Therefore the line should be analyzed in terms of the assembly process
workstations layout and workstation cycle time [35]
When balancing a line the following factors need to be taken into account
bull the required output rate or cycle time (which depends on the demand for the
product)
bull precedence constraints (these are restrictions on the order in which tasks can be
done in other words specific tasks will have lsquolsquopredecessor tasksrsquorsquo that must be
done first)
bull zoning constraints (these are restrictions on where specific tasks or combinations
of tasks should or should not take place)
bull duplication of workstations are done in case when a task takes longer cycle time
than the available cycle time [34]
The line-balancing problem forms two aspects
bull Determination of the required number of stations and
bull The assignment of tasks to each station with the aim of maximizing efficiency (by
minimizing idle time and spreading it evenly across workstations)
Formulation
Equation 1 Represents the formulations involved in line balancing
Equation 1 Formulations involved in line balancing
119888119910119888119897119890119905119894119898119890 ∶= (119901119903119900119889119906119888119905119894119900119899119906119899119894119905119905119894119898119890)(119889119890119898119886119899119889119906119899119894119905119905119894119898119890)
119873119906119898119887119890119903 119900119891 119908119900119903119896 119904119905119886119905119894119900119899119904 ∶= 119879119886119904119896 119905119894119898119890 119862119910119888119897119890 119905119894119898119890frasl
119864119891119891119894119888119894119890119899119888119910 ∶= 119879119886119904119896 119905119894119898119890 119860119888119905119906119886119897 119899119906119898119887119890119903 119900119891 119908119900119903119896119904119905119886119905119894119900119899119904frasl
The effectiveness of the balance decision is measured by the lsquolsquobalance lossrsquorsquo of the line
The balance loss is the time invested in making one product that is lost through
imbalance expressed as a percentage of the total time investment
For a paced n stage line the time lost through imbalance is the cumulative difference
between the stationsrsquo distributed work times and the cycle time allowed by the pacing
of the line For unpacked lines it is the cumulative difference between each stagersquos work
THEORETICAL BACKGROUND 31
OPTIMIZING THE WORK ENVIRONMENT USING LEAN AND CONTINUOUS IMPROVEMENT TOOLS-PRINTING FLOOR MANIVANNAN SAMPATH
time and that of the stage with the most significant work time (this effectively governs
the cycle time of the whole line)
An amazingly simple line-balancing problem may be solved by lsquolsquotrial and errorrsquorsquo Most
practical problems however are extremely complex needing thousands of tasks to be
assigned across hundreds of workstations and with many precedences and zoning
constraints to be taken into account Many heuristic algorithms have been developed
such as the Kilbridge and Wester method and the ranked positional weights technique
Being based on heuristics or lsquolsquorulesrsquorsquo that have been tested empirically such techniques
can provide useful although not necessarily best results [34]
Kilbridge and Wester method
bull It is a heuristic procedure which selects work elements for assignment to stations
according to their position in the precedence diagram
bull elements at the end of the precedence diagram might be the first candidates to
be considered just because their values are significant
Procedure
Construct the precedence diagram so those nodes being work elements of the same
precedence are arranged vertically in columns
1 List the elements in order of their columns column I at the top of the list If an
element can be in more than one column list all columns by the element to show
the transferability of the element
2 To assign elements to workstations start with the column I elements Continue
the assignment procedure in order of column number until the cycle time is
reached [36]
2233 Supply
The supply chain is defined as a network of facilities and distribution options that performs
three tasks One is procurement second is manufacturing or transformation of these
materials into products and the third is distribution which is to deliver the manufactured
products to the ultimate or end customer [37]
Figure 25 shows the set of suppliers and then there is the manufacturing or the
organization produced goods are sent to customers through a channel so it could be a
distribution channel and from there it goes to the final customer
THEORETICAL BACKGROUND 32
OPTIMIZING THE WORK ENVIRONMENT USING LEAN AND CONTINUOUS IMPROVEMENT TOOLS-PRINTING FLOOR MANIVANNAN SAMPATH
Figure 25 Represents the flow across enterprises [38]
There are four primary uses of the term lsquosupply chain managementrsquo [38]
bull First the internal supply chain that integrates business functions involved in the
flow of materials and information from inbound to outbound ends of the
business
bull Secondly the management of two-party relationships with immediate suppliers
bull Thirdly the management of a chain of businesses including a supplier a supplierrsquos
suppliers a customer and a customerrsquos customer and so on
bull Fourthly the management of a network of interconnected businesses involved in
the ultimate provision of product and service packages needed by end
customers
Performance in supply chain management
Network performance
Easton [39] investigated performance differences between single-sourcing and multiple-
sourcing networks They proposed that single-sourcing networks would be more rigid
and stronger as there would be dense flows of exchanges within them It would also be
easier to keep confidentiality in single sourcing However the advantages of multi-
source or extensive networks included an ability to adapt to changes in the environment
through switching and a broader base to generate innovation from advocated multiple
sourcing as an essential strategy for firms who needed to reduce uncertainty in
purchasing
Chain performance
Logistics research into chain performance has focused primarily on improving speed and
cost performance Improvements in speed and cost may relate to the physical supply
THEORETICAL BACKGROUND 33
OPTIMIZING THE WORK ENVIRONMENT USING LEAN AND CONTINUOUS IMPROVEMENT TOOLS-PRINTING FLOOR MANIVANNAN SAMPATH
chain through which materials are converted and goods flow to end customers or to
the process chain of orders and demand transmission [40]
Relationship performance
Recent purchasing literature emphasizes the increasing importance of measuring and
monitoring performance within relationships because of the increased dependency
between the parties A performance measurement system implemented by the
purchasing party can enhance the buy-sell relationship However most performance
measurement systems in use do not do this for three main reasons First they
incorporate mostly hard objective measures which may not be proper for measuring
softer features of capability and performance Secondly the measurement systems are
usually designed by the purchasing organization for the purchasing organization rather
than for the relationship as a quasi-organization [41]
23 Lean concepts and tools
Lean is a management philosophy that focuses on reconfiguring organizational
processes to continually reduce and eliminate waste over time thereby contributing to
efficiency and value creation for the customer [42]
The concept of lean is the Toyota way promoted by Toyota which helps in improving
the flow of a process in a system is by dropping any uneven workflow throughout the
system Tools namely pull system by ldquoKanbanrdquo and production smoothing or ldquoheijunkardquo
are used for improving the flow in a system
Womack and Jones [43] stated lean is a management philosophy that focuses on
reconfiguring organizational processes to continually reduce and cut waste over time
thereby contributing to efficiency and value creation for the customer To this end Lean
applies specialist analytical tools and techniques
The concept helps in reducing waste (Muda) in any organization without affecting its
products or services which also includes the waste occurred due to overburden (muri)
and uneven workload (Mura) scenarios which are considered as significant causes of
creating losses Several tools and practices have been developed to achieve lean
Figure 26 presents the classification of the tools as suggested by Salonitis and
Tsinopoulos [44]
THEORETICAL BACKGROUND 34
OPTIMIZING THE WORK ENVIRONMENT USING LEAN AND CONTINUOUS IMPROVEMENT TOOLS-PRINTING FLOOR MANIVANNAN SAMPATH
Figure 26 Lean manufacturing tools and practices [44]
The use of lean will allow any organization to achieve continuous and valuable
propositions for their key stakeholders A lean manufacturing initiative is focused on
cost reduction and increases in turnover by systematically and continuously cutting all
non-value-added activities [45]
Benefits of lean
As been said by many authors the benefits of lean can be grouped and represent five
improvement dimensions waste elimination continuous improvement continuous
flow and pull-driven systems multifunctional teams and information systems The
main benefits are related to the reduction of different type of resources reduced
delivery time increased productivity higher quality faster problem solving and decision
making and higher customer satisfaction [46]
Through lean manufacturing can be achieved by using less human effort in the factory
less space less financial resources and less material for producing the same product
[47]
231 Concept of waste
The concepts of waste are central to the Lean method that has been adapted from its
manufacturing origins and applied successfully to the context in several organizations
Howell defines waste as the difference in productivity when benchmarked against the
performance criteria for a production system failure to meet the unique requirements
of a client considered waste [48]
THEORETICAL BACKGROUND 35
OPTIMIZING THE WORK ENVIRONMENT USING LEAN AND CONTINUOUS IMPROVEMENT TOOLS-PRINTING FLOOR MANIVANNAN SAMPATH
Waste also defined as ldquoAnything that does not add value to the customer is a wasterdquo
Waste adds to time and cost This definition captures the thinking behind operations
management most effectively because it takes into consideration not just the material
wastes but also other resources like time and labor to which we can assign some form
of value [49]
Waste can be in the form of additional output input or processing It can be in the form
of materials stocks equipment facilities manhours utilities documents expenses
motion and other activities that do not add value [50]
Muda Muri Mura are three different types of wastes
Muda
Muda means waste or uselessness This type of waste characterized by using time
money and resources while not adding any value to the customer The goal of finding
Muda is to recognize which steps are necessary for the process and which need to be
reduced or eliminated [51]
bull Type I Muda Non-value-added tasks which seem to be essential Business
conditions need to be changed to cut this type of waste
bull Type II Muda Non-value-added tasks which can be eliminated at once
Taiichi Ohno the author of Toyota Production System devised seven manufacturing
wastes Overproduction Inventory Over-processing Correction Waiting Conveyance
and Motion [52]
Muri
Muri means overburden or unreasonableness (waste of overloading equipment facility
or people resources beyond its ability)
Mura
Mura means variation or unevenness It refers to waste of unevenness in production
volume It may take two different forms variation in production scheduling uneven
production workload and pace of work
232 POKE-YOKE
In 1961 Shigeo Shingo introduced Poka-Yoke method when he is one of the engineers at
Toyota Motor Corporation This method in other words is to prevent defects and errors
originating in the mistake [53]
The basis for poke yoke is that defects occur because of worker errors Although poke
yokes may be used for mistake-proofing any process poke yokes are usually targeted to
repetitive tasks where the potential for human error is more likely [54] Poka-Yoke
design can dramatically decrease the risk of producing defectives again [55] The aim of
THEORETICAL BACKGROUND 36
OPTIMIZING THE WORK ENVIRONMENT USING LEAN AND CONTINUOUS IMPROVEMENT TOOLS-PRINTING FLOOR MANIVANNAN SAMPATH
Poka-Yoke method is to eliminate or minimize human errors in manufacturing processes
and management because of mental and physical human imperfections [53]
DTommelein [56] after performing mistake-proofing in an AEC (Architecture
Engineering construction) industry stated that mistake-proofing could be practiced
within a specialty (eg plumbing electrical or mechanical work) it can be practiced by
designers manufacturers or fabricators to benefit a product as it is being constructed or
throughout its lifecycle performance or it can be practiced by designers to benefit a
system
Poke-yoke inspection methods
Successive self and source inspection can be achieved using poke yoke methods Poke-
yoke achieves 100 percent inspection through mechanical or physical control [57]
Regulatory functions of poke yoke
There are two ways where poke yoke can be used to correct mistakes
bull Control type
The control poke-yoke is the most robust corrective device because it shuts
down the process until the poor condition has been corrected [57]
bull Warning type
The warning poke-yoke allows defective processing to continue if workers do not
respond to the warning [57]
Figure 27 shows the two types poke yoke methods
Figure 27 Function of Poke-Yoke [58]
The decision to implement a poke-yoke must be made based on a cost-benefit analysis
The control poke-yoke is the more effective in most cases [57]
There are three types of control poke-yoke
bull The contact method finds defects by slight changes in product shape or dimension
are sometimes introduced deliberately to make defects easier to find color
differences
bull The fixed value method decides whether a given number of movements is made
THEORETICAL BACKGROUND 37
OPTIMIZING THE WORK ENVIRONMENT USING LEAN AND CONTINUOUS IMPROVEMENT TOOLS-PRINTING FLOOR MANIVANNAN SAMPATH
bull The motion step method decides whether the established steps or motions of a
procedure are followed [57]
The Poka-Yoke is a technique for avoiding human error at work A defect exists in either
of two states the defect either has already occurred calling for defect detection or is
about to occur calling for defect prediction [59]
Step by step process in applying poka-yoke
bull Find the operation or process
bull Analyze and understand the ways in which a process can fail
bull Decide the right Poka-yoke approach such as using a
o Control Type Preventing an error being made
o Warning Type Highlighting that an error has been made
bull Determine whether a Contact Method Constant Number or Counting Method
Motion-Sequence Method
bull Trial the method and see if it works
bull Train the operator review performance and measure success [60]
233 MUDA
There are two types of waste (Muda)
Muda Type I non-value adding but necessary for end-customers These are usually
harder to eliminate because while classified as non-value adding they may still be
necessary For example while an end-customer might not view quality inspection in car
assembly as value-adding it is necessary to ensure the car meets safety standards
Muda Type II non-value is adding and unnecessary for end-customers These contribute
to waste incur hidden costs and should be eliminated
Figure 28 shows the seven types of waste by Taiichi Ohno
Figure 28 Types of waste [61]
THEORETICAL BACKGROUND 38
OPTIMIZING THE WORK ENVIRONMENT USING LEAN AND CONTINUOUS IMPROVEMENT TOOLS-PRINTING FLOOR MANIVANNAN SAMPATH
Transportation
Transport is an inseparable part of the production processes which cannot be removed
However it does not give any value to the final product and this is why the aim is to
reduce it to the lowest possible level [61]
Inventory
Inventory wastes come from the purchasing storage of excess or excessive supplies
materials and other resources This waste can also be caused by overproduction as
excess materials and work-in-process are accumulated Inventory waste is often due to
a lack of planning and failure to match purchases with the actual consumption or usage
rate of a resource [50]
Motion
Unnecessary movements in the manufacturing environment will result in processing
delays Other unutilized talents are employee lost time excellent skills employee ideas
and recommendations for simplifying the process [62]
Waiting
Some common wait time is caused by processing delays machine or system downtime
response time and signature needed for approval wait time Delay usually caused by the
loading and unloading the workpiece in the machines The operatorrsquos time allocation is
more than that of the actual processing time This excess time allocation for the
operators to do the job increases the overall wait time and delay in the process [63]
Over-production
Making more of a product that is needed results in several forms of waste typically
caused by production in large batches The customers needs often change over the time
it takes to produce a larger batch Over-production has been described as the subdue
waste
Over-processing
Doing more to a product that is needed by the end-customer results in it taking longer
and costing more to produce They do not answer to a real need adding more value to
the service than the customers are willing to pay for Design or build a work that presents
an oversized performance if compared with real demand [64]
Defects
Whenever defects occur extra costs are incurred by reworking the part rescheduling
production etc [61]
THEORETICAL BACKGROUND 39
OPTIMIZING THE WORK ENVIRONMENT USING LEAN AND CONTINUOUS IMPROVEMENT TOOLS-PRINTING FLOOR MANIVANNAN SAMPATH
234 SMED
The SMED method was developed by Shingo (1985) who described it as a scientific
approach to reduce setup times and which can be applied to any industrial unit and to
any machine
SMED is defined as the minimum amount of time necessary to change the type of
production activity taking into consideration the moment in which the last piece of a
previous lot was produced to the first piece produced by the subsequent lot [65]
SMED helps to reduce machine setup times by cutting wastes and unnecessary setup
processes and helps to improve current setup processes and manufacturing flexibility
[66]
By focusing on the elimination of the waste associated with tool changeovers in the
setup phase SMED allows for the reduction of lot sizes and enables one to meet the
fluctuation of demand It further cuts the waste inherent to stock buildup and enhances
a reduction in lead time [67]
The SMED method in association to other Lean tools on a seat-cable assembly line at
the automotive sector company showed a reduction in setup time by at least 583
corresponding to 210 min in a week [68]
A fundamental aspect of the SMED method relates to its features of internal and
external activities
External activities
All the setup activities which do not interfere directly with the equipment and which
can be carried out without interrupting production are designated as being external
activities
Internal activities
Those who imply a stoppage in the equipment running are described as internal
activities The correct separation of the two is what fundamentally contributes to a
reduction in setup times [67]
Figure 29 shows the different phases of a SMED process
THEORETICAL BACKGROUND 40
OPTIMIZING THE WORK ENVIRONMENT USING LEAN AND CONTINUOUS IMPROVEMENT TOOLS-PRINTING FLOOR MANIVANNAN SAMPATH
Figure 29 The phases of SMED method [69]
In sum the SMED method consists of four phases when aiming to reduce setup times
bull PHASE A - In this phase there is not a clear separation between activities that
must be performed while the equipment is stopped (activities that are not
making parts or internal activities) and the ones that can be done while
equipment is running (activities making parts or external activities) In this
phase the involvement of everyone is critical and should be specifically assured
bull PHASE B - This phase refers to the detailed characterization organization and
separation of the operations in internal or external Shingo (1985) considers this
the most crucial phase from which the setup can be reduced from 30 to 50
bull PHASE C - a new analysis of all operations should be done to verify the
classification done in the phase B and focus effort should be directed to convert
internal operations into external The implementation of this phase should
allow an improvement from 10 to 30 in the total time of internal setup of
the phase B [65]
bull PHASE D ndashthe primary goal is to reduce the time of internal and external
operations through the application of the identified solutions that will allow an
easy fast and secure performance
Benefits of Single Minute Exchange of die
bull The reduction of inventory the increase in production flexibility and the
rationalization of tools is among the indirect benefits
bull The direct benefits include the reduction of setup time the reduction of time
spent with fine-tuning the machines the reduction of errors during
changeovers the improvement of product quality and increased safety [65]
235 5S
The 5S lean tool was developed in Japan by Sakichi Toyoda Kishiro Toyoda and Taiichi
Ohno in 1960 [70] 5S is a method of organizing the workspace in a clean efficient and
safe manner to achieve a productive work environment The 5S is a starting point for
THEORETICAL BACKGROUND 41
OPTIMIZING THE WORK ENVIRONMENT USING LEAN AND CONTINUOUS IMPROVEMENT TOOLS-PRINTING FLOOR MANIVANNAN SAMPATH
any company that wants to be recognized as a responsible producer worthy of world-
class status [71]
Implementation of the five levels can reduce the amount of waste and errors and
increase productivity improve safety and quality of products or services [72]
Figure 30 shows the 5 stages of 5s as implementation steps
Figure 30 5S method [73]
The method consists of the sequential following of five steps
bull Seiri (Sort)
The workplace should only have what is needed to perform the activities
Remove all unnecessary tools and parts Go through all tools materials and so
forth in the plant and work area Keep only essential items
bull Seiton (Set in order)
There must be a place for everything and everything should be in its place Quick
and visual identification of tools and areas saves time and eases processes
bull Seiso (Shine)
To keep everything clean and neat One aspect of ldquoSeisordquo is to design and
implement effective methods which must be integrated into the operatorsacute daily
maintenance tasks
bull Seiketsu (Standardize)
Documenting and standardizing the method using standard procedures
Standards should be very communicative clear and easy to understand
bull Shinseki (Sustain)
The last step consists of developing a method to ensure the 5S technique is
followed It needs discipline and focus Usually audits are performed to assure
the sustainability of the method
The implementation of 5s in automotive cable production plant and its case study
concludes that implementing and maintaining 5S method and standards in the company
THEORETICAL BACKGROUND 42
OPTIMIZING THE WORK ENVIRONMENT USING LEAN AND CONTINUOUS IMPROVEMENT TOOLS-PRINTING FLOOR MANIVANNAN SAMPATH
led to improved performances increase of the productivity of the organization the
safety at workplace and the product quality has been increased [73]
5S bring several benefits to a company being the most relevant one the decrease in a
waste of time and space According to Hirano the rewards of applying 5S are extended
to quality security and hygiene [74]
24 Continuum improvement tools
Continuous improvement or Kaizen is a method for finding opportunities for
streamlining work and reducing waste The practice was formalized by the popularity of
Lean Agile Kaizen in manufacturing and business and it is now being used by
thousands of companies all over the world to find savings opportunities Many of these
ideologies can be combined for excellent results For example Kaizen and Kanban can
go hand-in-hand to facilitate continuous improvement
241 PDCA
Deming introduced PDCA to Japanese enterprises in 1950 according to which quality
improvements take place through four significant steps Plan-Do-Check-Act Since then
Japan has become the world leader in quality management [75] PDCA is a successive
cycle which starts off small to test potential effects on processes but then gradually
leads to more substantial and more targeted change [76] It consists of a logical
sequence of four repetitive steps for continuous improvement and learning These all
four steps are repeated over and over as part of a never-ending cycle for improvement
[77] Figure 31 shows the process of the PDCA cycle in a clockwise direction
Figure 31 PDCA Cycle [77]
THEORETICAL BACKGROUND 43
OPTIMIZING THE WORK ENVIRONMENT USING LEAN AND CONTINUOUS IMPROVEMENT TOOLS-PRINTING FLOOR MANIVANNAN SAMPATH
According to Gorenflo and Moran [78] [79] the phases of PDCA can be understood as
follows
bull Plan In this phase opportunities for improvement are found and prioritized the
current situation of the process is investigated through consistent data the
causes of the problem are determined and possible actions to mitigate the
issues are chalked out
bull Do The purpose of this step is to implement the action plan select and document
data voluntarily and note the unexpected events lessons learned and
knowledge gained
bull Check At this point the results of the actions are analyzed The new situation is
compared to the old verifying if there were improvements and whether aims
were met For this various graph support tools are used
bull Action At this stage the team involved develops methods that will standardize
the improvement (if the result has been reached) repeats the test to collect new
data and re-evaluate the intervention (if the collected data is insufficient or
circumstances have changed) or abandon the project and make another
beginning from stage 1 (if the actions taken have not generated useful
improvements)
The application of PDCA has seen various improvements in different scenarios where
they were performed According to PDCA Processes can be improved with changes in
workplace layout material handling system workplace arrangement and
Standardization of operations [80]
The PDCA cycle ensures two types of corrective action ndash temporary and permanent The
short action is aimed at practically tackling and fixing the problem The permanent
corrective action consists of investigation and cutting the root causes and thus targets
the sustainability of the improved process [81]
242 TFM
TFM is then defined as an integrated concept to increase Process Flow and Effectiveness
(Pull) across the Totality of a Supply Chain The targets are the reduction of the total lead
time in the SC Reducing lead time also drops Muda of waiting and really means creating
a material flow [82]
Primarily it is necessary to create an internal pull flow in maximum operational
efficiency and free of non-value added activities (NVAA) then consider the extension to
the valley (the delivery side ie customers) and upstream (the source side ie the
suppliers)
Figure 32 shows the TFM model having the internal pull flow having the suppliers
customers as for source and destination respectively
THEORETICAL BACKGROUND 44
OPTIMIZING THE WORK ENVIRONMENT USING LEAN AND CONTINUOUS IMPROVEMENT TOOLS-PRINTING FLOOR MANIVANNAN SAMPATH
Figure 32 TFM model [83]
The flow of materials can be considered as a repeated sequence of four types of
transaction namely transport inspection waiting and transformation the only value-
added activities The primary objective is the reduction of total lead time as regular
coverage of stocks eliminating Muda process creating benefits in terms of cost
reduction and working capital increased productivity and quality in order to achieve a
higher level of service provided to customers and to improve therefore the satisfaction
[84]
Figure 33 shows the TFM pillars and the strategies involved in each pillar
Figure 33 Total Flow Management Pillars [83]
THEORETICAL BACKGROUND 45
OPTIMIZING THE WORK ENVIRONMENT USING LEAN AND CONTINUOUS IMPROVEMENT TOOLS-PRINTING FLOOR MANIVANNAN SAMPATH
TFM is a model that can trigger a breakthrough in the performance of any Supply Chain
and that embodies the power of a complete lean transformation [83]
The flow of information and materials found through the analysis of logistic loop can be
grouped into three pillars of TFM Figure 33
bull Production Flow
bull Internal coordination flow
bull External coordination flow
In a Total Flow Management optics each of these flows must be analyzed and perfected
by applying the principles of Lean and Kaizen tools
The first step is to improve the production flow which ranks as aims the implementation
of the one-piece flow increased flexibility by adjusting the setup and an increase in
operational efficiency and supply
The improvement actions are divided into these categories
Redesign of the layout and lines in one-piece optical flow redesign of the perimeter of
the line for the efficiency of supply definition of standard work for operational
efficiency SMED technique for flexibility in setup low-cost automation to reduce the
walls
The second step is the optimization of internal logistics flows including all the
movements of small containers inside the plant but also the related information flows
The improvement actions are divided into these categories
bull A system to simplify and streamline internal transport of the material to the point
of use synchronization as coordination between supply and production leveling
productivity of the lines and equipment in relation to the takt time pull
production planning by the actual customer orders
Finally the third step is the optimization of external logistics flows ie the handling of
materials and products generally parceled out in pallet from the factory to customers
and suppliers to the plant
bull In this case the categories of intervention are redesign of the stores and
warehouses creation of the milk run ie an external flow of transport physical
flows in (inbound) and outgoing (outbound) through small containers and
pallets planning pull the logistics to handle the material withdrawals according
to the royal orders of consumers
243 OEE
Overall Equipment Effectiveness (OEE) is a crucial measurement of efficiency in
manufacturing processes (at the machine manufacturing cell or assembly line levels)
THEORETICAL BACKGROUND 46
OPTIMIZING THE WORK ENVIRONMENT USING LEAN AND CONTINUOUS IMPROVEMENT TOOLS-PRINTING FLOOR MANIVANNAN SAMPATH
[9] It is defined as the ratio of producing goods of approved quality to the scheduled
production time (loading time) [85] The OEE has been applied as a measurement tool
and decision-making aid for improving productivity by improving equipment [86] In
general OEE is decided according to each machine used in a production process to
identify its availability quality and performance contributions and to observe the
possible relationships between the different parameters of influence
Equation 2 Represents the formulas involved in calculating OEE
Equation 2 formulations in calculating OEE
119860119907119886119894119897119886119887119894119897119894119905119910(119860) ∶= 119874119901119890119903119886119905119894119898119890 119905119894119898119890 119871119900119886119889119894119899119892 119905119894119898119890frasl
119875119890119903119891119900119903119898119886119899119888119890(119875) ∶= 119873119890119905 119900119901119890119903119886119905119894119899119892 119905119894119898119890 119874119901119890119903119886119905119894119899119892 119905119894119898119890frasl
119876119906119886119897119894119905119910(119876) ∶= 119907119886119897119906119886119887119897119890 119900119901119890119903119886119905119894119899119892 119905119894119898119890 119873119890119905 119900119901119890119903119886119905119894119899119892 119905119894119898119890frasl
119874119907119890119903119886119897119897 119864119902119906119894119901119898119890119899119905 119864119891119891119890119888119905119894119907119890119899119890119904119904 ∶= 119860119907119886119894119897119886119887119894119897119894119905119910 lowast 119875119890119903119891119900119903119898119886119899119888119890 lowast 119876119906119886119897119894119905119910
Figure 34 shows the six significant losses divided into the three categories such as
availability performance and quality where (A) availability is defined as a ratio of
planned production time minus downtime (breakdowns and changeovers) over planned
production time (P) Performance efficiency is the ideal cycle time times the number of
products produced over the actual runtime The (Q) quality rate is the ratio between
accepted products over several products produced
Figure 34 OEE Timeline [87]
Nakajima [86] defines the six significant losses in production as in three categories [85]
THEORETICAL BACKGROUND 47
OPTIMIZING THE WORK ENVIRONMENT USING LEAN AND CONTINUOUS IMPROVEMENT TOOLS-PRINTING FLOOR MANIVANNAN SAMPATH
Downtime losses
1 Equipment failures are categorized as time losses when productivity is reduced
and quantity losses caused by defective products
2 Setup and adjustment time losses result from downtime and defective products
that occur when the production of one item ends and the equipment is adjusted
to meet the requirements of another item
Speed losses
3 Idling and minor stop losses occur when the production is interrupted by a
temporary malfunction or when a machine is idling
4 Reduced speed losses refer to the difference between equipment design speed
and actual operating speed
Quality losses
5 Reduced yield occurs during the initial stages of production from machine startup
to until stabilization
6 Quality defects and rework are losses in quality caused by malfunctioning
production equipment
World class level of OEE is in the range of 85ndash92 for non-process industry [88]
49
ltTIacuteTULO DA TESEgt ltNOME DO AUTORgt
THESIS DEVELOPMENT
31 Production lines characterization
32 Problem characterization
33 Objective
34 Brainstorming
35 SWOT analysis of possible solutions
36 Implementation
THESIS DEVELOPMENT 51
OPTIMIZING THE WORK ENVIRONMENT USING LEAN AND CONTINUOUS IMPROVEMENT TOOLS-PRINTING FLOOR MANIVANNAN SAMPATH
THESIS DEVELOPMENT
31 Production lines characterization
In this section the characteristics of production lines where the work was
performed are briefed and picturized
311 Production line A
There are two printing machines used at this production line they are Heidelberg
Speedmaster 74-5 Heidelberg Speedmaster 52-2 having 5 and 2 printing bodies
respectively each produces products of small batches prints at 15000 sph The machines
are positioned in between the marked yellow line giving enough space for the
production activity to be carried out
Explaining the process in Heidelberg Speedmaster 74-5 production starts by receiving
the order and obtaining required raw materials such as the specified size of printing
paper inks printing plates as per specified in the job sheet
Figure 35 shows the picture of Heidelberg Speedmaster 74-5 printing unit at Marsil
Figure 35 Offset printing SM74-5 unit at Marsil
The inks for the production are introduced into the inking rollers through the reservoir
ducts present at heads of the printing bodies by the machine operator and are evenly
THESIS DEVELOPMENT 52
OPTIMIZING THE WORK ENVIRONMENT USING LEAN AND CONTINUOUS IMPROVEMENT TOOLS-PRINTING FLOOR MANIVANNAN SAMPATH
spread out and so the printing machines are made to run for the inks to reach the
cylinders inside each printing bodies The printing plates are cleaned by cleaning
solutions and introduced into printing bodies in between the plate cylinder and the
impression cylinder(blanket) as the machines grab the plates and set them up through
the press of a button specified at each printing bodies
Figure 36 shows the cleaning solution used for cleaning plates during the production
process
Figure 36 Plate cleaning solution
Control system
Selection of size of the printing area the intensity of the colors to be printed the
thickness of the printing paper size of the production is made through the control
system specified for that printing unit Figure 37 A and B shows the control system
images of Speedmaster 74-5 at the printing unit
A
B
Figure 37 Control systems of SM 74-5
The printing process begins after setup for the production is complete and several prints
for the job being printed and evaluated The evaluation performed through a device that
measures the intensity of the ink printed on the paper and the results compared to the
THESIS DEVELOPMENT 53
OPTIMIZING THE WORK ENVIRONMENT USING LEAN AND CONTINUOUS IMPROVEMENT TOOLS-PRINTING FLOOR MANIVANNAN SAMPATH
expected level by the operator The operator performs a few more prints by changing
the intensity level on the control system and the operation repeated until the operator
has a superior quality of prints for the job This shows that the production unit is partially
automatedFigure 38 A and B shows the image of measuring devices used at every
production unit during preparation operations
A
B
Figure 38 Measuring devices
Figure 39 Shows the image of goods produced by speedmaster 74-5 arraged on pallets
Figure 39 Products produced by SM74-5
The produced goods are then transferred to the next production unit with help of
manual fork lifters where the final goods are produced according to requirements
Figure 40 shows the image of manual fork lifter used for transferring goods
THESIS DEVELOPMENT 54
OPTIMIZING THE WORK ENVIRONMENT USING LEAN AND CONTINUOUS IMPROVEMENT TOOLS-PRINTING FLOOR MANIVANNAN SAMPATH
Figure 40 Manual fork lifter
The speedmaster 52-2p having 2 printing bodies performs printing through two colors
using plates sizing 459x525 mm The setup for the production is the same as the
Speedmaster 74-5 The produced prints are corrected visually by comparing the prints
produced to an ideal print copy and the required intensities of ink to be printed changed
by changing the knob present at the heads of the printing bodies of the machine This
shows that the printing machine is partially automated
Figure 41 shows the image of Speedmaster master 52-2 with control system along with
the printing machine
Figure 41 SM 52-2
312 Production line B
The production line B has two production units speedmaster 52-4 and web-fed offset
printing machine
THESIS DEVELOPMENT 55
OPTIMIZING THE WORK ENVIRONMENT USING LEAN AND CONTINUOUS IMPROVEMENT TOOLS-PRINTING FLOOR MANIVANNAN SAMPATH
Figure 42 shows the image of Speedmaster 52-4 at the production line
Figure 42 SM 52-4
The speedmaster 52-4 has 4 printing bodies using 4 colors for the printing process with
the printing plates sizing 459x525 mm The produced prints are corrected at the
workstation which also has a control station The setup for the production is the same
as the Speedmaster 74-5 The printing machine has a control system separately with the
work station
THESIS DEVELOPMENT 56
OPTIMIZING THE WORK ENVIRONMENT USING LEAN AND CONTINUOUS IMPROVEMENT TOOLS-PRINTING FLOOR MANIVANNAN SAMPATH
Control system
The control system for speedmaster 52 4 is provided with the workstation where the
evaluation works are performed and the input is fed accordingly For example the
thickness of the sheet dimensions of the printing area adjustments of the margins the
flow of die and much more can be performed
Figure 43 shows the images of the control systems for Speedmaster 52-4
Figure 43 A and B control systems for Speedmaster 52-4
Figure 44 shows the image of goods produced by the printing machine SM 52-4
Figure 44 Goods produced at SM 52-4
The next printing unit in this line is the didde web offset printing machine with 4 printing
bodies capable of printing 80m minute Sheets of the maximum length of 340mm to a
minimum of 100mm can be printed The machine is installed spatially along with the
other 3 machines
THESIS DEVELOPMENT 57
OPTIMIZING THE WORK ENVIRONMENT USING LEAN AND CONTINUOUS IMPROVEMENT TOOLS-PRINTING FLOOR MANIVANNAN SAMPATH
Figure 45 shows the picture of didde web-fed printing unit at Marsil
Figure 45 Web-fed Printing unit
Control system
The control systems at these production units assigned along with the printing bodies
The usage of the printing bodies adjusted according to the work needs by removing one
of the gears at a specific printing body that is not involved in the working of the printing
machine
Figure 46 shows the image of goods produced by didde webfed printing machine
Figure 46 Products produced at the webfed unit
THESIS DEVELOPMENT 58
OPTIMIZING THE WORK ENVIRONMENT USING LEAN AND CONTINUOUS IMPROVEMENT TOOLS-PRINTING FLOOR MANIVANNAN SAMPATH
313 Production line C
The Production line c has two printing machines they are heidelberg SORM-Z and
heidelberg GTO 52
The heidelberg SORM-Z semi automated printing machine consists of 2 printing bodies
uses printing plates with size 720x540 mm capable of printing 30 million copies having
printing format maximum of 720x540 mm and minimum of 280x210 mm The machine
is positioned patially along with heidelberg GTO The control system is provided along
with the machine Each machine at the production floor is provided with fire
extinguishers as safety precautions
Figure 47 shows the image of heidelberg SORM-Z at the printing floor
Figure 47 Heidelberg SORM-Z
The heidelberg GTO- 52 capable of printing sheets maximum of 520x360 mm to
minimum of 160x80 mm with two printing bodies printing 8000 sph The control system
for GTO-52 comes along with the printing machine
Figure 48 shows the image of heidelberg GTO-52 at the printing floor
Figure 48 Heidelberg GTO-52
THESIS DEVELOPMENT 59
OPTIMIZING THE WORK ENVIRONMENT USING LEAN AND CONTINUOUS IMPROVEMENT TOOLS-PRINTING FLOOR MANIVANNAN SAMPATH
314 Production line D
The Production line D has 3 heidelberg minivera machines cutting machines striching
machines finishing machines as well as laminating machines at the other half of the
production floor
Three heidelberg minerva machines are used for the purpose of cutting and ceasing with
maximum format of 360x260 mm to a minimum format of 80x50 mm operating at a
speed of 3000 sphFigure 49 shows the 3 heideberg minerva cut and cease machines at
the printing floor
Figure 49 Heidelberg Minerva
The cutting machines each are with specific specification but all does the same work of
cutting required printing sheets for productioncutting works required by the printed
products
Table 2 Shows the specifications of three cutting machines present at the floor
Table 2 cutting machine specification
Model Maximum
format
Minimum
format
Polar-76 760x760 mm 30x760 mm
Polar 78 780x780mm 30x780mm
Polar-92 920x920mm 30x920mm
Figure 50 shows the picture of polar 92 cutting machine
THESIS DEVELOPMENT 60
OPTIMIZING THE WORK ENVIRONMENT USING LEAN AND CONTINUOUS IMPROVEMENT TOOLS-PRINTING FLOOR MANIVANNAN SAMPATH
Figure 50 Cutting machine polar 92
There are two finishing machines at the floor they heidelberg STAHL Ti-52 and Double
600i
Heidelberg STAHL Ti-52 performs actions such as creasing perforating and cutting jobs
in the folder It increases fold quality and allows for a multi-up processing having
processing speed of 200 mminute and 10 mminute as maximum and minimum speed
respectively This machine is used for creating magazines which includes all the above
mentioned actions
Figure 51 shows the image of heidelberg STAHL Ti-52 finishing machine
Figure 51 Heidelberg STAHL Ti-52
The double 600i finishing maching with maximum format of 660x330 mm to a minimum
of 120x180mm performing at a speed of 3750 sph performs the same actions as of
heidelberg STAHL Ti
Figure 52 shows the image of double 600i finishing machine at the printing floor
THESIS DEVELOPMENT 61
OPTIMIZING THE WORK ENVIRONMENT USING LEAN AND CONTINUOUS IMPROVEMENT TOOLS-PRINTING FLOOR MANIVANNAN SAMPATH
Figure 52 Double 600i
32 Problem characterization
The problems in the company were segmented as follows -
1 Missing of machine tools in the printing floor creating a tool room The issue is
when a specific tool is taken for a machining purpose the tool is left somewhere
unnoticed after its use causing difficulties (waste of time) when the same tool is
needed by another worker on the floor no enlistments of the tools neither
proper maintenance of the tool room nor tool chart
Figure 53 shows the tool room used left with residues and the tool board being empty
Figure 53 Pegboard with the missing tools
2 Improper usage of the inkrsquos in the paint room the issue found to be is that inks
are prepared and stored in tins these ink tins are labeled in markers and left
THESIS DEVELOPMENT 62
OPTIMIZING THE WORK ENVIRONMENT USING LEAN AND CONTINUOUS IMPROVEMENT TOOLS-PRINTING FLOOR MANIVANNAN SAMPATH
open once after their use These ink tins do not have any organized setup such
that the tins of different Pantone numbers get mixed up resulting in the
unnoticed behavior of the operator lead to drying of paints and ending as
waste
3 The company has printing machines using printing plates of four varied sizes 400
x 510 mm 450 x 628 mm 605 x 745 mm 615 x 724 mm The printing plates
which are made for the printing works are used and they are kept organized on
the floor according to their client once after the job is completed This has been
followed for a long time and ended up in stacking up vast volumes of printing
plates together which resulted in consuming a lot of time while retrieving those
when there is a reorder of a job made by the client The time taken for a worker
to retrieve a plate for a specific job was found to be 15-30 mins and up to 60
mins at times When a specific printing plate was not to be found set of printing
plates for the concerned job is made and provided to workers resulting in added
wastage of the production time
Figure 54 shows the image of plates arranged on the floor according to their clients
Figure 54 Printing plates arranged on the floor according to their clients
33 Objective
The aim of this thesis is to improve the conditions of the above-stated problems at
Marsil with the help of lean tools and continuous improvement tools by
bull Creating a tool room for the machinery works to take place and to create a tool
chart for organizing tools
bull Creating a system for organizing the ink tins in the paint room
THESIS DEVELOPMENT 63
OPTIMIZING THE WORK ENVIRONMENT USING LEAN AND CONTINUOUS IMPROVEMENT TOOLS-PRINTING FLOOR MANIVANNAN SAMPATH
bull Implementing a system for the printing plates to be organized and quick retrieval
of the plates from the system for the printing jobs
34 Brainstorming
Brainstorming is a process of generating ideas and solutions through fast thinking and
group discussion In this section brainstorming is made on the problems said by the
management and possible solutions and ideas were reached
341 Objective A
Brainstorming sessions were made on the creating a tool room consisting of a tool-chart
The problem seen was the tool room stuffed with many printed goods machines and
with residues of works performed in the room
Figure 55 shows various causes that led to the missing of tools on the production floor
as well as unmanaged tool room
Figure 55 Cause and Effect diagram on missing tools and unmanaged paint room
Researches were done on the process of creating a system that keeps tracks on the
usage of tools and controlling the flow of resources from the pegboard Kanban pull
system is studied where the goal of such a system is to replace what has been consumed
at that time when resources are needed or asked Here in this system color cards
(Kanban cards) of different colors will be used to show the availability of the resource in
the clipboard Layout of the working floor made by showing the production lines and the
working areas as blocks in different colors The color of each production line shows the
color card or the Kanban card assigned to it
THESIS DEVELOPMENT 64
OPTIMIZING THE WORK ENVIRONMENT USING LEAN AND CONTINUOUS IMPROVEMENT TOOLS-PRINTING FLOOR MANIVANNAN SAMPATH
In preparing setting up the system the documentation of the work which includes the
checklists of the available tools and machinery should be made and checked the working
of the system is then explained to all the operators in the printing floor and the system
should be studied regularly
342 Objective B
The issue said to be the lack in the organization of ink tins in the paint room Inks are
prepared according to the production needs ie when the job sheet reaches the
respective production unit on the printing floor press operator decides to make the
required ink for the production use for that specific job The ink is prepared with the
help of the Pantone matching system which shows the required quantity of colors to be
mixed in creating that ink which is then stored in tins
After the production process in preparing the prints of a job is completed tin consisting
the remaining quantity of ink is labeled with Pantone number by markers as indicators
and are stored in the paint room These paint tins are left unnoticed due lack of proper
arrangement which is left to dry and is not used again to solve this issue discussions
were made and an idea was proposed in arranging the ink tins according to Pantone
series
Figure 56 shows the various causes their part leads to unorganized ink tins and drying
of paints
Figure 56 Cause and effect diagram on unorganized ink tins
Discussions were made and ideas were explored on areas of warehouse codification
and arranging the ink tins in a better way for easy accessibility and labeling of the ink
tins
THESIS DEVELOPMENT 65
OPTIMIZING THE WORK ENVIRONMENT USING LEAN AND CONTINUOUS IMPROVEMENT TOOLS-PRINTING FLOOR MANIVANNAN SAMPATH
343 Objective C
The problems told by the management before working on the printing plates were the
operators spend much longer time in searching for the printing plates when there is a
job that needs printing plates produced before as because many clientrsquos requests
reorder and they do not have a system for organizing the printing plates
The first scenario was printing plates kept on the floor according to the clients with
support to the wall Since the company provide service to many clients there exist many
printing plates associated to many job numbers The workers receive the order sheet
have the order made by the client which consists of the order number size of the plate
number of plates to be used for the specific job and a preview copy of the same job that
was done long before The order sheet also includes the work of the previous jobs
carried on the same work with few variations So this ensures that there are many job
sheets of different order numbers of the same work The management also told that if
there are changes in a job that has been done before the plate manufacturer prepares
the new plates for job updates the order sheet of the job This order sheet and the plate
along with plates is received by the operator and the job is carried out The plates are
arranged along with other plates that were made for the same client The operators in
the printing floor said that it might take them 30-45 mins or even more when they are
trying to retrieve plates for reorders
Figure 57 shows the cause and effect diagram on setup made by the organization
Figure 57 Cause and effect diagram on printing plate setup made by management
THESIS DEVELOPMENT 66
OPTIMIZING THE WORK ENVIRONMENT USING LEAN AND CONTINUOUS IMPROVEMENT TOOLS-PRINTING FLOOR MANIVANNAN SAMPATH
Discussions made with operators and the management about a system for the
organization and retrieving the plates in a short span of time Researches made onto
check types of storing systems available in the market for organizing the plates Results
were found with systems capable of hanging the plates to it with the help of hooks with
covers for the plates and found to be expensive Hence disagreed by the management
In minimize the usage of production time in searching for the printing plates for an
order the organization suggested arranging the printed plates inside the cardboard
boxes(boxes of the printing plates when bought newly) The method proposed to be
simple that involves arranging the plates inside the boxes and specifying a number on
the boxes that will be written in the order sheet that the operators receive The capacity
of each box found to be 60 and arranging 60 plates in those will be seeming to be
congested and will be difficult for the operators in retrieving the necessary plates
needed for a job and will consume a lot of space and requires work to be done while
arranging them in boxes
The printing plates have information such as the companyrsquos name model number job
number sheet number date of manufacturing the plates So all these need to be
considered while designing the system for the organization of the printing plates
The company had resources in implementing three racks with the length of 240 cm The
idea was to divide the rack of length 240 cm into 54 slots with separators between each
slot The thickness of the separators is 04 cm and the width of each slot is 4cm a rough
estimation of 35-40 plates each of 450 x 628 mm shall be placed into those slots and a
total of 2160 plates can organize into these 54 slots divided from 240 cm length rack
Identification of the plates can be made by code which has a combination of an alphabet
and number The codification will be made by assigning an alphabet to each row and a
number to each slot Here the alphabets A B C assigned to the three racks and the
numbers from 1- 54 assigned to the slots Hence the plates can be arranged into the
slots which give the slot locations as A1 A2 A3 119860119899etc
Figure 58 below-mentioned flowchart shows the flow of work from receiving the order
manufacturing the printing plates operators receiving the plates for production
management decision on saving the plates or throwing them away as thrash
THESIS DEVELOPMENT 67
OPTIMIZING THE WORK ENVIRONMENT USING LEAN AND CONTINUOUS IMPROVEMENT TOOLS-PRINTING FLOOR MANIVANNAN SAMPATH
THESIS DEVELOPMENT 68
OPTIMIZING THE WORK ENVIRONMENT USING LEAN AND CONTINUOUS IMPROVEMENT TOOLS-PRINTING FLOOR MANIVANNAN SAMPATH
Figure 58 Flow chart
THESIS DEVELOPMENT 69
OPTIMIZING THE WORK ENVIRONMENT USING LEAN AND CONTINUOUS IMPROVEMENT TOOLS-PRINTING FLOOR MANIVANNAN SAMPATH
35 SWOT analysis of possible solutions
In this section SWOT analysis is made on the ideas proposed for the aim to understand
the strength weakness opportunities and threats involved in implementing the ideas
351 Objective A SWOT analysis
The SWOT analysis made on the idea to be implemented in creating a tool chart
distribution of tools to all the units at the printing floor and in the maintenance of the
tool room
Figure 59 shows the SWOT analysis of Strength weakness opportunity and threats
involved in implementing the tool 5s and in creating the tool chart
Figure 59 SWOT analysis on objective A
352 Objective B SWOT analysis
The SWOT analysis performed on organizing the ink tins on shelves shows various
strengths weakness opportunities threats gathered giving enough support in
implementing the system
Figure 60 shows the strength weakness opportunity and threat involved in creating a
system for organized ink tins
THESIS DEVELOPMENT 70
OPTIMIZING THE WORK ENVIRONMENT USING LEAN AND CONTINUOUS IMPROVEMENT TOOLS-PRINTING FLOOR MANIVANNAN SAMPATH
Figure 60 SWOT on objective B
353 Objective C SWOT analysis
The SWOT analysis structured on the idea of creating a system in organizing the printing
plates into it The positive effects in using the continuous improvement tool in
implementing the system and gathering of data about the plates and configuring them
in working together to work efficiently
Figure 61 shows the Strength weakness opportunity and threats involved in creating
two systems for organizing the plates
THESIS DEVELOPMENT 71
OPTIMIZING THE WORK ENVIRONMENT USING LEAN AND CONTINUOUS IMPROVEMENT TOOLS-PRINTING FLOOR MANIVANNAN SAMPATH
Figure 61 SWOT on objective C
36 Implementation
This section shows the practice of the continuous improvement and other lean tools on
each of the objectives and their procedures in implementing the steps and achieving the
results
361 Implementation of 5S
Implementation steps
1 The tool room was initially seen filled with printed goods and with other finished
materials These printed materials were considered waste by the company since
they were outdated and did not add any value Hence they were cleared from
the tool room
2 Tools except machinery tools (tools that came along with the machine) were
collected from every production line and an inventory list of the available tools
in the printing floor was made Tools that were needed or requested by any
operator were bought so the missing tools were covered
Figure 62 shows the image of tools collected as being a step in implementing 5s
THESIS DEVELOPMENT 72
OPTIMIZING THE WORK ENVIRONMENT USING LEAN AND CONTINUOUS IMPROVEMENT TOOLS-PRINTING FLOOR MANIVANNAN SAMPATH
Figure 62 Collected tools
3 Tools are left to hang on the pegboard with the help of hooks Organization of the
tools were done according to increase in the order of their sizes for each category
of tools and were arranged in such a way that the entire pegboard is filled with
the available tools
4 The entire tool room was cleaned and for the distribution of tools to the
machines at the printing floor Kanban system was studied and the use of
Kanban cards to effectively implement the pull system
5 The entire layout of the printing floor with production lines was designed During
this process production lines in the floor have been segmented and were
assigned to a specific color in the layout design The Kanban cards of colors Red
green yellow orange dark blue brown and purple were made These Kanban
cards represents the segmented production units designed in the layout
Figure 63 kanban cards of different colors created to replace the tool spot in absence of
tools from the peg board
Figure 63 Kanban cards
THESIS DEVELOPMENT 73
OPTIMIZING THE WORK ENVIRONMENT USING LEAN AND CONTINUOUS IMPROVEMENT TOOLS-PRINTING FLOOR MANIVANNAN SAMPATH
Figure 64 shows the simple layout of the printing floor with the position of production
units defined in colors to show the Kanban cards assigned to those units
Figure 64 Simple floor layout is highlighting the production units in colors
6 The designed printing floor layout along with the Kanban cards left to hang
alongside with the pegboard to visually help the operator to understand the
system
Working of the system
The system works with the help of the color cards
bull When an operator needs a tool for a specific work to be performed the operator
should check the layout designed which shows the production line and the
associated color
bull The next step is pick up a color card of the production line and place it in the place
where the tools are rested in the pegboard Placing the color card in the tool place
shows that the tool is in use
bull The tool that is taken for performing work is returned by dropping down the color
card from the pegboard and replacing it with the tool that is taken
Standardized procedures have been written on the working of the system usage of the
5s method and were explained to the workers using the Kanban card system
implemented This also includes the documentation work on the inventory list of all the
available tools on the clipboards and their quantities This stage of 5s educates everyone
on the printing floor about the implemented method and to increase awareness about
the maintenance of the tool room and about the usage of the tools
THESIS DEVELOPMENT 74
OPTIMIZING THE WORK ENVIRONMENT USING LEAN AND CONTINUOUS IMPROVEMENT TOOLS-PRINTING FLOOR MANIVANNAN SAMPATH
Figure 65 shows the inventory list taken while performing the tool 5s
Figure 65 inventory list of tools
7 Once after implementation and explaining the working of system to all operators
the tool room was inspected for a period During this period the entire system
was evaluated by using a checklist of available tools and tools on the pegboard
It was also seen that the tool room is cleaned regularly and the usage of the cards
by operators while selecting a tool and returning it was followed
Figure 66 and Figure 67 shows the images of the tool room before and after
implementation of the 5s tool
THESIS DEVELOPMENT 75
OPTIMIZING THE WORK ENVIRONMENT USING LEAN AND CONTINUOUS IMPROVEMENT TOOLS-PRINTING FLOOR MANIVANNAN SAMPATH
Figure 66 Toolroom before implementation
Figure 67 Toolroom after implementation
362 Implementation of 5S in paint room
Implementation steps
1 Initially ink tins were checked to confirm that the inks are in good condition or
whether they have dried By doing so the tins with proper ink separated from
the bad ones and were gathered in a separate place in the paint room
2 Space is created after moving the tins and resources for building the racks in the
paint room were bought by the management 2 columns each with 5 racks
constructed with the help of nuts and bolts 3 Labels for showing information such as the Pantone number and for showing the
odd and even sides of the rack were designed and printed Each column has five
racks where the left side of the first rack label mentioned as ldquoseries starting with
1 -ending with an odd numberrdquo and on the right side of the rack ldquoseries starting
with 1 and ending with the even numberrdquo were struck Similarly for Pantone
THESIS DEVELOPMENT 76
OPTIMIZING THE WORK ENVIRONMENT USING LEAN AND CONTINUOUS IMPROVEMENT TOOLS-PRINTING FLOOR MANIVANNAN SAMPATH
series 2 till Pantone series 10 labels are struck on both sides of the rack showing
the odd and even sides of the series
Figure 68 shows label struck on shelf as indicators for organizing the ink tins
Figure 68 Labels as indicators
4 After indicators were struck on the racks labels for showing Pantone number
were struck on the ink tins and the Pantone number is written on them The
Pantone number is written to show the ink associated with it and ink tins were
organized according to indicators on the racks For example consider a ink tin
labeled with Pantone number 8442 which starts with series 8 and ends with an
even number so this ink tin should be placed on the side of the rack labeled
ldquoseries starting with 1 and ending with the even numberrdquo The process was
carried out for all tins and were organized on the racks
Figure 69 shows the label designed for ink tins
Figure 69 Lable for ink tins
5 Later the room was cleaned and method of organizing ink tins on the racks were
explained to the press operators Procedures on how to use the racks were
THESIS DEVELOPMENT 77
OPTIMIZING THE WORK ENVIRONMENT USING LEAN AND CONTINUOUS IMPROVEMENT TOOLS-PRINTING FLOOR MANIVANNAN SAMPATH
documented and displayed next to the racks for operators understanding
purposes and as part of work ethics
Figure 70 shows ink tins organized in shelves with labels as indicators according to the
Pantone numbers
Figure 70 Ink tins arranged on shelves after implementation
363 Implementation of PDCA
The implementation of printing plate system is gone ahead with the help of PDCA (plan
do check act) cycle
The plates arranged on the floor includes plates manufactured from the year 2005till
present The management also said that there are plates outdated due to changes made
from the client side The plates used for the production process are picked by operators
by searching in the place where the plates according to clients are placed This time for
retrieval of the plates for the production reported being high so performance sheets
were given to the operators for recording the time
Table 3 Shows time taken by operators in retrieving the plates for various jobs before
implementation
THESIS DEVELOPMENT 78
OPTIMIZING THE WORK ENVIRONMENT USING LEAN AND CONTINUOUS IMPROVEMENT TOOLS-PRINTING FLOOR MANIVANNAN SAMPATH
Table 3 Time taken before implementation
SL No Job Number Time-Taken
1 173815 10 mins
2 173780 15 mins
3 173791 15 mins
4 180085 10 mins
5 171060 10 mins
6 174604 30 mins
7 174546 15 mins
8 180018 40 mins
9 174117 15 mins
10 174085 15 mins
Jobs are carried out after wasting the production time in searching for plates and the
average time in searching the plates for these ten jobs is 17 min and 5 seconds
Implementation steps
1 By obtaining a list of companies that have made changes the separation process
will begin The changes include updated logo of the clients updated capitais
sociais most of the clients were private banks having new capitais sociais
number The separation process started by looking at the information on each
plate and the preview sheet attached to it Around 1000 plates considered waste
during the process of separation
THESIS DEVELOPMENT 79
OPTIMIZING THE WORK ENVIRONMENT USING LEAN AND CONTINUOUS IMPROVEMENT TOOLS-PRINTING FLOOR MANIVANNAN SAMPATH
Figure 71 shows the image of plates segregated while taking inventory and arranged on
pallets
Figure 71 Separation of plates in pallets
Figure 72 shows the image consisting data about capitais socials of various clients
Figure 72 Information regarding captais socials
2 The printing plates with information regarding client job number model number
and date of manufacturing of the plates etc used in creating a list of inventories
of all the plates in Microsoft Excel
THESIS DEVELOPMENT 80
OPTIMIZING THE WORK ENVIRONMENT USING LEAN AND CONTINUOUS IMPROVEMENT TOOLS-PRINTING FLOOR MANIVANNAN SAMPATH
Figure 73 shows information about the plate used in creating the inventory list of all the
plates
Figure 73 Information about the plate
3 The company had resources where three racks each of 240 cm in length stacked
one upon the other for the plates sizing 450 x 628 mm and another three racks
of the same length for the plates sizing 605 x 745 mm were installed
respectively The design of the system was discussed with a local carpenter and
the dimensions recorded for the creation of a prototype
Figure 74 shows the image of the prototype being created by placing the separators in
between the slots for plates to be stored
Figure 74 Image taken during the creation of the prototype
THESIS DEVELOPMENT 81
OPTIMIZING THE WORK ENVIRONMENT USING LEAN AND CONTINUOUS IMPROVEMENT TOOLS-PRINTING FLOOR MANIVANNAN SAMPATH
4 The prototype of length 240 cm consisting of 27 slots each of 4 cm in width with
separators in between the slots was designed and installed The prototype was
inspected by placing 35-40 plates of few job numbers on single slot and
operators on the working floor were asked to pick a specific job from the plates
that were kept in the slot The operators were able to pick the specific job plates
in the noticeably time span of 2 mins finally the entire system was made and
installed for 450 x 628 mm and 605x745 mm size plates
5 Plates belonging to a set of job numbers were placed into the slots and their
position in the system is mentioned in the inventory list The position of the
plates will be decided by an alphabet that stands for each row and the numbers
for each slot Considering a random job number 180176 say has 6 plates and they
are kept in the 15th slot of row A so the position of the plates of that specific job
number will be A15 Similarly all plates were arranged into the system and their
positions are updated in the inventory list
Figure 75 shows the information about the plates organized in the system and their
positions mentioned as slot numbers
Figure 75 Inventory list of the plates
6 Apart from the plates that were organized into a system there are plates that will
be manufactured for new jobs or any changes to the previous job will be
regarded as new plates Here the new plates will replace the plates of the
previous job and the job number is updated in the inventory list
7 The system will become full by adding new plates and this makes the system to
be congested and difficult for operators to handle to avoid this situation some
plates must be removed from the system
Figure 76 shows the image of plates into the system with lables for identifying the plates
at the respective slots
THESIS DEVELOPMENT 82
OPTIMIZING THE WORK ENVIRONMENT USING LEAN AND CONTINUOUS IMPROVEMENT TOOLS-PRINTING FLOOR MANIVANNAN SAMPATH
Figure 76 image of plates organizeed with labels
8 Removal of plates from the system needs either the plate should be outdated or
changes in any job made from the clientrsquos side or when there is a complete
change in for a new season from the client
9 The system was full after organizing the plates and space for arranging new plates
is gathered by removing old plates which are manufactured in 2010 2011
20122013 400 plates were removed giving space for new printing plates to rest
in the system
10 The system was set completely and evaluating sheets were given to the
operators of the production lines to make a note of the timing spent on retrieving
the plates from the system
Error Reference source not found shows the time taken by the operators in retrieving
the plates for the jobs to be done It also says that the time taken by operators has been
reduced and the average time is taken in searching for the plates of the jobs found
reduced to 2 minutes and 3 secs
THESIS DEVELOPMENT 83
OPTIMIZING THE WORK ENVIRONMENT USING LEAN AND CONTINUOUS IMPROVEMENT TOOLS-PRINTING FLOOR MANIVANNAN SAMPATH
Table 4 Time observation after implementation
SL No Job Number Time Taken
1 153517 2 mins
2 174172 3 mins
3 163923 2 mins
4 180634 2 mins
5 170890 2 mins
6 181293 3 mins
7 162477 2 mins
8 173660 2 mins
9 173373 2 mins
10 162185 3mins
ChartGraph 1 shows the comparison of the time-taken in retrieving the plates during
before implementation and after implementation of the system
ChartGraph 1 Comparison of time on before and after implementation
0 5 10 15 20 25 30 35 40 45
1
2
3
4
5
6
7
8
9
10
Time
Job
after implementation before implementation
THESIS DEVELOPMENT 84
OPTIMIZING THE WORK ENVIRONMENT USING LEAN AND CONTINUOUS IMPROVEMENT TOOLS-PRINTING FLOOR MANIVANNAN SAMPATH
Figure 77 shows the image of plates organized on floor before implementation of the
system for storing plates
Figure 77 Before implementation
Figure 78 shows the image of plates organized into the systems created with labels as
indicators for slots and racks
Figure 78 After implementation
11 Systems of organizing plates for the plates sizing 459x525 mm and 605x745 mm
having a capacity of 6800 and 4000 were setup respectively
12 The system is reviewed often such that it does not overflow and causing the
workers to adapt to the earlier situation of arranging the plates on the floor
Inspections are made to check whether there are old plates
The cost of material used in making the system is 300euro
Labour cost in creating the system according to the specifications is 1700euro
Total cost in creating systems for 2 different sizes is 2000 euro
THESIS DEVELOPMENT 85
OPTIMIZING THE WORK ENVIRONMENT USING LEAN AND CONTINUOUS IMPROVEMENT TOOLS-PRINTING FLOOR MANIVANNAN SAMPATH
It is the responsibility of the management to be updated in the orders of the clients at
each season and to follow the cycle to keep the system working
SMED Practice
The Single Minute Exchange of die (SMED) tool is performed when the setup process
for the jobs seem to consume a lot of production timeAt the end of each production
the products produced unloaded to a pallet and the operator continues for the next
setup process of productionOperator looking at the job sheet searches for required
printing plates or the operator will receive the plates in case if the job is new
Activities carried out before the setup operation are mentioned below-
bull The setup process includes cleaningchanging of plates
bull Changing ink at the printing bodies of the printing machine
bull filling up the paper tray at the feeding unit of the printing machine
bull cleaning of impression cylinder(rubber) in each printing body
bull changing the ink absorbing cloth at each head for every 24 jobs
Implementation steps
1 The tool was performed on speedmaster 52-4 speedmaster 74-5 and the
speedmaster 52-2 and data about the setup times for different jobs are
gathered
Table 5 shows the performed actions during the setup phase and their time averages
THESIS DEVELOPMENT 86
OPTIMIZING THE WORK ENVIRONMENT USING LEAN AND CONTINUOUS IMPROVEMENT TOOLS-PRINTING FLOOR MANIVANNAN SAMPATH
Table 5 Average time of actions performed on three machines
Sl no Actions performed SM 52-2 SM 52-4 SM 74-5
1 Cleaning of machine 33125 31175 3828333
2 Searching the plate 09675 2513333 12
3 Cleaning of plates 1795 3505 3263333
4 Removing plate of
the earlier job 16425 15825 153
5 Introducing ink 14325 2413333 2883333
6 Introducing plate and
input 17575 29775 4976667
7 Setting up paper 5415 82425 1145
8 Average setup time 163225 2312 2669
2 The actions performed during the calculation of setup times were almost similar
in all the three machines The average setup time calculated and found to be
1632 2312 2669 for SM 52-2 SM 52-4 SM 74-5 machines respectively
3 The time is taken for the actions performed compared with all the three
machines and grouped as internal and external actions ie The movement of
the operation involving the work done during the setup process recorded as stop
events occurring at the printing machines on event log sheets in minutes with
the help of stopwatch
Table 6 shows the actions performed by the operators during the setup process
segmented into internal and external actions
Table 6 Performed actions categorized into internal and external
Internal actions External actions
Changing of plates Few prints were taken after setup
Changingintroducing ink Production after setup
Cleaning of printing plates Evaluation
Searching for needed printing sheets
Searching for pallets for transferring
finished products
THESIS DEVELOPMENT 87
OPTIMIZING THE WORK ENVIRONMENT USING LEAN AND CONTINUOUS IMPROVEMENT TOOLS-PRINTING FLOOR MANIVANNAN SAMPATH
4 The next step is the conversion of possible internal elements into external
elements ie actions performed during off state of the machine performed
when the machine is running
5 The total time spent on performing the internal actions is higher than the time
spent on the external actions Here the possible internal actions that can be
performed during machine operation are searching searching for needed
printing sheets An average of 5415 8241145 minutes spent in printing
machines SM 52-2 SM 52-4 SM 74-5 respectivelyin searching for new printing
sheets and to get printed samples
6 The average time spent on searching for the plates for the jobs is 251 in case of
SM 54-5 and being less in the other two machines is because of new jobs In the
case of new jobs plates are produced and handed over to the printing operators
in prior
7 The time on searching for new printing sheets and as well as cutting can be solved
by having the right material flow to all the printing machines in the printing floor
In explaining the scenario places next to the printing machines of SM 52-2 and SM 52-4
are occupied by printed stock materials
Figure 79 shows the picture of finished goods to be used for production stored at the
production floor
Figure 79 shows the space occupied by printed goods right near the printing machines
Goods are mostly printed materials of invite cards designation cards documented
forms of many clients stored on pallets The space occupied by these goods can be used
for storing the printing sheets needed by the printing machines The printed materials
for production use can be stored at the huge shelves made for organizing the printing
materials like coated papers and papers of different GSMs These shelves must be
categorized labelled and organize printing papers according to their availability during
production process
Figure 80 shows the image of shelves for storing purposes near the loading area at the
printing floor
THESIS DEVELOPMENT 88
OPTIMIZING THE WORK ENVIRONMENT USING LEAN AND CONTINUOUS IMPROVEMENT TOOLS-PRINTING FLOOR MANIVANNAN SAMPATH
Figure 80 Shelves for storing purposes
The proposal is by hiring a worker performing the internal activities like searching of the
plate cleaning of plates searching for needed papers ink for production from the paint
room and every other possible helps that an machine operator requires
In the total production time of 10 hrsday 2 hrs is spent on internal activities by the
operators
In justifying the above-mentioned proposal in hiring an employee
Total production time wasted on the printing floorday = 120 mins
Production cost hr on Speedmaster 522=30 euro
Production cost hr on Speedmaster 524 = 30 euro
Production cost hr on Speedmaster 745 = 60 euro
The operators from SM 522 and SM 524 together and SM 74-5 consume 1 hour each
respectively in doing all the internal operation for a day
Total production loss day =120 euro
Total production loss month =12020=2400 euro
The minimum wage of an employee in Portugal =67667 euro
Total savings by hiring an employee for a month=2400-67667=172333euro
So by hiring an employee for all the printing machines time spent in searching of the
plate cleaning of plates cutting required papers ink for production from the paint
room moving finished products to loading area can be conserved thereby increasing
productivity in the company
89
ltTIacuteTULO DA TESEgt ltNOME DO AUTORgt
CONCLUSIONS
51 CONCLUSIONS
52 PROPOSALS OF FUTURE WORKS
CONCLUSIONS 91
OPTIMIZING THE WORK ENVIRONMENT USING LEAN AND CONTINUOUS IMPROVEMENT TOOLS-PRINTING FLOOR MANIVANNAN SAMPATH
CONCLUSIONS AND PROPOSALS OF FUTURE WORKS
51 CONCLUSIONS
The study of lean tools and continuous improvement tools at the literature part of this
thesis proves to be significant support in terms of knowledge about understanding
waste and its different forms in the organization The terms regarded as waste as
discussed in section 2324 The problems faced by the company at each scenario
proven to contribute a considerable amount of time wastage in the setup process of the
production
The use of Ishikawa(fishbone diagram) a quality tool in addressing the root causes of the
issues was proven useful and helped in providing a guideway in solving those causes
see section 341342343 The benefits observed in using Ishikawa were Understood
and issues ewere analysed Identify the root cause of the issue Provide ways to improve
the process related to the issue In-depth in discussion of issue Helps in prioritizing the
analysis made and choosing corrective actions The corrective actions are analyzed by
categorizing them according to strengths- results that can be achieved using the
corrective actions weakness- possible scenario where it can go wrong opportunity to
introduce something new that can improve the operation and threats involving the
possible events where the actions reaches bottleneck and required inspections to be
followed periodically This helped in studying the system implemented in complete and
futher update in working of the system Section 351352353
The implementation section 36 explains the corrective actions performed periodically
for each problem reported by the organization of the company Each implementation
process is carried out following the steps involved in the tool adopted The creation of
tool room and tool chart involves the use of 5s along with Kanban shows the distribution
management of the tools at the production floor and management of tool room This
created awareness about the use of tools availability of the tools returning them to the
pegboard and cleanliness of the tool room after use The arrangement of ink tins in
shelves according to the Pantone number found to be helping the operators in obtaining
the required ink tins quickly Inspections gave improving results in following the
procedure for arranging the tins by the operator when they have the need to create
another Pantone color in a separate tin The creation of systems for the arrangement of
printing plates involves the use of PDCA during implementation which helped in
planning the system with available resources the capability of the system as well as the
design of the system according to two different plate sizes Results obtained after
CONCLUSIONS 92
OPTIMIZING THE WORK ENVIRONMENT USING LEAN AND CONTINUOUS IMPROVEMENT TOOLS-PRINTING FLOOR MANIVANNAN SAMPATH
implementation found to be satisfying that the time taken for retrieving the plates from
the systems has been reduced from an average of 17 minutes to 3 minutes Minimized
space in arranging the plates records of the plates existing the system updating the
system whenever changes with clients occur are the improvements made regarding the
printing plates Finally SMED is performed in figuring out the setup activities and time
involved in performing those activities where the results of the setup times regarding
the printing plates and ink from the paint room found to have contributed in the setup
time of jobs carried at production units but there are other activities like searching for
required printing sheets for production consumes an average of 5415 8241145
minutes and seconds were recorded for the machine namely SM 52-2 SM 52-4 SM 74-
5 respectively see section 4 Proposals for solving the issue about acquiring required
printing sheets mentioned in section 52
The use of lean tools and continuous improvement tools have proven to have made
changes in terms of space occupied the time taken in performing actions effective
management of tool room tool chart and insight in solving other actions in the setup
process
52 PROPOSALS OF FUTURE WORKS
The work will be done for reducing the time needed to receive the printing sheet at each
machine This can be achieved by taking inventory of the goods present on the printing
floor and then moving them in pallets to a separate place ThePrinted goods are then
moved to the storage room created giving free space for the supply of printing sheets
for the production processon the printing floor The created space will be segmented
for allowing the required printing sheets for the job and for storing the finished products
temporarily
93
ltTIacuteTULO DA TESEgt ltNOME DO AUTORgt
REFERENCES AND OTHER
SOURCES OF INFORMATION
REFERENCES AND OTHER SOURCES OF INFORMATION 95
OPTIMIZING THE WORK ENVIRONMENT USING LEAN AND CONTINUOUS IMPROVEMENT TOOLS-PRINTING FLOOR MANIVANNAN SAMPATH
REFERENCES AND OTHER SOURCES OF INFORMATION
[1] C C Yew and E Tan The Print Industry An Overview Information Services
Division National Library Board 2005
[2] [Online] Available ttpscollegegradcomindustriesprinting
[3] weebly [Online] Available httpsinvention-of-the-printing-
pressweeblycomeconomic-impacthtml
[4] J Dittmar Information Technology and Economic Change The Impact of the
Printing Press 2010
[5] E L Eisenstein The Printing Press as an Agent of Change Communications and
Cultural Transformations in Early-Modern Europe Cambridge University
Press 1979
[6] J-F Gilmont Printing at the dawn of the sixteenth centuary in The
Reformation and the Book Ashgate Aldershot 1998
[7] Engineering 360 by IEEE Global Spec [Online] Available
httpswwwglobalspeccomlearnmorematerial_handling_packaging_equi
pmentpackaging_labelingindustrial_printing_equipment [Accessed 25
september 2018]
[8] Flexography principles and practices Foundation of Flexographic Technical
Association
[9] T Dunn Manufacturing Flexible Packaging
[10] H Walter Process of letterpress printing
httpspatentsgooglecompatentUS2268594Aen Patent US2268594A
1939
REFERENCES AND OTHER SOURCES OF INFORMATION 96
OPTIMIZING THE WORK ENVIRONMENT USING LEAN AND CONTINUOUS IMPROVEMENT TOOLS-PRINTING FLOOR MANIVANNAN SAMPATH
[11] H Kipphan Hand book of Print Media technology and production methods
Springer-Verlag
[12] H Johnson and C D Tobie Digital printing startup guide Stacy L Hiquet 2005
[13] FACT SHEET SERIES-OFFSET PRINTING Print amp Copy Bureau Roger Stevens
Building University of Leeds
[14] offset pressman [Online] Available
httpoffsetpressmanblogspotcom201109short-history-of-offset-
printinghtml
[15] GRISO Print Solutions [Online] Available httpwwwgriso-
chemiecomenservicegeschichte-offsetdruck
[16] S H H Y Y A H H S K SUBRAMANIAM Machine efficiency and man
power utilization on production lines in 8th WSEAS Int Conf on
ELECTRONICS HARDWARE WIRELESS and OPTICAL COMMUNICATIONS
[17] N SAni kumar production and operations management New Age
International Publishers
[18] L B T Abdel-Malek A framework for the economic evaluation of production
system and product design alternatives for robot assembly International
Journal of Production Research vol 23 p 197ndash208 1985
[19] M S Y Y K K I a S N Yoshimura A rapid analysis method for production
line design International Journal of Production Research vol 44 no 6
2006
[20] D B M a B W Spath Springer Handbook of Automation Springer 2009
[21] R G S G B M K T Bley H Appropriate Human Involvement in Assembly and
Disassembly CIRP Annals ndash Manufacturing Technology 2009
[22] T L A V J Kruumlger Cooperation of human and machines in assembly lines
[23] T L A V J Kruuml ger Cooperation of human and machines in assembly lines
CIRP Annals - Manufacturing Technology 2009
REFERENCES AND OTHER SOURCES OF INFORMATION 97
OPTIMIZING THE WORK ENVIRONMENT USING LEAN AND CONTINUOUS IMPROVEMENT TOOLS-PRINTING FLOOR MANIVANNAN SAMPATH
[24] N Galway unit 13 automated production lines in Production lines NUI
Galway p 33
[25] J Liker The Toyota Way 14 Management Principles from the Worldrsquos Greatest
Manufacturer New York McGraw-Hill 2004
[26] G a W J Miltenburg The u-line line balancing problem Management
Science vol 40 no 10 1994
[27] J S L W L G M Gao An efficient approach for type II robotic assembly line
balancing problems Computer and Industrial Engineering 2009
[28] G R J S B Levitin A genetic algorithm for robotic assembly line balancing
European Journal of operational Research 2006
[29] T C L C G S S L M Adalberto Sato Michels The Robotic Assembly Line
Design (RALD) problem Model and case studies with practical extensions
Computers amp Industrial Engineering 2018
[30] P j Wallin Robotics in the Food Industry An update Trends in Food Science
amp Technology 1997
[31] J a H M Bicheno The Lean toolbox Buckingham PICSIE Books 2016
[32] A Weber Lean Workstations Organized for Productivity 2005
[33] A Maslow A theory of human motivation Psychological review 1943
[34] S a G R Ghosh A comprehensive literature review and analysis of the design
balancing and scheduling of assembly systems International Journal of
Production Research vol 27 no 4 1989
[35] L T D C D K N H B Tran Minh Canh A case study in Whittier woods
furniture in 13th International Conference Việt Nam 2013
[36] W L Kilbridge M A heuristic method of assembly line balancing Journal of
Industrial Engineering vol 24 no 2 p 292 1961
[37] G Srinivasan Operations and Supply Chain Management Department of
Management Studies Indian Institute of Technology Madras Chennai
REFERENCES AND OTHER SOURCES OF INFORMATION 98
OPTIMIZING THE WORK ENVIRONMENT USING LEAN AND CONTINUOUS IMPROVEMENT TOOLS-PRINTING FLOOR MANIVANNAN SAMPATH
[38] C M Harland Supply Chain Management Relationships Chains and
Networks British Academy of Management 1996
[39] G a M Q Easton Single and Multiple Network Sourcing - Network
Implications in 6th IMP Conference Milan 1990
[40] M G Christopher Logistics and Suppry Chain Management LondonUK
Pitman Publishing 1992
[41] L M Ellram lsquoSupply Chain Management The Industrial Organisation
Perspective International Journal of Physical Distribution and Logistics
Management vol 21 no 1 pp 13-22 1991
[42] T P b G M Daniel E Ufua a Systemic Lean Intervention Enhancing Lean
with Community Operational Research European Journal of Operational
Research 2017
[43] J amp J D T Womack Lean Thinking Banish Waste and Create Wealth for Your
Corporation New York Simon and Schuster 1996
[44] T C Salonitis K Drivers and Barriers of Lean Implementation in the Greek
Manufacturing Sector Procedia CIRP 7189ndash194 2016
[45] J A F Joliveira continuous improvement through lean tools An application
in a mechanical company Manufacturing Engineering Society International
Conference 2017 MESIC 2017 28-30 June 2017
[46] M V Ramunė Čiarnienėa An Empirical Study of Lean Concept Manifestation
11th International Strategic Management Conference 2015 2015
[47] K S Y X Mudhafar Alefari The role of leadership in implementing lean
manufacturing The 50th CIRP Conference on Manufacturing Systems 2017
[48] G Howell rdquoWhat is Lean Constructionrdquo Proceeding Seventh annual
Conference of the International Group for Lean Construction 1999
[49] C Ohaegbunam AN OPERATIONS MANAGEMENT PERSPECTIVE ON WASTE
MANAGEMENT IN A FOOD PROCESSING FACTORY Tampere University of
Applied Sciences 2015
REFERENCES AND OTHER SOURCES OF INFORMATION 99
OPTIMIZING THE WORK ENVIRONMENT USING LEAN AND CONTINUOUS IMPROVEMENT TOOLS-PRINTING FLOOR MANIVANNAN SAMPATH
[50] P R T Domingo Identifying and Eliminating The Seven Wastes or Muda
Asian Institute of Management
[51] M Pieńkowski WASTE MEASUREMENT TECHNIQUES FOR LEAN COMPANIES
International journal of lean Thinking vol 5 2014
[52] T Ohno Toyota Production System Beyond Large-Scale Production diamond
Inc 1978
[53] D S M Dudek-Burlikowska The Poka-Yoke method as an improving quality
tool of operations in the process journal of Achivements in Materials and
Manufacturing Enginnering vol 36 no 1 2009
[54] K V Scyoc Process safety improvementmdashQuality and target zero Journal of
Hazardous Materials 159 (2008) 42ndash48 2008
[55] A D Shigeo Shingo ldquoZero Quality Control Source Inspection and the Poka-Yoke
Systemrdquo Productivity Press 1986
[56] D Tommelein lsquoPOKA YOKErsquo OR QUALITY BY MISTAKE PROOFING DESIGN AND
CONSTRUCTION SYSTEMS Proceedings for the 16th Annual Conference of
the International Group for Lean Construction
[57] S Shingo A study of the toyota production system japan management
association
[58] D N S Yash Dave a IMPLEMENTATION OF POKA-YOKE TECHNIQUE IN A GEAR
INDUSTRY -A CASE STUDY International Journal of Latest Research in Science
and Technology 2015
[59] M D-B H 1048800achajczyk Quality continuous improvement of company with
usage the Poka-Yoke methods PSKN 72006
[60] S S Zero Quality Control Source Inspection and the Pokandash Yoke System
Cambridge Productivity Press 1986
[61] M G Marta Kučerovaacute Eliminating waste in the production process using tools
and methods of industrial engineering 28 11 2015
REFERENCES AND OTHER SOURCES OF INFORMATION 100
OPTIMIZING THE WORK ENVIRONMENT USING LEAN AND CONTINUOUS IMPROVEMENT TOOLS-PRINTING FLOOR MANIVANNAN SAMPATH
[62] A G P Arunagiria Identification of Major Lean Production Waste in
Automobile Industries using Weighted Average Method 12th GLOBAL
CONGRESS ON MANUFACTURING AND MANAGEMENT GCMM 2014 2014
[63] G A Arunagiri P Investigation on Critical Factors Assessment of the Lean
Production Systems in Industrial Environment Elsevier Science and
Technology 2013
[64] I G-R A S-L E Andreacutes-Loacutepeza Lean Service Reassessment of Lean
Manufacturing for Service Activities The Manufacturing Engineering Society
International Conference MESIC 2015 2015
[65] S SHINGO A Revolution in ManufacturingThe SMED System Productivity
Press 1985
[66] D L M Silvia Pellegrini Study and Implementation of Single Minute Exchange
of Die (SMED) Methodology in a Setup Reduction Kaizen Proceedings of the
2012 International Conference on Industrial 2012
[67] A R RSundara A Review on Lean Manufacturing Implementation
Techniques 12th GLOBAL CONGRESS ON MANUFACTURING AND
MANAGEMENT GCMM 2014 2014
[68] F L F R CRosa SMED Methodology The reduction of setup times for steel
wire-rope assembly lines in the automotive industry Manufacturing
Engineering Society International Conference 2017 MESIC 2017 28-30 June
2017 Vigo (Pontevedra) Spain 2017
[69] P M T G Antoacutenio Carrizo Moreira Implementation of the Single Minute
Exchange of Die (SMED) Methodology in Small to Medium-sized Enterprises
A Portuguese Case Study International Journal of Management vol 30 no
1 2013
[70] T Ohno Toyota Production System Beyond Large-Scale Production New York
Productivity Press 1988
[71] M Imai Gemba Kaizen A Practical Approach to a Continuous Improvement
Strategy Kaizen Publishing House vol 2 2013
REFERENCES AND OTHER SOURCES OF INFORMATION 101
OPTIMIZING THE WORK ENVIRONMENT USING LEAN AND CONTINUOUS IMPROVEMENT TOOLS-PRINTING FLOOR MANIVANNAN SAMPATH
[72] R W Beata GALA PROBLEMS OF IMPLEMENTATION 5S PRACTICES IN AN
INDUSTRIAL COMPANY Management Systems in Production Engineering
vol 12 no 4 pp 8-14 2013
[73] wwwleanproductseu [Online]
[74] H Hirano The Complete Guide to Just-In-Time Manufacturing Waste and the
5S s Productivity press 2009
[75] D W Edwards The new economics for industry government and education
Cambridge Mass MIT Press 1993
[76] KACHANDRAKANTH PLAN DO CHECK ACT (PDCA) IMPROVING QUALITY
THROUGH AGILE ACCOUNTABILITY TEKTRONIX ENGINEERING
DEVELOPMENT INDIA PRIVATE LIMITED BANGALORE
[77] V A D Pratik M Patel Application Of Plan-Do-Check-Act Cycle For Quality And
Productivity Improvement - A Review International Journal for Research in
Applied Science amp Engineering Technology (IJRASET) vol 5 no 1 2017
[78] H Kanri The Strategic Approach to Continuous Improvement Gower
Publishing Limited 2008
[79] G a J W Moran The ABCs of PDCA 2009
[80] D SLOVIĆ D STOJANOVIĆ2 and I TOMAŠEVIĆ Productivity Upswing Through
Two-Phase Continuous Process Improvement Model The Case Of Apparel
Manufacturer Journal of Textile amp Apparel Tekstil ve Konfeksiyon vol 25
no 2 2015
[81] P S T Mr Madan M Jagtap International Journal on Recent Technologies in
Mechanical and Electrical Engineering (IJRMEE) ISSN 2349-7947 vol 2 no
4
[82] E Coimbra The Total Flow Management Model Kaizen forum 2008
[83] E Coimbra TheTotal Flow Management Model KAIZEN FORUM vol 3 pp 1-
4 2008
[84] E A Coimbra Total Flow Management Achieving Excellence with Kaizen and
Lean Supply Chains KAIZEN INSTITUTE (2012)
REFERENCES AND OTHER SOURCES OF INFORMATION 102
OPTIMIZING THE WORK ENVIRONMENT USING LEAN AND CONTINUOUS IMPROVEMENT TOOLS-PRINTING FLOOR MANIVANNAN SAMPATH
[85] S Nakajima Introduction to TPM total productive maintenance Cambridge
MA Productivity Press 1988
[86] P Muchiri and L Pintelon Performance measurement using overall
equipment effectiveness (OEE) Literature review and practical application
discussion International journal of Production Research vol 46 no 13
2008
[87] b J S a J R M-T c C J Andres Mu~noz-Villamizar a Using OEE to evaluate
the effectiveness of urban freight transportation systems A case study
International Journal of Production Economics 2018
[88] B J The new lean toolbox towards fast flexible flow PICSIEBooks Moreton
Press 2004
103
ltTIacuteTULO DA TESEgt ltNOME DO AUTORgt
ANNEXES
71 ANNEX1
ANNEXES 105
OPTIMIZING THE WORK ENVIRONMENT USING LEAN AND CONTINUOUS IMPROVEMENT TOOLS-PRINTING FLOOR MANIVANNAN SAMPATH
ANNEXES
This section consist of the supported documents involved in implementation of the tools
as well as corrective actions carried out in solving the prblems reported by the
organization
71 ANNEX1
ANNEXES 106
OPTIMIZING THE WORK ENVIRONMENT USING LEAN AND CONTINUOUS IMPROVEMENT TOOLS-PRINTING FLOOR MANIVANNAN SAMPATH
ANNEXES 107
OPTIMIZING THE WORK ENVIRONMENT USING LEAN AND CONTINUOUS IMPROVEMENT TOOLS-PRINTING FLOOR MANIVANNAN SAMPATH
ANNEXES 108
OPTIMIZING THE WORK ENVIRONMENT USING LEAN AND CONTINUOUS IMPROVEMENT TOOLS-PRINTING FLOOR MANIVANNAN SAMPATH
OPTIMIZING THE WORK ENVIRONMENT USING LEAN AND CONTINUOUS IMPROVEMENT TOOLS-PRINTING FLOOR MANIVANNAN SAMPATH
JURY
President
Sandra Cristina de Faria Ramos
Adjunct Professor ISEP
Supervisor
Raul Duarte Salgueiral Gomes Campilho
Adjunct professor ISEP
Second supervisor
Francisco Jose Gomes da Silva
Adjunct professor ISEP
Examiner
Ana Margarida Araujo Barros Fonseca
Associated Professor UFP
OPTIMIZING THE WORK ENVIRONMENT USING LEAN AND CONTINUOUS IMPROVEMENT TOOLS-PRINTING FLOOR MANIVANNAN SAMPATH
ACKNOWLEDGEMENTS
I would like to express my sincere gratitude to everyone who has contributed to the
completion of this work
Thanks to professor Raul Duarte Salgueiral Gomes Campilho for guiding in the
completion of the work company Marsil Graphic Arts Ltd Antoacutenio Andreacute da Costa
Moreira for giving me the opportunity as internship and finding help in the
implementation of works workers of Marsil
Finally I thank my friends and my family for the support and advice provided during the
completion of this Master thesis
ABSTRACT IX
OPTIMIZING THE WORK ENVIRONMENT USING LEAN AND CONTINUOUS IMPROVEMENT TOOLS-PRINTING FLOOR MANIVANNAN SAMPATH
KEYWORDS
5s PDCA SMED waste Muda lean and continuous improvement tools
ABSTRACT
The study aims at solving the problems reported by the management using lean tools
and continuous improvement tools The purpose of using a lean tool is to configure the
working process involved in production thereby reducing waste periodically The tool
also aims at improving the flow of process resulting in reducing the uneven workflow
throughout the floor The pull system from Kanban also found to improvise flow of
materials at the production floor The continuous improvement tool helps in
streamlining works related to implementing works and reducing waste In this work the
implementation of 5s has found its use in creating a tool room and tool chart along with
a pull system introduced for the tools at the pegboard The use of Kanban cards as pull
system at tool chart for the tool is to monitor the flow of tool to the production units at
the printing floor The implementation of 5s in paint room is to organize the ink tins used
for setup activity in the production process and to make the ink tins easier to find for
the operator PDCA (plan do check act) cycle one of the continuous improvement tools
implemented for organizing the printing plates into a system by creating and thereby
reducing the retrieval time of the plates by the operators SMED (single minute exchange
of die) performed on production units to find the activities involved in the setup
operations and reducing the time needed to perform the setup operations The results
of the implementations made found to be satisfying that the tool room kept periodically
and the use of Kanban cards on the tool chart for some tool being used through
inspections performed The systems implemented for organizing the printing plates
helped in retrieving the plates from the system for a setup operation seem to have
reduced from 17 minutes to 3 minutes The implementation of 5s at the paint room in
organizing the ink tins proven useful as the time needed for operators in obtaining the
ink tins and introducing it into the system a setup operation performed for production
purpose observed during SMED process
RESUMO XI
OPTIMIZING THE WORK ENVIRONMENT USING LEAN AND CONTINUOUS IMPROVEMENT TOOLS-PRINTING FLOOR MANIVANNAN SAMPATH
PALAVRAS CHAVE
5s PDCA SMED resiacuteduos Muda ferramentas de melhoria contiacutenua e enxuta
RESUMO
O objetivo do estudo eacute resolver os problemas relatados pelo gerenciamento utilizando
ferramentas enxutas e ferramentas de melhoria contiacutenua O propoacutesito de usar uma
ferramenta enxuta eacute configurar o processo de trabalho envolvido na produccedilatildeo
reduzindo assim o desperdiacutecio periodicamente A ferramenta tambeacutem visa melhorar o
fluxo do processo resultando na reduccedilatildeo do fluxo de trabalho irregular em todo o piso
O sistema de traccedilatildeo do Kanban tambeacutem descobriu improvisar o fluxo de materiais no
chatildeo de faacutebrica A ferramenta de melhoria contiacutenua ajuda na racionalizaccedilatildeo de trabalhos
relacionados agrave implementaccedilatildeo de obras e reduccedilatildeo de desperdiacutecio Neste trabalho a
implementaccedilatildeo do 5s encontrou seu uso na criaccedilatildeo de uma sala de ferramentas e um
graacutefico de ferramentas juntamente com um sistema de traccedilatildeo introduzido para as
ferramentas no pegboard O uso de cartotildees Kanban como sistema pull no quadro de
ferramentas da ferramenta eacute monitorar o fluxo da ferramenta para as unidades de
produccedilatildeo no chatildeo de impressatildeo A implementaccedilatildeo do 5s na sala de pintura eacute organizar
as latas de tingimento usadas para a atividade de configuraccedilatildeo no processo de produccedilatildeo
e tornar as latas de tingimento mais faacuteceis de encontrar para o operador O PDCA (plan
do check act) aciona uma das ferramentas de melhoria contiacutenua implementadas para
organizar as chapas de impressatildeo em um sistema criando e reduzindo o tempo de
recuperaccedilatildeo das chapas pelos operadores SMED (single minute exchange of die)
realizado nas unidades de produccedilatildeo para localizar as atividades envolvidas nas
operaccedilotildees de configuraccedilatildeo e reduzir o tempo necessaacuterio para executar as operaccedilotildees de
configuraccedilatildeo Os resultados das implementaccedilotildees realizadas demonstraram ser
satisfatoacuterios que a sala de ferramentas eacute mantida periodicamente e o uso de cartotildees
Kanban na tabela de ferramentas para alguma ferramenta sendo usada atraveacutes de
inspeccedilotildees realizadas Os sistemas implementados para organizar as chapas de
impressatildeo ajudaram a recuperar as chapas do sistema para que uma operaccedilatildeo de
configuraccedilatildeo parecesse ter reduzido de 17 minutos para 3 minutos A implementaccedilatildeo
de 5s na sala de pintura organizou as tintas de tingimento comprovadamente uacuteteis
como o tempo necessaacuterio para os operadores obterem as tintas de corante e introduzi-
las no sistema uma operaccedilatildeo de configuraccedilatildeo realizada para fins de produccedilatildeo
observada durante o processo SMED
LIST OF SYMBOLS AND ABBREVIATIONS XIII
OPTIMIZING THE WORK ENVIRONMENT USING LEAN AND CONTINUOUS IMPROVEMENT TOOLS-PRINTING FLOOR MANIVANNAN SAMPATH
LIST OF SYMBOLS AND ABBREVIATIONS
List of abbreviations
GSM Grams per Square Meter
NVAA Non-Value Added Activities
OEE Overall Equipment Effectiveness
PDCA Plan Do Check Act
SME Small Machine Enterprise
SMED Single Minute Exchange of DIE
SPH Sheets per Hour
TFM Total Flow Management
List of units
cm Centimeter
m Meter
mm Millimeter
OZ Ounces
List of symbols
euro Euro
FIGURES INDEX XV
OPTIMIZING THE WORK ENVIRONMENT USING LEAN AND CONTINUOUS IMPROVEMENT TOOLS-PRINTING FLOOR MANIVANNAN SAMPATH
FIGURES INDEX
Figure 1 Cities with printing in 1450 [4] 8
Figure 2 Cities with printing press from the 1500s to 1800s [4] 9
Figure 3 Flexography printing station [8] 11
Figure 4 Flexography printing application [8] 12
Figure 5 Letter printing station [10] 13
Figure 6 Screen printing station [11] 14
Figure 7 Gravure printing station [8] 15
Figure 8 Processing of data into printed image [12] 16
Figure 9 shows the image created using printing [12] 17
Figure 10 offset printing station [13] 18
Figure 11 Usage of offset printing for product lables [11] 19
Figure 12 Schematic Production System [17] 21
Figure 13 Manual assembly line [18] 21
Figure 14 combination of manual and automatic workstations [21] 22
Figure 15 A and B workplace sharing hybrid systems [22] 23
Figure 16 Inline Configuration of an automated production line [24] 24
Figure 17 L shaped layout [24] 24
Figure 18 U shaped production layout [24] 25
Figure 19 Rotary layout [24] 26
Figure 20 Welding process performed by platform robots [29] 27
Figure 21 Roles of robots [29] 27
Figure 22 Platform robots performing welding tasks [29] 27
Figure 23 Transporter robot on a track-motion device [29] 28
Figure 24 Hierarchy of workstation needs [33] 29
Figure 25 Represents the flow across enterprises [38] 32
Figure 26 Lean manufacturing tools and practices [44] 34
Figure 27 Function of Poke-Yoke [58] 36
FIGURES INDEX XVI
OPTIMIZING THE WORK ENVIRONMENT USING LEAN AND CONTINUOUS IMPROVEMENT TOOLS-PRINTING FLOOR MANIVANNAN SAMPATH
Figure 28 Types of waste [61] 37
Figure 29 The phases of SMED method [69] 40
Figure 30 5S method [73] 41
Figure 31 PDCA Cycle [77] 42
Figure 32 TFM model [83] 44
Figure 33 Total Flow Management Pillars [83] 44
Figure 34 OEE Timeline [87] 46
Figure 35 Offset printing SM74-5 unit at Marsil 51
Figure 36 Plate cleaning solution 52
Figure 37 Control systems of SM 74-5 52
Figure 38 Measuring devices 53
Figure 39 Products produced by SM74-5 53
Figure 40 Manual fork lifter 54
Figure 41 SM 52-2 54
Figure 42 SM 52-4 55
Figure 43 A and B control systems for Speedmaster 52-4 56
Figure 44 Goods produced at SM 52-4 56
Figure 45 Web-fed Printing unit 57
Figure 46 Products produced at the webfed unit 57
Figure 47 Heidelberg SORM-Z 58
Figure 48 Heidelberg GTO-52 58
Figure 49 Heidelberg Minerva 59
Figure 50 Cutting machine polar 92 60
Figure 51 Heidelberg STAHL Ti-52 60
Figure 52 Double 600i 61
Figure 53 Pegboard with the missing tools 61
Figure 54 Printing plates arranged on the floor according to their clients 62
Figure 55 Cause and Effect diagram on missing tools and unmanaged paint room 63
Figure 56 Cause and effect diagram on unorganized ink tins 64
Figure 57 Cause and effect diagram on printing plate setup made by management 65
FIGURES INDEX XVII
OPTIMIZING THE WORK ENVIRONMENT USING LEAN AND CONTINUOUS IMPROVEMENT TOOLS-PRINTING FLOOR MANIVANNAN SAMPATH
Figure 58 Flow chart 68
Figure 59 SWOT analysis on objective A 69
Figure 60 SWOT on objective B 70
Figure 61 SWOT on objective C 71
Figure 62 Collected tools 72
Figure 63 Kanban cards 72
Figure 64 Simple floor layout is highlighting the production units in colors 73
Figure 65 inventory list of tools 74
Figure 66 Toolroom before implementation 75
Figure 67 Toolroom after implementation 75
Figure 68 Labels as indicators 76
Figure 69 Lable for ink tins 76
Figure 70 Ink tins arranged on shelves after implementation 77
Figure 71 Separation of plates in pallets 79
Figure 72 Information regarding captais socials 79
Figure 73 Information about the plate 80
Figure 74 Image taken during the creation of the prototype 80
Figure 75 Inventory list of the plates 81
Figure 76 image of plates organizeed with labels 82
Figure 77 Before implementation 84
Figure 78 After implementation 84
Figure 79 shows the space occupied by printed goods right near the printing machines 87
Figure 80 Shelves for storing purposes 88
TABLES INDEX XIX
OPTIMIZING THE WORK ENVIRONMENT USING LEAN AND CONTINUOUS IMPROVEMENT TOOLS-PRINTING FLOOR MANIVANNAN SAMPATH
TABLES INDEX
Table 1 printing equipment features [7] 10
Table 2 cutting machine specification 59
Table 3 Time taken before implementation 78
Table 4Time observation after implementation 83
Table 5 Average time of actions performed on three machines 86
Table 6 Performed actions categorized into internal and external 86
INDEX XXI
OPTIMIZING THE WORK ENVIRONMENT USING LEAN AND CONTINUOUS IMPROVEMENT TOOLS-PRINTING FLOOR MANIVANNAN SAMPATH
INDEX
INTRODUCTION 1
11 Framework 1
12 Objectives 1
13 Methodology 1
14 Thesis structure 2
15 Host company 2
THEORETICAL BACKGROUND 7
21 The printing sector 7
211 Importance in the national and international economy 7
212 Types of printings 9
213 Printing equipment 10
214 Printing process description 11
2141 Flexography 11
2142 Letter press printing 12
2143 Screen printing 14
2144 Rotogravure 14
2145 Digital printing 15
2146 Offset lithography 17
215 Evolution of offset printing press 19
22 Production lines 20
221 Concept of production line 20
222 Types of production lines 21
2221 Manual production lines 21
2222 Semi automatic production lines 22
INDEX XXII
OPTIMIZING THE WORK ENVIRONMENT USING LEAN AND CONTINUOUS IMPROVEMENT TOOLS-PRINTING FLOOR MANIVANNAN SAMPATH
2223 Automated production lines 23
223 Management of production lines 28
2231 Workstations 28
2232 Line balancing 30
2233 Supply 31
23 Lean concepts and tools 33
231 Concept of waste 34
232 POKE-YOKE 35
233 MUDA 37
234 SMED 39
235 5S 40
24 Continuum improvement tools 42
241 PDCA 42
242 TFM 43
243 OEE 45
THESIS DEVELOPMENT 51
31 Production lines characterization 51
311 Production line A 51
312 Production line B 54
313 Production line C 58
314 Production line D 59
32 Problem characterization 61
33 Objective 62
34 Brainstorming 63
341 Objective A 63
342 Objective B 64
343 Objective C 65
INDEX XXIII
OPTIMIZING THE WORK ENVIRONMENT USING LEAN AND CONTINUOUS IMPROVEMENT TOOLS-PRINTING FLOOR MANIVANNAN SAMPATH
35 SWOT analysis of possible solutions 69
351 Objective A SWOT analysis 69
352 Objective B SWOT analysis 69
353 Objective C SWOT analysis 70
36 Implementation 71
361 Implementation of 5S 71
362 Implementation of 5S in paint room 75
363 Implementation of PDCA 77
SMED PRACTICE 85
CONCLUSIONS AND PROPOSALS OF FUTURE WORKS 91
51 CONCLUSIONS 91
52 PROPOSALS OF FUTURE WORKS 92
REFERENCES AND OTHER SOURCES OF INFORMATION 95
ANNEXES 105
71 ANNEX1 105
25
INTRODUCTION
11 Framework
12 Objectives
13 Methodology
14 Thesis structure
15 Host company
INTRODUCTION 1
OPTIMIZING THE WORK ENVIRONMENT USING LEAN AND CONTINUOUS IMPROVEMENT TOOLS-PRINTING FLOOR MANIVANNAN SAMPATH
INTRODUCTION
11 Framework
The graphic arts industry where the work is performed has production lines performing
jobs of everyday demands of the clients This includes process from creating the
products according to clientrsquos preference followed by cutting binding lamination until
the final product is met The working conditions are affected by busy long-term
production during various scenarios where the implementation of the lean tools and
continuous improvement tools are necessary to improve the working conditions
availability of resources and thereby increasing the productivity gradually
12 Objectives
The objective of this thesis is to improve the conditions at Marsil with the help of lean
tools and continuous improvement tools by
bull Creating a tool room for the machinery works to take place and to create a tool
chart for organizing tools
bull Creating a system for organizing the ink tins in the paint room
bull Implementing a system for the printing plates to be organized and quick retrieval
of the plates from the system for the printing jobs
13 Methodology
bull Study about the problem reported
bull Collection of data about the problem and proposing ideas in solving them
bull Study about the production floor and the included production units and their
works
bull Brainstorming on the problems in figuring out the possible causes and to get a
broader perspective in structuring the solutions
bull Selection of idea based on collected data available area resources
bull Implementation of an idea based on the adopted tool
bull Collection of data after implementation
bull Analyzing the data obtained
INTRODUCTION 2
OPTIMIZING THE WORK ENVIRONMENT USING LEAN AND CONTINUOUS IMPROVEMENT TOOLS-PRINTING FLOOR MANIVANNAN SAMPATH
14 Thesis structure
The thesis is structured by having it into two sections
bull The theoretical background is having the study of the printing sector the
importance of printing in the economy types of printing printing equipment
printing process with the description of each and their applications the
evolution of offset printing
Production lines include the concept of the production line types of production
lines and management of production lines
Lean tools and concept include waste concept poke-yoke method Muda single
minute exchange of ink 5s and continuous improvement tools has brief
explanation on PDCA (Plan do check act) TFM (Total flow management) OEE
(Overall Equipment Effectiveness) from various research papers journals books
and websites
bull The development section will have characteristics of the production lines
addressing the problems at the printing floor reported by the company goals
performing brainstorming actions on the problems by figuring out the elements
involved in the cause and suggesting out the actions SWOT (strengths
weakness opportunity and threats) involved in these actions Later the actions
implemented according to lean tools and continuous improvement tools
necessary
15 Host company
The company Marsil was founded in the year 1953 as a printing business licensed for the
manual cutter and a printing machine in the downtown of Porto Rua Conde de Vizela
No 76 In the early 80s after the formation of the company became the first customer
segmentation exercise and went on to emphasize to the institutional client initially
Banco Borges amp Brother followed by Banco Espiacuterito Santo The company now also has
a delegation in Lisbon initially at Av Infante Santo and later in Tower 2 of the Amoreiras
which still remains to provide the necessary personalized support to the customer
The company was awarded the prize of IAPMEI SME Excellence in 2000 and 2001 which
happened again in 2008 and 2009 with the awards SME Leader and SME Excellence
respectively
In 2006 Marsil started a new business area passing by incorporating value-added
services to the graphics product - the Bursar and Logistics Management with stock
management graphics delivering the quantity needed time limit and at the locations by
customers
INTRODUCTION 3
OPTIMIZING THE WORK ENVIRONMENT USING LEAN AND CONTINUOUS IMPROVEMENT TOOLS-PRINTING FLOOR MANIVANNAN SAMPATH
In 2008 it was inaugurated Mosteiroacute facilities with a park web presses and finishing lines
constituting the second productive hub and from 2010 onwards there is an ongoing
new customer segmentation exercise and exploration of new markets which has
allowed the Marsil increase the portfolio and even be honored with some awards and
prestigious honors in the field of Graphic Arts
Marsil currently has 1420 clients currently active and half of them made orders during
the year 2016 Noteworthy are clients like the Caixa Geral de Depoacutesitos Novo Banco
Millenium BCP SantaderTotta Banco BPI Euro big Pestana Group Hotels Hotels Minor
Tivoli Nau Hotels Group Eurostars Group Hospital da Luz among other clients in these
and other sectors such as footwear textiles etc The Marsil has forty-two employees
employed at present
5
ltTIacuteTULO DA TESEgt ltNOME DO AUTORgt
BIBLIOGRAPHIC WORK
21 The printing sector
22 Production lines
23 Lean concepts and tools
24 Continuum improvement tools
THEORETICAL BACKGROUND 7
OPTIMIZING THE WORK ENVIRONMENT USING LEAN AND CONTINUOUS IMPROVEMENT TOOLS-PRINTING FLOOR MANIVANNAN SAMPATH
THEORETICAL BACKGROUND
21 The printing sector
The printing industry covers the entire print process from creation through distribution
to other non-print services that it offers So any definition of the industry includes not
only the numerous firms that perform the actual printing but the companies that
provide binding and finishing services such as cutting trimming die to cut laminating
mounting and varnishing documents for their clients [1]
A wide range of products is produced in the printing industry In addition to magazines
books and some small newspapers other examples of printed products include direct
mail labels manuals and marketing material Less obvious printed goods include memo
pads business order forms checks maps T-shirts and packaging The industry also
includes establishments that give quick printing of documents for the consumer or
support services such as prepress embossing binding finishing and mailing [2]
211 Importance in the national and international economy
The printing press had enormous effects on the economy The printing press was an
invention that led to the flourishment of trade throughout all of Europe due to increased
demands This was a cause for a stronger economy Also a more natural way to print
books led to more affordable books this meant that now not only could the elite and
wealthy afford books but so could the poor More durable and well-made books grew
the market for books and strengthened the economy Newspaper on the other hand
were more everyday items created by the printing press which caused a massive burst
in demand for newspapers Frequent changing of prices downward made more
affordable books Books carried information for people to learn and create more jobs
Stores could now sell and buy books more rapidly The demand for books and
newspapers also led to more inventions for printing to grow the economy Lastly
printing became a massive industry and led to different companies to move into large
noisy factories meaning many for jobs to hire more books to make and more books to
sell [3]
Historians and studies suggest the printing press was one of the most revolutionary
inventions in human history as well the printing press eased these intellectual
developments the process of sharing and recombining ideas that economists have tied
to technological progress and the development of economic activities in which literacy
THEORETICAL BACKGROUND 8
OPTIMIZING THE WORK ENVIRONMENT USING LEAN AND CONTINUOUS IMPROVEMENT TOOLS-PRINTING FLOOR MANIVANNAN SAMPATH
numeracy and other intellectual skills were valuable Indeed there is an argument to
be made that (via its pervasive and fundamental impact on a wide range of economic
activities) printing technology may qualify as a general-purpose technology [4]
Printing cities enjoy helps due to agglomeration economies The printing press produced
new face-to-face interactions in addition to books and pamphlets Printers workshops
brought scholars merchants craftsmen and mechanics together for the first time in a
commercial environment eroding a pre-existing ldquotown and gown divide Bookshops
and the houses of printers became meeting places and temporary residences for
intellectuals Print technology also produced printing-scholars Adapt to handling
machines and marketing products finding learned societies promoting artists and
authors advancing new forms of data collection [5]
Cities with printing presses derived benefits from the technology that others did not
The costs of information and human capital accumulation were significantly lower in
cities with printing presses In part these advantages were due to transport costs Print
media is costly to transport because it is vast and a fragile commodity sensitive to damp
[6]
[4]Jeremiah Dittmar in comparing cities where printers set up presses to similar cities
where they did not conclude that ldquoprint technologies had very substantial effects in
European economic history through their impact on cities ldquoSome have concluded that
the economic impact of the printing press was limited
Figure 1 Cities with printing in 1450 [4]
THEORETICAL BACKGROUND 9
OPTIMIZING THE WORK ENVIRONMENT USING LEAN AND CONTINUOUS IMPROVEMENT TOOLS-PRINTING FLOOR MANIVANNAN SAMPATH
Figure 2 Cities with printing press from the 1500s to 1800s [4]
Figure 1 and Figure 2 represents the cities with printing presses at the 1450s and
between 1500s-1800s
On exploiting the city level data on the diffusion and adoption of the printing press to
examine the technologys impact from a new perspective shows that cities that adopted
the printing press in the late 1400s enjoyed no growth advantages prior to adoption but
grew at least 20 percentage points and as much as 80 percentage points more than
similar cities that did not change over the period 1500-1600 These estimates imply that
the impact of printing accounted for at least 18 and as much as 80 percent of European
city growth between 1500 and 1600 [4]
Cities that were early adopters of the printing press kept a significant growth advantage
even over the three hundred years running 1500-1800 Even 1500-1800 print accounted
for somewhere between 5 and 45 percent of city growth Between 1500 and 1800
European cities were seedbeds of the ideas activities and social groups that launched
modern capitalist economic growth [4]
212 Types of printings
1 Flexography
2 Letterpress printing
3 Screen printing
4 Rotogravure
5 Digital printing
6 Lithography
THEORETICAL BACKGROUND 10
OPTIMIZING THE WORK ENVIRONMENT USING LEAN AND CONTINUOUS IMPROVEMENT TOOLS-PRINTING FLOOR MANIVANNAN SAMPATH
213 Printing equipment
Industrial printing equipment and supplies include screen printing equipment digital
printing equipment label printing equipment offset printing equipment letterpress
printing equipment and flexographic printing equipment
Table 1 Describes various printing equipments and their associated equipments
Table 1 printing equipment features [7]
Serial
Number
Equipment used
for printing Definition Features
1
Flexographic
printing
equipment
Flexographic printing equipment uses rubber
cylinders that are easy to keep and repair
bull Viscosity control
systems
bull Ink pumps
bull Chamber doctor
blades
bull Video systems
bull Stroboscopes
bull Slitting and rewinding
machines
2
Letterpress
printing
equipment
Letterpress printing inks type that is pressed
onto the printing surface
bull Die cutters
bull Scorers
bull Engravers
bull Embossers
bull Foil stampers
bull Binders
3 Screen printing
equipment
Screen printing equipment uses rubber
cylinders that are easy to keep and repair
bull Racks
bull Stretchers
bull Transfer presses
bull Dip tanks
bull Dryers
4 Digital printing
equipment
Digital printing equipment produces printed
materials directly from a computer file and
does not use intermediate materials such as
film or plates
bull Variable imaging digital
presses (computer to
paper)
bull Digital desktop
printers
bull Digital copiers
bull Direct imaging presses
(computer to plate on
press)
THEORETICAL BACKGROUND 11
OPTIMIZING THE WORK ENVIRONMENT USING LEAN AND CONTINUOUS IMPROVEMENT TOOLS-PRINTING FLOOR MANIVANNAN SAMPATH
5 Offset printing
equipment
Offset printing equipment produces printed
images from plate to paper with the help of
inks and cylinders
bull Printers
bull Scanners
bull Folding machines
bull Joggers
bull Binding equipment
214 Printing process description
This section briefly explains the process involved in various printing techniques and their
uses in production activities
2141 Flexography
Process
Flexographic printing involves a ldquoplate cylinderrdquo covered in whole or in part with raised
flexible print media that carry ink for an image The media then deposit that ink onto
the substrate Initially the media made of rubber sheets pressed into rigid molds and
vulcanized shows the image of flexography printing unit and its working components
Figure 3 shows the working image of flexography printing unit with its components
Figure 3 Flexography printing station [8]
A metal (eg magnesium) plate exposed with the negative of the image to be printed
and developed in an acid bath creates the first mold This metal relief plate makes the
mold for commercial use (usually in Bakelite plastic) A rubber or plastic sheet material
is vulcanized (by pressing it into the metal mold under controlled temperature and
pressure) to create the printing plate Alternatively a photopolymer material exposed
to the negative of the image to be printed creates the print media directly Light not
THEORETICAL BACKGROUND 12
OPTIMIZING THE WORK ENVIRONMENT USING LEAN AND CONTINUOUS IMPROVEMENT TOOLS-PRINTING FLOOR MANIVANNAN SAMPATH
excluded by the negative image cross-links the polymer In the following step a liquid
bath removes the polymer not cross-linked during the exposure process Raised surfaces
of (crossed-linked) photopolymer material give the raised surfaces to carry ink Recently
direct laser light exposure of photopolymer material has been able to cut the need for
the intermediate contrary giving high reproducibility and quality [9]
The process was developed primarily for printing on packaging substrates board paper
foil and film Materials are supplied in roll form for feeding into form-fill over-wrapping
bag making and other continuous web processing machinery [8]
Flexography printing is an efficient cost-effective and versatile printing method by the
end of the 1990rsquos approximately one-quarter of all printing is flexographic in the
packing segment of the printing industry Flexography enjoys a market share of over
65 growth throughout the 1990rsquos has been steady [8]
Applications
Some typical applications for flexography are paper and plastic bags milk cartons
disposable cups and candy bar wrappers Flexography printing may also be used for
envelopes labels and newspapers [8] Figure 4 shows some of the applications where
flexographic printing is used The labels of the above-shown products are made through
flexographic printing
Figure 4 Flexography printing application [8]
2142 Letter press printing
Process
Letter-press printing consists printing of suitably aqueous ink onto a sheet or web from
surfaces in relief The printing form is usually a stereotype or electrotype plate or a type
form with or without etchings bearing designs etched in relief While various kinds of
THEORETICAL BACKGROUND 13
OPTIMIZING THE WORK ENVIRONMENT USING LEAN AND CONTINUOUS IMPROVEMENT TOOLS-PRINTING FLOOR MANIVANNAN SAMPATH
presses may be employed rotary presses are used for high-speed letter-press printing
as in the printing of books magazines newspapers In rotary letter-press operations a
supply of ink is maintained in an ink fountain at a consistency suitable for the printing
conditions and the ink is fed from the fountain and distributed onto the raised surfaces
of the rotating printing form by a series of transfer and inking rollers [10] The web to
be printed is passed into contact with the moving inked form to affect the printing
operation After one side of the web has been printed that is after the first impression
a second printing or second impression is usually made on the other side of the web
by continuous operation of another section of the same press In multi-color letter-press
printing a series of impressions are made with inks of assorted colors a plurality of
impressions being placed in adjacent or superimposed relation on the same side of the
sheet or web [10]
Figure 5 shows the working of letterpress printing unit and its components
Figure 5 Letter printing station [10]
Applications
Letterpress printing was the effective book-preparing process For four centuries it was
also the powerful printing technology for posters announcements printed matter for
churches government and businesses single or two paged local news sheets daily and
weekly newspapers as well as various simple print jobs now limited to specialty works
such as numbering embossing hot stamping and hot wax carbonizing (spot carbon
printing) It is also used for die cutting perforating slitting and scoring [11]
THEORETICAL BACKGROUND 14
OPTIMIZING THE WORK ENVIRONMENT USING LEAN AND CONTINUOUS IMPROVEMENT TOOLS-PRINTING FLOOR MANIVANNAN SAMPATH
2143 Screen printing
Screen printing is a process in which ink is forced through a screen The screen-printing
stencil serves as a printing plate The screen is a delicate fabric made of natural silk
plastic or metal fibersthreads Plastic or metal fabric is used nowadays Ink is
imprintedtransferred through the image-specific open mesh that is not covered by the
stencil The screen-printing plate is therefore a combination of screen and stencil It is
the material the fineness of the screen (the number of screen threads per centimeter
of fabric length) the thickness of the screen the distance between the top and bottom
sides of the screen and the degree of opening of the screen (the degree of screen
opening areas as a percentage describes the ratio of the total of all mesh openings to
the entire surface of the fabric) that determine the printing properties and Quality of
the fabric (screen) [11]
Applications
Textilesmaterials printed T-shirts printed toys fronts of televisions radios etc
automobile dashboards measuring equipment packaging (plastic bags) printed circuit
boards large-format advertising posters are the areas where screen printing have found
its use [11]
Figure 6 shows the image of the screen-printing process and involved components
Figure 6 Screen printing station [11]
2144 Rotogravure
Process
True intaglio or steel-die process prints from sunken lines or grooves are connected and
cross each other Ink is then applied to the engraved areas and doctored or wiped off
the flat nonimage areas The resulting ink image is then impressed on the substrate to
THEORETICAL BACKGROUND 15
OPTIMIZING THE WORK ENVIRONMENT USING LEAN AND CONTINUOUS IMPROVEMENT TOOLS-PRINTING FLOOR MANIVANNAN SAMPATH
be printed Paper currency is printed from steel dies capable of reproducing beautiful
lines that no other process can duplicate A rotogravure is a form of printing and prints
directly from unconnected cells engraved into the plate cylinder [8]
Figure 7 shows the image of Gravure printing process and its units in operation
Figure 7 Gravure printing station [8]
Applications
Gravure is used for packaging magazines newspapers and other specialty printing
applications It has been an outstanding choice for printing process color for mass-
circulation magazines and newspapers Gravure-printed postage stamps are another
example of the exceptional print results of rotogravure Many plants have blended
flexography with gravure to produce exceptional print results on packaging materials
[8]
2145 Digital printing
The basic concept is that digital means using numbers to represent something and
thatrsquos what a computer does A typical image is converted into numerical data (a long
string of ones and zeros) that describe or quantify each sample point or ldquopixelrdquo (short
for picture element the basic unit of image information) in terms of specific attributes
such as color and intensity This data can be stored manipulated and transformed with
digital printing technologies back into a customarily viewed image [12]
THEORETICAL BACKGROUND 16
OPTIMIZING THE WORK ENVIRONMENT USING LEAN AND CONTINUOUS IMPROVEMENT TOOLS-PRINTING FLOOR MANIVANNAN SAMPATH
Process
Compared to traditional printing techniques digital printing is different However there
is no pressure or impact and there is no physical matrix The matrix now sits in the
computer in the form of digital data that can be converted repeatedly with or without
any variation into a print by any image-maker who either does his own printing (ldquoself-
printingrdquo) or who uses an outside printing service lab or retailer [12]
Figure 8 shows the process in which data is created stored and finally processed to
produce printed image on sheet
Figure 8 Processing of data into printed image [12]
Digital imaging and printing have changed the rules of visual communication Making
original prints or reproductions (see below) especially at an enormous size and in color
used to be costly cumbersome or difficult for any individual photographer or artist [12]
Figure 9 shows the image created using digital printing
THEORETICAL BACKGROUND 17
OPTIMIZING THE WORK ENVIRONMENT USING LEAN AND CONTINUOUS IMPROVEMENT TOOLS-PRINTING FLOOR MANIVANNAN SAMPATH
Figure 9 shows the image created using printing [12]
Advantages
The advantages of digital printing are clear in terms of cost consistency storage
flexibility
bull Some of the digital printing technologies are line printing mdash where pre-formed
characters are applied to the paper by lines
bull daisy wheel mdash where pre-formed characters are applied individually
bull dot-matrix mdash which produces arbitrary patterns of dots with an array of printing
studs
bull heat transfer mdash like early fax machines or modern receipt printers that apply heat
to special paper which turns black to form the printed image
bull blueprint mdash and related chemical technologies
bull inkjet mdash including bubble-jet mdash where ink is sprayed onto the paper to create the
desired image
bull laser mdash where toner consisting primarily of polymer with the pigment of the
desired colors are melted and applied directly to the paper to create the desired
image
bull 3D printing
2146 Offset lithography
Process
In offset lithographic printing the Printing ink is supplied to the inking rollers via a
reservoir (duct) Greater and lesser amounts of ink can be fed to the inking rollers by
opening and closing duct keys The inking rollers transfer the required amount of ink to
the printing plate The printing image is then transferred (or offset) from the plate to
THEORETICAL BACKGROUND 18
OPTIMIZING THE WORK ENVIRONMENT USING LEAN AND CONTINUOUS IMPROVEMENT TOOLS-PRINTING FLOOR MANIVANNAN SAMPATH
the blanket` and then to the paper on the impression cylinder The printed sheet is then
passed into the next printing unit via the transfer cylinder Each color must have a
separate printing unit The printing plate is made from aluminum and backed with a
sensitive coating The plate has two distinct areas the image area and the non-image
area Ink is accepted by the image areas of the plate while the non-image areas accept
a water-based mix called a damper solution When applied to the plate the solution
repels ink from the non-image area [13]
There are two types of lithographic printing they are
bull Sheet-fed
Sheet-fed press prints an image on single sheets of paper as they are fed individually
into the press The print quality and sheet to sheet registration are often better than
web-fed printing but it is often more economical to produce huge runs on web presses
because of their higher running speeds
bull Web-fed
A web-fed press prints images on a continuous web of paper fed into the press from a large roll of paper The web of paper is then cut into individual sheets after printing or as with continuous business form applications it is left in web form and is perforated for later separation into individual sheets
Figure 10 shows the working of offset printing machine along with parts involved in
producing prints
Figure 10 offset printing station [13]
Applications
The highest printing quality for packaging is achieved with offset printing Accordingly
printing of expensive luxury packaging for individual spirits chocolates perfumes and
cosmetics and even embossing in the correct register is always done on sheet-fed offset
THEORETICAL BACKGROUND 19
OPTIMIZING THE WORK ENVIRONMENT USING LEAN AND CONTINUOUS IMPROVEMENT TOOLS-PRINTING FLOOR MANIVANNAN SAMPATH
presses The printing of many other cardboard products and folding boxes for the
packaging of frozen food ice cream cigarettes drugs and cosmetics as well as many
other products in the food and non-food areas remains the almost exclusive domain of
offset printing technology [11]
Figure 11 shows the usage of offset printing on various products
Figure 11 Usage of offset printing for product lables [11]
215 Evolution of offset printing press
This section shows the evolution of offset printing technology and inventions made over
the past 100 years [14] [15]
1875
The first press to use offset lithography and the offset printing process is invented in
England The offset cylinder was covered with specially treated cardboard that
transferred the printed image from the litho stone to the surface of the metal
1880
The cardboard covering of the offset cylinder was changed to rubber which is still the
most commonly used material
1903
Ira Washington Rubel of the United States used the offset process to print on paper
Rubel noticed that whenever a sheet of paper was not fed into his lithographic press
during operation the stone printed its image to the rubber-covered impression cylinder
and the next impression had an image on both sides direct litho on the front and an
image from the rubber blanket on the back and discovered that images were printed
sharply by printing from the stone to the blanket and then to the paper
THEORETICAL BACKGROUND 20
OPTIMIZING THE WORK ENVIRONMENT USING LEAN AND CONTINUOUS IMPROVEMENT TOOLS-PRINTING FLOOR MANIVANNAN SAMPATH
1911
Albert Harris observed the process discovered by Rubel at about the same time and
developed an offset printing press for the Harris Automatic Press Company
1950
During the 1950s offset printing became the most popular form of commercial printing
as improvements were made in plates inks and paper maximizing the techniques
superior production speed and plate durability Today most of the printing including
newspapers is done by the offset printing process
1960
Increasingly newspaper printers begin replacing their outdated letterpress machines
with offset presses
1962
Heidelberg begins development for offset printing presses This came after decades of
resistance by management Technicians were able to convince them that this was the
way of the future
22 Production lines
221 Concept of production line
A production line is a set of the sequential process set up on an industrial shop floor A
production process or a manufacturing process is the transformation of raw materials
or components into finished products The stages of a production process involve
procurement fabrication assembly testing packaging and distribution The
production or manufacturing lines in industries can be categories into three typersquos ie
automated production lines semi-automated production lines and standard
production lines The nature of a production line depends on the complexity of the
manufacturing parts the production volume the sensitivity of the product and cost [16]
The production system has the following characteristics
1 Production is an organized activity so every production system has an aim
2 The system transforms the various inputs into useful outputs
3 It does not run in isolation from the other organization system
4 There exists feedback about the activities which is essential to control and
improve system performance [17]
THEORETICAL BACKGROUND 21
OPTIMIZING THE WORK ENVIRONMENT USING LEAN AND CONTINUOUS IMPROVEMENT TOOLS-PRINTING FLOOR MANIVANNAN SAMPATH
Figure 12 shows the inputs go through the transformation process and finally the output
of a production system
Figure 12 Schematic Production System [17]
222 Types of production lines
2221 Manual production lines
It consists of multiple workstations in which the assembly work is carried out as the
product (subassembly) is passed from station to station along the line At each
workstation one or more human workers perform a part of the total assembly work on
the product by adding one or more components to the existing subassembly Manual
lines are especially common where workpieces are fragile or if workpieces need to be
gripped often as industrial robots often lack the necessary accuracy In countries where
wage costs are low manual labor can also be a cost-efficient alternative to expensive
automated machinery [18]
Figure 13 depicts the manual assembly line setup
Figure 13 Manual assembly line [18]
THEORETICAL BACKGROUND 22
OPTIMIZING THE WORK ENVIRONMENT USING LEAN AND CONTINUOUS IMPROVEMENT TOOLS-PRINTING FLOOR MANIVANNAN SAMPATH
Manual operations are used in the assembly of complex work elements as well as when
product demand is unstable or where the use of specialized machines and equipment is
unjustifiably expensive Thus caution must be exercised in the design of a manual
assembly line with respect to the volume flexibility with uncertain production demand
To achieve this situation needs adjusting the number of workers or the system
configuration according to the changes in product demand Hence a manual assembly
line is more flexible than automated machine assembly systems in adapting to the
changes in production demand [19]
Manual assembly lines are used in high-production situations where the work to be
performed can be divided into small tasks and tasks assigned to the workstations on the
line A key advantage of using manual assembly line is a specialization of labor is by
giving each worker a limited set of tasks to do repeatedly According to Shtub [19] lack
of motivation and low level of satisfaction which is typically caused by the high
repetitiveness of elementary operations have been considered as a significant
disadvantage of assembly production
2222 Semi automatic production lines
Semi-automation describes a system in which a human operator or a small production
line feeds a product to a robot the robot performs a single task on that product and
then the human operator removes the product and completes the task
ldquoWork characteristic of a machine that only needs some degree of support from a manrdquo
In contrast to a completely automated system semi-automation does not achieve
complete relief from work for the worker [20] Ie the technical system usually achieves
the control of the individual functions Program control which means the start end and
succession of the individual functions is accomplished by manrdquo
Figure 14 shows the integration of manual and automatic workstations
Figure 14 combination of manual and automatic workstations [21]
Utilizing robotic and human capabilities at their best is obtained in an assembly system
where there is a sequential division of tasks The simple tasks suited for robots are found
THEORETICAL BACKGROUND 23
OPTIMIZING THE WORK ENVIRONMENT USING LEAN AND CONTINUOUS IMPROVEMENT TOOLS-PRINTING FLOOR MANIVANNAN SAMPATH
upstream in the line The complex often varied tasks that give the assembled products
human operators downstream perform their individual features Such hybrid lines have
been used to advantage in the industry for more than two decades [21]
Figure 15 shows the workstation been shared by the worker and an automated machine
in a line
A
B
Figure 15 A and B workplace sharing hybrid systems [22]
In this scenario several components must be assembled on a sheet metal part which is
supplied by a conveyor system The human worker must grip the components out of
bins to transport these parts towards the conveyor system (handling time) and to put
the components on the sheet metal parts (assembly) Afterward the robot must screw
these components into the sheet metal part (assembly) If the worker is too slow the
robot will wait until the worker has finished his tasks [23]
2223 Automated production lines
An automated production line has multiple workstations that are automated and linked
together by a work handling system that transfers parts from one station to the next
The automated production may consist of automated workstations manual
workstations and inspection stationsThere are different types of configurations layouts
available for automated production lines
bull In line
bull Segmented In-Line
bull Rotary
In-line layout
THEORETICAL BACKGROUND 24
OPTIMIZING THE WORK ENVIRONMENT USING LEAN AND CONTINUOUS IMPROVEMENT TOOLS-PRINTING FLOOR MANIVANNAN SAMPATH
Raw materials enter the automated production line and undergo a system of automated
processing at various workstations along the fixed production line the parts are passed
from workstation to workstation by means of a mechanized work transport system until
the wholly processed parts pass out of the automated production line after the last
process occurs to the part at the final workstation in the system [24]
Figure 16 describes the process of the In-line automated production line
Figure 16 Inline Configuration of an automated production line [24]
The conditions that decide the use of automated production lines include high product
demand stable product design long product life and multiple operations
Segmented In-line
L shaped layout
This layout allows fitting in a lengthy series of operations into limited space The feeding
cells start on an aisle and end at the point of use This May allow isolation of dangerous
or costly-to-move equipment in the elbow with savings in implementation cost andor
two directions for expansion It is easy to segregate the in-flow and outflow of physically
different materials products supplies and special services [24] Figure 17 shows the L-
shaped production layout with assembly stations to perform work
Figure 17 L shaped layout [24]
THEORETICAL BACKGROUND 25
OPTIMIZING THE WORK ENVIRONMENT USING LEAN AND CONTINUOUS IMPROVEMENT TOOLS-PRINTING FLOOR MANIVANNAN SAMPATH
U- shaped layout
U-shaped production lines were conceived as a solution in lean production
environments for waste elimination and for getting the full use of workerrsquos capabilities
Waste removal is usually achieved by the introduction of pull systems one-piece flow
leveling and ldquojidokardquo while fully utilizing workersrsquo capabilities requires a system of
respect for people based on minimizing wasted movements ensuring their safety and
giving them greater responsibility in running and improving their jobs [25]
Figure 18 shows u shaped production line system In U shaped lines the entrance and
the exit of the line system are remarkably close to each other Operators may handle
work-pieces both on the front and back of the line What operators found in crossover
workstations can perform tasks from both the front and back of the line Thus idle times
are reduced and resource use is increased thanks to the crossover stations found in
between the front and back of the U line [26]
Figure 18 U shaped production layout [24]
Rotary
Consists of a circular worktable around which work parts are fixed to work holders The
worktable rotates to move each work part in turn into each automated workstation
which is found around the circumference of the worktable The worktable is often called
a dial and the equipment is referred to as a dial indexing machine or simply indexing
machine
Figure 19 shows the image of a rotary layout design
THEORETICAL BACKGROUND 26
OPTIMIZING THE WORK ENVIRONMENT USING LEAN AND CONTINUOUS IMPROVEMENT TOOLS-PRINTING FLOOR MANIVANNAN SAMPATH
Figure 19 Rotary layout [24]
Limited to smaller work parts and few workstations and they cannot readily
accommodate buffer Robotic production lines storage capacity However they need less
floor space and are less expensive than other configurations [24]
Robots are being used extensively in assembly lines to perform the tasks and these
assembly lines are called robotic assembly lines [27] The robots are programmed to
perform different types of tasks and it can be used to work 24 hrs without worries of
fatigue Different types of robots are available in the market to do the same task with
different capabilities and efficiencies Therefore there is a requirement of reasonable
allocation of robots to workstations with the sure specific aim These robots need to be
re-assigned whenever there is a new product is planned for assembly [28]
Michels [29] consider that a robotic assembly line is composed of platform stations and
transporter robots to displace work-pieces between these platforms Multiple robots
may be assigned to each platform station By defining each transporter or platform as a
station and assuming the line starts and finishes with a transporter robot the
configuration results in line with an odd number of stations in an alternating pattern of
platform-fixed and transporter robots
Figure 20 shows the robotic line design model forming 13 serial stations (S1 to S13)
There are 24 robots in total composed of 17 platform robots (15 performing geometry
and finishing welding tasks and 2 performing stud tasks) and 7 transporter robots (4
performing finishing welding tasks 1 performing stud tasks (S9) and 2 for work-pieces
handling in the entrance and S11)
THEORETICAL BACKGROUND 27
OPTIMIZING THE WORK ENVIRONMENT USING LEAN AND CONTINUOUS IMPROVEMENT TOOLS-PRINTING FLOOR MANIVANNAN SAMPATH
Figure 20 Welding process performed by platform robots [29]
Figure 21 shows the types of the robot and their roles where they are being used in the
assembly line
Figure 21 Roles of robots [29]
Figure 22 shows the welding process performed by platform robots
Figure 22 Platform robots performing welding tasks [29]
THEORETICAL BACKGROUND 28
OPTIMIZING THE WORK ENVIRONMENT USING LEAN AND CONTINUOUS IMPROVEMENT TOOLS-PRINTING FLOOR MANIVANNAN SAMPATH
Figure 23 shows transporter robot on a track motion device unloading workpieces
Figure 23 Transporter robot on a track-motion device [29]
Benefits of the robotic system
bull The requirement for reduced floor space
bull Improved efficiency Improved quality
bull The ability to work in cold or hostile environments
bull Increased yields and reduced wastage
bull Increased consistency
bull Increased flexibility for some operations [30]
223 Management of production lines
2231 Workstations
A workstation is among the most critical places in a manufacturing environment Well-
organized working areas are essential for standardized work procedures which are
needed to control the workplace To perform the required tasks operators must use
different types of equipment tools and materials If the necessary resources are not
precisely and safely stored operators lose precious time to find them increasing thus
the non-value-added time (waste) [31] Workstations play a critical role in
manufacturing processes Lean workstations focus on minimizing waste and
concentrate operators to critical issues It is essential to ensure effectiveness in an
environment of high customization automation and competitiveness
As from the workstations design point of view Workstation design handles placing
materials tools equipment etc and routing operator movements in the most suitable
form That way operators can perform their work in an efficient manner [31]
traditional workstations and lean workstations are inherently different Traditional
workplaces are designed to ease the work of material handler not increase the value
THEORETICAL BACKGROUND 29
OPTIMIZING THE WORK ENVIRONMENT USING LEAN AND CONTINUOUS IMPROVEMENT TOOLS-PRINTING FLOOR MANIVANNAN SAMPATH
added by the operator A lean workstation is designed focused on operator concerns
such as safety and ergonomics and minimal wasted motion with the goal to get parts
efficiently and find tools quickly Assembly materials tools or parts should be
strategically positioned to allow the operator to reach it instantaneously without
interfering with operatorsrsquo safety and comfortability [32]
Maslow [33] introduced five stages of ldquoHierarchy of workstations needsrdquo which were
developed to understand and priorities the requirements to achieve full performance in
workstations
Figure 24 shows the Functionality effectiveness efficiency satisfaction are the levels of
hierarchy in workstation needs towards excellence proposed by Maslow
Figure 24 Hierarchy of workstation needs [33]
Functionality ensures physical and safety needs of the operators Effectiveness fulfills
their social and relationship needs such as friendship love and belonging Efficiency
reflects how the workstation and their associates are seen in the whole facility and if
their value is recognized and respected by others ndash esteem Finally satisfaction refers to
the achievement of higher goals and full levels of satisfaction ndash self-actualization and
self-transcendence Once all levels have been fulfilled the company and its workstation
can achieve the desired level of excellence [33]
THEORETICAL BACKGROUND 30
OPTIMIZING THE WORK ENVIRONMENT USING LEAN AND CONTINUOUS IMPROVEMENT TOOLS-PRINTING FLOOR MANIVANNAN SAMPATH
2232 Line balancing
Line balancing is a technique used in connection with the design of product layout or
lsquolsquolinesrsquorsquo The term lsquolsquobalancingrsquorsquo is used because one of its main aims is to minimize the
idle time and spread it as evenly as possible across the workstations [34] It is also used
to minimize imbalance betweenamong workers and workloads to achieve the required
run rate Therefore the line should be analyzed in terms of the assembly process
workstations layout and workstation cycle time [35]
When balancing a line the following factors need to be taken into account
bull the required output rate or cycle time (which depends on the demand for the
product)
bull precedence constraints (these are restrictions on the order in which tasks can be
done in other words specific tasks will have lsquolsquopredecessor tasksrsquorsquo that must be
done first)
bull zoning constraints (these are restrictions on where specific tasks or combinations
of tasks should or should not take place)
bull duplication of workstations are done in case when a task takes longer cycle time
than the available cycle time [34]
The line-balancing problem forms two aspects
bull Determination of the required number of stations and
bull The assignment of tasks to each station with the aim of maximizing efficiency (by
minimizing idle time and spreading it evenly across workstations)
Formulation
Equation 1 Represents the formulations involved in line balancing
Equation 1 Formulations involved in line balancing
119888119910119888119897119890119905119894119898119890 ∶= (119901119903119900119889119906119888119905119894119900119899119906119899119894119905119905119894119898119890)(119889119890119898119886119899119889119906119899119894119905119905119894119898119890)
119873119906119898119887119890119903 119900119891 119908119900119903119896 119904119905119886119905119894119900119899119904 ∶= 119879119886119904119896 119905119894119898119890 119862119910119888119897119890 119905119894119898119890frasl
119864119891119891119894119888119894119890119899119888119910 ∶= 119879119886119904119896 119905119894119898119890 119860119888119905119906119886119897 119899119906119898119887119890119903 119900119891 119908119900119903119896119904119905119886119905119894119900119899119904frasl
The effectiveness of the balance decision is measured by the lsquolsquobalance lossrsquorsquo of the line
The balance loss is the time invested in making one product that is lost through
imbalance expressed as a percentage of the total time investment
For a paced n stage line the time lost through imbalance is the cumulative difference
between the stationsrsquo distributed work times and the cycle time allowed by the pacing
of the line For unpacked lines it is the cumulative difference between each stagersquos work
THEORETICAL BACKGROUND 31
OPTIMIZING THE WORK ENVIRONMENT USING LEAN AND CONTINUOUS IMPROVEMENT TOOLS-PRINTING FLOOR MANIVANNAN SAMPATH
time and that of the stage with the most significant work time (this effectively governs
the cycle time of the whole line)
An amazingly simple line-balancing problem may be solved by lsquolsquotrial and errorrsquorsquo Most
practical problems however are extremely complex needing thousands of tasks to be
assigned across hundreds of workstations and with many precedences and zoning
constraints to be taken into account Many heuristic algorithms have been developed
such as the Kilbridge and Wester method and the ranked positional weights technique
Being based on heuristics or lsquolsquorulesrsquorsquo that have been tested empirically such techniques
can provide useful although not necessarily best results [34]
Kilbridge and Wester method
bull It is a heuristic procedure which selects work elements for assignment to stations
according to their position in the precedence diagram
bull elements at the end of the precedence diagram might be the first candidates to
be considered just because their values are significant
Procedure
Construct the precedence diagram so those nodes being work elements of the same
precedence are arranged vertically in columns
1 List the elements in order of their columns column I at the top of the list If an
element can be in more than one column list all columns by the element to show
the transferability of the element
2 To assign elements to workstations start with the column I elements Continue
the assignment procedure in order of column number until the cycle time is
reached [36]
2233 Supply
The supply chain is defined as a network of facilities and distribution options that performs
three tasks One is procurement second is manufacturing or transformation of these
materials into products and the third is distribution which is to deliver the manufactured
products to the ultimate or end customer [37]
Figure 25 shows the set of suppliers and then there is the manufacturing or the
organization produced goods are sent to customers through a channel so it could be a
distribution channel and from there it goes to the final customer
THEORETICAL BACKGROUND 32
OPTIMIZING THE WORK ENVIRONMENT USING LEAN AND CONTINUOUS IMPROVEMENT TOOLS-PRINTING FLOOR MANIVANNAN SAMPATH
Figure 25 Represents the flow across enterprises [38]
There are four primary uses of the term lsquosupply chain managementrsquo [38]
bull First the internal supply chain that integrates business functions involved in the
flow of materials and information from inbound to outbound ends of the
business
bull Secondly the management of two-party relationships with immediate suppliers
bull Thirdly the management of a chain of businesses including a supplier a supplierrsquos
suppliers a customer and a customerrsquos customer and so on
bull Fourthly the management of a network of interconnected businesses involved in
the ultimate provision of product and service packages needed by end
customers
Performance in supply chain management
Network performance
Easton [39] investigated performance differences between single-sourcing and multiple-
sourcing networks They proposed that single-sourcing networks would be more rigid
and stronger as there would be dense flows of exchanges within them It would also be
easier to keep confidentiality in single sourcing However the advantages of multi-
source or extensive networks included an ability to adapt to changes in the environment
through switching and a broader base to generate innovation from advocated multiple
sourcing as an essential strategy for firms who needed to reduce uncertainty in
purchasing
Chain performance
Logistics research into chain performance has focused primarily on improving speed and
cost performance Improvements in speed and cost may relate to the physical supply
THEORETICAL BACKGROUND 33
OPTIMIZING THE WORK ENVIRONMENT USING LEAN AND CONTINUOUS IMPROVEMENT TOOLS-PRINTING FLOOR MANIVANNAN SAMPATH
chain through which materials are converted and goods flow to end customers or to
the process chain of orders and demand transmission [40]
Relationship performance
Recent purchasing literature emphasizes the increasing importance of measuring and
monitoring performance within relationships because of the increased dependency
between the parties A performance measurement system implemented by the
purchasing party can enhance the buy-sell relationship However most performance
measurement systems in use do not do this for three main reasons First they
incorporate mostly hard objective measures which may not be proper for measuring
softer features of capability and performance Secondly the measurement systems are
usually designed by the purchasing organization for the purchasing organization rather
than for the relationship as a quasi-organization [41]
23 Lean concepts and tools
Lean is a management philosophy that focuses on reconfiguring organizational
processes to continually reduce and eliminate waste over time thereby contributing to
efficiency and value creation for the customer [42]
The concept of lean is the Toyota way promoted by Toyota which helps in improving
the flow of a process in a system is by dropping any uneven workflow throughout the
system Tools namely pull system by ldquoKanbanrdquo and production smoothing or ldquoheijunkardquo
are used for improving the flow in a system
Womack and Jones [43] stated lean is a management philosophy that focuses on
reconfiguring organizational processes to continually reduce and cut waste over time
thereby contributing to efficiency and value creation for the customer To this end Lean
applies specialist analytical tools and techniques
The concept helps in reducing waste (Muda) in any organization without affecting its
products or services which also includes the waste occurred due to overburden (muri)
and uneven workload (Mura) scenarios which are considered as significant causes of
creating losses Several tools and practices have been developed to achieve lean
Figure 26 presents the classification of the tools as suggested by Salonitis and
Tsinopoulos [44]
THEORETICAL BACKGROUND 34
OPTIMIZING THE WORK ENVIRONMENT USING LEAN AND CONTINUOUS IMPROVEMENT TOOLS-PRINTING FLOOR MANIVANNAN SAMPATH
Figure 26 Lean manufacturing tools and practices [44]
The use of lean will allow any organization to achieve continuous and valuable
propositions for their key stakeholders A lean manufacturing initiative is focused on
cost reduction and increases in turnover by systematically and continuously cutting all
non-value-added activities [45]
Benefits of lean
As been said by many authors the benefits of lean can be grouped and represent five
improvement dimensions waste elimination continuous improvement continuous
flow and pull-driven systems multifunctional teams and information systems The
main benefits are related to the reduction of different type of resources reduced
delivery time increased productivity higher quality faster problem solving and decision
making and higher customer satisfaction [46]
Through lean manufacturing can be achieved by using less human effort in the factory
less space less financial resources and less material for producing the same product
[47]
231 Concept of waste
The concepts of waste are central to the Lean method that has been adapted from its
manufacturing origins and applied successfully to the context in several organizations
Howell defines waste as the difference in productivity when benchmarked against the
performance criteria for a production system failure to meet the unique requirements
of a client considered waste [48]
THEORETICAL BACKGROUND 35
OPTIMIZING THE WORK ENVIRONMENT USING LEAN AND CONTINUOUS IMPROVEMENT TOOLS-PRINTING FLOOR MANIVANNAN SAMPATH
Waste also defined as ldquoAnything that does not add value to the customer is a wasterdquo
Waste adds to time and cost This definition captures the thinking behind operations
management most effectively because it takes into consideration not just the material
wastes but also other resources like time and labor to which we can assign some form
of value [49]
Waste can be in the form of additional output input or processing It can be in the form
of materials stocks equipment facilities manhours utilities documents expenses
motion and other activities that do not add value [50]
Muda Muri Mura are three different types of wastes
Muda
Muda means waste or uselessness This type of waste characterized by using time
money and resources while not adding any value to the customer The goal of finding
Muda is to recognize which steps are necessary for the process and which need to be
reduced or eliminated [51]
bull Type I Muda Non-value-added tasks which seem to be essential Business
conditions need to be changed to cut this type of waste
bull Type II Muda Non-value-added tasks which can be eliminated at once
Taiichi Ohno the author of Toyota Production System devised seven manufacturing
wastes Overproduction Inventory Over-processing Correction Waiting Conveyance
and Motion [52]
Muri
Muri means overburden or unreasonableness (waste of overloading equipment facility
or people resources beyond its ability)
Mura
Mura means variation or unevenness It refers to waste of unevenness in production
volume It may take two different forms variation in production scheduling uneven
production workload and pace of work
232 POKE-YOKE
In 1961 Shigeo Shingo introduced Poka-Yoke method when he is one of the engineers at
Toyota Motor Corporation This method in other words is to prevent defects and errors
originating in the mistake [53]
The basis for poke yoke is that defects occur because of worker errors Although poke
yokes may be used for mistake-proofing any process poke yokes are usually targeted to
repetitive tasks where the potential for human error is more likely [54] Poka-Yoke
design can dramatically decrease the risk of producing defectives again [55] The aim of
THEORETICAL BACKGROUND 36
OPTIMIZING THE WORK ENVIRONMENT USING LEAN AND CONTINUOUS IMPROVEMENT TOOLS-PRINTING FLOOR MANIVANNAN SAMPATH
Poka-Yoke method is to eliminate or minimize human errors in manufacturing processes
and management because of mental and physical human imperfections [53]
DTommelein [56] after performing mistake-proofing in an AEC (Architecture
Engineering construction) industry stated that mistake-proofing could be practiced
within a specialty (eg plumbing electrical or mechanical work) it can be practiced by
designers manufacturers or fabricators to benefit a product as it is being constructed or
throughout its lifecycle performance or it can be practiced by designers to benefit a
system
Poke-yoke inspection methods
Successive self and source inspection can be achieved using poke yoke methods Poke-
yoke achieves 100 percent inspection through mechanical or physical control [57]
Regulatory functions of poke yoke
There are two ways where poke yoke can be used to correct mistakes
bull Control type
The control poke-yoke is the most robust corrective device because it shuts
down the process until the poor condition has been corrected [57]
bull Warning type
The warning poke-yoke allows defective processing to continue if workers do not
respond to the warning [57]
Figure 27 shows the two types poke yoke methods
Figure 27 Function of Poke-Yoke [58]
The decision to implement a poke-yoke must be made based on a cost-benefit analysis
The control poke-yoke is the more effective in most cases [57]
There are three types of control poke-yoke
bull The contact method finds defects by slight changes in product shape or dimension
are sometimes introduced deliberately to make defects easier to find color
differences
bull The fixed value method decides whether a given number of movements is made
THEORETICAL BACKGROUND 37
OPTIMIZING THE WORK ENVIRONMENT USING LEAN AND CONTINUOUS IMPROVEMENT TOOLS-PRINTING FLOOR MANIVANNAN SAMPATH
bull The motion step method decides whether the established steps or motions of a
procedure are followed [57]
The Poka-Yoke is a technique for avoiding human error at work A defect exists in either
of two states the defect either has already occurred calling for defect detection or is
about to occur calling for defect prediction [59]
Step by step process in applying poka-yoke
bull Find the operation or process
bull Analyze and understand the ways in which a process can fail
bull Decide the right Poka-yoke approach such as using a
o Control Type Preventing an error being made
o Warning Type Highlighting that an error has been made
bull Determine whether a Contact Method Constant Number or Counting Method
Motion-Sequence Method
bull Trial the method and see if it works
bull Train the operator review performance and measure success [60]
233 MUDA
There are two types of waste (Muda)
Muda Type I non-value adding but necessary for end-customers These are usually
harder to eliminate because while classified as non-value adding they may still be
necessary For example while an end-customer might not view quality inspection in car
assembly as value-adding it is necessary to ensure the car meets safety standards
Muda Type II non-value is adding and unnecessary for end-customers These contribute
to waste incur hidden costs and should be eliminated
Figure 28 shows the seven types of waste by Taiichi Ohno
Figure 28 Types of waste [61]
THEORETICAL BACKGROUND 38
OPTIMIZING THE WORK ENVIRONMENT USING LEAN AND CONTINUOUS IMPROVEMENT TOOLS-PRINTING FLOOR MANIVANNAN SAMPATH
Transportation
Transport is an inseparable part of the production processes which cannot be removed
However it does not give any value to the final product and this is why the aim is to
reduce it to the lowest possible level [61]
Inventory
Inventory wastes come from the purchasing storage of excess or excessive supplies
materials and other resources This waste can also be caused by overproduction as
excess materials and work-in-process are accumulated Inventory waste is often due to
a lack of planning and failure to match purchases with the actual consumption or usage
rate of a resource [50]
Motion
Unnecessary movements in the manufacturing environment will result in processing
delays Other unutilized talents are employee lost time excellent skills employee ideas
and recommendations for simplifying the process [62]
Waiting
Some common wait time is caused by processing delays machine or system downtime
response time and signature needed for approval wait time Delay usually caused by the
loading and unloading the workpiece in the machines The operatorrsquos time allocation is
more than that of the actual processing time This excess time allocation for the
operators to do the job increases the overall wait time and delay in the process [63]
Over-production
Making more of a product that is needed results in several forms of waste typically
caused by production in large batches The customers needs often change over the time
it takes to produce a larger batch Over-production has been described as the subdue
waste
Over-processing
Doing more to a product that is needed by the end-customer results in it taking longer
and costing more to produce They do not answer to a real need adding more value to
the service than the customers are willing to pay for Design or build a work that presents
an oversized performance if compared with real demand [64]
Defects
Whenever defects occur extra costs are incurred by reworking the part rescheduling
production etc [61]
THEORETICAL BACKGROUND 39
OPTIMIZING THE WORK ENVIRONMENT USING LEAN AND CONTINUOUS IMPROVEMENT TOOLS-PRINTING FLOOR MANIVANNAN SAMPATH
234 SMED
The SMED method was developed by Shingo (1985) who described it as a scientific
approach to reduce setup times and which can be applied to any industrial unit and to
any machine
SMED is defined as the minimum amount of time necessary to change the type of
production activity taking into consideration the moment in which the last piece of a
previous lot was produced to the first piece produced by the subsequent lot [65]
SMED helps to reduce machine setup times by cutting wastes and unnecessary setup
processes and helps to improve current setup processes and manufacturing flexibility
[66]
By focusing on the elimination of the waste associated with tool changeovers in the
setup phase SMED allows for the reduction of lot sizes and enables one to meet the
fluctuation of demand It further cuts the waste inherent to stock buildup and enhances
a reduction in lead time [67]
The SMED method in association to other Lean tools on a seat-cable assembly line at
the automotive sector company showed a reduction in setup time by at least 583
corresponding to 210 min in a week [68]
A fundamental aspect of the SMED method relates to its features of internal and
external activities
External activities
All the setup activities which do not interfere directly with the equipment and which
can be carried out without interrupting production are designated as being external
activities
Internal activities
Those who imply a stoppage in the equipment running are described as internal
activities The correct separation of the two is what fundamentally contributes to a
reduction in setup times [67]
Figure 29 shows the different phases of a SMED process
THEORETICAL BACKGROUND 40
OPTIMIZING THE WORK ENVIRONMENT USING LEAN AND CONTINUOUS IMPROVEMENT TOOLS-PRINTING FLOOR MANIVANNAN SAMPATH
Figure 29 The phases of SMED method [69]
In sum the SMED method consists of four phases when aiming to reduce setup times
bull PHASE A - In this phase there is not a clear separation between activities that
must be performed while the equipment is stopped (activities that are not
making parts or internal activities) and the ones that can be done while
equipment is running (activities making parts or external activities) In this
phase the involvement of everyone is critical and should be specifically assured
bull PHASE B - This phase refers to the detailed characterization organization and
separation of the operations in internal or external Shingo (1985) considers this
the most crucial phase from which the setup can be reduced from 30 to 50
bull PHASE C - a new analysis of all operations should be done to verify the
classification done in the phase B and focus effort should be directed to convert
internal operations into external The implementation of this phase should
allow an improvement from 10 to 30 in the total time of internal setup of
the phase B [65]
bull PHASE D ndashthe primary goal is to reduce the time of internal and external
operations through the application of the identified solutions that will allow an
easy fast and secure performance
Benefits of Single Minute Exchange of die
bull The reduction of inventory the increase in production flexibility and the
rationalization of tools is among the indirect benefits
bull The direct benefits include the reduction of setup time the reduction of time
spent with fine-tuning the machines the reduction of errors during
changeovers the improvement of product quality and increased safety [65]
235 5S
The 5S lean tool was developed in Japan by Sakichi Toyoda Kishiro Toyoda and Taiichi
Ohno in 1960 [70] 5S is a method of organizing the workspace in a clean efficient and
safe manner to achieve a productive work environment The 5S is a starting point for
THEORETICAL BACKGROUND 41
OPTIMIZING THE WORK ENVIRONMENT USING LEAN AND CONTINUOUS IMPROVEMENT TOOLS-PRINTING FLOOR MANIVANNAN SAMPATH
any company that wants to be recognized as a responsible producer worthy of world-
class status [71]
Implementation of the five levels can reduce the amount of waste and errors and
increase productivity improve safety and quality of products or services [72]
Figure 30 shows the 5 stages of 5s as implementation steps
Figure 30 5S method [73]
The method consists of the sequential following of five steps
bull Seiri (Sort)
The workplace should only have what is needed to perform the activities
Remove all unnecessary tools and parts Go through all tools materials and so
forth in the plant and work area Keep only essential items
bull Seiton (Set in order)
There must be a place for everything and everything should be in its place Quick
and visual identification of tools and areas saves time and eases processes
bull Seiso (Shine)
To keep everything clean and neat One aspect of ldquoSeisordquo is to design and
implement effective methods which must be integrated into the operatorsacute daily
maintenance tasks
bull Seiketsu (Standardize)
Documenting and standardizing the method using standard procedures
Standards should be very communicative clear and easy to understand
bull Shinseki (Sustain)
The last step consists of developing a method to ensure the 5S technique is
followed It needs discipline and focus Usually audits are performed to assure
the sustainability of the method
The implementation of 5s in automotive cable production plant and its case study
concludes that implementing and maintaining 5S method and standards in the company
THEORETICAL BACKGROUND 42
OPTIMIZING THE WORK ENVIRONMENT USING LEAN AND CONTINUOUS IMPROVEMENT TOOLS-PRINTING FLOOR MANIVANNAN SAMPATH
led to improved performances increase of the productivity of the organization the
safety at workplace and the product quality has been increased [73]
5S bring several benefits to a company being the most relevant one the decrease in a
waste of time and space According to Hirano the rewards of applying 5S are extended
to quality security and hygiene [74]
24 Continuum improvement tools
Continuous improvement or Kaizen is a method for finding opportunities for
streamlining work and reducing waste The practice was formalized by the popularity of
Lean Agile Kaizen in manufacturing and business and it is now being used by
thousands of companies all over the world to find savings opportunities Many of these
ideologies can be combined for excellent results For example Kaizen and Kanban can
go hand-in-hand to facilitate continuous improvement
241 PDCA
Deming introduced PDCA to Japanese enterprises in 1950 according to which quality
improvements take place through four significant steps Plan-Do-Check-Act Since then
Japan has become the world leader in quality management [75] PDCA is a successive
cycle which starts off small to test potential effects on processes but then gradually
leads to more substantial and more targeted change [76] It consists of a logical
sequence of four repetitive steps for continuous improvement and learning These all
four steps are repeated over and over as part of a never-ending cycle for improvement
[77] Figure 31 shows the process of the PDCA cycle in a clockwise direction
Figure 31 PDCA Cycle [77]
THEORETICAL BACKGROUND 43
OPTIMIZING THE WORK ENVIRONMENT USING LEAN AND CONTINUOUS IMPROVEMENT TOOLS-PRINTING FLOOR MANIVANNAN SAMPATH
According to Gorenflo and Moran [78] [79] the phases of PDCA can be understood as
follows
bull Plan In this phase opportunities for improvement are found and prioritized the
current situation of the process is investigated through consistent data the
causes of the problem are determined and possible actions to mitigate the
issues are chalked out
bull Do The purpose of this step is to implement the action plan select and document
data voluntarily and note the unexpected events lessons learned and
knowledge gained
bull Check At this point the results of the actions are analyzed The new situation is
compared to the old verifying if there were improvements and whether aims
were met For this various graph support tools are used
bull Action At this stage the team involved develops methods that will standardize
the improvement (if the result has been reached) repeats the test to collect new
data and re-evaluate the intervention (if the collected data is insufficient or
circumstances have changed) or abandon the project and make another
beginning from stage 1 (if the actions taken have not generated useful
improvements)
The application of PDCA has seen various improvements in different scenarios where
they were performed According to PDCA Processes can be improved with changes in
workplace layout material handling system workplace arrangement and
Standardization of operations [80]
The PDCA cycle ensures two types of corrective action ndash temporary and permanent The
short action is aimed at practically tackling and fixing the problem The permanent
corrective action consists of investigation and cutting the root causes and thus targets
the sustainability of the improved process [81]
242 TFM
TFM is then defined as an integrated concept to increase Process Flow and Effectiveness
(Pull) across the Totality of a Supply Chain The targets are the reduction of the total lead
time in the SC Reducing lead time also drops Muda of waiting and really means creating
a material flow [82]
Primarily it is necessary to create an internal pull flow in maximum operational
efficiency and free of non-value added activities (NVAA) then consider the extension to
the valley (the delivery side ie customers) and upstream (the source side ie the
suppliers)
Figure 32 shows the TFM model having the internal pull flow having the suppliers
customers as for source and destination respectively
THEORETICAL BACKGROUND 44
OPTIMIZING THE WORK ENVIRONMENT USING LEAN AND CONTINUOUS IMPROVEMENT TOOLS-PRINTING FLOOR MANIVANNAN SAMPATH
Figure 32 TFM model [83]
The flow of materials can be considered as a repeated sequence of four types of
transaction namely transport inspection waiting and transformation the only value-
added activities The primary objective is the reduction of total lead time as regular
coverage of stocks eliminating Muda process creating benefits in terms of cost
reduction and working capital increased productivity and quality in order to achieve a
higher level of service provided to customers and to improve therefore the satisfaction
[84]
Figure 33 shows the TFM pillars and the strategies involved in each pillar
Figure 33 Total Flow Management Pillars [83]
THEORETICAL BACKGROUND 45
OPTIMIZING THE WORK ENVIRONMENT USING LEAN AND CONTINUOUS IMPROVEMENT TOOLS-PRINTING FLOOR MANIVANNAN SAMPATH
TFM is a model that can trigger a breakthrough in the performance of any Supply Chain
and that embodies the power of a complete lean transformation [83]
The flow of information and materials found through the analysis of logistic loop can be
grouped into three pillars of TFM Figure 33
bull Production Flow
bull Internal coordination flow
bull External coordination flow
In a Total Flow Management optics each of these flows must be analyzed and perfected
by applying the principles of Lean and Kaizen tools
The first step is to improve the production flow which ranks as aims the implementation
of the one-piece flow increased flexibility by adjusting the setup and an increase in
operational efficiency and supply
The improvement actions are divided into these categories
Redesign of the layout and lines in one-piece optical flow redesign of the perimeter of
the line for the efficiency of supply definition of standard work for operational
efficiency SMED technique for flexibility in setup low-cost automation to reduce the
walls
The second step is the optimization of internal logistics flows including all the
movements of small containers inside the plant but also the related information flows
The improvement actions are divided into these categories
bull A system to simplify and streamline internal transport of the material to the point
of use synchronization as coordination between supply and production leveling
productivity of the lines and equipment in relation to the takt time pull
production planning by the actual customer orders
Finally the third step is the optimization of external logistics flows ie the handling of
materials and products generally parceled out in pallet from the factory to customers
and suppliers to the plant
bull In this case the categories of intervention are redesign of the stores and
warehouses creation of the milk run ie an external flow of transport physical
flows in (inbound) and outgoing (outbound) through small containers and
pallets planning pull the logistics to handle the material withdrawals according
to the royal orders of consumers
243 OEE
Overall Equipment Effectiveness (OEE) is a crucial measurement of efficiency in
manufacturing processes (at the machine manufacturing cell or assembly line levels)
THEORETICAL BACKGROUND 46
OPTIMIZING THE WORK ENVIRONMENT USING LEAN AND CONTINUOUS IMPROVEMENT TOOLS-PRINTING FLOOR MANIVANNAN SAMPATH
[9] It is defined as the ratio of producing goods of approved quality to the scheduled
production time (loading time) [85] The OEE has been applied as a measurement tool
and decision-making aid for improving productivity by improving equipment [86] In
general OEE is decided according to each machine used in a production process to
identify its availability quality and performance contributions and to observe the
possible relationships between the different parameters of influence
Equation 2 Represents the formulas involved in calculating OEE
Equation 2 formulations in calculating OEE
119860119907119886119894119897119886119887119894119897119894119905119910(119860) ∶= 119874119901119890119903119886119905119894119898119890 119905119894119898119890 119871119900119886119889119894119899119892 119905119894119898119890frasl
119875119890119903119891119900119903119898119886119899119888119890(119875) ∶= 119873119890119905 119900119901119890119903119886119905119894119899119892 119905119894119898119890 119874119901119890119903119886119905119894119899119892 119905119894119898119890frasl
119876119906119886119897119894119905119910(119876) ∶= 119907119886119897119906119886119887119897119890 119900119901119890119903119886119905119894119899119892 119905119894119898119890 119873119890119905 119900119901119890119903119886119905119894119899119892 119905119894119898119890frasl
119874119907119890119903119886119897119897 119864119902119906119894119901119898119890119899119905 119864119891119891119890119888119905119894119907119890119899119890119904119904 ∶= 119860119907119886119894119897119886119887119894119897119894119905119910 lowast 119875119890119903119891119900119903119898119886119899119888119890 lowast 119876119906119886119897119894119905119910
Figure 34 shows the six significant losses divided into the three categories such as
availability performance and quality where (A) availability is defined as a ratio of
planned production time minus downtime (breakdowns and changeovers) over planned
production time (P) Performance efficiency is the ideal cycle time times the number of
products produced over the actual runtime The (Q) quality rate is the ratio between
accepted products over several products produced
Figure 34 OEE Timeline [87]
Nakajima [86] defines the six significant losses in production as in three categories [85]
THEORETICAL BACKGROUND 47
OPTIMIZING THE WORK ENVIRONMENT USING LEAN AND CONTINUOUS IMPROVEMENT TOOLS-PRINTING FLOOR MANIVANNAN SAMPATH
Downtime losses
1 Equipment failures are categorized as time losses when productivity is reduced
and quantity losses caused by defective products
2 Setup and adjustment time losses result from downtime and defective products
that occur when the production of one item ends and the equipment is adjusted
to meet the requirements of another item
Speed losses
3 Idling and minor stop losses occur when the production is interrupted by a
temporary malfunction or when a machine is idling
4 Reduced speed losses refer to the difference between equipment design speed
and actual operating speed
Quality losses
5 Reduced yield occurs during the initial stages of production from machine startup
to until stabilization
6 Quality defects and rework are losses in quality caused by malfunctioning
production equipment
World class level of OEE is in the range of 85ndash92 for non-process industry [88]
49
ltTIacuteTULO DA TESEgt ltNOME DO AUTORgt
THESIS DEVELOPMENT
31 Production lines characterization
32 Problem characterization
33 Objective
34 Brainstorming
35 SWOT analysis of possible solutions
36 Implementation
THESIS DEVELOPMENT 51
OPTIMIZING THE WORK ENVIRONMENT USING LEAN AND CONTINUOUS IMPROVEMENT TOOLS-PRINTING FLOOR MANIVANNAN SAMPATH
THESIS DEVELOPMENT
31 Production lines characterization
In this section the characteristics of production lines where the work was
performed are briefed and picturized
311 Production line A
There are two printing machines used at this production line they are Heidelberg
Speedmaster 74-5 Heidelberg Speedmaster 52-2 having 5 and 2 printing bodies
respectively each produces products of small batches prints at 15000 sph The machines
are positioned in between the marked yellow line giving enough space for the
production activity to be carried out
Explaining the process in Heidelberg Speedmaster 74-5 production starts by receiving
the order and obtaining required raw materials such as the specified size of printing
paper inks printing plates as per specified in the job sheet
Figure 35 shows the picture of Heidelberg Speedmaster 74-5 printing unit at Marsil
Figure 35 Offset printing SM74-5 unit at Marsil
The inks for the production are introduced into the inking rollers through the reservoir
ducts present at heads of the printing bodies by the machine operator and are evenly
THESIS DEVELOPMENT 52
OPTIMIZING THE WORK ENVIRONMENT USING LEAN AND CONTINUOUS IMPROVEMENT TOOLS-PRINTING FLOOR MANIVANNAN SAMPATH
spread out and so the printing machines are made to run for the inks to reach the
cylinders inside each printing bodies The printing plates are cleaned by cleaning
solutions and introduced into printing bodies in between the plate cylinder and the
impression cylinder(blanket) as the machines grab the plates and set them up through
the press of a button specified at each printing bodies
Figure 36 shows the cleaning solution used for cleaning plates during the production
process
Figure 36 Plate cleaning solution
Control system
Selection of size of the printing area the intensity of the colors to be printed the
thickness of the printing paper size of the production is made through the control
system specified for that printing unit Figure 37 A and B shows the control system
images of Speedmaster 74-5 at the printing unit
A
B
Figure 37 Control systems of SM 74-5
The printing process begins after setup for the production is complete and several prints
for the job being printed and evaluated The evaluation performed through a device that
measures the intensity of the ink printed on the paper and the results compared to the
THESIS DEVELOPMENT 53
OPTIMIZING THE WORK ENVIRONMENT USING LEAN AND CONTINUOUS IMPROVEMENT TOOLS-PRINTING FLOOR MANIVANNAN SAMPATH
expected level by the operator The operator performs a few more prints by changing
the intensity level on the control system and the operation repeated until the operator
has a superior quality of prints for the job This shows that the production unit is partially
automatedFigure 38 A and B shows the image of measuring devices used at every
production unit during preparation operations
A
B
Figure 38 Measuring devices
Figure 39 Shows the image of goods produced by speedmaster 74-5 arraged on pallets
Figure 39 Products produced by SM74-5
The produced goods are then transferred to the next production unit with help of
manual fork lifters where the final goods are produced according to requirements
Figure 40 shows the image of manual fork lifter used for transferring goods
THESIS DEVELOPMENT 54
OPTIMIZING THE WORK ENVIRONMENT USING LEAN AND CONTINUOUS IMPROVEMENT TOOLS-PRINTING FLOOR MANIVANNAN SAMPATH
Figure 40 Manual fork lifter
The speedmaster 52-2p having 2 printing bodies performs printing through two colors
using plates sizing 459x525 mm The setup for the production is the same as the
Speedmaster 74-5 The produced prints are corrected visually by comparing the prints
produced to an ideal print copy and the required intensities of ink to be printed changed
by changing the knob present at the heads of the printing bodies of the machine This
shows that the printing machine is partially automated
Figure 41 shows the image of Speedmaster master 52-2 with control system along with
the printing machine
Figure 41 SM 52-2
312 Production line B
The production line B has two production units speedmaster 52-4 and web-fed offset
printing machine
THESIS DEVELOPMENT 55
OPTIMIZING THE WORK ENVIRONMENT USING LEAN AND CONTINUOUS IMPROVEMENT TOOLS-PRINTING FLOOR MANIVANNAN SAMPATH
Figure 42 shows the image of Speedmaster 52-4 at the production line
Figure 42 SM 52-4
The speedmaster 52-4 has 4 printing bodies using 4 colors for the printing process with
the printing plates sizing 459x525 mm The produced prints are corrected at the
workstation which also has a control station The setup for the production is the same
as the Speedmaster 74-5 The printing machine has a control system separately with the
work station
THESIS DEVELOPMENT 56
OPTIMIZING THE WORK ENVIRONMENT USING LEAN AND CONTINUOUS IMPROVEMENT TOOLS-PRINTING FLOOR MANIVANNAN SAMPATH
Control system
The control system for speedmaster 52 4 is provided with the workstation where the
evaluation works are performed and the input is fed accordingly For example the
thickness of the sheet dimensions of the printing area adjustments of the margins the
flow of die and much more can be performed
Figure 43 shows the images of the control systems for Speedmaster 52-4
Figure 43 A and B control systems for Speedmaster 52-4
Figure 44 shows the image of goods produced by the printing machine SM 52-4
Figure 44 Goods produced at SM 52-4
The next printing unit in this line is the didde web offset printing machine with 4 printing
bodies capable of printing 80m minute Sheets of the maximum length of 340mm to a
minimum of 100mm can be printed The machine is installed spatially along with the
other 3 machines
THESIS DEVELOPMENT 57
OPTIMIZING THE WORK ENVIRONMENT USING LEAN AND CONTINUOUS IMPROVEMENT TOOLS-PRINTING FLOOR MANIVANNAN SAMPATH
Figure 45 shows the picture of didde web-fed printing unit at Marsil
Figure 45 Web-fed Printing unit
Control system
The control systems at these production units assigned along with the printing bodies
The usage of the printing bodies adjusted according to the work needs by removing one
of the gears at a specific printing body that is not involved in the working of the printing
machine
Figure 46 shows the image of goods produced by didde webfed printing machine
Figure 46 Products produced at the webfed unit
THESIS DEVELOPMENT 58
OPTIMIZING THE WORK ENVIRONMENT USING LEAN AND CONTINUOUS IMPROVEMENT TOOLS-PRINTING FLOOR MANIVANNAN SAMPATH
313 Production line C
The Production line c has two printing machines they are heidelberg SORM-Z and
heidelberg GTO 52
The heidelberg SORM-Z semi automated printing machine consists of 2 printing bodies
uses printing plates with size 720x540 mm capable of printing 30 million copies having
printing format maximum of 720x540 mm and minimum of 280x210 mm The machine
is positioned patially along with heidelberg GTO The control system is provided along
with the machine Each machine at the production floor is provided with fire
extinguishers as safety precautions
Figure 47 shows the image of heidelberg SORM-Z at the printing floor
Figure 47 Heidelberg SORM-Z
The heidelberg GTO- 52 capable of printing sheets maximum of 520x360 mm to
minimum of 160x80 mm with two printing bodies printing 8000 sph The control system
for GTO-52 comes along with the printing machine
Figure 48 shows the image of heidelberg GTO-52 at the printing floor
Figure 48 Heidelberg GTO-52
THESIS DEVELOPMENT 59
OPTIMIZING THE WORK ENVIRONMENT USING LEAN AND CONTINUOUS IMPROVEMENT TOOLS-PRINTING FLOOR MANIVANNAN SAMPATH
314 Production line D
The Production line D has 3 heidelberg minivera machines cutting machines striching
machines finishing machines as well as laminating machines at the other half of the
production floor
Three heidelberg minerva machines are used for the purpose of cutting and ceasing with
maximum format of 360x260 mm to a minimum format of 80x50 mm operating at a
speed of 3000 sphFigure 49 shows the 3 heideberg minerva cut and cease machines at
the printing floor
Figure 49 Heidelberg Minerva
The cutting machines each are with specific specification but all does the same work of
cutting required printing sheets for productioncutting works required by the printed
products
Table 2 Shows the specifications of three cutting machines present at the floor
Table 2 cutting machine specification
Model Maximum
format
Minimum
format
Polar-76 760x760 mm 30x760 mm
Polar 78 780x780mm 30x780mm
Polar-92 920x920mm 30x920mm
Figure 50 shows the picture of polar 92 cutting machine
THESIS DEVELOPMENT 60
OPTIMIZING THE WORK ENVIRONMENT USING LEAN AND CONTINUOUS IMPROVEMENT TOOLS-PRINTING FLOOR MANIVANNAN SAMPATH
Figure 50 Cutting machine polar 92
There are two finishing machines at the floor they heidelberg STAHL Ti-52 and Double
600i
Heidelberg STAHL Ti-52 performs actions such as creasing perforating and cutting jobs
in the folder It increases fold quality and allows for a multi-up processing having
processing speed of 200 mminute and 10 mminute as maximum and minimum speed
respectively This machine is used for creating magazines which includes all the above
mentioned actions
Figure 51 shows the image of heidelberg STAHL Ti-52 finishing machine
Figure 51 Heidelberg STAHL Ti-52
The double 600i finishing maching with maximum format of 660x330 mm to a minimum
of 120x180mm performing at a speed of 3750 sph performs the same actions as of
heidelberg STAHL Ti
Figure 52 shows the image of double 600i finishing machine at the printing floor
THESIS DEVELOPMENT 61
OPTIMIZING THE WORK ENVIRONMENT USING LEAN AND CONTINUOUS IMPROVEMENT TOOLS-PRINTING FLOOR MANIVANNAN SAMPATH
Figure 52 Double 600i
32 Problem characterization
The problems in the company were segmented as follows -
1 Missing of machine tools in the printing floor creating a tool room The issue is
when a specific tool is taken for a machining purpose the tool is left somewhere
unnoticed after its use causing difficulties (waste of time) when the same tool is
needed by another worker on the floor no enlistments of the tools neither
proper maintenance of the tool room nor tool chart
Figure 53 shows the tool room used left with residues and the tool board being empty
Figure 53 Pegboard with the missing tools
2 Improper usage of the inkrsquos in the paint room the issue found to be is that inks
are prepared and stored in tins these ink tins are labeled in markers and left
THESIS DEVELOPMENT 62
OPTIMIZING THE WORK ENVIRONMENT USING LEAN AND CONTINUOUS IMPROVEMENT TOOLS-PRINTING FLOOR MANIVANNAN SAMPATH
open once after their use These ink tins do not have any organized setup such
that the tins of different Pantone numbers get mixed up resulting in the
unnoticed behavior of the operator lead to drying of paints and ending as
waste
3 The company has printing machines using printing plates of four varied sizes 400
x 510 mm 450 x 628 mm 605 x 745 mm 615 x 724 mm The printing plates
which are made for the printing works are used and they are kept organized on
the floor according to their client once after the job is completed This has been
followed for a long time and ended up in stacking up vast volumes of printing
plates together which resulted in consuming a lot of time while retrieving those
when there is a reorder of a job made by the client The time taken for a worker
to retrieve a plate for a specific job was found to be 15-30 mins and up to 60
mins at times When a specific printing plate was not to be found set of printing
plates for the concerned job is made and provided to workers resulting in added
wastage of the production time
Figure 54 shows the image of plates arranged on the floor according to their clients
Figure 54 Printing plates arranged on the floor according to their clients
33 Objective
The aim of this thesis is to improve the conditions of the above-stated problems at
Marsil with the help of lean tools and continuous improvement tools by
bull Creating a tool room for the machinery works to take place and to create a tool
chart for organizing tools
bull Creating a system for organizing the ink tins in the paint room
THESIS DEVELOPMENT 63
OPTIMIZING THE WORK ENVIRONMENT USING LEAN AND CONTINUOUS IMPROVEMENT TOOLS-PRINTING FLOOR MANIVANNAN SAMPATH
bull Implementing a system for the printing plates to be organized and quick retrieval
of the plates from the system for the printing jobs
34 Brainstorming
Brainstorming is a process of generating ideas and solutions through fast thinking and
group discussion In this section brainstorming is made on the problems said by the
management and possible solutions and ideas were reached
341 Objective A
Brainstorming sessions were made on the creating a tool room consisting of a tool-chart
The problem seen was the tool room stuffed with many printed goods machines and
with residues of works performed in the room
Figure 55 shows various causes that led to the missing of tools on the production floor
as well as unmanaged tool room
Figure 55 Cause and Effect diagram on missing tools and unmanaged paint room
Researches were done on the process of creating a system that keeps tracks on the
usage of tools and controlling the flow of resources from the pegboard Kanban pull
system is studied where the goal of such a system is to replace what has been consumed
at that time when resources are needed or asked Here in this system color cards
(Kanban cards) of different colors will be used to show the availability of the resource in
the clipboard Layout of the working floor made by showing the production lines and the
working areas as blocks in different colors The color of each production line shows the
color card or the Kanban card assigned to it
THESIS DEVELOPMENT 64
OPTIMIZING THE WORK ENVIRONMENT USING LEAN AND CONTINUOUS IMPROVEMENT TOOLS-PRINTING FLOOR MANIVANNAN SAMPATH
In preparing setting up the system the documentation of the work which includes the
checklists of the available tools and machinery should be made and checked the working
of the system is then explained to all the operators in the printing floor and the system
should be studied regularly
342 Objective B
The issue said to be the lack in the organization of ink tins in the paint room Inks are
prepared according to the production needs ie when the job sheet reaches the
respective production unit on the printing floor press operator decides to make the
required ink for the production use for that specific job The ink is prepared with the
help of the Pantone matching system which shows the required quantity of colors to be
mixed in creating that ink which is then stored in tins
After the production process in preparing the prints of a job is completed tin consisting
the remaining quantity of ink is labeled with Pantone number by markers as indicators
and are stored in the paint room These paint tins are left unnoticed due lack of proper
arrangement which is left to dry and is not used again to solve this issue discussions
were made and an idea was proposed in arranging the ink tins according to Pantone
series
Figure 56 shows the various causes their part leads to unorganized ink tins and drying
of paints
Figure 56 Cause and effect diagram on unorganized ink tins
Discussions were made and ideas were explored on areas of warehouse codification
and arranging the ink tins in a better way for easy accessibility and labeling of the ink
tins
THESIS DEVELOPMENT 65
OPTIMIZING THE WORK ENVIRONMENT USING LEAN AND CONTINUOUS IMPROVEMENT TOOLS-PRINTING FLOOR MANIVANNAN SAMPATH
343 Objective C
The problems told by the management before working on the printing plates were the
operators spend much longer time in searching for the printing plates when there is a
job that needs printing plates produced before as because many clientrsquos requests
reorder and they do not have a system for organizing the printing plates
The first scenario was printing plates kept on the floor according to the clients with
support to the wall Since the company provide service to many clients there exist many
printing plates associated to many job numbers The workers receive the order sheet
have the order made by the client which consists of the order number size of the plate
number of plates to be used for the specific job and a preview copy of the same job that
was done long before The order sheet also includes the work of the previous jobs
carried on the same work with few variations So this ensures that there are many job
sheets of different order numbers of the same work The management also told that if
there are changes in a job that has been done before the plate manufacturer prepares
the new plates for job updates the order sheet of the job This order sheet and the plate
along with plates is received by the operator and the job is carried out The plates are
arranged along with other plates that were made for the same client The operators in
the printing floor said that it might take them 30-45 mins or even more when they are
trying to retrieve plates for reorders
Figure 57 shows the cause and effect diagram on setup made by the organization
Figure 57 Cause and effect diagram on printing plate setup made by management
THESIS DEVELOPMENT 66
OPTIMIZING THE WORK ENVIRONMENT USING LEAN AND CONTINUOUS IMPROVEMENT TOOLS-PRINTING FLOOR MANIVANNAN SAMPATH
Discussions made with operators and the management about a system for the
organization and retrieving the plates in a short span of time Researches made onto
check types of storing systems available in the market for organizing the plates Results
were found with systems capable of hanging the plates to it with the help of hooks with
covers for the plates and found to be expensive Hence disagreed by the management
In minimize the usage of production time in searching for the printing plates for an
order the organization suggested arranging the printed plates inside the cardboard
boxes(boxes of the printing plates when bought newly) The method proposed to be
simple that involves arranging the plates inside the boxes and specifying a number on
the boxes that will be written in the order sheet that the operators receive The capacity
of each box found to be 60 and arranging 60 plates in those will be seeming to be
congested and will be difficult for the operators in retrieving the necessary plates
needed for a job and will consume a lot of space and requires work to be done while
arranging them in boxes
The printing plates have information such as the companyrsquos name model number job
number sheet number date of manufacturing the plates So all these need to be
considered while designing the system for the organization of the printing plates
The company had resources in implementing three racks with the length of 240 cm The
idea was to divide the rack of length 240 cm into 54 slots with separators between each
slot The thickness of the separators is 04 cm and the width of each slot is 4cm a rough
estimation of 35-40 plates each of 450 x 628 mm shall be placed into those slots and a
total of 2160 plates can organize into these 54 slots divided from 240 cm length rack
Identification of the plates can be made by code which has a combination of an alphabet
and number The codification will be made by assigning an alphabet to each row and a
number to each slot Here the alphabets A B C assigned to the three racks and the
numbers from 1- 54 assigned to the slots Hence the plates can be arranged into the
slots which give the slot locations as A1 A2 A3 119860119899etc
Figure 58 below-mentioned flowchart shows the flow of work from receiving the order
manufacturing the printing plates operators receiving the plates for production
management decision on saving the plates or throwing them away as thrash
THESIS DEVELOPMENT 67
OPTIMIZING THE WORK ENVIRONMENT USING LEAN AND CONTINUOUS IMPROVEMENT TOOLS-PRINTING FLOOR MANIVANNAN SAMPATH
THESIS DEVELOPMENT 68
OPTIMIZING THE WORK ENVIRONMENT USING LEAN AND CONTINUOUS IMPROVEMENT TOOLS-PRINTING FLOOR MANIVANNAN SAMPATH
Figure 58 Flow chart
THESIS DEVELOPMENT 69
OPTIMIZING THE WORK ENVIRONMENT USING LEAN AND CONTINUOUS IMPROVEMENT TOOLS-PRINTING FLOOR MANIVANNAN SAMPATH
35 SWOT analysis of possible solutions
In this section SWOT analysis is made on the ideas proposed for the aim to understand
the strength weakness opportunities and threats involved in implementing the ideas
351 Objective A SWOT analysis
The SWOT analysis made on the idea to be implemented in creating a tool chart
distribution of tools to all the units at the printing floor and in the maintenance of the
tool room
Figure 59 shows the SWOT analysis of Strength weakness opportunity and threats
involved in implementing the tool 5s and in creating the tool chart
Figure 59 SWOT analysis on objective A
352 Objective B SWOT analysis
The SWOT analysis performed on organizing the ink tins on shelves shows various
strengths weakness opportunities threats gathered giving enough support in
implementing the system
Figure 60 shows the strength weakness opportunity and threat involved in creating a
system for organized ink tins
THESIS DEVELOPMENT 70
OPTIMIZING THE WORK ENVIRONMENT USING LEAN AND CONTINUOUS IMPROVEMENT TOOLS-PRINTING FLOOR MANIVANNAN SAMPATH
Figure 60 SWOT on objective B
353 Objective C SWOT analysis
The SWOT analysis structured on the idea of creating a system in organizing the printing
plates into it The positive effects in using the continuous improvement tool in
implementing the system and gathering of data about the plates and configuring them
in working together to work efficiently
Figure 61 shows the Strength weakness opportunity and threats involved in creating
two systems for organizing the plates
THESIS DEVELOPMENT 71
OPTIMIZING THE WORK ENVIRONMENT USING LEAN AND CONTINUOUS IMPROVEMENT TOOLS-PRINTING FLOOR MANIVANNAN SAMPATH
Figure 61 SWOT on objective C
36 Implementation
This section shows the practice of the continuous improvement and other lean tools on
each of the objectives and their procedures in implementing the steps and achieving the
results
361 Implementation of 5S
Implementation steps
1 The tool room was initially seen filled with printed goods and with other finished
materials These printed materials were considered waste by the company since
they were outdated and did not add any value Hence they were cleared from
the tool room
2 Tools except machinery tools (tools that came along with the machine) were
collected from every production line and an inventory list of the available tools
in the printing floor was made Tools that were needed or requested by any
operator were bought so the missing tools were covered
Figure 62 shows the image of tools collected as being a step in implementing 5s
THESIS DEVELOPMENT 72
OPTIMIZING THE WORK ENVIRONMENT USING LEAN AND CONTINUOUS IMPROVEMENT TOOLS-PRINTING FLOOR MANIVANNAN SAMPATH
Figure 62 Collected tools
3 Tools are left to hang on the pegboard with the help of hooks Organization of the
tools were done according to increase in the order of their sizes for each category
of tools and were arranged in such a way that the entire pegboard is filled with
the available tools
4 The entire tool room was cleaned and for the distribution of tools to the
machines at the printing floor Kanban system was studied and the use of
Kanban cards to effectively implement the pull system
5 The entire layout of the printing floor with production lines was designed During
this process production lines in the floor have been segmented and were
assigned to a specific color in the layout design The Kanban cards of colors Red
green yellow orange dark blue brown and purple were made These Kanban
cards represents the segmented production units designed in the layout
Figure 63 kanban cards of different colors created to replace the tool spot in absence of
tools from the peg board
Figure 63 Kanban cards
THESIS DEVELOPMENT 73
OPTIMIZING THE WORK ENVIRONMENT USING LEAN AND CONTINUOUS IMPROVEMENT TOOLS-PRINTING FLOOR MANIVANNAN SAMPATH
Figure 64 shows the simple layout of the printing floor with the position of production
units defined in colors to show the Kanban cards assigned to those units
Figure 64 Simple floor layout is highlighting the production units in colors
6 The designed printing floor layout along with the Kanban cards left to hang
alongside with the pegboard to visually help the operator to understand the
system
Working of the system
The system works with the help of the color cards
bull When an operator needs a tool for a specific work to be performed the operator
should check the layout designed which shows the production line and the
associated color
bull The next step is pick up a color card of the production line and place it in the place
where the tools are rested in the pegboard Placing the color card in the tool place
shows that the tool is in use
bull The tool that is taken for performing work is returned by dropping down the color
card from the pegboard and replacing it with the tool that is taken
Standardized procedures have been written on the working of the system usage of the
5s method and were explained to the workers using the Kanban card system
implemented This also includes the documentation work on the inventory list of all the
available tools on the clipboards and their quantities This stage of 5s educates everyone
on the printing floor about the implemented method and to increase awareness about
the maintenance of the tool room and about the usage of the tools
THESIS DEVELOPMENT 74
OPTIMIZING THE WORK ENVIRONMENT USING LEAN AND CONTINUOUS IMPROVEMENT TOOLS-PRINTING FLOOR MANIVANNAN SAMPATH
Figure 65 shows the inventory list taken while performing the tool 5s
Figure 65 inventory list of tools
7 Once after implementation and explaining the working of system to all operators
the tool room was inspected for a period During this period the entire system
was evaluated by using a checklist of available tools and tools on the pegboard
It was also seen that the tool room is cleaned regularly and the usage of the cards
by operators while selecting a tool and returning it was followed
Figure 66 and Figure 67 shows the images of the tool room before and after
implementation of the 5s tool
THESIS DEVELOPMENT 75
OPTIMIZING THE WORK ENVIRONMENT USING LEAN AND CONTINUOUS IMPROVEMENT TOOLS-PRINTING FLOOR MANIVANNAN SAMPATH
Figure 66 Toolroom before implementation
Figure 67 Toolroom after implementation
362 Implementation of 5S in paint room
Implementation steps
1 Initially ink tins were checked to confirm that the inks are in good condition or
whether they have dried By doing so the tins with proper ink separated from
the bad ones and were gathered in a separate place in the paint room
2 Space is created after moving the tins and resources for building the racks in the
paint room were bought by the management 2 columns each with 5 racks
constructed with the help of nuts and bolts 3 Labels for showing information such as the Pantone number and for showing the
odd and even sides of the rack were designed and printed Each column has five
racks where the left side of the first rack label mentioned as ldquoseries starting with
1 -ending with an odd numberrdquo and on the right side of the rack ldquoseries starting
with 1 and ending with the even numberrdquo were struck Similarly for Pantone
THESIS DEVELOPMENT 76
OPTIMIZING THE WORK ENVIRONMENT USING LEAN AND CONTINUOUS IMPROVEMENT TOOLS-PRINTING FLOOR MANIVANNAN SAMPATH
series 2 till Pantone series 10 labels are struck on both sides of the rack showing
the odd and even sides of the series
Figure 68 shows label struck on shelf as indicators for organizing the ink tins
Figure 68 Labels as indicators
4 After indicators were struck on the racks labels for showing Pantone number
were struck on the ink tins and the Pantone number is written on them The
Pantone number is written to show the ink associated with it and ink tins were
organized according to indicators on the racks For example consider a ink tin
labeled with Pantone number 8442 which starts with series 8 and ends with an
even number so this ink tin should be placed on the side of the rack labeled
ldquoseries starting with 1 and ending with the even numberrdquo The process was
carried out for all tins and were organized on the racks
Figure 69 shows the label designed for ink tins
Figure 69 Lable for ink tins
5 Later the room was cleaned and method of organizing ink tins on the racks were
explained to the press operators Procedures on how to use the racks were
THESIS DEVELOPMENT 77
OPTIMIZING THE WORK ENVIRONMENT USING LEAN AND CONTINUOUS IMPROVEMENT TOOLS-PRINTING FLOOR MANIVANNAN SAMPATH
documented and displayed next to the racks for operators understanding
purposes and as part of work ethics
Figure 70 shows ink tins organized in shelves with labels as indicators according to the
Pantone numbers
Figure 70 Ink tins arranged on shelves after implementation
363 Implementation of PDCA
The implementation of printing plate system is gone ahead with the help of PDCA (plan
do check act) cycle
The plates arranged on the floor includes plates manufactured from the year 2005till
present The management also said that there are plates outdated due to changes made
from the client side The plates used for the production process are picked by operators
by searching in the place where the plates according to clients are placed This time for
retrieval of the plates for the production reported being high so performance sheets
were given to the operators for recording the time
Table 3 Shows time taken by operators in retrieving the plates for various jobs before
implementation
THESIS DEVELOPMENT 78
OPTIMIZING THE WORK ENVIRONMENT USING LEAN AND CONTINUOUS IMPROVEMENT TOOLS-PRINTING FLOOR MANIVANNAN SAMPATH
Table 3 Time taken before implementation
SL No Job Number Time-Taken
1 173815 10 mins
2 173780 15 mins
3 173791 15 mins
4 180085 10 mins
5 171060 10 mins
6 174604 30 mins
7 174546 15 mins
8 180018 40 mins
9 174117 15 mins
10 174085 15 mins
Jobs are carried out after wasting the production time in searching for plates and the
average time in searching the plates for these ten jobs is 17 min and 5 seconds
Implementation steps
1 By obtaining a list of companies that have made changes the separation process
will begin The changes include updated logo of the clients updated capitais
sociais most of the clients were private banks having new capitais sociais
number The separation process started by looking at the information on each
plate and the preview sheet attached to it Around 1000 plates considered waste
during the process of separation
THESIS DEVELOPMENT 79
OPTIMIZING THE WORK ENVIRONMENT USING LEAN AND CONTINUOUS IMPROVEMENT TOOLS-PRINTING FLOOR MANIVANNAN SAMPATH
Figure 71 shows the image of plates segregated while taking inventory and arranged on
pallets
Figure 71 Separation of plates in pallets
Figure 72 shows the image consisting data about capitais socials of various clients
Figure 72 Information regarding captais socials
2 The printing plates with information regarding client job number model number
and date of manufacturing of the plates etc used in creating a list of inventories
of all the plates in Microsoft Excel
THESIS DEVELOPMENT 80
OPTIMIZING THE WORK ENVIRONMENT USING LEAN AND CONTINUOUS IMPROVEMENT TOOLS-PRINTING FLOOR MANIVANNAN SAMPATH
Figure 73 shows information about the plate used in creating the inventory list of all the
plates
Figure 73 Information about the plate
3 The company had resources where three racks each of 240 cm in length stacked
one upon the other for the plates sizing 450 x 628 mm and another three racks
of the same length for the plates sizing 605 x 745 mm were installed
respectively The design of the system was discussed with a local carpenter and
the dimensions recorded for the creation of a prototype
Figure 74 shows the image of the prototype being created by placing the separators in
between the slots for plates to be stored
Figure 74 Image taken during the creation of the prototype
THESIS DEVELOPMENT 81
OPTIMIZING THE WORK ENVIRONMENT USING LEAN AND CONTINUOUS IMPROVEMENT TOOLS-PRINTING FLOOR MANIVANNAN SAMPATH
4 The prototype of length 240 cm consisting of 27 slots each of 4 cm in width with
separators in between the slots was designed and installed The prototype was
inspected by placing 35-40 plates of few job numbers on single slot and
operators on the working floor were asked to pick a specific job from the plates
that were kept in the slot The operators were able to pick the specific job plates
in the noticeably time span of 2 mins finally the entire system was made and
installed for 450 x 628 mm and 605x745 mm size plates
5 Plates belonging to a set of job numbers were placed into the slots and their
position in the system is mentioned in the inventory list The position of the
plates will be decided by an alphabet that stands for each row and the numbers
for each slot Considering a random job number 180176 say has 6 plates and they
are kept in the 15th slot of row A so the position of the plates of that specific job
number will be A15 Similarly all plates were arranged into the system and their
positions are updated in the inventory list
Figure 75 shows the information about the plates organized in the system and their
positions mentioned as slot numbers
Figure 75 Inventory list of the plates
6 Apart from the plates that were organized into a system there are plates that will
be manufactured for new jobs or any changes to the previous job will be
regarded as new plates Here the new plates will replace the plates of the
previous job and the job number is updated in the inventory list
7 The system will become full by adding new plates and this makes the system to
be congested and difficult for operators to handle to avoid this situation some
plates must be removed from the system
Figure 76 shows the image of plates into the system with lables for identifying the plates
at the respective slots
THESIS DEVELOPMENT 82
OPTIMIZING THE WORK ENVIRONMENT USING LEAN AND CONTINUOUS IMPROVEMENT TOOLS-PRINTING FLOOR MANIVANNAN SAMPATH
Figure 76 image of plates organizeed with labels
8 Removal of plates from the system needs either the plate should be outdated or
changes in any job made from the clientrsquos side or when there is a complete
change in for a new season from the client
9 The system was full after organizing the plates and space for arranging new plates
is gathered by removing old plates which are manufactured in 2010 2011
20122013 400 plates were removed giving space for new printing plates to rest
in the system
10 The system was set completely and evaluating sheets were given to the
operators of the production lines to make a note of the timing spent on retrieving
the plates from the system
Error Reference source not found shows the time taken by the operators in retrieving
the plates for the jobs to be done It also says that the time taken by operators has been
reduced and the average time is taken in searching for the plates of the jobs found
reduced to 2 minutes and 3 secs
THESIS DEVELOPMENT 83
OPTIMIZING THE WORK ENVIRONMENT USING LEAN AND CONTINUOUS IMPROVEMENT TOOLS-PRINTING FLOOR MANIVANNAN SAMPATH
Table 4 Time observation after implementation
SL No Job Number Time Taken
1 153517 2 mins
2 174172 3 mins
3 163923 2 mins
4 180634 2 mins
5 170890 2 mins
6 181293 3 mins
7 162477 2 mins
8 173660 2 mins
9 173373 2 mins
10 162185 3mins
ChartGraph 1 shows the comparison of the time-taken in retrieving the plates during
before implementation and after implementation of the system
ChartGraph 1 Comparison of time on before and after implementation
0 5 10 15 20 25 30 35 40 45
1
2
3
4
5
6
7
8
9
10
Time
Job
after implementation before implementation
THESIS DEVELOPMENT 84
OPTIMIZING THE WORK ENVIRONMENT USING LEAN AND CONTINUOUS IMPROVEMENT TOOLS-PRINTING FLOOR MANIVANNAN SAMPATH
Figure 77 shows the image of plates organized on floor before implementation of the
system for storing plates
Figure 77 Before implementation
Figure 78 shows the image of plates organized into the systems created with labels as
indicators for slots and racks
Figure 78 After implementation
11 Systems of organizing plates for the plates sizing 459x525 mm and 605x745 mm
having a capacity of 6800 and 4000 were setup respectively
12 The system is reviewed often such that it does not overflow and causing the
workers to adapt to the earlier situation of arranging the plates on the floor
Inspections are made to check whether there are old plates
The cost of material used in making the system is 300euro
Labour cost in creating the system according to the specifications is 1700euro
Total cost in creating systems for 2 different sizes is 2000 euro
THESIS DEVELOPMENT 85
OPTIMIZING THE WORK ENVIRONMENT USING LEAN AND CONTINUOUS IMPROVEMENT TOOLS-PRINTING FLOOR MANIVANNAN SAMPATH
It is the responsibility of the management to be updated in the orders of the clients at
each season and to follow the cycle to keep the system working
SMED Practice
The Single Minute Exchange of die (SMED) tool is performed when the setup process
for the jobs seem to consume a lot of production timeAt the end of each production
the products produced unloaded to a pallet and the operator continues for the next
setup process of productionOperator looking at the job sheet searches for required
printing plates or the operator will receive the plates in case if the job is new
Activities carried out before the setup operation are mentioned below-
bull The setup process includes cleaningchanging of plates
bull Changing ink at the printing bodies of the printing machine
bull filling up the paper tray at the feeding unit of the printing machine
bull cleaning of impression cylinder(rubber) in each printing body
bull changing the ink absorbing cloth at each head for every 24 jobs
Implementation steps
1 The tool was performed on speedmaster 52-4 speedmaster 74-5 and the
speedmaster 52-2 and data about the setup times for different jobs are
gathered
Table 5 shows the performed actions during the setup phase and their time averages
THESIS DEVELOPMENT 86
OPTIMIZING THE WORK ENVIRONMENT USING LEAN AND CONTINUOUS IMPROVEMENT TOOLS-PRINTING FLOOR MANIVANNAN SAMPATH
Table 5 Average time of actions performed on three machines
Sl no Actions performed SM 52-2 SM 52-4 SM 74-5
1 Cleaning of machine 33125 31175 3828333
2 Searching the plate 09675 2513333 12
3 Cleaning of plates 1795 3505 3263333
4 Removing plate of
the earlier job 16425 15825 153
5 Introducing ink 14325 2413333 2883333
6 Introducing plate and
input 17575 29775 4976667
7 Setting up paper 5415 82425 1145
8 Average setup time 163225 2312 2669
2 The actions performed during the calculation of setup times were almost similar
in all the three machines The average setup time calculated and found to be
1632 2312 2669 for SM 52-2 SM 52-4 SM 74-5 machines respectively
3 The time is taken for the actions performed compared with all the three
machines and grouped as internal and external actions ie The movement of
the operation involving the work done during the setup process recorded as stop
events occurring at the printing machines on event log sheets in minutes with
the help of stopwatch
Table 6 shows the actions performed by the operators during the setup process
segmented into internal and external actions
Table 6 Performed actions categorized into internal and external
Internal actions External actions
Changing of plates Few prints were taken after setup
Changingintroducing ink Production after setup
Cleaning of printing plates Evaluation
Searching for needed printing sheets
Searching for pallets for transferring
finished products
THESIS DEVELOPMENT 87
OPTIMIZING THE WORK ENVIRONMENT USING LEAN AND CONTINUOUS IMPROVEMENT TOOLS-PRINTING FLOOR MANIVANNAN SAMPATH
4 The next step is the conversion of possible internal elements into external
elements ie actions performed during off state of the machine performed
when the machine is running
5 The total time spent on performing the internal actions is higher than the time
spent on the external actions Here the possible internal actions that can be
performed during machine operation are searching searching for needed
printing sheets An average of 5415 8241145 minutes spent in printing
machines SM 52-2 SM 52-4 SM 74-5 respectivelyin searching for new printing
sheets and to get printed samples
6 The average time spent on searching for the plates for the jobs is 251 in case of
SM 54-5 and being less in the other two machines is because of new jobs In the
case of new jobs plates are produced and handed over to the printing operators
in prior
7 The time on searching for new printing sheets and as well as cutting can be solved
by having the right material flow to all the printing machines in the printing floor
In explaining the scenario places next to the printing machines of SM 52-2 and SM 52-4
are occupied by printed stock materials
Figure 79 shows the picture of finished goods to be used for production stored at the
production floor
Figure 79 shows the space occupied by printed goods right near the printing machines
Goods are mostly printed materials of invite cards designation cards documented
forms of many clients stored on pallets The space occupied by these goods can be used
for storing the printing sheets needed by the printing machines The printed materials
for production use can be stored at the huge shelves made for organizing the printing
materials like coated papers and papers of different GSMs These shelves must be
categorized labelled and organize printing papers according to their availability during
production process
Figure 80 shows the image of shelves for storing purposes near the loading area at the
printing floor
THESIS DEVELOPMENT 88
OPTIMIZING THE WORK ENVIRONMENT USING LEAN AND CONTINUOUS IMPROVEMENT TOOLS-PRINTING FLOOR MANIVANNAN SAMPATH
Figure 80 Shelves for storing purposes
The proposal is by hiring a worker performing the internal activities like searching of the
plate cleaning of plates searching for needed papers ink for production from the paint
room and every other possible helps that an machine operator requires
In the total production time of 10 hrsday 2 hrs is spent on internal activities by the
operators
In justifying the above-mentioned proposal in hiring an employee
Total production time wasted on the printing floorday = 120 mins
Production cost hr on Speedmaster 522=30 euro
Production cost hr on Speedmaster 524 = 30 euro
Production cost hr on Speedmaster 745 = 60 euro
The operators from SM 522 and SM 524 together and SM 74-5 consume 1 hour each
respectively in doing all the internal operation for a day
Total production loss day =120 euro
Total production loss month =12020=2400 euro
The minimum wage of an employee in Portugal =67667 euro
Total savings by hiring an employee for a month=2400-67667=172333euro
So by hiring an employee for all the printing machines time spent in searching of the
plate cleaning of plates cutting required papers ink for production from the paint
room moving finished products to loading area can be conserved thereby increasing
productivity in the company
89
ltTIacuteTULO DA TESEgt ltNOME DO AUTORgt
CONCLUSIONS
51 CONCLUSIONS
52 PROPOSALS OF FUTURE WORKS
CONCLUSIONS 91
OPTIMIZING THE WORK ENVIRONMENT USING LEAN AND CONTINUOUS IMPROVEMENT TOOLS-PRINTING FLOOR MANIVANNAN SAMPATH
CONCLUSIONS AND PROPOSALS OF FUTURE WORKS
51 CONCLUSIONS
The study of lean tools and continuous improvement tools at the literature part of this
thesis proves to be significant support in terms of knowledge about understanding
waste and its different forms in the organization The terms regarded as waste as
discussed in section 2324 The problems faced by the company at each scenario
proven to contribute a considerable amount of time wastage in the setup process of the
production
The use of Ishikawa(fishbone diagram) a quality tool in addressing the root causes of the
issues was proven useful and helped in providing a guideway in solving those causes
see section 341342343 The benefits observed in using Ishikawa were Understood
and issues ewere analysed Identify the root cause of the issue Provide ways to improve
the process related to the issue In-depth in discussion of issue Helps in prioritizing the
analysis made and choosing corrective actions The corrective actions are analyzed by
categorizing them according to strengths- results that can be achieved using the
corrective actions weakness- possible scenario where it can go wrong opportunity to
introduce something new that can improve the operation and threats involving the
possible events where the actions reaches bottleneck and required inspections to be
followed periodically This helped in studying the system implemented in complete and
futher update in working of the system Section 351352353
The implementation section 36 explains the corrective actions performed periodically
for each problem reported by the organization of the company Each implementation
process is carried out following the steps involved in the tool adopted The creation of
tool room and tool chart involves the use of 5s along with Kanban shows the distribution
management of the tools at the production floor and management of tool room This
created awareness about the use of tools availability of the tools returning them to the
pegboard and cleanliness of the tool room after use The arrangement of ink tins in
shelves according to the Pantone number found to be helping the operators in obtaining
the required ink tins quickly Inspections gave improving results in following the
procedure for arranging the tins by the operator when they have the need to create
another Pantone color in a separate tin The creation of systems for the arrangement of
printing plates involves the use of PDCA during implementation which helped in
planning the system with available resources the capability of the system as well as the
design of the system according to two different plate sizes Results obtained after
CONCLUSIONS 92
OPTIMIZING THE WORK ENVIRONMENT USING LEAN AND CONTINUOUS IMPROVEMENT TOOLS-PRINTING FLOOR MANIVANNAN SAMPATH
implementation found to be satisfying that the time taken for retrieving the plates from
the systems has been reduced from an average of 17 minutes to 3 minutes Minimized
space in arranging the plates records of the plates existing the system updating the
system whenever changes with clients occur are the improvements made regarding the
printing plates Finally SMED is performed in figuring out the setup activities and time
involved in performing those activities where the results of the setup times regarding
the printing plates and ink from the paint room found to have contributed in the setup
time of jobs carried at production units but there are other activities like searching for
required printing sheets for production consumes an average of 5415 8241145
minutes and seconds were recorded for the machine namely SM 52-2 SM 52-4 SM 74-
5 respectively see section 4 Proposals for solving the issue about acquiring required
printing sheets mentioned in section 52
The use of lean tools and continuous improvement tools have proven to have made
changes in terms of space occupied the time taken in performing actions effective
management of tool room tool chart and insight in solving other actions in the setup
process
52 PROPOSALS OF FUTURE WORKS
The work will be done for reducing the time needed to receive the printing sheet at each
machine This can be achieved by taking inventory of the goods present on the printing
floor and then moving them in pallets to a separate place ThePrinted goods are then
moved to the storage room created giving free space for the supply of printing sheets
for the production processon the printing floor The created space will be segmented
for allowing the required printing sheets for the job and for storing the finished products
temporarily
93
ltTIacuteTULO DA TESEgt ltNOME DO AUTORgt
REFERENCES AND OTHER
SOURCES OF INFORMATION
REFERENCES AND OTHER SOURCES OF INFORMATION 95
OPTIMIZING THE WORK ENVIRONMENT USING LEAN AND CONTINUOUS IMPROVEMENT TOOLS-PRINTING FLOOR MANIVANNAN SAMPATH
REFERENCES AND OTHER SOURCES OF INFORMATION
[1] C C Yew and E Tan The Print Industry An Overview Information Services
Division National Library Board 2005
[2] [Online] Available ttpscollegegradcomindustriesprinting
[3] weebly [Online] Available httpsinvention-of-the-printing-
pressweeblycomeconomic-impacthtml
[4] J Dittmar Information Technology and Economic Change The Impact of the
Printing Press 2010
[5] E L Eisenstein The Printing Press as an Agent of Change Communications and
Cultural Transformations in Early-Modern Europe Cambridge University
Press 1979
[6] J-F Gilmont Printing at the dawn of the sixteenth centuary in The
Reformation and the Book Ashgate Aldershot 1998
[7] Engineering 360 by IEEE Global Spec [Online] Available
httpswwwglobalspeccomlearnmorematerial_handling_packaging_equi
pmentpackaging_labelingindustrial_printing_equipment [Accessed 25
september 2018]
[8] Flexography principles and practices Foundation of Flexographic Technical
Association
[9] T Dunn Manufacturing Flexible Packaging
[10] H Walter Process of letterpress printing
httpspatentsgooglecompatentUS2268594Aen Patent US2268594A
1939
REFERENCES AND OTHER SOURCES OF INFORMATION 96
OPTIMIZING THE WORK ENVIRONMENT USING LEAN AND CONTINUOUS IMPROVEMENT TOOLS-PRINTING FLOOR MANIVANNAN SAMPATH
[11] H Kipphan Hand book of Print Media technology and production methods
Springer-Verlag
[12] H Johnson and C D Tobie Digital printing startup guide Stacy L Hiquet 2005
[13] FACT SHEET SERIES-OFFSET PRINTING Print amp Copy Bureau Roger Stevens
Building University of Leeds
[14] offset pressman [Online] Available
httpoffsetpressmanblogspotcom201109short-history-of-offset-
printinghtml
[15] GRISO Print Solutions [Online] Available httpwwwgriso-
chemiecomenservicegeschichte-offsetdruck
[16] S H H Y Y A H H S K SUBRAMANIAM Machine efficiency and man
power utilization on production lines in 8th WSEAS Int Conf on
ELECTRONICS HARDWARE WIRELESS and OPTICAL COMMUNICATIONS
[17] N SAni kumar production and operations management New Age
International Publishers
[18] L B T Abdel-Malek A framework for the economic evaluation of production
system and product design alternatives for robot assembly International
Journal of Production Research vol 23 p 197ndash208 1985
[19] M S Y Y K K I a S N Yoshimura A rapid analysis method for production
line design International Journal of Production Research vol 44 no 6
2006
[20] D B M a B W Spath Springer Handbook of Automation Springer 2009
[21] R G S G B M K T Bley H Appropriate Human Involvement in Assembly and
Disassembly CIRP Annals ndash Manufacturing Technology 2009
[22] T L A V J Kruumlger Cooperation of human and machines in assembly lines
[23] T L A V J Kruuml ger Cooperation of human and machines in assembly lines
CIRP Annals - Manufacturing Technology 2009
REFERENCES AND OTHER SOURCES OF INFORMATION 97
OPTIMIZING THE WORK ENVIRONMENT USING LEAN AND CONTINUOUS IMPROVEMENT TOOLS-PRINTING FLOOR MANIVANNAN SAMPATH
[24] N Galway unit 13 automated production lines in Production lines NUI
Galway p 33
[25] J Liker The Toyota Way 14 Management Principles from the Worldrsquos Greatest
Manufacturer New York McGraw-Hill 2004
[26] G a W J Miltenburg The u-line line balancing problem Management
Science vol 40 no 10 1994
[27] J S L W L G M Gao An efficient approach for type II robotic assembly line
balancing problems Computer and Industrial Engineering 2009
[28] G R J S B Levitin A genetic algorithm for robotic assembly line balancing
European Journal of operational Research 2006
[29] T C L C G S S L M Adalberto Sato Michels The Robotic Assembly Line
Design (RALD) problem Model and case studies with practical extensions
Computers amp Industrial Engineering 2018
[30] P j Wallin Robotics in the Food Industry An update Trends in Food Science
amp Technology 1997
[31] J a H M Bicheno The Lean toolbox Buckingham PICSIE Books 2016
[32] A Weber Lean Workstations Organized for Productivity 2005
[33] A Maslow A theory of human motivation Psychological review 1943
[34] S a G R Ghosh A comprehensive literature review and analysis of the design
balancing and scheduling of assembly systems International Journal of
Production Research vol 27 no 4 1989
[35] L T D C D K N H B Tran Minh Canh A case study in Whittier woods
furniture in 13th International Conference Việt Nam 2013
[36] W L Kilbridge M A heuristic method of assembly line balancing Journal of
Industrial Engineering vol 24 no 2 p 292 1961
[37] G Srinivasan Operations and Supply Chain Management Department of
Management Studies Indian Institute of Technology Madras Chennai
REFERENCES AND OTHER SOURCES OF INFORMATION 98
OPTIMIZING THE WORK ENVIRONMENT USING LEAN AND CONTINUOUS IMPROVEMENT TOOLS-PRINTING FLOOR MANIVANNAN SAMPATH
[38] C M Harland Supply Chain Management Relationships Chains and
Networks British Academy of Management 1996
[39] G a M Q Easton Single and Multiple Network Sourcing - Network
Implications in 6th IMP Conference Milan 1990
[40] M G Christopher Logistics and Suppry Chain Management LondonUK
Pitman Publishing 1992
[41] L M Ellram lsquoSupply Chain Management The Industrial Organisation
Perspective International Journal of Physical Distribution and Logistics
Management vol 21 no 1 pp 13-22 1991
[42] T P b G M Daniel E Ufua a Systemic Lean Intervention Enhancing Lean
with Community Operational Research European Journal of Operational
Research 2017
[43] J amp J D T Womack Lean Thinking Banish Waste and Create Wealth for Your
Corporation New York Simon and Schuster 1996
[44] T C Salonitis K Drivers and Barriers of Lean Implementation in the Greek
Manufacturing Sector Procedia CIRP 7189ndash194 2016
[45] J A F Joliveira continuous improvement through lean tools An application
in a mechanical company Manufacturing Engineering Society International
Conference 2017 MESIC 2017 28-30 June 2017
[46] M V Ramunė Čiarnienėa An Empirical Study of Lean Concept Manifestation
11th International Strategic Management Conference 2015 2015
[47] K S Y X Mudhafar Alefari The role of leadership in implementing lean
manufacturing The 50th CIRP Conference on Manufacturing Systems 2017
[48] G Howell rdquoWhat is Lean Constructionrdquo Proceeding Seventh annual
Conference of the International Group for Lean Construction 1999
[49] C Ohaegbunam AN OPERATIONS MANAGEMENT PERSPECTIVE ON WASTE
MANAGEMENT IN A FOOD PROCESSING FACTORY Tampere University of
Applied Sciences 2015
REFERENCES AND OTHER SOURCES OF INFORMATION 99
OPTIMIZING THE WORK ENVIRONMENT USING LEAN AND CONTINUOUS IMPROVEMENT TOOLS-PRINTING FLOOR MANIVANNAN SAMPATH
[50] P R T Domingo Identifying and Eliminating The Seven Wastes or Muda
Asian Institute of Management
[51] M Pieńkowski WASTE MEASUREMENT TECHNIQUES FOR LEAN COMPANIES
International journal of lean Thinking vol 5 2014
[52] T Ohno Toyota Production System Beyond Large-Scale Production diamond
Inc 1978
[53] D S M Dudek-Burlikowska The Poka-Yoke method as an improving quality
tool of operations in the process journal of Achivements in Materials and
Manufacturing Enginnering vol 36 no 1 2009
[54] K V Scyoc Process safety improvementmdashQuality and target zero Journal of
Hazardous Materials 159 (2008) 42ndash48 2008
[55] A D Shigeo Shingo ldquoZero Quality Control Source Inspection and the Poka-Yoke
Systemrdquo Productivity Press 1986
[56] D Tommelein lsquoPOKA YOKErsquo OR QUALITY BY MISTAKE PROOFING DESIGN AND
CONSTRUCTION SYSTEMS Proceedings for the 16th Annual Conference of
the International Group for Lean Construction
[57] S Shingo A study of the toyota production system japan management
association
[58] D N S Yash Dave a IMPLEMENTATION OF POKA-YOKE TECHNIQUE IN A GEAR
INDUSTRY -A CASE STUDY International Journal of Latest Research in Science
and Technology 2015
[59] M D-B H 1048800achajczyk Quality continuous improvement of company with
usage the Poka-Yoke methods PSKN 72006
[60] S S Zero Quality Control Source Inspection and the Pokandash Yoke System
Cambridge Productivity Press 1986
[61] M G Marta Kučerovaacute Eliminating waste in the production process using tools
and methods of industrial engineering 28 11 2015
REFERENCES AND OTHER SOURCES OF INFORMATION 100
OPTIMIZING THE WORK ENVIRONMENT USING LEAN AND CONTINUOUS IMPROVEMENT TOOLS-PRINTING FLOOR MANIVANNAN SAMPATH
[62] A G P Arunagiria Identification of Major Lean Production Waste in
Automobile Industries using Weighted Average Method 12th GLOBAL
CONGRESS ON MANUFACTURING AND MANAGEMENT GCMM 2014 2014
[63] G A Arunagiri P Investigation on Critical Factors Assessment of the Lean
Production Systems in Industrial Environment Elsevier Science and
Technology 2013
[64] I G-R A S-L E Andreacutes-Loacutepeza Lean Service Reassessment of Lean
Manufacturing for Service Activities The Manufacturing Engineering Society
International Conference MESIC 2015 2015
[65] S SHINGO A Revolution in ManufacturingThe SMED System Productivity
Press 1985
[66] D L M Silvia Pellegrini Study and Implementation of Single Minute Exchange
of Die (SMED) Methodology in a Setup Reduction Kaizen Proceedings of the
2012 International Conference on Industrial 2012
[67] A R RSundara A Review on Lean Manufacturing Implementation
Techniques 12th GLOBAL CONGRESS ON MANUFACTURING AND
MANAGEMENT GCMM 2014 2014
[68] F L F R CRosa SMED Methodology The reduction of setup times for steel
wire-rope assembly lines in the automotive industry Manufacturing
Engineering Society International Conference 2017 MESIC 2017 28-30 June
2017 Vigo (Pontevedra) Spain 2017
[69] P M T G Antoacutenio Carrizo Moreira Implementation of the Single Minute
Exchange of Die (SMED) Methodology in Small to Medium-sized Enterprises
A Portuguese Case Study International Journal of Management vol 30 no
1 2013
[70] T Ohno Toyota Production System Beyond Large-Scale Production New York
Productivity Press 1988
[71] M Imai Gemba Kaizen A Practical Approach to a Continuous Improvement
Strategy Kaizen Publishing House vol 2 2013
REFERENCES AND OTHER SOURCES OF INFORMATION 101
OPTIMIZING THE WORK ENVIRONMENT USING LEAN AND CONTINUOUS IMPROVEMENT TOOLS-PRINTING FLOOR MANIVANNAN SAMPATH
[72] R W Beata GALA PROBLEMS OF IMPLEMENTATION 5S PRACTICES IN AN
INDUSTRIAL COMPANY Management Systems in Production Engineering
vol 12 no 4 pp 8-14 2013
[73] wwwleanproductseu [Online]
[74] H Hirano The Complete Guide to Just-In-Time Manufacturing Waste and the
5S s Productivity press 2009
[75] D W Edwards The new economics for industry government and education
Cambridge Mass MIT Press 1993
[76] KACHANDRAKANTH PLAN DO CHECK ACT (PDCA) IMPROVING QUALITY
THROUGH AGILE ACCOUNTABILITY TEKTRONIX ENGINEERING
DEVELOPMENT INDIA PRIVATE LIMITED BANGALORE
[77] V A D Pratik M Patel Application Of Plan-Do-Check-Act Cycle For Quality And
Productivity Improvement - A Review International Journal for Research in
Applied Science amp Engineering Technology (IJRASET) vol 5 no 1 2017
[78] H Kanri The Strategic Approach to Continuous Improvement Gower
Publishing Limited 2008
[79] G a J W Moran The ABCs of PDCA 2009
[80] D SLOVIĆ D STOJANOVIĆ2 and I TOMAŠEVIĆ Productivity Upswing Through
Two-Phase Continuous Process Improvement Model The Case Of Apparel
Manufacturer Journal of Textile amp Apparel Tekstil ve Konfeksiyon vol 25
no 2 2015
[81] P S T Mr Madan M Jagtap International Journal on Recent Technologies in
Mechanical and Electrical Engineering (IJRMEE) ISSN 2349-7947 vol 2 no
4
[82] E Coimbra The Total Flow Management Model Kaizen forum 2008
[83] E Coimbra TheTotal Flow Management Model KAIZEN FORUM vol 3 pp 1-
4 2008
[84] E A Coimbra Total Flow Management Achieving Excellence with Kaizen and
Lean Supply Chains KAIZEN INSTITUTE (2012)
REFERENCES AND OTHER SOURCES OF INFORMATION 102
OPTIMIZING THE WORK ENVIRONMENT USING LEAN AND CONTINUOUS IMPROVEMENT TOOLS-PRINTING FLOOR MANIVANNAN SAMPATH
[85] S Nakajima Introduction to TPM total productive maintenance Cambridge
MA Productivity Press 1988
[86] P Muchiri and L Pintelon Performance measurement using overall
equipment effectiveness (OEE) Literature review and practical application
discussion International journal of Production Research vol 46 no 13
2008
[87] b J S a J R M-T c C J Andres Mu~noz-Villamizar a Using OEE to evaluate
the effectiveness of urban freight transportation systems A case study
International Journal of Production Economics 2018
[88] B J The new lean toolbox towards fast flexible flow PICSIEBooks Moreton
Press 2004
103
ltTIacuteTULO DA TESEgt ltNOME DO AUTORgt
ANNEXES
71 ANNEX1
ANNEXES 105
OPTIMIZING THE WORK ENVIRONMENT USING LEAN AND CONTINUOUS IMPROVEMENT TOOLS-PRINTING FLOOR MANIVANNAN SAMPATH
ANNEXES
This section consist of the supported documents involved in implementation of the tools
as well as corrective actions carried out in solving the prblems reported by the
organization
71 ANNEX1
ANNEXES 106
OPTIMIZING THE WORK ENVIRONMENT USING LEAN AND CONTINUOUS IMPROVEMENT TOOLS-PRINTING FLOOR MANIVANNAN SAMPATH
ANNEXES 107
OPTIMIZING THE WORK ENVIRONMENT USING LEAN AND CONTINUOUS IMPROVEMENT TOOLS-PRINTING FLOOR MANIVANNAN SAMPATH
ANNEXES 108
OPTIMIZING THE WORK ENVIRONMENT USING LEAN AND CONTINUOUS IMPROVEMENT TOOLS-PRINTING FLOOR MANIVANNAN SAMPATH

OPTIMIZING THE WORK ENVIRONMENT USING LEAN AND CONTINUOUS IMPROVEMENT TOOLS-PRINTING FLOOR MANIVANNAN SAMPATH
ACKNOWLEDGEMENTS
I would like to express my sincere gratitude to everyone who has contributed to the
completion of this work
Thanks to professor Raul Duarte Salgueiral Gomes Campilho for guiding in the
completion of the work company Marsil Graphic Arts Ltd Antoacutenio Andreacute da Costa
Moreira for giving me the opportunity as internship and finding help in the
implementation of works workers of Marsil
Finally I thank my friends and my family for the support and advice provided during the
completion of this Master thesis
ABSTRACT IX
OPTIMIZING THE WORK ENVIRONMENT USING LEAN AND CONTINUOUS IMPROVEMENT TOOLS-PRINTING FLOOR MANIVANNAN SAMPATH
KEYWORDS
5s PDCA SMED waste Muda lean and continuous improvement tools
ABSTRACT
The study aims at solving the problems reported by the management using lean tools
and continuous improvement tools The purpose of using a lean tool is to configure the
working process involved in production thereby reducing waste periodically The tool
also aims at improving the flow of process resulting in reducing the uneven workflow
throughout the floor The pull system from Kanban also found to improvise flow of
materials at the production floor The continuous improvement tool helps in
streamlining works related to implementing works and reducing waste In this work the
implementation of 5s has found its use in creating a tool room and tool chart along with
a pull system introduced for the tools at the pegboard The use of Kanban cards as pull
system at tool chart for the tool is to monitor the flow of tool to the production units at
the printing floor The implementation of 5s in paint room is to organize the ink tins used
for setup activity in the production process and to make the ink tins easier to find for
the operator PDCA (plan do check act) cycle one of the continuous improvement tools
implemented for organizing the printing plates into a system by creating and thereby
reducing the retrieval time of the plates by the operators SMED (single minute exchange
of die) performed on production units to find the activities involved in the setup
operations and reducing the time needed to perform the setup operations The results
of the implementations made found to be satisfying that the tool room kept periodically
and the use of Kanban cards on the tool chart for some tool being used through
inspections performed The systems implemented for organizing the printing plates
helped in retrieving the plates from the system for a setup operation seem to have
reduced from 17 minutes to 3 minutes The implementation of 5s at the paint room in
organizing the ink tins proven useful as the time needed for operators in obtaining the
ink tins and introducing it into the system a setup operation performed for production
purpose observed during SMED process
RESUMO XI
OPTIMIZING THE WORK ENVIRONMENT USING LEAN AND CONTINUOUS IMPROVEMENT TOOLS-PRINTING FLOOR MANIVANNAN SAMPATH
PALAVRAS CHAVE
5s PDCA SMED resiacuteduos Muda ferramentas de melhoria contiacutenua e enxuta
RESUMO
O objetivo do estudo eacute resolver os problemas relatados pelo gerenciamento utilizando
ferramentas enxutas e ferramentas de melhoria contiacutenua O propoacutesito de usar uma
ferramenta enxuta eacute configurar o processo de trabalho envolvido na produccedilatildeo
reduzindo assim o desperdiacutecio periodicamente A ferramenta tambeacutem visa melhorar o
fluxo do processo resultando na reduccedilatildeo do fluxo de trabalho irregular em todo o piso
O sistema de traccedilatildeo do Kanban tambeacutem descobriu improvisar o fluxo de materiais no
chatildeo de faacutebrica A ferramenta de melhoria contiacutenua ajuda na racionalizaccedilatildeo de trabalhos
relacionados agrave implementaccedilatildeo de obras e reduccedilatildeo de desperdiacutecio Neste trabalho a
implementaccedilatildeo do 5s encontrou seu uso na criaccedilatildeo de uma sala de ferramentas e um
graacutefico de ferramentas juntamente com um sistema de traccedilatildeo introduzido para as
ferramentas no pegboard O uso de cartotildees Kanban como sistema pull no quadro de
ferramentas da ferramenta eacute monitorar o fluxo da ferramenta para as unidades de
produccedilatildeo no chatildeo de impressatildeo A implementaccedilatildeo do 5s na sala de pintura eacute organizar
as latas de tingimento usadas para a atividade de configuraccedilatildeo no processo de produccedilatildeo
e tornar as latas de tingimento mais faacuteceis de encontrar para o operador O PDCA (plan
do check act) aciona uma das ferramentas de melhoria contiacutenua implementadas para
organizar as chapas de impressatildeo em um sistema criando e reduzindo o tempo de
recuperaccedilatildeo das chapas pelos operadores SMED (single minute exchange of die)
realizado nas unidades de produccedilatildeo para localizar as atividades envolvidas nas
operaccedilotildees de configuraccedilatildeo e reduzir o tempo necessaacuterio para executar as operaccedilotildees de
configuraccedilatildeo Os resultados das implementaccedilotildees realizadas demonstraram ser
satisfatoacuterios que a sala de ferramentas eacute mantida periodicamente e o uso de cartotildees
Kanban na tabela de ferramentas para alguma ferramenta sendo usada atraveacutes de
inspeccedilotildees realizadas Os sistemas implementados para organizar as chapas de
impressatildeo ajudaram a recuperar as chapas do sistema para que uma operaccedilatildeo de
configuraccedilatildeo parecesse ter reduzido de 17 minutos para 3 minutos A implementaccedilatildeo
de 5s na sala de pintura organizou as tintas de tingimento comprovadamente uacuteteis
como o tempo necessaacuterio para os operadores obterem as tintas de corante e introduzi-
las no sistema uma operaccedilatildeo de configuraccedilatildeo realizada para fins de produccedilatildeo
observada durante o processo SMED
LIST OF SYMBOLS AND ABBREVIATIONS XIII
OPTIMIZING THE WORK ENVIRONMENT USING LEAN AND CONTINUOUS IMPROVEMENT TOOLS-PRINTING FLOOR MANIVANNAN SAMPATH
LIST OF SYMBOLS AND ABBREVIATIONS
List of abbreviations
GSM Grams per Square Meter
NVAA Non-Value Added Activities
OEE Overall Equipment Effectiveness
PDCA Plan Do Check Act
SME Small Machine Enterprise
SMED Single Minute Exchange of DIE
SPH Sheets per Hour
TFM Total Flow Management
List of units
cm Centimeter
m Meter
mm Millimeter
OZ Ounces
List of symbols
euro Euro
FIGURES INDEX XV
OPTIMIZING THE WORK ENVIRONMENT USING LEAN AND CONTINUOUS IMPROVEMENT TOOLS-PRINTING FLOOR MANIVANNAN SAMPATH
FIGURES INDEX
Figure 1 Cities with printing in 1450 [4] 8
Figure 2 Cities with printing press from the 1500s to 1800s [4] 9
Figure 3 Flexography printing station [8] 11
Figure 4 Flexography printing application [8] 12
Figure 5 Letter printing station [10] 13
Figure 6 Screen printing station [11] 14
Figure 7 Gravure printing station [8] 15
Figure 8 Processing of data into printed image [12] 16
Figure 9 shows the image created using printing [12] 17
Figure 10 offset printing station [13] 18
Figure 11 Usage of offset printing for product lables [11] 19
Figure 12 Schematic Production System [17] 21
Figure 13 Manual assembly line [18] 21
Figure 14 combination of manual and automatic workstations [21] 22
Figure 15 A and B workplace sharing hybrid systems [22] 23
Figure 16 Inline Configuration of an automated production line [24] 24
Figure 17 L shaped layout [24] 24
Figure 18 U shaped production layout [24] 25
Figure 19 Rotary layout [24] 26
Figure 20 Welding process performed by platform robots [29] 27
Figure 21 Roles of robots [29] 27
Figure 22 Platform robots performing welding tasks [29] 27
Figure 23 Transporter robot on a track-motion device [29] 28
Figure 24 Hierarchy of workstation needs [33] 29
Figure 25 Represents the flow across enterprises [38] 32
Figure 26 Lean manufacturing tools and practices [44] 34
Figure 27 Function of Poke-Yoke [58] 36
FIGURES INDEX XVI
OPTIMIZING THE WORK ENVIRONMENT USING LEAN AND CONTINUOUS IMPROVEMENT TOOLS-PRINTING FLOOR MANIVANNAN SAMPATH
Figure 28 Types of waste [61] 37
Figure 29 The phases of SMED method [69] 40
Figure 30 5S method [73] 41
Figure 31 PDCA Cycle [77] 42
Figure 32 TFM model [83] 44
Figure 33 Total Flow Management Pillars [83] 44
Figure 34 OEE Timeline [87] 46
Figure 35 Offset printing SM74-5 unit at Marsil 51
Figure 36 Plate cleaning solution 52
Figure 37 Control systems of SM 74-5 52
Figure 38 Measuring devices 53
Figure 39 Products produced by SM74-5 53
Figure 40 Manual fork lifter 54
Figure 41 SM 52-2 54
Figure 42 SM 52-4 55
Figure 43 A and B control systems for Speedmaster 52-4 56
Figure 44 Goods produced at SM 52-4 56
Figure 45 Web-fed Printing unit 57
Figure 46 Products produced at the webfed unit 57
Figure 47 Heidelberg SORM-Z 58
Figure 48 Heidelberg GTO-52 58
Figure 49 Heidelberg Minerva 59
Figure 50 Cutting machine polar 92 60
Figure 51 Heidelberg STAHL Ti-52 60
Figure 52 Double 600i 61
Figure 53 Pegboard with the missing tools 61
Figure 54 Printing plates arranged on the floor according to their clients 62
Figure 55 Cause and Effect diagram on missing tools and unmanaged paint room 63
Figure 56 Cause and effect diagram on unorganized ink tins 64
Figure 57 Cause and effect diagram on printing plate setup made by management 65
FIGURES INDEX XVII
OPTIMIZING THE WORK ENVIRONMENT USING LEAN AND CONTINUOUS IMPROVEMENT TOOLS-PRINTING FLOOR MANIVANNAN SAMPATH
Figure 58 Flow chart 68
Figure 59 SWOT analysis on objective A 69
Figure 60 SWOT on objective B 70
Figure 61 SWOT on objective C 71
Figure 62 Collected tools 72
Figure 63 Kanban cards 72
Figure 64 Simple floor layout is highlighting the production units in colors 73
Figure 65 inventory list of tools 74
Figure 66 Toolroom before implementation 75
Figure 67 Toolroom after implementation 75
Figure 68 Labels as indicators 76
Figure 69 Lable for ink tins 76
Figure 70 Ink tins arranged on shelves after implementation 77
Figure 71 Separation of plates in pallets 79
Figure 72 Information regarding captais socials 79
Figure 73 Information about the plate 80
Figure 74 Image taken during the creation of the prototype 80
Figure 75 Inventory list of the plates 81
Figure 76 image of plates organizeed with labels 82
Figure 77 Before implementation 84
Figure 78 After implementation 84
Figure 79 shows the space occupied by printed goods right near the printing machines 87
Figure 80 Shelves for storing purposes 88
TABLES INDEX XIX
OPTIMIZING THE WORK ENVIRONMENT USING LEAN AND CONTINUOUS IMPROVEMENT TOOLS-PRINTING FLOOR MANIVANNAN SAMPATH
TABLES INDEX
Table 1 printing equipment features [7] 10
Table 2 cutting machine specification 59
Table 3 Time taken before implementation 78
Table 4Time observation after implementation 83
Table 5 Average time of actions performed on three machines 86
Table 6 Performed actions categorized into internal and external 86
INDEX XXI
OPTIMIZING THE WORK ENVIRONMENT USING LEAN AND CONTINUOUS IMPROVEMENT TOOLS-PRINTING FLOOR MANIVANNAN SAMPATH
INDEX
INTRODUCTION 1
11 Framework 1
12 Objectives 1
13 Methodology 1
14 Thesis structure 2
15 Host company 2
THEORETICAL BACKGROUND 7
21 The printing sector 7
211 Importance in the national and international economy 7
212 Types of printings 9
213 Printing equipment 10
214 Printing process description 11
2141 Flexography 11
2142 Letter press printing 12
2143 Screen printing 14
2144 Rotogravure 14
2145 Digital printing 15
2146 Offset lithography 17
215 Evolution of offset printing press 19
22 Production lines 20
221 Concept of production line 20
222 Types of production lines 21
2221 Manual production lines 21
2222 Semi automatic production lines 22
INDEX XXII
OPTIMIZING THE WORK ENVIRONMENT USING LEAN AND CONTINUOUS IMPROVEMENT TOOLS-PRINTING FLOOR MANIVANNAN SAMPATH
2223 Automated production lines 23
223 Management of production lines 28
2231 Workstations 28
2232 Line balancing 30
2233 Supply 31
23 Lean concepts and tools 33
231 Concept of waste 34
232 POKE-YOKE 35
233 MUDA 37
234 SMED 39
235 5S 40
24 Continuum improvement tools 42
241 PDCA 42
242 TFM 43
243 OEE 45
THESIS DEVELOPMENT 51
31 Production lines characterization 51
311 Production line A 51
312 Production line B 54
313 Production line C 58
314 Production line D 59
32 Problem characterization 61
33 Objective 62
34 Brainstorming 63
341 Objective A 63
342 Objective B 64
343 Objective C 65
INDEX XXIII
OPTIMIZING THE WORK ENVIRONMENT USING LEAN AND CONTINUOUS IMPROVEMENT TOOLS-PRINTING FLOOR MANIVANNAN SAMPATH
35 SWOT analysis of possible solutions 69
351 Objective A SWOT analysis 69
352 Objective B SWOT analysis 69
353 Objective C SWOT analysis 70
36 Implementation 71
361 Implementation of 5S 71
362 Implementation of 5S in paint room 75
363 Implementation of PDCA 77
SMED PRACTICE 85
CONCLUSIONS AND PROPOSALS OF FUTURE WORKS 91
51 CONCLUSIONS 91
52 PROPOSALS OF FUTURE WORKS 92
REFERENCES AND OTHER SOURCES OF INFORMATION 95
ANNEXES 105
71 ANNEX1 105
25
INTRODUCTION
11 Framework
12 Objectives
13 Methodology
14 Thesis structure
15 Host company
INTRODUCTION 1
OPTIMIZING THE WORK ENVIRONMENT USING LEAN AND CONTINUOUS IMPROVEMENT TOOLS-PRINTING FLOOR MANIVANNAN SAMPATH
INTRODUCTION
11 Framework
The graphic arts industry where the work is performed has production lines performing
jobs of everyday demands of the clients This includes process from creating the
products according to clientrsquos preference followed by cutting binding lamination until
the final product is met The working conditions are affected by busy long-term
production during various scenarios where the implementation of the lean tools and
continuous improvement tools are necessary to improve the working conditions
availability of resources and thereby increasing the productivity gradually
12 Objectives
The objective of this thesis is to improve the conditions at Marsil with the help of lean
tools and continuous improvement tools by
bull Creating a tool room for the machinery works to take place and to create a tool
chart for organizing tools
bull Creating a system for organizing the ink tins in the paint room
bull Implementing a system for the printing plates to be organized and quick retrieval
of the plates from the system for the printing jobs
13 Methodology
bull Study about the problem reported
bull Collection of data about the problem and proposing ideas in solving them
bull Study about the production floor and the included production units and their
works
bull Brainstorming on the problems in figuring out the possible causes and to get a
broader perspective in structuring the solutions
bull Selection of idea based on collected data available area resources
bull Implementation of an idea based on the adopted tool
bull Collection of data after implementation
bull Analyzing the data obtained
INTRODUCTION 2
OPTIMIZING THE WORK ENVIRONMENT USING LEAN AND CONTINUOUS IMPROVEMENT TOOLS-PRINTING FLOOR MANIVANNAN SAMPATH
14 Thesis structure
The thesis is structured by having it into two sections
bull The theoretical background is having the study of the printing sector the
importance of printing in the economy types of printing printing equipment
printing process with the description of each and their applications the
evolution of offset printing
Production lines include the concept of the production line types of production
lines and management of production lines
Lean tools and concept include waste concept poke-yoke method Muda single
minute exchange of ink 5s and continuous improvement tools has brief
explanation on PDCA (Plan do check act) TFM (Total flow management) OEE
(Overall Equipment Effectiveness) from various research papers journals books
and websites
bull The development section will have characteristics of the production lines
addressing the problems at the printing floor reported by the company goals
performing brainstorming actions on the problems by figuring out the elements
involved in the cause and suggesting out the actions SWOT (strengths
weakness opportunity and threats) involved in these actions Later the actions
implemented according to lean tools and continuous improvement tools
necessary
15 Host company
The company Marsil was founded in the year 1953 as a printing business licensed for the
manual cutter and a printing machine in the downtown of Porto Rua Conde de Vizela
No 76 In the early 80s after the formation of the company became the first customer
segmentation exercise and went on to emphasize to the institutional client initially
Banco Borges amp Brother followed by Banco Espiacuterito Santo The company now also has
a delegation in Lisbon initially at Av Infante Santo and later in Tower 2 of the Amoreiras
which still remains to provide the necessary personalized support to the customer
The company was awarded the prize of IAPMEI SME Excellence in 2000 and 2001 which
happened again in 2008 and 2009 with the awards SME Leader and SME Excellence
respectively
In 2006 Marsil started a new business area passing by incorporating value-added
services to the graphics product - the Bursar and Logistics Management with stock
management graphics delivering the quantity needed time limit and at the locations by
customers
INTRODUCTION 3
OPTIMIZING THE WORK ENVIRONMENT USING LEAN AND CONTINUOUS IMPROVEMENT TOOLS-PRINTING FLOOR MANIVANNAN SAMPATH
In 2008 it was inaugurated Mosteiroacute facilities with a park web presses and finishing lines
constituting the second productive hub and from 2010 onwards there is an ongoing
new customer segmentation exercise and exploration of new markets which has
allowed the Marsil increase the portfolio and even be honored with some awards and
prestigious honors in the field of Graphic Arts
Marsil currently has 1420 clients currently active and half of them made orders during
the year 2016 Noteworthy are clients like the Caixa Geral de Depoacutesitos Novo Banco
Millenium BCP SantaderTotta Banco BPI Euro big Pestana Group Hotels Hotels Minor
Tivoli Nau Hotels Group Eurostars Group Hospital da Luz among other clients in these
and other sectors such as footwear textiles etc The Marsil has forty-two employees
employed at present
5
ltTIacuteTULO DA TESEgt ltNOME DO AUTORgt
BIBLIOGRAPHIC WORK
21 The printing sector
22 Production lines
23 Lean concepts and tools
24 Continuum improvement tools
THEORETICAL BACKGROUND 7
OPTIMIZING THE WORK ENVIRONMENT USING LEAN AND CONTINUOUS IMPROVEMENT TOOLS-PRINTING FLOOR MANIVANNAN SAMPATH
THEORETICAL BACKGROUND
21 The printing sector
The printing industry covers the entire print process from creation through distribution
to other non-print services that it offers So any definition of the industry includes not
only the numerous firms that perform the actual printing but the companies that
provide binding and finishing services such as cutting trimming die to cut laminating
mounting and varnishing documents for their clients [1]
A wide range of products is produced in the printing industry In addition to magazines
books and some small newspapers other examples of printed products include direct
mail labels manuals and marketing material Less obvious printed goods include memo
pads business order forms checks maps T-shirts and packaging The industry also
includes establishments that give quick printing of documents for the consumer or
support services such as prepress embossing binding finishing and mailing [2]
211 Importance in the national and international economy
The printing press had enormous effects on the economy The printing press was an
invention that led to the flourishment of trade throughout all of Europe due to increased
demands This was a cause for a stronger economy Also a more natural way to print
books led to more affordable books this meant that now not only could the elite and
wealthy afford books but so could the poor More durable and well-made books grew
the market for books and strengthened the economy Newspaper on the other hand
were more everyday items created by the printing press which caused a massive burst
in demand for newspapers Frequent changing of prices downward made more
affordable books Books carried information for people to learn and create more jobs
Stores could now sell and buy books more rapidly The demand for books and
newspapers also led to more inventions for printing to grow the economy Lastly
printing became a massive industry and led to different companies to move into large
noisy factories meaning many for jobs to hire more books to make and more books to
sell [3]
Historians and studies suggest the printing press was one of the most revolutionary
inventions in human history as well the printing press eased these intellectual
developments the process of sharing and recombining ideas that economists have tied
to technological progress and the development of economic activities in which literacy
THEORETICAL BACKGROUND 8
OPTIMIZING THE WORK ENVIRONMENT USING LEAN AND CONTINUOUS IMPROVEMENT TOOLS-PRINTING FLOOR MANIVANNAN SAMPATH
numeracy and other intellectual skills were valuable Indeed there is an argument to
be made that (via its pervasive and fundamental impact on a wide range of economic
activities) printing technology may qualify as a general-purpose technology [4]
Printing cities enjoy helps due to agglomeration economies The printing press produced
new face-to-face interactions in addition to books and pamphlets Printers workshops
brought scholars merchants craftsmen and mechanics together for the first time in a
commercial environment eroding a pre-existing ldquotown and gown divide Bookshops
and the houses of printers became meeting places and temporary residences for
intellectuals Print technology also produced printing-scholars Adapt to handling
machines and marketing products finding learned societies promoting artists and
authors advancing new forms of data collection [5]
Cities with printing presses derived benefits from the technology that others did not
The costs of information and human capital accumulation were significantly lower in
cities with printing presses In part these advantages were due to transport costs Print
media is costly to transport because it is vast and a fragile commodity sensitive to damp
[6]
[4]Jeremiah Dittmar in comparing cities where printers set up presses to similar cities
where they did not conclude that ldquoprint technologies had very substantial effects in
European economic history through their impact on cities ldquoSome have concluded that
the economic impact of the printing press was limited
Figure 1 Cities with printing in 1450 [4]
THEORETICAL BACKGROUND 9
OPTIMIZING THE WORK ENVIRONMENT USING LEAN AND CONTINUOUS IMPROVEMENT TOOLS-PRINTING FLOOR MANIVANNAN SAMPATH
Figure 2 Cities with printing press from the 1500s to 1800s [4]
Figure 1 and Figure 2 represents the cities with printing presses at the 1450s and
between 1500s-1800s
On exploiting the city level data on the diffusion and adoption of the printing press to
examine the technologys impact from a new perspective shows that cities that adopted
the printing press in the late 1400s enjoyed no growth advantages prior to adoption but
grew at least 20 percentage points and as much as 80 percentage points more than
similar cities that did not change over the period 1500-1600 These estimates imply that
the impact of printing accounted for at least 18 and as much as 80 percent of European
city growth between 1500 and 1600 [4]
Cities that were early adopters of the printing press kept a significant growth advantage
even over the three hundred years running 1500-1800 Even 1500-1800 print accounted
for somewhere between 5 and 45 percent of city growth Between 1500 and 1800
European cities were seedbeds of the ideas activities and social groups that launched
modern capitalist economic growth [4]
212 Types of printings
1 Flexography
2 Letterpress printing
3 Screen printing
4 Rotogravure
5 Digital printing
6 Lithography
THEORETICAL BACKGROUND 10
OPTIMIZING THE WORK ENVIRONMENT USING LEAN AND CONTINUOUS IMPROVEMENT TOOLS-PRINTING FLOOR MANIVANNAN SAMPATH
213 Printing equipment
Industrial printing equipment and supplies include screen printing equipment digital
printing equipment label printing equipment offset printing equipment letterpress
printing equipment and flexographic printing equipment
Table 1 Describes various printing equipments and their associated equipments
Table 1 printing equipment features [7]
Serial
Number
Equipment used
for printing Definition Features
1
Flexographic
printing
equipment
Flexographic printing equipment uses rubber
cylinders that are easy to keep and repair
bull Viscosity control
systems
bull Ink pumps
bull Chamber doctor
blades
bull Video systems
bull Stroboscopes
bull Slitting and rewinding
machines
2
Letterpress
printing
equipment
Letterpress printing inks type that is pressed
onto the printing surface
bull Die cutters
bull Scorers
bull Engravers
bull Embossers
bull Foil stampers
bull Binders
3 Screen printing
equipment
Screen printing equipment uses rubber
cylinders that are easy to keep and repair
bull Racks
bull Stretchers
bull Transfer presses
bull Dip tanks
bull Dryers
4 Digital printing
equipment
Digital printing equipment produces printed
materials directly from a computer file and
does not use intermediate materials such as
film or plates
bull Variable imaging digital
presses (computer to
paper)
bull Digital desktop
printers
bull Digital copiers
bull Direct imaging presses
(computer to plate on
press)
THEORETICAL BACKGROUND 11
OPTIMIZING THE WORK ENVIRONMENT USING LEAN AND CONTINUOUS IMPROVEMENT TOOLS-PRINTING FLOOR MANIVANNAN SAMPATH
5 Offset printing
equipment
Offset printing equipment produces printed
images from plate to paper with the help of
inks and cylinders
bull Printers
bull Scanners
bull Folding machines
bull Joggers
bull Binding equipment
214 Printing process description
This section briefly explains the process involved in various printing techniques and their
uses in production activities
2141 Flexography
Process
Flexographic printing involves a ldquoplate cylinderrdquo covered in whole or in part with raised
flexible print media that carry ink for an image The media then deposit that ink onto
the substrate Initially the media made of rubber sheets pressed into rigid molds and
vulcanized shows the image of flexography printing unit and its working components
Figure 3 shows the working image of flexography printing unit with its components
Figure 3 Flexography printing station [8]
A metal (eg magnesium) plate exposed with the negative of the image to be printed
and developed in an acid bath creates the first mold This metal relief plate makes the
mold for commercial use (usually in Bakelite plastic) A rubber or plastic sheet material
is vulcanized (by pressing it into the metal mold under controlled temperature and
pressure) to create the printing plate Alternatively a photopolymer material exposed
to the negative of the image to be printed creates the print media directly Light not
THEORETICAL BACKGROUND 12
OPTIMIZING THE WORK ENVIRONMENT USING LEAN AND CONTINUOUS IMPROVEMENT TOOLS-PRINTING FLOOR MANIVANNAN SAMPATH
excluded by the negative image cross-links the polymer In the following step a liquid
bath removes the polymer not cross-linked during the exposure process Raised surfaces
of (crossed-linked) photopolymer material give the raised surfaces to carry ink Recently
direct laser light exposure of photopolymer material has been able to cut the need for
the intermediate contrary giving high reproducibility and quality [9]
The process was developed primarily for printing on packaging substrates board paper
foil and film Materials are supplied in roll form for feeding into form-fill over-wrapping
bag making and other continuous web processing machinery [8]
Flexography printing is an efficient cost-effective and versatile printing method by the
end of the 1990rsquos approximately one-quarter of all printing is flexographic in the
packing segment of the printing industry Flexography enjoys a market share of over
65 growth throughout the 1990rsquos has been steady [8]
Applications
Some typical applications for flexography are paper and plastic bags milk cartons
disposable cups and candy bar wrappers Flexography printing may also be used for
envelopes labels and newspapers [8] Figure 4 shows some of the applications where
flexographic printing is used The labels of the above-shown products are made through
flexographic printing
Figure 4 Flexography printing application [8]
2142 Letter press printing
Process
Letter-press printing consists printing of suitably aqueous ink onto a sheet or web from
surfaces in relief The printing form is usually a stereotype or electrotype plate or a type
form with or without etchings bearing designs etched in relief While various kinds of
THEORETICAL BACKGROUND 13
OPTIMIZING THE WORK ENVIRONMENT USING LEAN AND CONTINUOUS IMPROVEMENT TOOLS-PRINTING FLOOR MANIVANNAN SAMPATH
presses may be employed rotary presses are used for high-speed letter-press printing
as in the printing of books magazines newspapers In rotary letter-press operations a
supply of ink is maintained in an ink fountain at a consistency suitable for the printing
conditions and the ink is fed from the fountain and distributed onto the raised surfaces
of the rotating printing form by a series of transfer and inking rollers [10] The web to
be printed is passed into contact with the moving inked form to affect the printing
operation After one side of the web has been printed that is after the first impression
a second printing or second impression is usually made on the other side of the web
by continuous operation of another section of the same press In multi-color letter-press
printing a series of impressions are made with inks of assorted colors a plurality of
impressions being placed in adjacent or superimposed relation on the same side of the
sheet or web [10]
Figure 5 shows the working of letterpress printing unit and its components
Figure 5 Letter printing station [10]
Applications
Letterpress printing was the effective book-preparing process For four centuries it was
also the powerful printing technology for posters announcements printed matter for
churches government and businesses single or two paged local news sheets daily and
weekly newspapers as well as various simple print jobs now limited to specialty works
such as numbering embossing hot stamping and hot wax carbonizing (spot carbon
printing) It is also used for die cutting perforating slitting and scoring [11]
THEORETICAL BACKGROUND 14
OPTIMIZING THE WORK ENVIRONMENT USING LEAN AND CONTINUOUS IMPROVEMENT TOOLS-PRINTING FLOOR MANIVANNAN SAMPATH
2143 Screen printing
Screen printing is a process in which ink is forced through a screen The screen-printing
stencil serves as a printing plate The screen is a delicate fabric made of natural silk
plastic or metal fibersthreads Plastic or metal fabric is used nowadays Ink is
imprintedtransferred through the image-specific open mesh that is not covered by the
stencil The screen-printing plate is therefore a combination of screen and stencil It is
the material the fineness of the screen (the number of screen threads per centimeter
of fabric length) the thickness of the screen the distance between the top and bottom
sides of the screen and the degree of opening of the screen (the degree of screen
opening areas as a percentage describes the ratio of the total of all mesh openings to
the entire surface of the fabric) that determine the printing properties and Quality of
the fabric (screen) [11]
Applications
Textilesmaterials printed T-shirts printed toys fronts of televisions radios etc
automobile dashboards measuring equipment packaging (plastic bags) printed circuit
boards large-format advertising posters are the areas where screen printing have found
its use [11]
Figure 6 shows the image of the screen-printing process and involved components
Figure 6 Screen printing station [11]
2144 Rotogravure
Process
True intaglio or steel-die process prints from sunken lines or grooves are connected and
cross each other Ink is then applied to the engraved areas and doctored or wiped off
the flat nonimage areas The resulting ink image is then impressed on the substrate to
THEORETICAL BACKGROUND 15
OPTIMIZING THE WORK ENVIRONMENT USING LEAN AND CONTINUOUS IMPROVEMENT TOOLS-PRINTING FLOOR MANIVANNAN SAMPATH
be printed Paper currency is printed from steel dies capable of reproducing beautiful
lines that no other process can duplicate A rotogravure is a form of printing and prints
directly from unconnected cells engraved into the plate cylinder [8]
Figure 7 shows the image of Gravure printing process and its units in operation
Figure 7 Gravure printing station [8]
Applications
Gravure is used for packaging magazines newspapers and other specialty printing
applications It has been an outstanding choice for printing process color for mass-
circulation magazines and newspapers Gravure-printed postage stamps are another
example of the exceptional print results of rotogravure Many plants have blended
flexography with gravure to produce exceptional print results on packaging materials
[8]
2145 Digital printing
The basic concept is that digital means using numbers to represent something and
thatrsquos what a computer does A typical image is converted into numerical data (a long
string of ones and zeros) that describe or quantify each sample point or ldquopixelrdquo (short
for picture element the basic unit of image information) in terms of specific attributes
such as color and intensity This data can be stored manipulated and transformed with
digital printing technologies back into a customarily viewed image [12]
THEORETICAL BACKGROUND 16
OPTIMIZING THE WORK ENVIRONMENT USING LEAN AND CONTINUOUS IMPROVEMENT TOOLS-PRINTING FLOOR MANIVANNAN SAMPATH
Process
Compared to traditional printing techniques digital printing is different However there
is no pressure or impact and there is no physical matrix The matrix now sits in the
computer in the form of digital data that can be converted repeatedly with or without
any variation into a print by any image-maker who either does his own printing (ldquoself-
printingrdquo) or who uses an outside printing service lab or retailer [12]
Figure 8 shows the process in which data is created stored and finally processed to
produce printed image on sheet
Figure 8 Processing of data into printed image [12]
Digital imaging and printing have changed the rules of visual communication Making
original prints or reproductions (see below) especially at an enormous size and in color
used to be costly cumbersome or difficult for any individual photographer or artist [12]
Figure 9 shows the image created using digital printing
THEORETICAL BACKGROUND 17
OPTIMIZING THE WORK ENVIRONMENT USING LEAN AND CONTINUOUS IMPROVEMENT TOOLS-PRINTING FLOOR MANIVANNAN SAMPATH
Figure 9 shows the image created using printing [12]
Advantages
The advantages of digital printing are clear in terms of cost consistency storage
flexibility
bull Some of the digital printing technologies are line printing mdash where pre-formed
characters are applied to the paper by lines
bull daisy wheel mdash where pre-formed characters are applied individually
bull dot-matrix mdash which produces arbitrary patterns of dots with an array of printing
studs
bull heat transfer mdash like early fax machines or modern receipt printers that apply heat
to special paper which turns black to form the printed image
bull blueprint mdash and related chemical technologies
bull inkjet mdash including bubble-jet mdash where ink is sprayed onto the paper to create the
desired image
bull laser mdash where toner consisting primarily of polymer with the pigment of the
desired colors are melted and applied directly to the paper to create the desired
image
bull 3D printing
2146 Offset lithography
Process
In offset lithographic printing the Printing ink is supplied to the inking rollers via a
reservoir (duct) Greater and lesser amounts of ink can be fed to the inking rollers by
opening and closing duct keys The inking rollers transfer the required amount of ink to
the printing plate The printing image is then transferred (or offset) from the plate to
THEORETICAL BACKGROUND 18
OPTIMIZING THE WORK ENVIRONMENT USING LEAN AND CONTINUOUS IMPROVEMENT TOOLS-PRINTING FLOOR MANIVANNAN SAMPATH
the blanket` and then to the paper on the impression cylinder The printed sheet is then
passed into the next printing unit via the transfer cylinder Each color must have a
separate printing unit The printing plate is made from aluminum and backed with a
sensitive coating The plate has two distinct areas the image area and the non-image
area Ink is accepted by the image areas of the plate while the non-image areas accept
a water-based mix called a damper solution When applied to the plate the solution
repels ink from the non-image area [13]
There are two types of lithographic printing they are
bull Sheet-fed
Sheet-fed press prints an image on single sheets of paper as they are fed individually
into the press The print quality and sheet to sheet registration are often better than
web-fed printing but it is often more economical to produce huge runs on web presses
because of their higher running speeds
bull Web-fed
A web-fed press prints images on a continuous web of paper fed into the press from a large roll of paper The web of paper is then cut into individual sheets after printing or as with continuous business form applications it is left in web form and is perforated for later separation into individual sheets
Figure 10 shows the working of offset printing machine along with parts involved in
producing prints
Figure 10 offset printing station [13]
Applications
The highest printing quality for packaging is achieved with offset printing Accordingly
printing of expensive luxury packaging for individual spirits chocolates perfumes and
cosmetics and even embossing in the correct register is always done on sheet-fed offset
THEORETICAL BACKGROUND 19
OPTIMIZING THE WORK ENVIRONMENT USING LEAN AND CONTINUOUS IMPROVEMENT TOOLS-PRINTING FLOOR MANIVANNAN SAMPATH
presses The printing of many other cardboard products and folding boxes for the
packaging of frozen food ice cream cigarettes drugs and cosmetics as well as many
other products in the food and non-food areas remains the almost exclusive domain of
offset printing technology [11]
Figure 11 shows the usage of offset printing on various products
Figure 11 Usage of offset printing for product lables [11]
215 Evolution of offset printing press
This section shows the evolution of offset printing technology and inventions made over
the past 100 years [14] [15]
1875
The first press to use offset lithography and the offset printing process is invented in
England The offset cylinder was covered with specially treated cardboard that
transferred the printed image from the litho stone to the surface of the metal
1880
The cardboard covering of the offset cylinder was changed to rubber which is still the
most commonly used material
1903
Ira Washington Rubel of the United States used the offset process to print on paper
Rubel noticed that whenever a sheet of paper was not fed into his lithographic press
during operation the stone printed its image to the rubber-covered impression cylinder
and the next impression had an image on both sides direct litho on the front and an
image from the rubber blanket on the back and discovered that images were printed
sharply by printing from the stone to the blanket and then to the paper
THEORETICAL BACKGROUND 20
OPTIMIZING THE WORK ENVIRONMENT USING LEAN AND CONTINUOUS IMPROVEMENT TOOLS-PRINTING FLOOR MANIVANNAN SAMPATH
1911
Albert Harris observed the process discovered by Rubel at about the same time and
developed an offset printing press for the Harris Automatic Press Company
1950
During the 1950s offset printing became the most popular form of commercial printing
as improvements were made in plates inks and paper maximizing the techniques
superior production speed and plate durability Today most of the printing including
newspapers is done by the offset printing process
1960
Increasingly newspaper printers begin replacing their outdated letterpress machines
with offset presses
1962
Heidelberg begins development for offset printing presses This came after decades of
resistance by management Technicians were able to convince them that this was the
way of the future
22 Production lines
221 Concept of production line
A production line is a set of the sequential process set up on an industrial shop floor A
production process or a manufacturing process is the transformation of raw materials
or components into finished products The stages of a production process involve
procurement fabrication assembly testing packaging and distribution The
production or manufacturing lines in industries can be categories into three typersquos ie
automated production lines semi-automated production lines and standard
production lines The nature of a production line depends on the complexity of the
manufacturing parts the production volume the sensitivity of the product and cost [16]
The production system has the following characteristics
1 Production is an organized activity so every production system has an aim
2 The system transforms the various inputs into useful outputs
3 It does not run in isolation from the other organization system
4 There exists feedback about the activities which is essential to control and
improve system performance [17]
THEORETICAL BACKGROUND 21
OPTIMIZING THE WORK ENVIRONMENT USING LEAN AND CONTINUOUS IMPROVEMENT TOOLS-PRINTING FLOOR MANIVANNAN SAMPATH
Figure 12 shows the inputs go through the transformation process and finally the output
of a production system
Figure 12 Schematic Production System [17]
222 Types of production lines
2221 Manual production lines
It consists of multiple workstations in which the assembly work is carried out as the
product (subassembly) is passed from station to station along the line At each
workstation one or more human workers perform a part of the total assembly work on
the product by adding one or more components to the existing subassembly Manual
lines are especially common where workpieces are fragile or if workpieces need to be
gripped often as industrial robots often lack the necessary accuracy In countries where
wage costs are low manual labor can also be a cost-efficient alternative to expensive
automated machinery [18]
Figure 13 depicts the manual assembly line setup
Figure 13 Manual assembly line [18]
THEORETICAL BACKGROUND 22
OPTIMIZING THE WORK ENVIRONMENT USING LEAN AND CONTINUOUS IMPROVEMENT TOOLS-PRINTING FLOOR MANIVANNAN SAMPATH
Manual operations are used in the assembly of complex work elements as well as when
product demand is unstable or where the use of specialized machines and equipment is
unjustifiably expensive Thus caution must be exercised in the design of a manual
assembly line with respect to the volume flexibility with uncertain production demand
To achieve this situation needs adjusting the number of workers or the system
configuration according to the changes in product demand Hence a manual assembly
line is more flexible than automated machine assembly systems in adapting to the
changes in production demand [19]
Manual assembly lines are used in high-production situations where the work to be
performed can be divided into small tasks and tasks assigned to the workstations on the
line A key advantage of using manual assembly line is a specialization of labor is by
giving each worker a limited set of tasks to do repeatedly According to Shtub [19] lack
of motivation and low level of satisfaction which is typically caused by the high
repetitiveness of elementary operations have been considered as a significant
disadvantage of assembly production
2222 Semi automatic production lines
Semi-automation describes a system in which a human operator or a small production
line feeds a product to a robot the robot performs a single task on that product and
then the human operator removes the product and completes the task
ldquoWork characteristic of a machine that only needs some degree of support from a manrdquo
In contrast to a completely automated system semi-automation does not achieve
complete relief from work for the worker [20] Ie the technical system usually achieves
the control of the individual functions Program control which means the start end and
succession of the individual functions is accomplished by manrdquo
Figure 14 shows the integration of manual and automatic workstations
Figure 14 combination of manual and automatic workstations [21]
Utilizing robotic and human capabilities at their best is obtained in an assembly system
where there is a sequential division of tasks The simple tasks suited for robots are found
THEORETICAL BACKGROUND 23
OPTIMIZING THE WORK ENVIRONMENT USING LEAN AND CONTINUOUS IMPROVEMENT TOOLS-PRINTING FLOOR MANIVANNAN SAMPATH
upstream in the line The complex often varied tasks that give the assembled products
human operators downstream perform their individual features Such hybrid lines have
been used to advantage in the industry for more than two decades [21]
Figure 15 shows the workstation been shared by the worker and an automated machine
in a line
A
B
Figure 15 A and B workplace sharing hybrid systems [22]
In this scenario several components must be assembled on a sheet metal part which is
supplied by a conveyor system The human worker must grip the components out of
bins to transport these parts towards the conveyor system (handling time) and to put
the components on the sheet metal parts (assembly) Afterward the robot must screw
these components into the sheet metal part (assembly) If the worker is too slow the
robot will wait until the worker has finished his tasks [23]
2223 Automated production lines
An automated production line has multiple workstations that are automated and linked
together by a work handling system that transfers parts from one station to the next
The automated production may consist of automated workstations manual
workstations and inspection stationsThere are different types of configurations layouts
available for automated production lines
bull In line
bull Segmented In-Line
bull Rotary
In-line layout
THEORETICAL BACKGROUND 24
OPTIMIZING THE WORK ENVIRONMENT USING LEAN AND CONTINUOUS IMPROVEMENT TOOLS-PRINTING FLOOR MANIVANNAN SAMPATH
Raw materials enter the automated production line and undergo a system of automated
processing at various workstations along the fixed production line the parts are passed
from workstation to workstation by means of a mechanized work transport system until
the wholly processed parts pass out of the automated production line after the last
process occurs to the part at the final workstation in the system [24]
Figure 16 describes the process of the In-line automated production line
Figure 16 Inline Configuration of an automated production line [24]
The conditions that decide the use of automated production lines include high product
demand stable product design long product life and multiple operations
Segmented In-line
L shaped layout
This layout allows fitting in a lengthy series of operations into limited space The feeding
cells start on an aisle and end at the point of use This May allow isolation of dangerous
or costly-to-move equipment in the elbow with savings in implementation cost andor
two directions for expansion It is easy to segregate the in-flow and outflow of physically
different materials products supplies and special services [24] Figure 17 shows the L-
shaped production layout with assembly stations to perform work
Figure 17 L shaped layout [24]
THEORETICAL BACKGROUND 25
OPTIMIZING THE WORK ENVIRONMENT USING LEAN AND CONTINUOUS IMPROVEMENT TOOLS-PRINTING FLOOR MANIVANNAN SAMPATH
U- shaped layout
U-shaped production lines were conceived as a solution in lean production
environments for waste elimination and for getting the full use of workerrsquos capabilities
Waste removal is usually achieved by the introduction of pull systems one-piece flow
leveling and ldquojidokardquo while fully utilizing workersrsquo capabilities requires a system of
respect for people based on minimizing wasted movements ensuring their safety and
giving them greater responsibility in running and improving their jobs [25]
Figure 18 shows u shaped production line system In U shaped lines the entrance and
the exit of the line system are remarkably close to each other Operators may handle
work-pieces both on the front and back of the line What operators found in crossover
workstations can perform tasks from both the front and back of the line Thus idle times
are reduced and resource use is increased thanks to the crossover stations found in
between the front and back of the U line [26]
Figure 18 U shaped production layout [24]
Rotary
Consists of a circular worktable around which work parts are fixed to work holders The
worktable rotates to move each work part in turn into each automated workstation
which is found around the circumference of the worktable The worktable is often called
a dial and the equipment is referred to as a dial indexing machine or simply indexing
machine
Figure 19 shows the image of a rotary layout design
THEORETICAL BACKGROUND 26
OPTIMIZING THE WORK ENVIRONMENT USING LEAN AND CONTINUOUS IMPROVEMENT TOOLS-PRINTING FLOOR MANIVANNAN SAMPATH
Figure 19 Rotary layout [24]
Limited to smaller work parts and few workstations and they cannot readily
accommodate buffer Robotic production lines storage capacity However they need less
floor space and are less expensive than other configurations [24]
Robots are being used extensively in assembly lines to perform the tasks and these
assembly lines are called robotic assembly lines [27] The robots are programmed to
perform different types of tasks and it can be used to work 24 hrs without worries of
fatigue Different types of robots are available in the market to do the same task with
different capabilities and efficiencies Therefore there is a requirement of reasonable
allocation of robots to workstations with the sure specific aim These robots need to be
re-assigned whenever there is a new product is planned for assembly [28]
Michels [29] consider that a robotic assembly line is composed of platform stations and
transporter robots to displace work-pieces between these platforms Multiple robots
may be assigned to each platform station By defining each transporter or platform as a
station and assuming the line starts and finishes with a transporter robot the
configuration results in line with an odd number of stations in an alternating pattern of
platform-fixed and transporter robots
Figure 20 shows the robotic line design model forming 13 serial stations (S1 to S13)
There are 24 robots in total composed of 17 platform robots (15 performing geometry
and finishing welding tasks and 2 performing stud tasks) and 7 transporter robots (4
performing finishing welding tasks 1 performing stud tasks (S9) and 2 for work-pieces
handling in the entrance and S11)
THEORETICAL BACKGROUND 27
OPTIMIZING THE WORK ENVIRONMENT USING LEAN AND CONTINUOUS IMPROVEMENT TOOLS-PRINTING FLOOR MANIVANNAN SAMPATH
Figure 20 Welding process performed by platform robots [29]
Figure 21 shows the types of the robot and their roles where they are being used in the
assembly line
Figure 21 Roles of robots [29]
Figure 22 shows the welding process performed by platform robots
Figure 22 Platform robots performing welding tasks [29]
THEORETICAL BACKGROUND 28
OPTIMIZING THE WORK ENVIRONMENT USING LEAN AND CONTINUOUS IMPROVEMENT TOOLS-PRINTING FLOOR MANIVANNAN SAMPATH
Figure 23 shows transporter robot on a track motion device unloading workpieces
Figure 23 Transporter robot on a track-motion device [29]
Benefits of the robotic system
bull The requirement for reduced floor space
bull Improved efficiency Improved quality
bull The ability to work in cold or hostile environments
bull Increased yields and reduced wastage
bull Increased consistency
bull Increased flexibility for some operations [30]
223 Management of production lines
2231 Workstations
A workstation is among the most critical places in a manufacturing environment Well-
organized working areas are essential for standardized work procedures which are
needed to control the workplace To perform the required tasks operators must use
different types of equipment tools and materials If the necessary resources are not
precisely and safely stored operators lose precious time to find them increasing thus
the non-value-added time (waste) [31] Workstations play a critical role in
manufacturing processes Lean workstations focus on minimizing waste and
concentrate operators to critical issues It is essential to ensure effectiveness in an
environment of high customization automation and competitiveness
As from the workstations design point of view Workstation design handles placing
materials tools equipment etc and routing operator movements in the most suitable
form That way operators can perform their work in an efficient manner [31]
traditional workstations and lean workstations are inherently different Traditional
workplaces are designed to ease the work of material handler not increase the value
THEORETICAL BACKGROUND 29
OPTIMIZING THE WORK ENVIRONMENT USING LEAN AND CONTINUOUS IMPROVEMENT TOOLS-PRINTING FLOOR MANIVANNAN SAMPATH
added by the operator A lean workstation is designed focused on operator concerns
such as safety and ergonomics and minimal wasted motion with the goal to get parts
efficiently and find tools quickly Assembly materials tools or parts should be
strategically positioned to allow the operator to reach it instantaneously without
interfering with operatorsrsquo safety and comfortability [32]
Maslow [33] introduced five stages of ldquoHierarchy of workstations needsrdquo which were
developed to understand and priorities the requirements to achieve full performance in
workstations
Figure 24 shows the Functionality effectiveness efficiency satisfaction are the levels of
hierarchy in workstation needs towards excellence proposed by Maslow
Figure 24 Hierarchy of workstation needs [33]
Functionality ensures physical and safety needs of the operators Effectiveness fulfills
their social and relationship needs such as friendship love and belonging Efficiency
reflects how the workstation and their associates are seen in the whole facility and if
their value is recognized and respected by others ndash esteem Finally satisfaction refers to
the achievement of higher goals and full levels of satisfaction ndash self-actualization and
self-transcendence Once all levels have been fulfilled the company and its workstation
can achieve the desired level of excellence [33]
THEORETICAL BACKGROUND 30
OPTIMIZING THE WORK ENVIRONMENT USING LEAN AND CONTINUOUS IMPROVEMENT TOOLS-PRINTING FLOOR MANIVANNAN SAMPATH
2232 Line balancing
Line balancing is a technique used in connection with the design of product layout or
lsquolsquolinesrsquorsquo The term lsquolsquobalancingrsquorsquo is used because one of its main aims is to minimize the
idle time and spread it as evenly as possible across the workstations [34] It is also used
to minimize imbalance betweenamong workers and workloads to achieve the required
run rate Therefore the line should be analyzed in terms of the assembly process
workstations layout and workstation cycle time [35]
When balancing a line the following factors need to be taken into account
bull the required output rate or cycle time (which depends on the demand for the
product)
bull precedence constraints (these are restrictions on the order in which tasks can be
done in other words specific tasks will have lsquolsquopredecessor tasksrsquorsquo that must be
done first)
bull zoning constraints (these are restrictions on where specific tasks or combinations
of tasks should or should not take place)
bull duplication of workstations are done in case when a task takes longer cycle time
than the available cycle time [34]
The line-balancing problem forms two aspects
bull Determination of the required number of stations and
bull The assignment of tasks to each station with the aim of maximizing efficiency (by
minimizing idle time and spreading it evenly across workstations)
Formulation
Equation 1 Represents the formulations involved in line balancing
Equation 1 Formulations involved in line balancing
119888119910119888119897119890119905119894119898119890 ∶= (119901119903119900119889119906119888119905119894119900119899119906119899119894119905119905119894119898119890)(119889119890119898119886119899119889119906119899119894119905119905119894119898119890)
119873119906119898119887119890119903 119900119891 119908119900119903119896 119904119905119886119905119894119900119899119904 ∶= 119879119886119904119896 119905119894119898119890 119862119910119888119897119890 119905119894119898119890frasl
119864119891119891119894119888119894119890119899119888119910 ∶= 119879119886119904119896 119905119894119898119890 119860119888119905119906119886119897 119899119906119898119887119890119903 119900119891 119908119900119903119896119904119905119886119905119894119900119899119904frasl
The effectiveness of the balance decision is measured by the lsquolsquobalance lossrsquorsquo of the line
The balance loss is the time invested in making one product that is lost through
imbalance expressed as a percentage of the total time investment
For a paced n stage line the time lost through imbalance is the cumulative difference
between the stationsrsquo distributed work times and the cycle time allowed by the pacing
of the line For unpacked lines it is the cumulative difference between each stagersquos work
THEORETICAL BACKGROUND 31
OPTIMIZING THE WORK ENVIRONMENT USING LEAN AND CONTINUOUS IMPROVEMENT TOOLS-PRINTING FLOOR MANIVANNAN SAMPATH
time and that of the stage with the most significant work time (this effectively governs
the cycle time of the whole line)
An amazingly simple line-balancing problem may be solved by lsquolsquotrial and errorrsquorsquo Most
practical problems however are extremely complex needing thousands of tasks to be
assigned across hundreds of workstations and with many precedences and zoning
constraints to be taken into account Many heuristic algorithms have been developed
such as the Kilbridge and Wester method and the ranked positional weights technique
Being based on heuristics or lsquolsquorulesrsquorsquo that have been tested empirically such techniques
can provide useful although not necessarily best results [34]
Kilbridge and Wester method
bull It is a heuristic procedure which selects work elements for assignment to stations
according to their position in the precedence diagram
bull elements at the end of the precedence diagram might be the first candidates to
be considered just because their values are significant
Procedure
Construct the precedence diagram so those nodes being work elements of the same
precedence are arranged vertically in columns
1 List the elements in order of their columns column I at the top of the list If an
element can be in more than one column list all columns by the element to show
the transferability of the element
2 To assign elements to workstations start with the column I elements Continue
the assignment procedure in order of column number until the cycle time is
reached [36]
2233 Supply
The supply chain is defined as a network of facilities and distribution options that performs
three tasks One is procurement second is manufacturing or transformation of these
materials into products and the third is distribution which is to deliver the manufactured
products to the ultimate or end customer [37]
Figure 25 shows the set of suppliers and then there is the manufacturing or the
organization produced goods are sent to customers through a channel so it could be a
distribution channel and from there it goes to the final customer
THEORETICAL BACKGROUND 32
OPTIMIZING THE WORK ENVIRONMENT USING LEAN AND CONTINUOUS IMPROVEMENT TOOLS-PRINTING FLOOR MANIVANNAN SAMPATH
Figure 25 Represents the flow across enterprises [38]
There are four primary uses of the term lsquosupply chain managementrsquo [38]
bull First the internal supply chain that integrates business functions involved in the
flow of materials and information from inbound to outbound ends of the
business
bull Secondly the management of two-party relationships with immediate suppliers
bull Thirdly the management of a chain of businesses including a supplier a supplierrsquos
suppliers a customer and a customerrsquos customer and so on
bull Fourthly the management of a network of interconnected businesses involved in
the ultimate provision of product and service packages needed by end
customers
Performance in supply chain management
Network performance
Easton [39] investigated performance differences between single-sourcing and multiple-
sourcing networks They proposed that single-sourcing networks would be more rigid
and stronger as there would be dense flows of exchanges within them It would also be
easier to keep confidentiality in single sourcing However the advantages of multi-
source or extensive networks included an ability to adapt to changes in the environment
through switching and a broader base to generate innovation from advocated multiple
sourcing as an essential strategy for firms who needed to reduce uncertainty in
purchasing
Chain performance
Logistics research into chain performance has focused primarily on improving speed and
cost performance Improvements in speed and cost may relate to the physical supply
THEORETICAL BACKGROUND 33
OPTIMIZING THE WORK ENVIRONMENT USING LEAN AND CONTINUOUS IMPROVEMENT TOOLS-PRINTING FLOOR MANIVANNAN SAMPATH
chain through which materials are converted and goods flow to end customers or to
the process chain of orders and demand transmission [40]
Relationship performance
Recent purchasing literature emphasizes the increasing importance of measuring and
monitoring performance within relationships because of the increased dependency
between the parties A performance measurement system implemented by the
purchasing party can enhance the buy-sell relationship However most performance
measurement systems in use do not do this for three main reasons First they
incorporate mostly hard objective measures which may not be proper for measuring
softer features of capability and performance Secondly the measurement systems are
usually designed by the purchasing organization for the purchasing organization rather
than for the relationship as a quasi-organization [41]
23 Lean concepts and tools
Lean is a management philosophy that focuses on reconfiguring organizational
processes to continually reduce and eliminate waste over time thereby contributing to
efficiency and value creation for the customer [42]
The concept of lean is the Toyota way promoted by Toyota which helps in improving
the flow of a process in a system is by dropping any uneven workflow throughout the
system Tools namely pull system by ldquoKanbanrdquo and production smoothing or ldquoheijunkardquo
are used for improving the flow in a system
Womack and Jones [43] stated lean is a management philosophy that focuses on
reconfiguring organizational processes to continually reduce and cut waste over time
thereby contributing to efficiency and value creation for the customer To this end Lean
applies specialist analytical tools and techniques
The concept helps in reducing waste (Muda) in any organization without affecting its
products or services which also includes the waste occurred due to overburden (muri)
and uneven workload (Mura) scenarios which are considered as significant causes of
creating losses Several tools and practices have been developed to achieve lean
Figure 26 presents the classification of the tools as suggested by Salonitis and
Tsinopoulos [44]
THEORETICAL BACKGROUND 34
OPTIMIZING THE WORK ENVIRONMENT USING LEAN AND CONTINUOUS IMPROVEMENT TOOLS-PRINTING FLOOR MANIVANNAN SAMPATH
Figure 26 Lean manufacturing tools and practices [44]
The use of lean will allow any organization to achieve continuous and valuable
propositions for their key stakeholders A lean manufacturing initiative is focused on
cost reduction and increases in turnover by systematically and continuously cutting all
non-value-added activities [45]
Benefits of lean
As been said by many authors the benefits of lean can be grouped and represent five
improvement dimensions waste elimination continuous improvement continuous
flow and pull-driven systems multifunctional teams and information systems The
main benefits are related to the reduction of different type of resources reduced
delivery time increased productivity higher quality faster problem solving and decision
making and higher customer satisfaction [46]
Through lean manufacturing can be achieved by using less human effort in the factory
less space less financial resources and less material for producing the same product
[47]
231 Concept of waste
The concepts of waste are central to the Lean method that has been adapted from its
manufacturing origins and applied successfully to the context in several organizations
Howell defines waste as the difference in productivity when benchmarked against the
performance criteria for a production system failure to meet the unique requirements
of a client considered waste [48]
THEORETICAL BACKGROUND 35
OPTIMIZING THE WORK ENVIRONMENT USING LEAN AND CONTINUOUS IMPROVEMENT TOOLS-PRINTING FLOOR MANIVANNAN SAMPATH
Waste also defined as ldquoAnything that does not add value to the customer is a wasterdquo
Waste adds to time and cost This definition captures the thinking behind operations
management most effectively because it takes into consideration not just the material
wastes but also other resources like time and labor to which we can assign some form
of value [49]
Waste can be in the form of additional output input or processing It can be in the form
of materials stocks equipment facilities manhours utilities documents expenses
motion and other activities that do not add value [50]
Muda Muri Mura are three different types of wastes
Muda
Muda means waste or uselessness This type of waste characterized by using time
money and resources while not adding any value to the customer The goal of finding
Muda is to recognize which steps are necessary for the process and which need to be
reduced or eliminated [51]
bull Type I Muda Non-value-added tasks which seem to be essential Business
conditions need to be changed to cut this type of waste
bull Type II Muda Non-value-added tasks which can be eliminated at once
Taiichi Ohno the author of Toyota Production System devised seven manufacturing
wastes Overproduction Inventory Over-processing Correction Waiting Conveyance
and Motion [52]
Muri
Muri means overburden or unreasonableness (waste of overloading equipment facility
or people resources beyond its ability)
Mura
Mura means variation or unevenness It refers to waste of unevenness in production
volume It may take two different forms variation in production scheduling uneven
production workload and pace of work
232 POKE-YOKE
In 1961 Shigeo Shingo introduced Poka-Yoke method when he is one of the engineers at
Toyota Motor Corporation This method in other words is to prevent defects and errors
originating in the mistake [53]
The basis for poke yoke is that defects occur because of worker errors Although poke
yokes may be used for mistake-proofing any process poke yokes are usually targeted to
repetitive tasks where the potential for human error is more likely [54] Poka-Yoke
design can dramatically decrease the risk of producing defectives again [55] The aim of
THEORETICAL BACKGROUND 36
OPTIMIZING THE WORK ENVIRONMENT USING LEAN AND CONTINUOUS IMPROVEMENT TOOLS-PRINTING FLOOR MANIVANNAN SAMPATH
Poka-Yoke method is to eliminate or minimize human errors in manufacturing processes
and management because of mental and physical human imperfections [53]
DTommelein [56] after performing mistake-proofing in an AEC (Architecture
Engineering construction) industry stated that mistake-proofing could be practiced
within a specialty (eg plumbing electrical or mechanical work) it can be practiced by
designers manufacturers or fabricators to benefit a product as it is being constructed or
throughout its lifecycle performance or it can be practiced by designers to benefit a
system
Poke-yoke inspection methods
Successive self and source inspection can be achieved using poke yoke methods Poke-
yoke achieves 100 percent inspection through mechanical or physical control [57]
Regulatory functions of poke yoke
There are two ways where poke yoke can be used to correct mistakes
bull Control type
The control poke-yoke is the most robust corrective device because it shuts
down the process until the poor condition has been corrected [57]
bull Warning type
The warning poke-yoke allows defective processing to continue if workers do not
respond to the warning [57]
Figure 27 shows the two types poke yoke methods
Figure 27 Function of Poke-Yoke [58]
The decision to implement a poke-yoke must be made based on a cost-benefit analysis
The control poke-yoke is the more effective in most cases [57]
There are three types of control poke-yoke
bull The contact method finds defects by slight changes in product shape or dimension
are sometimes introduced deliberately to make defects easier to find color
differences
bull The fixed value method decides whether a given number of movements is made
THEORETICAL BACKGROUND 37
OPTIMIZING THE WORK ENVIRONMENT USING LEAN AND CONTINUOUS IMPROVEMENT TOOLS-PRINTING FLOOR MANIVANNAN SAMPATH
bull The motion step method decides whether the established steps or motions of a
procedure are followed [57]
The Poka-Yoke is a technique for avoiding human error at work A defect exists in either
of two states the defect either has already occurred calling for defect detection or is
about to occur calling for defect prediction [59]
Step by step process in applying poka-yoke
bull Find the operation or process
bull Analyze and understand the ways in which a process can fail
bull Decide the right Poka-yoke approach such as using a
o Control Type Preventing an error being made
o Warning Type Highlighting that an error has been made
bull Determine whether a Contact Method Constant Number or Counting Method
Motion-Sequence Method
bull Trial the method and see if it works
bull Train the operator review performance and measure success [60]
233 MUDA
There are two types of waste (Muda)
Muda Type I non-value adding but necessary for end-customers These are usually
harder to eliminate because while classified as non-value adding they may still be
necessary For example while an end-customer might not view quality inspection in car
assembly as value-adding it is necessary to ensure the car meets safety standards
Muda Type II non-value is adding and unnecessary for end-customers These contribute
to waste incur hidden costs and should be eliminated
Figure 28 shows the seven types of waste by Taiichi Ohno
Figure 28 Types of waste [61]
THEORETICAL BACKGROUND 38
OPTIMIZING THE WORK ENVIRONMENT USING LEAN AND CONTINUOUS IMPROVEMENT TOOLS-PRINTING FLOOR MANIVANNAN SAMPATH
Transportation
Transport is an inseparable part of the production processes which cannot be removed
However it does not give any value to the final product and this is why the aim is to
reduce it to the lowest possible level [61]
Inventory
Inventory wastes come from the purchasing storage of excess or excessive supplies
materials and other resources This waste can also be caused by overproduction as
excess materials and work-in-process are accumulated Inventory waste is often due to
a lack of planning and failure to match purchases with the actual consumption or usage
rate of a resource [50]
Motion
Unnecessary movements in the manufacturing environment will result in processing
delays Other unutilized talents are employee lost time excellent skills employee ideas
and recommendations for simplifying the process [62]
Waiting
Some common wait time is caused by processing delays machine or system downtime
response time and signature needed for approval wait time Delay usually caused by the
loading and unloading the workpiece in the machines The operatorrsquos time allocation is
more than that of the actual processing time This excess time allocation for the
operators to do the job increases the overall wait time and delay in the process [63]
Over-production
Making more of a product that is needed results in several forms of waste typically
caused by production in large batches The customers needs often change over the time
it takes to produce a larger batch Over-production has been described as the subdue
waste
Over-processing
Doing more to a product that is needed by the end-customer results in it taking longer
and costing more to produce They do not answer to a real need adding more value to
the service than the customers are willing to pay for Design or build a work that presents
an oversized performance if compared with real demand [64]
Defects
Whenever defects occur extra costs are incurred by reworking the part rescheduling
production etc [61]
THEORETICAL BACKGROUND 39
OPTIMIZING THE WORK ENVIRONMENT USING LEAN AND CONTINUOUS IMPROVEMENT TOOLS-PRINTING FLOOR MANIVANNAN SAMPATH
234 SMED
The SMED method was developed by Shingo (1985) who described it as a scientific
approach to reduce setup times and which can be applied to any industrial unit and to
any machine
SMED is defined as the minimum amount of time necessary to change the type of
production activity taking into consideration the moment in which the last piece of a
previous lot was produced to the first piece produced by the subsequent lot [65]
SMED helps to reduce machine setup times by cutting wastes and unnecessary setup
processes and helps to improve current setup processes and manufacturing flexibility
[66]
By focusing on the elimination of the waste associated with tool changeovers in the
setup phase SMED allows for the reduction of lot sizes and enables one to meet the
fluctuation of demand It further cuts the waste inherent to stock buildup and enhances
a reduction in lead time [67]
The SMED method in association to other Lean tools on a seat-cable assembly line at
the automotive sector company showed a reduction in setup time by at least 583
corresponding to 210 min in a week [68]
A fundamental aspect of the SMED method relates to its features of internal and
external activities
External activities
All the setup activities which do not interfere directly with the equipment and which
can be carried out without interrupting production are designated as being external
activities
Internal activities
Those who imply a stoppage in the equipment running are described as internal
activities The correct separation of the two is what fundamentally contributes to a
reduction in setup times [67]
Figure 29 shows the different phases of a SMED process
THEORETICAL BACKGROUND 40
OPTIMIZING THE WORK ENVIRONMENT USING LEAN AND CONTINUOUS IMPROVEMENT TOOLS-PRINTING FLOOR MANIVANNAN SAMPATH
Figure 29 The phases of SMED method [69]
In sum the SMED method consists of four phases when aiming to reduce setup times
bull PHASE A - In this phase there is not a clear separation between activities that
must be performed while the equipment is stopped (activities that are not
making parts or internal activities) and the ones that can be done while
equipment is running (activities making parts or external activities) In this
phase the involvement of everyone is critical and should be specifically assured
bull PHASE B - This phase refers to the detailed characterization organization and
separation of the operations in internal or external Shingo (1985) considers this
the most crucial phase from which the setup can be reduced from 30 to 50
bull PHASE C - a new analysis of all operations should be done to verify the
classification done in the phase B and focus effort should be directed to convert
internal operations into external The implementation of this phase should
allow an improvement from 10 to 30 in the total time of internal setup of
the phase B [65]
bull PHASE D ndashthe primary goal is to reduce the time of internal and external
operations through the application of the identified solutions that will allow an
easy fast and secure performance
Benefits of Single Minute Exchange of die
bull The reduction of inventory the increase in production flexibility and the
rationalization of tools is among the indirect benefits
bull The direct benefits include the reduction of setup time the reduction of time
spent with fine-tuning the machines the reduction of errors during
changeovers the improvement of product quality and increased safety [65]
235 5S
The 5S lean tool was developed in Japan by Sakichi Toyoda Kishiro Toyoda and Taiichi
Ohno in 1960 [70] 5S is a method of organizing the workspace in a clean efficient and
safe manner to achieve a productive work environment The 5S is a starting point for
THEORETICAL BACKGROUND 41
OPTIMIZING THE WORK ENVIRONMENT USING LEAN AND CONTINUOUS IMPROVEMENT TOOLS-PRINTING FLOOR MANIVANNAN SAMPATH
any company that wants to be recognized as a responsible producer worthy of world-
class status [71]
Implementation of the five levels can reduce the amount of waste and errors and
increase productivity improve safety and quality of products or services [72]
Figure 30 shows the 5 stages of 5s as implementation steps
Figure 30 5S method [73]
The method consists of the sequential following of five steps
bull Seiri (Sort)
The workplace should only have what is needed to perform the activities
Remove all unnecessary tools and parts Go through all tools materials and so
forth in the plant and work area Keep only essential items
bull Seiton (Set in order)
There must be a place for everything and everything should be in its place Quick
and visual identification of tools and areas saves time and eases processes
bull Seiso (Shine)
To keep everything clean and neat One aspect of ldquoSeisordquo is to design and
implement effective methods which must be integrated into the operatorsacute daily
maintenance tasks
bull Seiketsu (Standardize)
Documenting and standardizing the method using standard procedures
Standards should be very communicative clear and easy to understand
bull Shinseki (Sustain)
The last step consists of developing a method to ensure the 5S technique is
followed It needs discipline and focus Usually audits are performed to assure
the sustainability of the method
The implementation of 5s in automotive cable production plant and its case study
concludes that implementing and maintaining 5S method and standards in the company
THEORETICAL BACKGROUND 42
OPTIMIZING THE WORK ENVIRONMENT USING LEAN AND CONTINUOUS IMPROVEMENT TOOLS-PRINTING FLOOR MANIVANNAN SAMPATH
led to improved performances increase of the productivity of the organization the
safety at workplace and the product quality has been increased [73]
5S bring several benefits to a company being the most relevant one the decrease in a
waste of time and space According to Hirano the rewards of applying 5S are extended
to quality security and hygiene [74]
24 Continuum improvement tools
Continuous improvement or Kaizen is a method for finding opportunities for
streamlining work and reducing waste The practice was formalized by the popularity of
Lean Agile Kaizen in manufacturing and business and it is now being used by
thousands of companies all over the world to find savings opportunities Many of these
ideologies can be combined for excellent results For example Kaizen and Kanban can
go hand-in-hand to facilitate continuous improvement
241 PDCA
Deming introduced PDCA to Japanese enterprises in 1950 according to which quality
improvements take place through four significant steps Plan-Do-Check-Act Since then
Japan has become the world leader in quality management [75] PDCA is a successive
cycle which starts off small to test potential effects on processes but then gradually
leads to more substantial and more targeted change [76] It consists of a logical
sequence of four repetitive steps for continuous improvement and learning These all
four steps are repeated over and over as part of a never-ending cycle for improvement
[77] Figure 31 shows the process of the PDCA cycle in a clockwise direction
Figure 31 PDCA Cycle [77]
THEORETICAL BACKGROUND 43
OPTIMIZING THE WORK ENVIRONMENT USING LEAN AND CONTINUOUS IMPROVEMENT TOOLS-PRINTING FLOOR MANIVANNAN SAMPATH
According to Gorenflo and Moran [78] [79] the phases of PDCA can be understood as
follows
bull Plan In this phase opportunities for improvement are found and prioritized the
current situation of the process is investigated through consistent data the
causes of the problem are determined and possible actions to mitigate the
issues are chalked out
bull Do The purpose of this step is to implement the action plan select and document
data voluntarily and note the unexpected events lessons learned and
knowledge gained
bull Check At this point the results of the actions are analyzed The new situation is
compared to the old verifying if there were improvements and whether aims
were met For this various graph support tools are used
bull Action At this stage the team involved develops methods that will standardize
the improvement (if the result has been reached) repeats the test to collect new
data and re-evaluate the intervention (if the collected data is insufficient or
circumstances have changed) or abandon the project and make another
beginning from stage 1 (if the actions taken have not generated useful
improvements)
The application of PDCA has seen various improvements in different scenarios where
they were performed According to PDCA Processes can be improved with changes in
workplace layout material handling system workplace arrangement and
Standardization of operations [80]
The PDCA cycle ensures two types of corrective action ndash temporary and permanent The
short action is aimed at practically tackling and fixing the problem The permanent
corrective action consists of investigation and cutting the root causes and thus targets
the sustainability of the improved process [81]
242 TFM
TFM is then defined as an integrated concept to increase Process Flow and Effectiveness
(Pull) across the Totality of a Supply Chain The targets are the reduction of the total lead
time in the SC Reducing lead time also drops Muda of waiting and really means creating
a material flow [82]
Primarily it is necessary to create an internal pull flow in maximum operational
efficiency and free of non-value added activities (NVAA) then consider the extension to
the valley (the delivery side ie customers) and upstream (the source side ie the
suppliers)
Figure 32 shows the TFM model having the internal pull flow having the suppliers
customers as for source and destination respectively
THEORETICAL BACKGROUND 44
OPTIMIZING THE WORK ENVIRONMENT USING LEAN AND CONTINUOUS IMPROVEMENT TOOLS-PRINTING FLOOR MANIVANNAN SAMPATH
Figure 32 TFM model [83]
The flow of materials can be considered as a repeated sequence of four types of
transaction namely transport inspection waiting and transformation the only value-
added activities The primary objective is the reduction of total lead time as regular
coverage of stocks eliminating Muda process creating benefits in terms of cost
reduction and working capital increased productivity and quality in order to achieve a
higher level of service provided to customers and to improve therefore the satisfaction
[84]
Figure 33 shows the TFM pillars and the strategies involved in each pillar
Figure 33 Total Flow Management Pillars [83]
THEORETICAL BACKGROUND 45
OPTIMIZING THE WORK ENVIRONMENT USING LEAN AND CONTINUOUS IMPROVEMENT TOOLS-PRINTING FLOOR MANIVANNAN SAMPATH
TFM is a model that can trigger a breakthrough in the performance of any Supply Chain
and that embodies the power of a complete lean transformation [83]
The flow of information and materials found through the analysis of logistic loop can be
grouped into three pillars of TFM Figure 33
bull Production Flow
bull Internal coordination flow
bull External coordination flow
In a Total Flow Management optics each of these flows must be analyzed and perfected
by applying the principles of Lean and Kaizen tools
The first step is to improve the production flow which ranks as aims the implementation
of the one-piece flow increased flexibility by adjusting the setup and an increase in
operational efficiency and supply
The improvement actions are divided into these categories
Redesign of the layout and lines in one-piece optical flow redesign of the perimeter of
the line for the efficiency of supply definition of standard work for operational
efficiency SMED technique for flexibility in setup low-cost automation to reduce the
walls
The second step is the optimization of internal logistics flows including all the
movements of small containers inside the plant but also the related information flows
The improvement actions are divided into these categories
bull A system to simplify and streamline internal transport of the material to the point
of use synchronization as coordination between supply and production leveling
productivity of the lines and equipment in relation to the takt time pull
production planning by the actual customer orders
Finally the third step is the optimization of external logistics flows ie the handling of
materials and products generally parceled out in pallet from the factory to customers
and suppliers to the plant
bull In this case the categories of intervention are redesign of the stores and
warehouses creation of the milk run ie an external flow of transport physical
flows in (inbound) and outgoing (outbound) through small containers and
pallets planning pull the logistics to handle the material withdrawals according
to the royal orders of consumers
243 OEE
Overall Equipment Effectiveness (OEE) is a crucial measurement of efficiency in
manufacturing processes (at the machine manufacturing cell or assembly line levels)
THEORETICAL BACKGROUND 46
OPTIMIZING THE WORK ENVIRONMENT USING LEAN AND CONTINUOUS IMPROVEMENT TOOLS-PRINTING FLOOR MANIVANNAN SAMPATH
[9] It is defined as the ratio of producing goods of approved quality to the scheduled
production time (loading time) [85] The OEE has been applied as a measurement tool
and decision-making aid for improving productivity by improving equipment [86] In
general OEE is decided according to each machine used in a production process to
identify its availability quality and performance contributions and to observe the
possible relationships between the different parameters of influence
Equation 2 Represents the formulas involved in calculating OEE
Equation 2 formulations in calculating OEE
119860119907119886119894119897119886119887119894119897119894119905119910(119860) ∶= 119874119901119890119903119886119905119894119898119890 119905119894119898119890 119871119900119886119889119894119899119892 119905119894119898119890frasl
119875119890119903119891119900119903119898119886119899119888119890(119875) ∶= 119873119890119905 119900119901119890119903119886119905119894119899119892 119905119894119898119890 119874119901119890119903119886119905119894119899119892 119905119894119898119890frasl
119876119906119886119897119894119905119910(119876) ∶= 119907119886119897119906119886119887119897119890 119900119901119890119903119886119905119894119899119892 119905119894119898119890 119873119890119905 119900119901119890119903119886119905119894119899119892 119905119894119898119890frasl
119874119907119890119903119886119897119897 119864119902119906119894119901119898119890119899119905 119864119891119891119890119888119905119894119907119890119899119890119904119904 ∶= 119860119907119886119894119897119886119887119894119897119894119905119910 lowast 119875119890119903119891119900119903119898119886119899119888119890 lowast 119876119906119886119897119894119905119910
Figure 34 shows the six significant losses divided into the three categories such as
availability performance and quality where (A) availability is defined as a ratio of
planned production time minus downtime (breakdowns and changeovers) over planned
production time (P) Performance efficiency is the ideal cycle time times the number of
products produced over the actual runtime The (Q) quality rate is the ratio between
accepted products over several products produced
Figure 34 OEE Timeline [87]
Nakajima [86] defines the six significant losses in production as in three categories [85]
THEORETICAL BACKGROUND 47
OPTIMIZING THE WORK ENVIRONMENT USING LEAN AND CONTINUOUS IMPROVEMENT TOOLS-PRINTING FLOOR MANIVANNAN SAMPATH
Downtime losses
1 Equipment failures are categorized as time losses when productivity is reduced
and quantity losses caused by defective products
2 Setup and adjustment time losses result from downtime and defective products
that occur when the production of one item ends and the equipment is adjusted
to meet the requirements of another item
Speed losses
3 Idling and minor stop losses occur when the production is interrupted by a
temporary malfunction or when a machine is idling
4 Reduced speed losses refer to the difference between equipment design speed
and actual operating speed
Quality losses
5 Reduced yield occurs during the initial stages of production from machine startup
to until stabilization
6 Quality defects and rework are losses in quality caused by malfunctioning
production equipment
World class level of OEE is in the range of 85ndash92 for non-process industry [88]
49
ltTIacuteTULO DA TESEgt ltNOME DO AUTORgt
THESIS DEVELOPMENT
31 Production lines characterization
32 Problem characterization
33 Objective
34 Brainstorming
35 SWOT analysis of possible solutions
36 Implementation
THESIS DEVELOPMENT 51
OPTIMIZING THE WORK ENVIRONMENT USING LEAN AND CONTINUOUS IMPROVEMENT TOOLS-PRINTING FLOOR MANIVANNAN SAMPATH
THESIS DEVELOPMENT
31 Production lines characterization
In this section the characteristics of production lines where the work was
performed are briefed and picturized
311 Production line A
There are two printing machines used at this production line they are Heidelberg
Speedmaster 74-5 Heidelberg Speedmaster 52-2 having 5 and 2 printing bodies
respectively each produces products of small batches prints at 15000 sph The machines
are positioned in between the marked yellow line giving enough space for the
production activity to be carried out
Explaining the process in Heidelberg Speedmaster 74-5 production starts by receiving
the order and obtaining required raw materials such as the specified size of printing
paper inks printing plates as per specified in the job sheet
Figure 35 shows the picture of Heidelberg Speedmaster 74-5 printing unit at Marsil
Figure 35 Offset printing SM74-5 unit at Marsil
The inks for the production are introduced into the inking rollers through the reservoir
ducts present at heads of the printing bodies by the machine operator and are evenly
THESIS DEVELOPMENT 52
OPTIMIZING THE WORK ENVIRONMENT USING LEAN AND CONTINUOUS IMPROVEMENT TOOLS-PRINTING FLOOR MANIVANNAN SAMPATH
spread out and so the printing machines are made to run for the inks to reach the
cylinders inside each printing bodies The printing plates are cleaned by cleaning
solutions and introduced into printing bodies in between the plate cylinder and the
impression cylinder(blanket) as the machines grab the plates and set them up through
the press of a button specified at each printing bodies
Figure 36 shows the cleaning solution used for cleaning plates during the production
process
Figure 36 Plate cleaning solution
Control system
Selection of size of the printing area the intensity of the colors to be printed the
thickness of the printing paper size of the production is made through the control
system specified for that printing unit Figure 37 A and B shows the control system
images of Speedmaster 74-5 at the printing unit
A
B
Figure 37 Control systems of SM 74-5
The printing process begins after setup for the production is complete and several prints
for the job being printed and evaluated The evaluation performed through a device that
measures the intensity of the ink printed on the paper and the results compared to the
THESIS DEVELOPMENT 53
OPTIMIZING THE WORK ENVIRONMENT USING LEAN AND CONTINUOUS IMPROVEMENT TOOLS-PRINTING FLOOR MANIVANNAN SAMPATH
expected level by the operator The operator performs a few more prints by changing
the intensity level on the control system and the operation repeated until the operator
has a superior quality of prints for the job This shows that the production unit is partially
automatedFigure 38 A and B shows the image of measuring devices used at every
production unit during preparation operations
A
B
Figure 38 Measuring devices
Figure 39 Shows the image of goods produced by speedmaster 74-5 arraged on pallets
Figure 39 Products produced by SM74-5
The produced goods are then transferred to the next production unit with help of
manual fork lifters where the final goods are produced according to requirements
Figure 40 shows the image of manual fork lifter used for transferring goods
THESIS DEVELOPMENT 54
OPTIMIZING THE WORK ENVIRONMENT USING LEAN AND CONTINUOUS IMPROVEMENT TOOLS-PRINTING FLOOR MANIVANNAN SAMPATH
Figure 40 Manual fork lifter
The speedmaster 52-2p having 2 printing bodies performs printing through two colors
using plates sizing 459x525 mm The setup for the production is the same as the
Speedmaster 74-5 The produced prints are corrected visually by comparing the prints
produced to an ideal print copy and the required intensities of ink to be printed changed
by changing the knob present at the heads of the printing bodies of the machine This
shows that the printing machine is partially automated
Figure 41 shows the image of Speedmaster master 52-2 with control system along with
the printing machine
Figure 41 SM 52-2
312 Production line B
The production line B has two production units speedmaster 52-4 and web-fed offset
printing machine
THESIS DEVELOPMENT 55
OPTIMIZING THE WORK ENVIRONMENT USING LEAN AND CONTINUOUS IMPROVEMENT TOOLS-PRINTING FLOOR MANIVANNAN SAMPATH
Figure 42 shows the image of Speedmaster 52-4 at the production line
Figure 42 SM 52-4
The speedmaster 52-4 has 4 printing bodies using 4 colors for the printing process with
the printing plates sizing 459x525 mm The produced prints are corrected at the
workstation which also has a control station The setup for the production is the same
as the Speedmaster 74-5 The printing machine has a control system separately with the
work station
THESIS DEVELOPMENT 56
OPTIMIZING THE WORK ENVIRONMENT USING LEAN AND CONTINUOUS IMPROVEMENT TOOLS-PRINTING FLOOR MANIVANNAN SAMPATH
Control system
The control system for speedmaster 52 4 is provided with the workstation where the
evaluation works are performed and the input is fed accordingly For example the
thickness of the sheet dimensions of the printing area adjustments of the margins the
flow of die and much more can be performed
Figure 43 shows the images of the control systems for Speedmaster 52-4
Figure 43 A and B control systems for Speedmaster 52-4
Figure 44 shows the image of goods produced by the printing machine SM 52-4
Figure 44 Goods produced at SM 52-4
The next printing unit in this line is the didde web offset printing machine with 4 printing
bodies capable of printing 80m minute Sheets of the maximum length of 340mm to a
minimum of 100mm can be printed The machine is installed spatially along with the
other 3 machines
THESIS DEVELOPMENT 57
OPTIMIZING THE WORK ENVIRONMENT USING LEAN AND CONTINUOUS IMPROVEMENT TOOLS-PRINTING FLOOR MANIVANNAN SAMPATH
Figure 45 shows the picture of didde web-fed printing unit at Marsil
Figure 45 Web-fed Printing unit
Control system
The control systems at these production units assigned along with the printing bodies
The usage of the printing bodies adjusted according to the work needs by removing one
of the gears at a specific printing body that is not involved in the working of the printing
machine
Figure 46 shows the image of goods produced by didde webfed printing machine
Figure 46 Products produced at the webfed unit
THESIS DEVELOPMENT 58
OPTIMIZING THE WORK ENVIRONMENT USING LEAN AND CONTINUOUS IMPROVEMENT TOOLS-PRINTING FLOOR MANIVANNAN SAMPATH
313 Production line C
The Production line c has two printing machines they are heidelberg SORM-Z and
heidelberg GTO 52
The heidelberg SORM-Z semi automated printing machine consists of 2 printing bodies
uses printing plates with size 720x540 mm capable of printing 30 million copies having
printing format maximum of 720x540 mm and minimum of 280x210 mm The machine
is positioned patially along with heidelberg GTO The control system is provided along
with the machine Each machine at the production floor is provided with fire
extinguishers as safety precautions
Figure 47 shows the image of heidelberg SORM-Z at the printing floor
Figure 47 Heidelberg SORM-Z
The heidelberg GTO- 52 capable of printing sheets maximum of 520x360 mm to
minimum of 160x80 mm with two printing bodies printing 8000 sph The control system
for GTO-52 comes along with the printing machine
Figure 48 shows the image of heidelberg GTO-52 at the printing floor
Figure 48 Heidelberg GTO-52
THESIS DEVELOPMENT 59
OPTIMIZING THE WORK ENVIRONMENT USING LEAN AND CONTINUOUS IMPROVEMENT TOOLS-PRINTING FLOOR MANIVANNAN SAMPATH
314 Production line D
The Production line D has 3 heidelberg minivera machines cutting machines striching
machines finishing machines as well as laminating machines at the other half of the
production floor
Three heidelberg minerva machines are used for the purpose of cutting and ceasing with
maximum format of 360x260 mm to a minimum format of 80x50 mm operating at a
speed of 3000 sphFigure 49 shows the 3 heideberg minerva cut and cease machines at
the printing floor
Figure 49 Heidelberg Minerva
The cutting machines each are with specific specification but all does the same work of
cutting required printing sheets for productioncutting works required by the printed
products
Table 2 Shows the specifications of three cutting machines present at the floor
Table 2 cutting machine specification
Model Maximum
format
Minimum
format
Polar-76 760x760 mm 30x760 mm
Polar 78 780x780mm 30x780mm
Polar-92 920x920mm 30x920mm
Figure 50 shows the picture of polar 92 cutting machine
THESIS DEVELOPMENT 60
OPTIMIZING THE WORK ENVIRONMENT USING LEAN AND CONTINUOUS IMPROVEMENT TOOLS-PRINTING FLOOR MANIVANNAN SAMPATH
Figure 50 Cutting machine polar 92
There are two finishing machines at the floor they heidelberg STAHL Ti-52 and Double
600i
Heidelberg STAHL Ti-52 performs actions such as creasing perforating and cutting jobs
in the folder It increases fold quality and allows for a multi-up processing having
processing speed of 200 mminute and 10 mminute as maximum and minimum speed
respectively This machine is used for creating magazines which includes all the above
mentioned actions
Figure 51 shows the image of heidelberg STAHL Ti-52 finishing machine
Figure 51 Heidelberg STAHL Ti-52
The double 600i finishing maching with maximum format of 660x330 mm to a minimum
of 120x180mm performing at a speed of 3750 sph performs the same actions as of
heidelberg STAHL Ti
Figure 52 shows the image of double 600i finishing machine at the printing floor
THESIS DEVELOPMENT 61
OPTIMIZING THE WORK ENVIRONMENT USING LEAN AND CONTINUOUS IMPROVEMENT TOOLS-PRINTING FLOOR MANIVANNAN SAMPATH
Figure 52 Double 600i
32 Problem characterization
The problems in the company were segmented as follows -
1 Missing of machine tools in the printing floor creating a tool room The issue is
when a specific tool is taken for a machining purpose the tool is left somewhere
unnoticed after its use causing difficulties (waste of time) when the same tool is
needed by another worker on the floor no enlistments of the tools neither
proper maintenance of the tool room nor tool chart
Figure 53 shows the tool room used left with residues and the tool board being empty
Figure 53 Pegboard with the missing tools
2 Improper usage of the inkrsquos in the paint room the issue found to be is that inks
are prepared and stored in tins these ink tins are labeled in markers and left
THESIS DEVELOPMENT 62
OPTIMIZING THE WORK ENVIRONMENT USING LEAN AND CONTINUOUS IMPROVEMENT TOOLS-PRINTING FLOOR MANIVANNAN SAMPATH
open once after their use These ink tins do not have any organized setup such
that the tins of different Pantone numbers get mixed up resulting in the
unnoticed behavior of the operator lead to drying of paints and ending as
waste
3 The company has printing machines using printing plates of four varied sizes 400
x 510 mm 450 x 628 mm 605 x 745 mm 615 x 724 mm The printing plates
which are made for the printing works are used and they are kept organized on
the floor according to their client once after the job is completed This has been
followed for a long time and ended up in stacking up vast volumes of printing
plates together which resulted in consuming a lot of time while retrieving those
when there is a reorder of a job made by the client The time taken for a worker
to retrieve a plate for a specific job was found to be 15-30 mins and up to 60
mins at times When a specific printing plate was not to be found set of printing
plates for the concerned job is made and provided to workers resulting in added
wastage of the production time
Figure 54 shows the image of plates arranged on the floor according to their clients
Figure 54 Printing plates arranged on the floor according to their clients
33 Objective
The aim of this thesis is to improve the conditions of the above-stated problems at
Marsil with the help of lean tools and continuous improvement tools by
bull Creating a tool room for the machinery works to take place and to create a tool
chart for organizing tools
bull Creating a system for organizing the ink tins in the paint room
THESIS DEVELOPMENT 63
OPTIMIZING THE WORK ENVIRONMENT USING LEAN AND CONTINUOUS IMPROVEMENT TOOLS-PRINTING FLOOR MANIVANNAN SAMPATH
bull Implementing a system for the printing plates to be organized and quick retrieval
of the plates from the system for the printing jobs
34 Brainstorming
Brainstorming is a process of generating ideas and solutions through fast thinking and
group discussion In this section brainstorming is made on the problems said by the
management and possible solutions and ideas were reached
341 Objective A
Brainstorming sessions were made on the creating a tool room consisting of a tool-chart
The problem seen was the tool room stuffed with many printed goods machines and
with residues of works performed in the room
Figure 55 shows various causes that led to the missing of tools on the production floor
as well as unmanaged tool room
Figure 55 Cause and Effect diagram on missing tools and unmanaged paint room
Researches were done on the process of creating a system that keeps tracks on the
usage of tools and controlling the flow of resources from the pegboard Kanban pull
system is studied where the goal of such a system is to replace what has been consumed
at that time when resources are needed or asked Here in this system color cards
(Kanban cards) of different colors will be used to show the availability of the resource in
the clipboard Layout of the working floor made by showing the production lines and the
working areas as blocks in different colors The color of each production line shows the
color card or the Kanban card assigned to it
THESIS DEVELOPMENT 64
OPTIMIZING THE WORK ENVIRONMENT USING LEAN AND CONTINUOUS IMPROVEMENT TOOLS-PRINTING FLOOR MANIVANNAN SAMPATH
In preparing setting up the system the documentation of the work which includes the
checklists of the available tools and machinery should be made and checked the working
of the system is then explained to all the operators in the printing floor and the system
should be studied regularly
342 Objective B
The issue said to be the lack in the organization of ink tins in the paint room Inks are
prepared according to the production needs ie when the job sheet reaches the
respective production unit on the printing floor press operator decides to make the
required ink for the production use for that specific job The ink is prepared with the
help of the Pantone matching system which shows the required quantity of colors to be
mixed in creating that ink which is then stored in tins
After the production process in preparing the prints of a job is completed tin consisting
the remaining quantity of ink is labeled with Pantone number by markers as indicators
and are stored in the paint room These paint tins are left unnoticed due lack of proper
arrangement which is left to dry and is not used again to solve this issue discussions
were made and an idea was proposed in arranging the ink tins according to Pantone
series
Figure 56 shows the various causes their part leads to unorganized ink tins and drying
of paints
Figure 56 Cause and effect diagram on unorganized ink tins
Discussions were made and ideas were explored on areas of warehouse codification
and arranging the ink tins in a better way for easy accessibility and labeling of the ink
tins
THESIS DEVELOPMENT 65
OPTIMIZING THE WORK ENVIRONMENT USING LEAN AND CONTINUOUS IMPROVEMENT TOOLS-PRINTING FLOOR MANIVANNAN SAMPATH
343 Objective C
The problems told by the management before working on the printing plates were the
operators spend much longer time in searching for the printing plates when there is a
job that needs printing plates produced before as because many clientrsquos requests
reorder and they do not have a system for organizing the printing plates
The first scenario was printing plates kept on the floor according to the clients with
support to the wall Since the company provide service to many clients there exist many
printing plates associated to many job numbers The workers receive the order sheet
have the order made by the client which consists of the order number size of the plate
number of plates to be used for the specific job and a preview copy of the same job that
was done long before The order sheet also includes the work of the previous jobs
carried on the same work with few variations So this ensures that there are many job
sheets of different order numbers of the same work The management also told that if
there are changes in a job that has been done before the plate manufacturer prepares
the new plates for job updates the order sheet of the job This order sheet and the plate
along with plates is received by the operator and the job is carried out The plates are
arranged along with other plates that were made for the same client The operators in
the printing floor said that it might take them 30-45 mins or even more when they are
trying to retrieve plates for reorders
Figure 57 shows the cause and effect diagram on setup made by the organization
Figure 57 Cause and effect diagram on printing plate setup made by management
THESIS DEVELOPMENT 66
OPTIMIZING THE WORK ENVIRONMENT USING LEAN AND CONTINUOUS IMPROVEMENT TOOLS-PRINTING FLOOR MANIVANNAN SAMPATH
Discussions made with operators and the management about a system for the
organization and retrieving the plates in a short span of time Researches made onto
check types of storing systems available in the market for organizing the plates Results
were found with systems capable of hanging the plates to it with the help of hooks with
covers for the plates and found to be expensive Hence disagreed by the management
In minimize the usage of production time in searching for the printing plates for an
order the organization suggested arranging the printed plates inside the cardboard
boxes(boxes of the printing plates when bought newly) The method proposed to be
simple that involves arranging the plates inside the boxes and specifying a number on
the boxes that will be written in the order sheet that the operators receive The capacity
of each box found to be 60 and arranging 60 plates in those will be seeming to be
congested and will be difficult for the operators in retrieving the necessary plates
needed for a job and will consume a lot of space and requires work to be done while
arranging them in boxes
The printing plates have information such as the companyrsquos name model number job
number sheet number date of manufacturing the plates So all these need to be
considered while designing the system for the organization of the printing plates
The company had resources in implementing three racks with the length of 240 cm The
idea was to divide the rack of length 240 cm into 54 slots with separators between each
slot The thickness of the separators is 04 cm and the width of each slot is 4cm a rough
estimation of 35-40 plates each of 450 x 628 mm shall be placed into those slots and a
total of 2160 plates can organize into these 54 slots divided from 240 cm length rack
Identification of the plates can be made by code which has a combination of an alphabet
and number The codification will be made by assigning an alphabet to each row and a
number to each slot Here the alphabets A B C assigned to the three racks and the
numbers from 1- 54 assigned to the slots Hence the plates can be arranged into the
slots which give the slot locations as A1 A2 A3 119860119899etc
Figure 58 below-mentioned flowchart shows the flow of work from receiving the order
manufacturing the printing plates operators receiving the plates for production
management decision on saving the plates or throwing them away as thrash
THESIS DEVELOPMENT 67
OPTIMIZING THE WORK ENVIRONMENT USING LEAN AND CONTINUOUS IMPROVEMENT TOOLS-PRINTING FLOOR MANIVANNAN SAMPATH
THESIS DEVELOPMENT 68
OPTIMIZING THE WORK ENVIRONMENT USING LEAN AND CONTINUOUS IMPROVEMENT TOOLS-PRINTING FLOOR MANIVANNAN SAMPATH
Figure 58 Flow chart
THESIS DEVELOPMENT 69
OPTIMIZING THE WORK ENVIRONMENT USING LEAN AND CONTINUOUS IMPROVEMENT TOOLS-PRINTING FLOOR MANIVANNAN SAMPATH
35 SWOT analysis of possible solutions
In this section SWOT analysis is made on the ideas proposed for the aim to understand
the strength weakness opportunities and threats involved in implementing the ideas
351 Objective A SWOT analysis
The SWOT analysis made on the idea to be implemented in creating a tool chart
distribution of tools to all the units at the printing floor and in the maintenance of the
tool room
Figure 59 shows the SWOT analysis of Strength weakness opportunity and threats
involved in implementing the tool 5s and in creating the tool chart
Figure 59 SWOT analysis on objective A
352 Objective B SWOT analysis
The SWOT analysis performed on organizing the ink tins on shelves shows various
strengths weakness opportunities threats gathered giving enough support in
implementing the system
Figure 60 shows the strength weakness opportunity and threat involved in creating a
system for organized ink tins
THESIS DEVELOPMENT 70
OPTIMIZING THE WORK ENVIRONMENT USING LEAN AND CONTINUOUS IMPROVEMENT TOOLS-PRINTING FLOOR MANIVANNAN SAMPATH
Figure 60 SWOT on objective B
353 Objective C SWOT analysis
The SWOT analysis structured on the idea of creating a system in organizing the printing
plates into it The positive effects in using the continuous improvement tool in
implementing the system and gathering of data about the plates and configuring them
in working together to work efficiently
Figure 61 shows the Strength weakness opportunity and threats involved in creating
two systems for organizing the plates
THESIS DEVELOPMENT 71
OPTIMIZING THE WORK ENVIRONMENT USING LEAN AND CONTINUOUS IMPROVEMENT TOOLS-PRINTING FLOOR MANIVANNAN SAMPATH
Figure 61 SWOT on objective C
36 Implementation
This section shows the practice of the continuous improvement and other lean tools on
each of the objectives and their procedures in implementing the steps and achieving the
results
361 Implementation of 5S
Implementation steps
1 The tool room was initially seen filled with printed goods and with other finished
materials These printed materials were considered waste by the company since
they were outdated and did not add any value Hence they were cleared from
the tool room
2 Tools except machinery tools (tools that came along with the machine) were
collected from every production line and an inventory list of the available tools
in the printing floor was made Tools that were needed or requested by any
operator were bought so the missing tools were covered
Figure 62 shows the image of tools collected as being a step in implementing 5s
THESIS DEVELOPMENT 72
OPTIMIZING THE WORK ENVIRONMENT USING LEAN AND CONTINUOUS IMPROVEMENT TOOLS-PRINTING FLOOR MANIVANNAN SAMPATH
Figure 62 Collected tools
3 Tools are left to hang on the pegboard with the help of hooks Organization of the
tools were done according to increase in the order of their sizes for each category
of tools and were arranged in such a way that the entire pegboard is filled with
the available tools
4 The entire tool room was cleaned and for the distribution of tools to the
machines at the printing floor Kanban system was studied and the use of
Kanban cards to effectively implement the pull system
5 The entire layout of the printing floor with production lines was designed During
this process production lines in the floor have been segmented and were
assigned to a specific color in the layout design The Kanban cards of colors Red
green yellow orange dark blue brown and purple were made These Kanban
cards represents the segmented production units designed in the layout
Figure 63 kanban cards of different colors created to replace the tool spot in absence of
tools from the peg board
Figure 63 Kanban cards
THESIS DEVELOPMENT 73
OPTIMIZING THE WORK ENVIRONMENT USING LEAN AND CONTINUOUS IMPROVEMENT TOOLS-PRINTING FLOOR MANIVANNAN SAMPATH
Figure 64 shows the simple layout of the printing floor with the position of production
units defined in colors to show the Kanban cards assigned to those units
Figure 64 Simple floor layout is highlighting the production units in colors
6 The designed printing floor layout along with the Kanban cards left to hang
alongside with the pegboard to visually help the operator to understand the
system
Working of the system
The system works with the help of the color cards
bull When an operator needs a tool for a specific work to be performed the operator
should check the layout designed which shows the production line and the
associated color
bull The next step is pick up a color card of the production line and place it in the place
where the tools are rested in the pegboard Placing the color card in the tool place
shows that the tool is in use
bull The tool that is taken for performing work is returned by dropping down the color
card from the pegboard and replacing it with the tool that is taken
Standardized procedures have been written on the working of the system usage of the
5s method and were explained to the workers using the Kanban card system
implemented This also includes the documentation work on the inventory list of all the
available tools on the clipboards and their quantities This stage of 5s educates everyone
on the printing floor about the implemented method and to increase awareness about
the maintenance of the tool room and about the usage of the tools
THESIS DEVELOPMENT 74
OPTIMIZING THE WORK ENVIRONMENT USING LEAN AND CONTINUOUS IMPROVEMENT TOOLS-PRINTING FLOOR MANIVANNAN SAMPATH
Figure 65 shows the inventory list taken while performing the tool 5s
Figure 65 inventory list of tools
7 Once after implementation and explaining the working of system to all operators
the tool room was inspected for a period During this period the entire system
was evaluated by using a checklist of available tools and tools on the pegboard
It was also seen that the tool room is cleaned regularly and the usage of the cards
by operators while selecting a tool and returning it was followed
Figure 66 and Figure 67 shows the images of the tool room before and after
implementation of the 5s tool
THESIS DEVELOPMENT 75
OPTIMIZING THE WORK ENVIRONMENT USING LEAN AND CONTINUOUS IMPROVEMENT TOOLS-PRINTING FLOOR MANIVANNAN SAMPATH
Figure 66 Toolroom before implementation
Figure 67 Toolroom after implementation
362 Implementation of 5S in paint room
Implementation steps
1 Initially ink tins were checked to confirm that the inks are in good condition or
whether they have dried By doing so the tins with proper ink separated from
the bad ones and were gathered in a separate place in the paint room
2 Space is created after moving the tins and resources for building the racks in the
paint room were bought by the management 2 columns each with 5 racks
constructed with the help of nuts and bolts 3 Labels for showing information such as the Pantone number and for showing the
odd and even sides of the rack were designed and printed Each column has five
racks where the left side of the first rack label mentioned as ldquoseries starting with
1 -ending with an odd numberrdquo and on the right side of the rack ldquoseries starting
with 1 and ending with the even numberrdquo were struck Similarly for Pantone
THESIS DEVELOPMENT 76
OPTIMIZING THE WORK ENVIRONMENT USING LEAN AND CONTINUOUS IMPROVEMENT TOOLS-PRINTING FLOOR MANIVANNAN SAMPATH
series 2 till Pantone series 10 labels are struck on both sides of the rack showing
the odd and even sides of the series
Figure 68 shows label struck on shelf as indicators for organizing the ink tins
Figure 68 Labels as indicators
4 After indicators were struck on the racks labels for showing Pantone number
were struck on the ink tins and the Pantone number is written on them The
Pantone number is written to show the ink associated with it and ink tins were
organized according to indicators on the racks For example consider a ink tin
labeled with Pantone number 8442 which starts with series 8 and ends with an
even number so this ink tin should be placed on the side of the rack labeled
ldquoseries starting with 1 and ending with the even numberrdquo The process was
carried out for all tins and were organized on the racks
Figure 69 shows the label designed for ink tins
Figure 69 Lable for ink tins
5 Later the room was cleaned and method of organizing ink tins on the racks were
explained to the press operators Procedures on how to use the racks were
THESIS DEVELOPMENT 77
OPTIMIZING THE WORK ENVIRONMENT USING LEAN AND CONTINUOUS IMPROVEMENT TOOLS-PRINTING FLOOR MANIVANNAN SAMPATH
documented and displayed next to the racks for operators understanding
purposes and as part of work ethics
Figure 70 shows ink tins organized in shelves with labels as indicators according to the
Pantone numbers
Figure 70 Ink tins arranged on shelves after implementation
363 Implementation of PDCA
The implementation of printing plate system is gone ahead with the help of PDCA (plan
do check act) cycle
The plates arranged on the floor includes plates manufactured from the year 2005till
present The management also said that there are plates outdated due to changes made
from the client side The plates used for the production process are picked by operators
by searching in the place where the plates according to clients are placed This time for
retrieval of the plates for the production reported being high so performance sheets
were given to the operators for recording the time
Table 3 Shows time taken by operators in retrieving the plates for various jobs before
implementation
THESIS DEVELOPMENT 78
OPTIMIZING THE WORK ENVIRONMENT USING LEAN AND CONTINUOUS IMPROVEMENT TOOLS-PRINTING FLOOR MANIVANNAN SAMPATH
Table 3 Time taken before implementation
SL No Job Number Time-Taken
1 173815 10 mins
2 173780 15 mins
3 173791 15 mins
4 180085 10 mins
5 171060 10 mins
6 174604 30 mins
7 174546 15 mins
8 180018 40 mins
9 174117 15 mins
10 174085 15 mins
Jobs are carried out after wasting the production time in searching for plates and the
average time in searching the plates for these ten jobs is 17 min and 5 seconds
Implementation steps
1 By obtaining a list of companies that have made changes the separation process
will begin The changes include updated logo of the clients updated capitais
sociais most of the clients were private banks having new capitais sociais
number The separation process started by looking at the information on each
plate and the preview sheet attached to it Around 1000 plates considered waste
during the process of separation
THESIS DEVELOPMENT 79
OPTIMIZING THE WORK ENVIRONMENT USING LEAN AND CONTINUOUS IMPROVEMENT TOOLS-PRINTING FLOOR MANIVANNAN SAMPATH
Figure 71 shows the image of plates segregated while taking inventory and arranged on
pallets
Figure 71 Separation of plates in pallets
Figure 72 shows the image consisting data about capitais socials of various clients
Figure 72 Information regarding captais socials
2 The printing plates with information regarding client job number model number
and date of manufacturing of the plates etc used in creating a list of inventories
of all the plates in Microsoft Excel
THESIS DEVELOPMENT 80
OPTIMIZING THE WORK ENVIRONMENT USING LEAN AND CONTINUOUS IMPROVEMENT TOOLS-PRINTING FLOOR MANIVANNAN SAMPATH
Figure 73 shows information about the plate used in creating the inventory list of all the
plates
Figure 73 Information about the plate
3 The company had resources where three racks each of 240 cm in length stacked
one upon the other for the plates sizing 450 x 628 mm and another three racks
of the same length for the plates sizing 605 x 745 mm were installed
respectively The design of the system was discussed with a local carpenter and
the dimensions recorded for the creation of a prototype
Figure 74 shows the image of the prototype being created by placing the separators in
between the slots for plates to be stored
Figure 74 Image taken during the creation of the prototype
THESIS DEVELOPMENT 81
OPTIMIZING THE WORK ENVIRONMENT USING LEAN AND CONTINUOUS IMPROVEMENT TOOLS-PRINTING FLOOR MANIVANNAN SAMPATH
4 The prototype of length 240 cm consisting of 27 slots each of 4 cm in width with
separators in between the slots was designed and installed The prototype was
inspected by placing 35-40 plates of few job numbers on single slot and
operators on the working floor were asked to pick a specific job from the plates
that were kept in the slot The operators were able to pick the specific job plates
in the noticeably time span of 2 mins finally the entire system was made and
installed for 450 x 628 mm and 605x745 mm size plates
5 Plates belonging to a set of job numbers were placed into the slots and their
position in the system is mentioned in the inventory list The position of the
plates will be decided by an alphabet that stands for each row and the numbers
for each slot Considering a random job number 180176 say has 6 plates and they
are kept in the 15th slot of row A so the position of the plates of that specific job
number will be A15 Similarly all plates were arranged into the system and their
positions are updated in the inventory list
Figure 75 shows the information about the plates organized in the system and their
positions mentioned as slot numbers
Figure 75 Inventory list of the plates
6 Apart from the plates that were organized into a system there are plates that will
be manufactured for new jobs or any changes to the previous job will be
regarded as new plates Here the new plates will replace the plates of the
previous job and the job number is updated in the inventory list
7 The system will become full by adding new plates and this makes the system to
be congested and difficult for operators to handle to avoid this situation some
plates must be removed from the system
Figure 76 shows the image of plates into the system with lables for identifying the plates
at the respective slots
THESIS DEVELOPMENT 82
OPTIMIZING THE WORK ENVIRONMENT USING LEAN AND CONTINUOUS IMPROVEMENT TOOLS-PRINTING FLOOR MANIVANNAN SAMPATH
Figure 76 image of plates organizeed with labels
8 Removal of plates from the system needs either the plate should be outdated or
changes in any job made from the clientrsquos side or when there is a complete
change in for a new season from the client
9 The system was full after organizing the plates and space for arranging new plates
is gathered by removing old plates which are manufactured in 2010 2011
20122013 400 plates were removed giving space for new printing plates to rest
in the system
10 The system was set completely and evaluating sheets were given to the
operators of the production lines to make a note of the timing spent on retrieving
the plates from the system
Error Reference source not found shows the time taken by the operators in retrieving
the plates for the jobs to be done It also says that the time taken by operators has been
reduced and the average time is taken in searching for the plates of the jobs found
reduced to 2 minutes and 3 secs
THESIS DEVELOPMENT 83
OPTIMIZING THE WORK ENVIRONMENT USING LEAN AND CONTINUOUS IMPROVEMENT TOOLS-PRINTING FLOOR MANIVANNAN SAMPATH
Table 4 Time observation after implementation
SL No Job Number Time Taken
1 153517 2 mins
2 174172 3 mins
3 163923 2 mins
4 180634 2 mins
5 170890 2 mins
6 181293 3 mins
7 162477 2 mins
8 173660 2 mins
9 173373 2 mins
10 162185 3mins
ChartGraph 1 shows the comparison of the time-taken in retrieving the plates during
before implementation and after implementation of the system
ChartGraph 1 Comparison of time on before and after implementation
0 5 10 15 20 25 30 35 40 45
1
2
3
4
5
6
7
8
9
10
Time
Job
after implementation before implementation
THESIS DEVELOPMENT 84
OPTIMIZING THE WORK ENVIRONMENT USING LEAN AND CONTINUOUS IMPROVEMENT TOOLS-PRINTING FLOOR MANIVANNAN SAMPATH
Figure 77 shows the image of plates organized on floor before implementation of the
system for storing plates
Figure 77 Before implementation
Figure 78 shows the image of plates organized into the systems created with labels as
indicators for slots and racks
Figure 78 After implementation
11 Systems of organizing plates for the plates sizing 459x525 mm and 605x745 mm
having a capacity of 6800 and 4000 were setup respectively
12 The system is reviewed often such that it does not overflow and causing the
workers to adapt to the earlier situation of arranging the plates on the floor
Inspections are made to check whether there are old plates
The cost of material used in making the system is 300euro
Labour cost in creating the system according to the specifications is 1700euro
Total cost in creating systems for 2 different sizes is 2000 euro
THESIS DEVELOPMENT 85
OPTIMIZING THE WORK ENVIRONMENT USING LEAN AND CONTINUOUS IMPROVEMENT TOOLS-PRINTING FLOOR MANIVANNAN SAMPATH
It is the responsibility of the management to be updated in the orders of the clients at
each season and to follow the cycle to keep the system working
SMED Practice
The Single Minute Exchange of die (SMED) tool is performed when the setup process
for the jobs seem to consume a lot of production timeAt the end of each production
the products produced unloaded to a pallet and the operator continues for the next
setup process of productionOperator looking at the job sheet searches for required
printing plates or the operator will receive the plates in case if the job is new
Activities carried out before the setup operation are mentioned below-
bull The setup process includes cleaningchanging of plates
bull Changing ink at the printing bodies of the printing machine
bull filling up the paper tray at the feeding unit of the printing machine
bull cleaning of impression cylinder(rubber) in each printing body
bull changing the ink absorbing cloth at each head for every 24 jobs
Implementation steps
1 The tool was performed on speedmaster 52-4 speedmaster 74-5 and the
speedmaster 52-2 and data about the setup times for different jobs are
gathered
Table 5 shows the performed actions during the setup phase and their time averages
THESIS DEVELOPMENT 86
OPTIMIZING THE WORK ENVIRONMENT USING LEAN AND CONTINUOUS IMPROVEMENT TOOLS-PRINTING FLOOR MANIVANNAN SAMPATH
Table 5 Average time of actions performed on three machines
Sl no Actions performed SM 52-2 SM 52-4 SM 74-5
1 Cleaning of machine 33125 31175 3828333
2 Searching the plate 09675 2513333 12
3 Cleaning of plates 1795 3505 3263333
4 Removing plate of
the earlier job 16425 15825 153
5 Introducing ink 14325 2413333 2883333
6 Introducing plate and
input 17575 29775 4976667
7 Setting up paper 5415 82425 1145
8 Average setup time 163225 2312 2669
2 The actions performed during the calculation of setup times were almost similar
in all the three machines The average setup time calculated and found to be
1632 2312 2669 for SM 52-2 SM 52-4 SM 74-5 machines respectively
3 The time is taken for the actions performed compared with all the three
machines and grouped as internal and external actions ie The movement of
the operation involving the work done during the setup process recorded as stop
events occurring at the printing machines on event log sheets in minutes with
the help of stopwatch
Table 6 shows the actions performed by the operators during the setup process
segmented into internal and external actions
Table 6 Performed actions categorized into internal and external
Internal actions External actions
Changing of plates Few prints were taken after setup
Changingintroducing ink Production after setup
Cleaning of printing plates Evaluation
Searching for needed printing sheets
Searching for pallets for transferring
finished products
THESIS DEVELOPMENT 87
OPTIMIZING THE WORK ENVIRONMENT USING LEAN AND CONTINUOUS IMPROVEMENT TOOLS-PRINTING FLOOR MANIVANNAN SAMPATH
4 The next step is the conversion of possible internal elements into external
elements ie actions performed during off state of the machine performed
when the machine is running
5 The total time spent on performing the internal actions is higher than the time
spent on the external actions Here the possible internal actions that can be
performed during machine operation are searching searching for needed
printing sheets An average of 5415 8241145 minutes spent in printing
machines SM 52-2 SM 52-4 SM 74-5 respectivelyin searching for new printing
sheets and to get printed samples
6 The average time spent on searching for the plates for the jobs is 251 in case of
SM 54-5 and being less in the other two machines is because of new jobs In the
case of new jobs plates are produced and handed over to the printing operators
in prior
7 The time on searching for new printing sheets and as well as cutting can be solved
by having the right material flow to all the printing machines in the printing floor
In explaining the scenario places next to the printing machines of SM 52-2 and SM 52-4
are occupied by printed stock materials
Figure 79 shows the picture of finished goods to be used for production stored at the
production floor
Figure 79 shows the space occupied by printed goods right near the printing machines
Goods are mostly printed materials of invite cards designation cards documented
forms of many clients stored on pallets The space occupied by these goods can be used
for storing the printing sheets needed by the printing machines The printed materials
for production use can be stored at the huge shelves made for organizing the printing
materials like coated papers and papers of different GSMs These shelves must be
categorized labelled and organize printing papers according to their availability during
production process
Figure 80 shows the image of shelves for storing purposes near the loading area at the
printing floor
THESIS DEVELOPMENT 88
OPTIMIZING THE WORK ENVIRONMENT USING LEAN AND CONTINUOUS IMPROVEMENT TOOLS-PRINTING FLOOR MANIVANNAN SAMPATH
Figure 80 Shelves for storing purposes
The proposal is by hiring a worker performing the internal activities like searching of the
plate cleaning of plates searching for needed papers ink for production from the paint
room and every other possible helps that an machine operator requires
In the total production time of 10 hrsday 2 hrs is spent on internal activities by the
operators
In justifying the above-mentioned proposal in hiring an employee
Total production time wasted on the printing floorday = 120 mins
Production cost hr on Speedmaster 522=30 euro
Production cost hr on Speedmaster 524 = 30 euro
Production cost hr on Speedmaster 745 = 60 euro
The operators from SM 522 and SM 524 together and SM 74-5 consume 1 hour each
respectively in doing all the internal operation for a day
Total production loss day =120 euro
Total production loss month =12020=2400 euro
The minimum wage of an employee in Portugal =67667 euro
Total savings by hiring an employee for a month=2400-67667=172333euro
So by hiring an employee for all the printing machines time spent in searching of the
plate cleaning of plates cutting required papers ink for production from the paint
room moving finished products to loading area can be conserved thereby increasing
productivity in the company
89
ltTIacuteTULO DA TESEgt ltNOME DO AUTORgt
CONCLUSIONS
51 CONCLUSIONS
52 PROPOSALS OF FUTURE WORKS
CONCLUSIONS 91
OPTIMIZING THE WORK ENVIRONMENT USING LEAN AND CONTINUOUS IMPROVEMENT TOOLS-PRINTING FLOOR MANIVANNAN SAMPATH
CONCLUSIONS AND PROPOSALS OF FUTURE WORKS
51 CONCLUSIONS
The study of lean tools and continuous improvement tools at the literature part of this
thesis proves to be significant support in terms of knowledge about understanding
waste and its different forms in the organization The terms regarded as waste as
discussed in section 2324 The problems faced by the company at each scenario
proven to contribute a considerable amount of time wastage in the setup process of the
production
The use of Ishikawa(fishbone diagram) a quality tool in addressing the root causes of the
issues was proven useful and helped in providing a guideway in solving those causes
see section 341342343 The benefits observed in using Ishikawa were Understood
and issues ewere analysed Identify the root cause of the issue Provide ways to improve
the process related to the issue In-depth in discussion of issue Helps in prioritizing the
analysis made and choosing corrective actions The corrective actions are analyzed by
categorizing them according to strengths- results that can be achieved using the
corrective actions weakness- possible scenario where it can go wrong opportunity to
introduce something new that can improve the operation and threats involving the
possible events where the actions reaches bottleneck and required inspections to be
followed periodically This helped in studying the system implemented in complete and
futher update in working of the system Section 351352353
The implementation section 36 explains the corrective actions performed periodically
for each problem reported by the organization of the company Each implementation
process is carried out following the steps involved in the tool adopted The creation of
tool room and tool chart involves the use of 5s along with Kanban shows the distribution
management of the tools at the production floor and management of tool room This
created awareness about the use of tools availability of the tools returning them to the
pegboard and cleanliness of the tool room after use The arrangement of ink tins in
shelves according to the Pantone number found to be helping the operators in obtaining
the required ink tins quickly Inspections gave improving results in following the
procedure for arranging the tins by the operator when they have the need to create
another Pantone color in a separate tin The creation of systems for the arrangement of
printing plates involves the use of PDCA during implementation which helped in
planning the system with available resources the capability of the system as well as the
design of the system according to two different plate sizes Results obtained after
CONCLUSIONS 92
OPTIMIZING THE WORK ENVIRONMENT USING LEAN AND CONTINUOUS IMPROVEMENT TOOLS-PRINTING FLOOR MANIVANNAN SAMPATH
implementation found to be satisfying that the time taken for retrieving the plates from
the systems has been reduced from an average of 17 minutes to 3 minutes Minimized
space in arranging the plates records of the plates existing the system updating the
system whenever changes with clients occur are the improvements made regarding the
printing plates Finally SMED is performed in figuring out the setup activities and time
involved in performing those activities where the results of the setup times regarding
the printing plates and ink from the paint room found to have contributed in the setup
time of jobs carried at production units but there are other activities like searching for
required printing sheets for production consumes an average of 5415 8241145
minutes and seconds were recorded for the machine namely SM 52-2 SM 52-4 SM 74-
5 respectively see section 4 Proposals for solving the issue about acquiring required
printing sheets mentioned in section 52
The use of lean tools and continuous improvement tools have proven to have made
changes in terms of space occupied the time taken in performing actions effective
management of tool room tool chart and insight in solving other actions in the setup
process
52 PROPOSALS OF FUTURE WORKS
The work will be done for reducing the time needed to receive the printing sheet at each
machine This can be achieved by taking inventory of the goods present on the printing
floor and then moving them in pallets to a separate place ThePrinted goods are then
moved to the storage room created giving free space for the supply of printing sheets
for the production processon the printing floor The created space will be segmented
for allowing the required printing sheets for the job and for storing the finished products
temporarily
93
ltTIacuteTULO DA TESEgt ltNOME DO AUTORgt
REFERENCES AND OTHER
SOURCES OF INFORMATION
REFERENCES AND OTHER SOURCES OF INFORMATION 95
OPTIMIZING THE WORK ENVIRONMENT USING LEAN AND CONTINUOUS IMPROVEMENT TOOLS-PRINTING FLOOR MANIVANNAN SAMPATH
REFERENCES AND OTHER SOURCES OF INFORMATION
[1] C C Yew and E Tan The Print Industry An Overview Information Services
Division National Library Board 2005
[2] [Online] Available ttpscollegegradcomindustriesprinting
[3] weebly [Online] Available httpsinvention-of-the-printing-
pressweeblycomeconomic-impacthtml
[4] J Dittmar Information Technology and Economic Change The Impact of the
Printing Press 2010
[5] E L Eisenstein The Printing Press as an Agent of Change Communications and
Cultural Transformations in Early-Modern Europe Cambridge University
Press 1979
[6] J-F Gilmont Printing at the dawn of the sixteenth centuary in The
Reformation and the Book Ashgate Aldershot 1998
[7] Engineering 360 by IEEE Global Spec [Online] Available
httpswwwglobalspeccomlearnmorematerial_handling_packaging_equi
pmentpackaging_labelingindustrial_printing_equipment [Accessed 25
september 2018]
[8] Flexography principles and practices Foundation of Flexographic Technical
Association
[9] T Dunn Manufacturing Flexible Packaging
[10] H Walter Process of letterpress printing
httpspatentsgooglecompatentUS2268594Aen Patent US2268594A
1939
REFERENCES AND OTHER SOURCES OF INFORMATION 96
OPTIMIZING THE WORK ENVIRONMENT USING LEAN AND CONTINUOUS IMPROVEMENT TOOLS-PRINTING FLOOR MANIVANNAN SAMPATH
[11] H Kipphan Hand book of Print Media technology and production methods
Springer-Verlag
[12] H Johnson and C D Tobie Digital printing startup guide Stacy L Hiquet 2005
[13] FACT SHEET SERIES-OFFSET PRINTING Print amp Copy Bureau Roger Stevens
Building University of Leeds
[14] offset pressman [Online] Available
httpoffsetpressmanblogspotcom201109short-history-of-offset-
printinghtml
[15] GRISO Print Solutions [Online] Available httpwwwgriso-
chemiecomenservicegeschichte-offsetdruck
[16] S H H Y Y A H H S K SUBRAMANIAM Machine efficiency and man
power utilization on production lines in 8th WSEAS Int Conf on
ELECTRONICS HARDWARE WIRELESS and OPTICAL COMMUNICATIONS
[17] N SAni kumar production and operations management New Age
International Publishers
[18] L B T Abdel-Malek A framework for the economic evaluation of production
system and product design alternatives for robot assembly International
Journal of Production Research vol 23 p 197ndash208 1985
[19] M S Y Y K K I a S N Yoshimura A rapid analysis method for production
line design International Journal of Production Research vol 44 no 6
2006
[20] D B M a B W Spath Springer Handbook of Automation Springer 2009
[21] R G S G B M K T Bley H Appropriate Human Involvement in Assembly and
Disassembly CIRP Annals ndash Manufacturing Technology 2009
[22] T L A V J Kruumlger Cooperation of human and machines in assembly lines
[23] T L A V J Kruuml ger Cooperation of human and machines in assembly lines
CIRP Annals - Manufacturing Technology 2009
REFERENCES AND OTHER SOURCES OF INFORMATION 97
OPTIMIZING THE WORK ENVIRONMENT USING LEAN AND CONTINUOUS IMPROVEMENT TOOLS-PRINTING FLOOR MANIVANNAN SAMPATH
[24] N Galway unit 13 automated production lines in Production lines NUI
Galway p 33
[25] J Liker The Toyota Way 14 Management Principles from the Worldrsquos Greatest
Manufacturer New York McGraw-Hill 2004
[26] G a W J Miltenburg The u-line line balancing problem Management
Science vol 40 no 10 1994
[27] J S L W L G M Gao An efficient approach for type II robotic assembly line
balancing problems Computer and Industrial Engineering 2009
[28] G R J S B Levitin A genetic algorithm for robotic assembly line balancing
European Journal of operational Research 2006
[29] T C L C G S S L M Adalberto Sato Michels The Robotic Assembly Line
Design (RALD) problem Model and case studies with practical extensions
Computers amp Industrial Engineering 2018
[30] P j Wallin Robotics in the Food Industry An update Trends in Food Science
amp Technology 1997
[31] J a H M Bicheno The Lean toolbox Buckingham PICSIE Books 2016
[32] A Weber Lean Workstations Organized for Productivity 2005
[33] A Maslow A theory of human motivation Psychological review 1943
[34] S a G R Ghosh A comprehensive literature review and analysis of the design
balancing and scheduling of assembly systems International Journal of
Production Research vol 27 no 4 1989
[35] L T D C D K N H B Tran Minh Canh A case study in Whittier woods
furniture in 13th International Conference Việt Nam 2013
[36] W L Kilbridge M A heuristic method of assembly line balancing Journal of
Industrial Engineering vol 24 no 2 p 292 1961
[37] G Srinivasan Operations and Supply Chain Management Department of
Management Studies Indian Institute of Technology Madras Chennai
REFERENCES AND OTHER SOURCES OF INFORMATION 98
OPTIMIZING THE WORK ENVIRONMENT USING LEAN AND CONTINUOUS IMPROVEMENT TOOLS-PRINTING FLOOR MANIVANNAN SAMPATH
[38] C M Harland Supply Chain Management Relationships Chains and
Networks British Academy of Management 1996
[39] G a M Q Easton Single and Multiple Network Sourcing - Network
Implications in 6th IMP Conference Milan 1990
[40] M G Christopher Logistics and Suppry Chain Management LondonUK
Pitman Publishing 1992
[41] L M Ellram lsquoSupply Chain Management The Industrial Organisation
Perspective International Journal of Physical Distribution and Logistics
Management vol 21 no 1 pp 13-22 1991
[42] T P b G M Daniel E Ufua a Systemic Lean Intervention Enhancing Lean
with Community Operational Research European Journal of Operational
Research 2017
[43] J amp J D T Womack Lean Thinking Banish Waste and Create Wealth for Your
Corporation New York Simon and Schuster 1996
[44] T C Salonitis K Drivers and Barriers of Lean Implementation in the Greek
Manufacturing Sector Procedia CIRP 7189ndash194 2016
[45] J A F Joliveira continuous improvement through lean tools An application
in a mechanical company Manufacturing Engineering Society International
Conference 2017 MESIC 2017 28-30 June 2017
[46] M V Ramunė Čiarnienėa An Empirical Study of Lean Concept Manifestation
11th International Strategic Management Conference 2015 2015
[47] K S Y X Mudhafar Alefari The role of leadership in implementing lean
manufacturing The 50th CIRP Conference on Manufacturing Systems 2017
[48] G Howell rdquoWhat is Lean Constructionrdquo Proceeding Seventh annual
Conference of the International Group for Lean Construction 1999
[49] C Ohaegbunam AN OPERATIONS MANAGEMENT PERSPECTIVE ON WASTE
MANAGEMENT IN A FOOD PROCESSING FACTORY Tampere University of
Applied Sciences 2015
REFERENCES AND OTHER SOURCES OF INFORMATION 99
OPTIMIZING THE WORK ENVIRONMENT USING LEAN AND CONTINUOUS IMPROVEMENT TOOLS-PRINTING FLOOR MANIVANNAN SAMPATH
[50] P R T Domingo Identifying and Eliminating The Seven Wastes or Muda
Asian Institute of Management
[51] M Pieńkowski WASTE MEASUREMENT TECHNIQUES FOR LEAN COMPANIES
International journal of lean Thinking vol 5 2014
[52] T Ohno Toyota Production System Beyond Large-Scale Production diamond
Inc 1978
[53] D S M Dudek-Burlikowska The Poka-Yoke method as an improving quality
tool of operations in the process journal of Achivements in Materials and
Manufacturing Enginnering vol 36 no 1 2009
[54] K V Scyoc Process safety improvementmdashQuality and target zero Journal of
Hazardous Materials 159 (2008) 42ndash48 2008
[55] A D Shigeo Shingo ldquoZero Quality Control Source Inspection and the Poka-Yoke
Systemrdquo Productivity Press 1986
[56] D Tommelein lsquoPOKA YOKErsquo OR QUALITY BY MISTAKE PROOFING DESIGN AND
CONSTRUCTION SYSTEMS Proceedings for the 16th Annual Conference of
the International Group for Lean Construction
[57] S Shingo A study of the toyota production system japan management
association
[58] D N S Yash Dave a IMPLEMENTATION OF POKA-YOKE TECHNIQUE IN A GEAR
INDUSTRY -A CASE STUDY International Journal of Latest Research in Science
and Technology 2015
[59] M D-B H 1048800achajczyk Quality continuous improvement of company with
usage the Poka-Yoke methods PSKN 72006
[60] S S Zero Quality Control Source Inspection and the Pokandash Yoke System
Cambridge Productivity Press 1986
[61] M G Marta Kučerovaacute Eliminating waste in the production process using tools
and methods of industrial engineering 28 11 2015
REFERENCES AND OTHER SOURCES OF INFORMATION 100
OPTIMIZING THE WORK ENVIRONMENT USING LEAN AND CONTINUOUS IMPROVEMENT TOOLS-PRINTING FLOOR MANIVANNAN SAMPATH
[62] A G P Arunagiria Identification of Major Lean Production Waste in
Automobile Industries using Weighted Average Method 12th GLOBAL
CONGRESS ON MANUFACTURING AND MANAGEMENT GCMM 2014 2014
[63] G A Arunagiri P Investigation on Critical Factors Assessment of the Lean
Production Systems in Industrial Environment Elsevier Science and
Technology 2013
[64] I G-R A S-L E Andreacutes-Loacutepeza Lean Service Reassessment of Lean
Manufacturing for Service Activities The Manufacturing Engineering Society
International Conference MESIC 2015 2015
[65] S SHINGO A Revolution in ManufacturingThe SMED System Productivity
Press 1985
[66] D L M Silvia Pellegrini Study and Implementation of Single Minute Exchange
of Die (SMED) Methodology in a Setup Reduction Kaizen Proceedings of the
2012 International Conference on Industrial 2012
[67] A R RSundara A Review on Lean Manufacturing Implementation
Techniques 12th GLOBAL CONGRESS ON MANUFACTURING AND
MANAGEMENT GCMM 2014 2014
[68] F L F R CRosa SMED Methodology The reduction of setup times for steel
wire-rope assembly lines in the automotive industry Manufacturing
Engineering Society International Conference 2017 MESIC 2017 28-30 June
2017 Vigo (Pontevedra) Spain 2017
[69] P M T G Antoacutenio Carrizo Moreira Implementation of the Single Minute
Exchange of Die (SMED) Methodology in Small to Medium-sized Enterprises
A Portuguese Case Study International Journal of Management vol 30 no
1 2013
[70] T Ohno Toyota Production System Beyond Large-Scale Production New York
Productivity Press 1988
[71] M Imai Gemba Kaizen A Practical Approach to a Continuous Improvement
Strategy Kaizen Publishing House vol 2 2013
REFERENCES AND OTHER SOURCES OF INFORMATION 101
OPTIMIZING THE WORK ENVIRONMENT USING LEAN AND CONTINUOUS IMPROVEMENT TOOLS-PRINTING FLOOR MANIVANNAN SAMPATH
[72] R W Beata GALA PROBLEMS OF IMPLEMENTATION 5S PRACTICES IN AN
INDUSTRIAL COMPANY Management Systems in Production Engineering
vol 12 no 4 pp 8-14 2013
[73] wwwleanproductseu [Online]
[74] H Hirano The Complete Guide to Just-In-Time Manufacturing Waste and the
5S s Productivity press 2009
[75] D W Edwards The new economics for industry government and education
Cambridge Mass MIT Press 1993
[76] KACHANDRAKANTH PLAN DO CHECK ACT (PDCA) IMPROVING QUALITY
THROUGH AGILE ACCOUNTABILITY TEKTRONIX ENGINEERING
DEVELOPMENT INDIA PRIVATE LIMITED BANGALORE
[77] V A D Pratik M Patel Application Of Plan-Do-Check-Act Cycle For Quality And
Productivity Improvement - A Review International Journal for Research in
Applied Science amp Engineering Technology (IJRASET) vol 5 no 1 2017
[78] H Kanri The Strategic Approach to Continuous Improvement Gower
Publishing Limited 2008
[79] G a J W Moran The ABCs of PDCA 2009
[80] D SLOVIĆ D STOJANOVIĆ2 and I TOMAŠEVIĆ Productivity Upswing Through
Two-Phase Continuous Process Improvement Model The Case Of Apparel
Manufacturer Journal of Textile amp Apparel Tekstil ve Konfeksiyon vol 25
no 2 2015
[81] P S T Mr Madan M Jagtap International Journal on Recent Technologies in
Mechanical and Electrical Engineering (IJRMEE) ISSN 2349-7947 vol 2 no
4
[82] E Coimbra The Total Flow Management Model Kaizen forum 2008
[83] E Coimbra TheTotal Flow Management Model KAIZEN FORUM vol 3 pp 1-
4 2008
[84] E A Coimbra Total Flow Management Achieving Excellence with Kaizen and
Lean Supply Chains KAIZEN INSTITUTE (2012)
REFERENCES AND OTHER SOURCES OF INFORMATION 102
OPTIMIZING THE WORK ENVIRONMENT USING LEAN AND CONTINUOUS IMPROVEMENT TOOLS-PRINTING FLOOR MANIVANNAN SAMPATH
[85] S Nakajima Introduction to TPM total productive maintenance Cambridge
MA Productivity Press 1988
[86] P Muchiri and L Pintelon Performance measurement using overall
equipment effectiveness (OEE) Literature review and practical application
discussion International journal of Production Research vol 46 no 13
2008
[87] b J S a J R M-T c C J Andres Mu~noz-Villamizar a Using OEE to evaluate
the effectiveness of urban freight transportation systems A case study
International Journal of Production Economics 2018
[88] B J The new lean toolbox towards fast flexible flow PICSIEBooks Moreton
Press 2004
103
ltTIacuteTULO DA TESEgt ltNOME DO AUTORgt
ANNEXES
71 ANNEX1
ANNEXES 105
OPTIMIZING THE WORK ENVIRONMENT USING LEAN AND CONTINUOUS IMPROVEMENT TOOLS-PRINTING FLOOR MANIVANNAN SAMPATH
ANNEXES
This section consist of the supported documents involved in implementation of the tools
as well as corrective actions carried out in solving the prblems reported by the
organization
71 ANNEX1
ANNEXES 106
OPTIMIZING THE WORK ENVIRONMENT USING LEAN AND CONTINUOUS IMPROVEMENT TOOLS-PRINTING FLOOR MANIVANNAN SAMPATH
ANNEXES 107
OPTIMIZING THE WORK ENVIRONMENT USING LEAN AND CONTINUOUS IMPROVEMENT TOOLS-PRINTING FLOOR MANIVANNAN SAMPATH
ANNEXES 108
OPTIMIZING THE WORK ENVIRONMENT USING LEAN AND CONTINUOUS IMPROVEMENT TOOLS-PRINTING FLOOR MANIVANNAN SAMPATH