optimizing payor mix - home - guidian healthcare consulting · optimizing payor mix billing &...
TRANSCRIPT
Optimizing Payor MixOptimizing Payor MixBilling & Collections in the Changing Economic Landscape
N W R P C A / C H A M P S 2 0 0 9 F A L L C O N F E R E N C ES E A T T L E , W A S H I N G T O N
G U I D I A N H E A L T H C A R E C O N S U L T I N GG U I D I A N H E A L T H C A R E C O N S U L T I N G
Presentation Overview
PAYOR MIX – THE BIG PICTURE
5 Important Reasons to Evaluate Payor Mix
Role of Payor Mix in Operations Management
Service Area Payor Mix
Optimizing Payor Mix thru Billing & CollectingOptimizing Payor Mix thru Billing & Collecting
Wrap-up and Questions
© Guidian Healthcare Consulting 2009

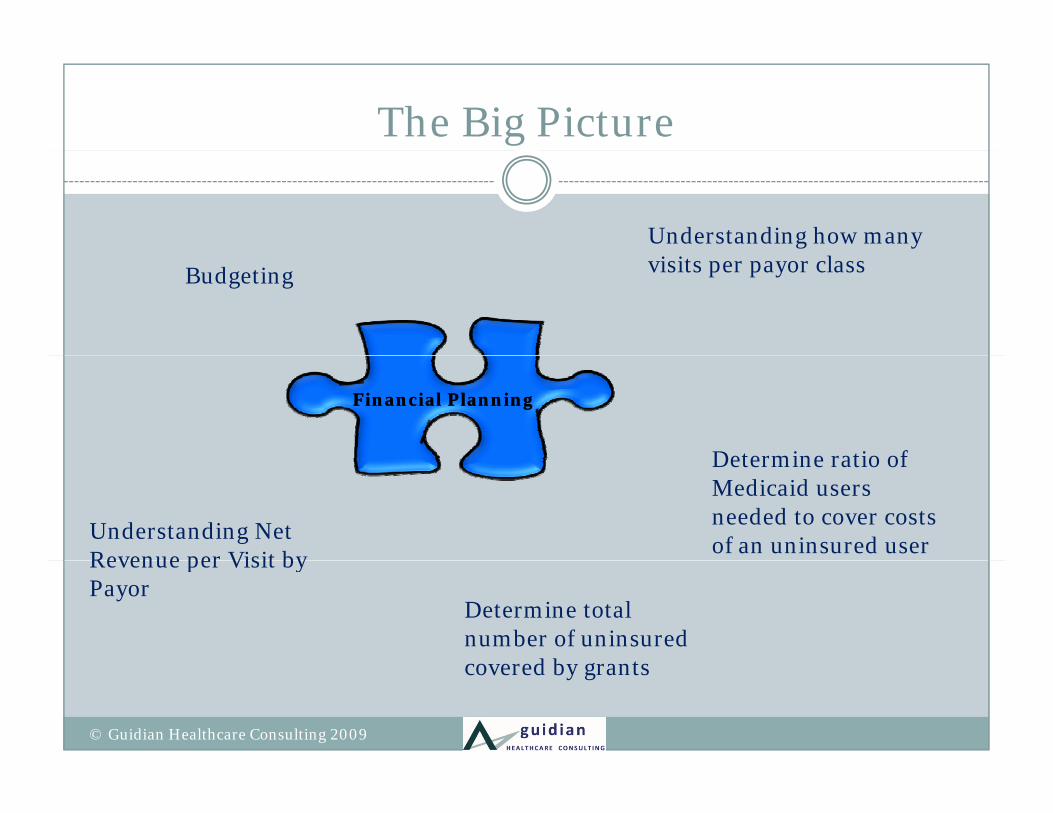
The Big Picture
Understanding the financial health of your community health centerbegins with understanding the user groups who access services andbegins with understanding the user groups who access services, andhow those services are reimbursed.
© Guidian Healthcare Consulting 2009
The Big Picture
Understanding how many
Budgeting visits per payor class
Financial PlanningFinancial Planning
Determine ratio of
Understanding Net Revenue per Visit by
Determine ratio of Medicaid users needed to cover costs of an uninsured userRevenue per Visit by
PayorDetermine total number of uninsured
d b tcovered by grants
© Guidian Healthcare Consulting 2009
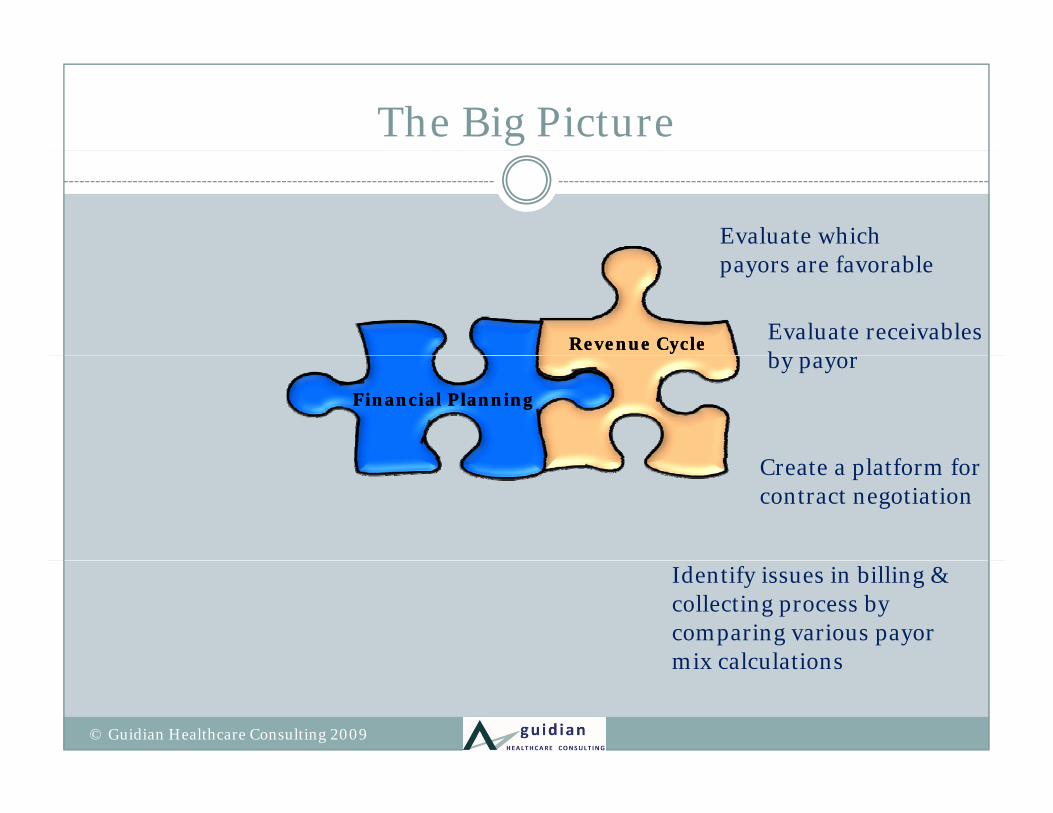
The Big Picture
Evaluate which
Revenue CycleRevenue Cycle
payors are favorable
Evaluate receivables b
Financial PlanningFinancial Planning
by payor
C l f f Create a platform for contract negotiation
Identify issues in billing & collecting process by comparing various payor mix calculationsmix calculations
© Guidian Healthcare Consulting 2009
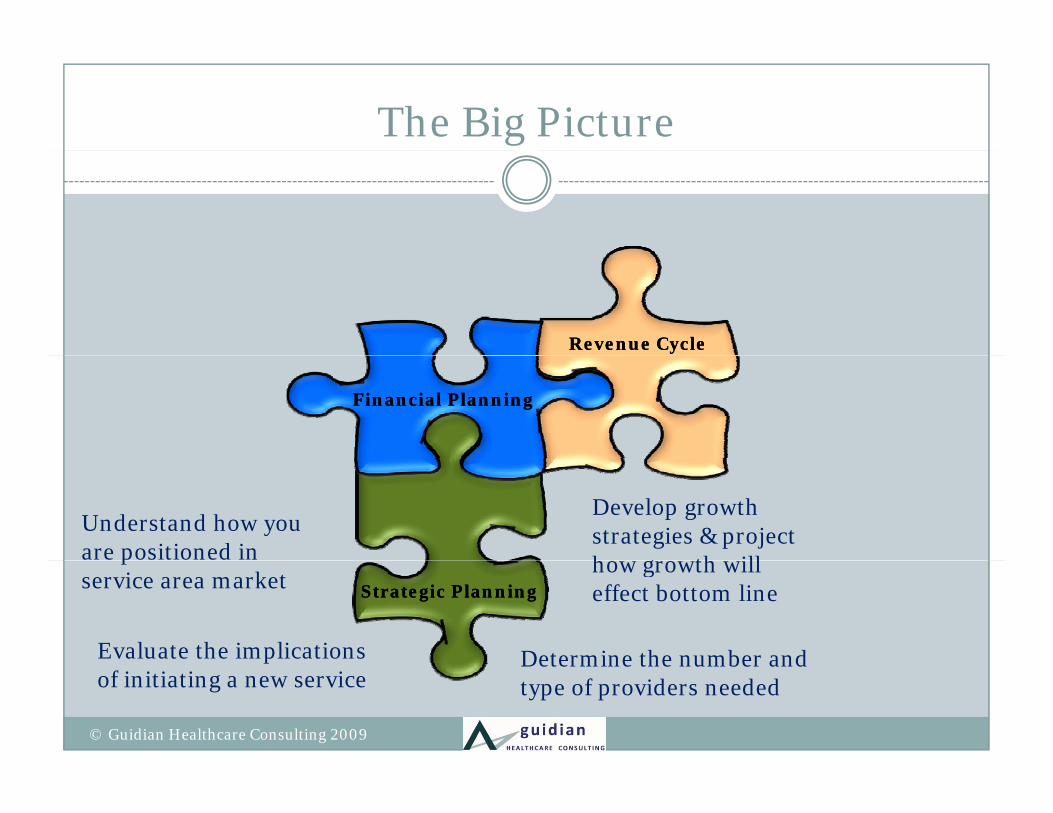
The Big Picture
Revenue CycleRevenue Cycle
Financial PlanningFinancial Planning
Understand how you are positioned in
Develop growth strategies & project ho gro th ill
Strategic PlanningStrategic Planning
pservice area market
Evaluate the implications
how growth will effect bottom line
Determine the number and pof initiating a new service
Determine the number and type of providers needed
© Guidian Healthcare Consulting 2009
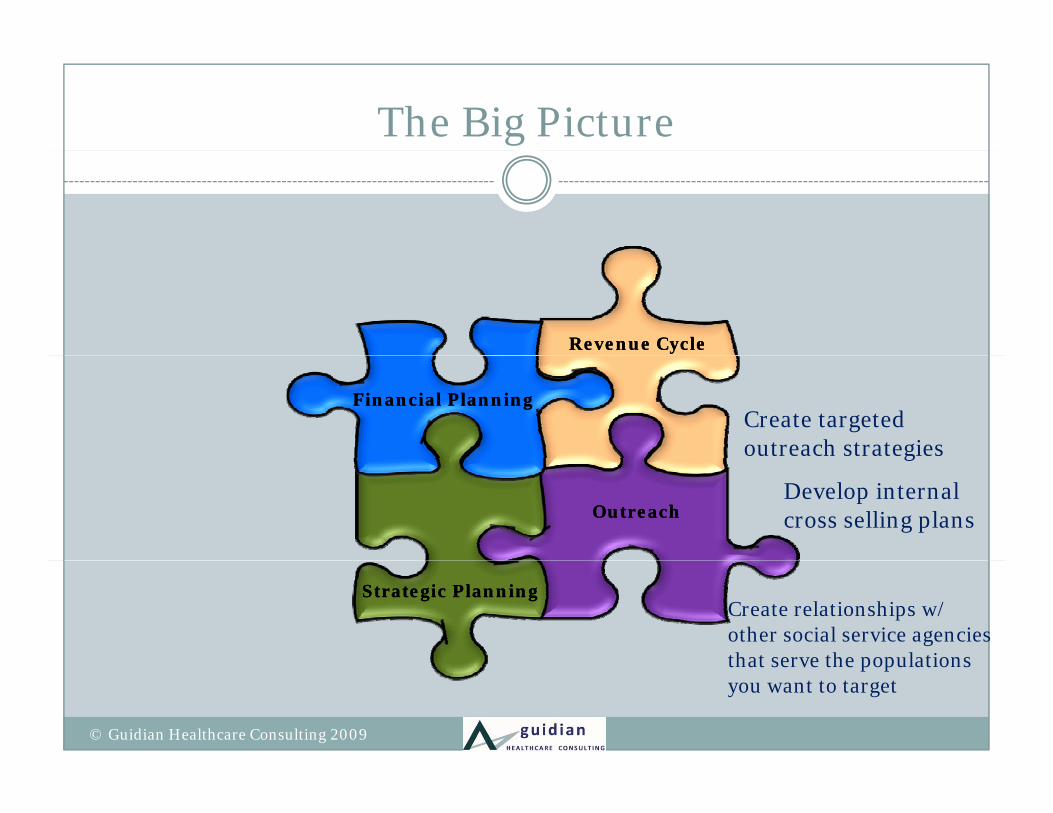
The Big Picture
Revenue CycleRevenue Cycle
Financial PlanningFinancial PlanningCreate targeted outreach strategies
OutreachOutreach
g
Develop internal cross selling plans
Strategic PlanningStrategic PlanningCreate relationships w/ other social service agencies that serve the populations that serve the populations you want to target
© Guidian Healthcare Consulting 2009
Presentation Overview
Payor Mix – The Big Picture
5 IMPORTANT REASONS TO EVALUATE PAYOR MIX
Role of Payor Mix in Operations Management
Service Area Payor Mix
Optimizing Payor Mix thru Billing & Collecting Optimizing Payor Mix thru Billing & Collecting
Wrap-up and Questions
© Guidian Healthcare Consulting 2009
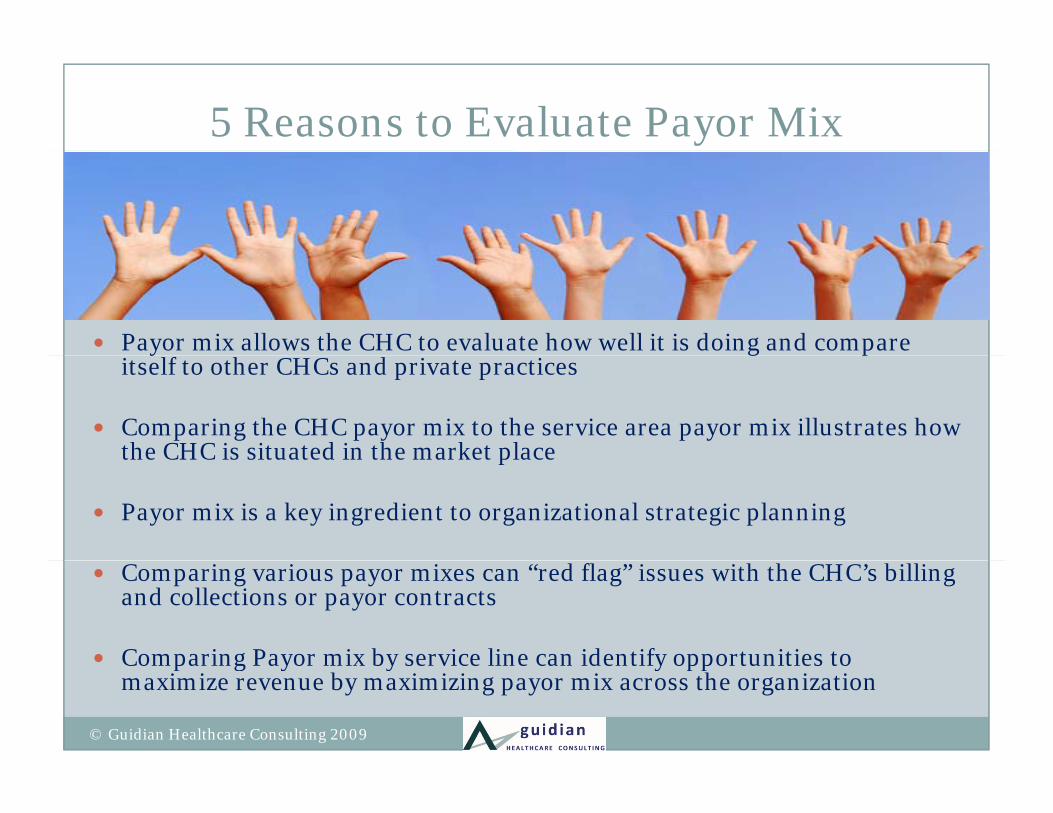
5 Reasons to Evaluate Payor Mix
Payor mix allows the CHC to evaluate how well it is doing and compare y g pitself to other CHCs and private practices
Comparing the CHC payor mix to the service area payor mix illustrates how the CHC is situated in the market placethe CHC is situated in the market place
Payor mix is a key ingredient to organizational strategic planning
Comparing various payor mixes can “red flag” issues with the CHC’s billing and collections or payor contracts
Comparing Payor mix by service line can identify opportunities to Comparing Payor mix by service line can identify opportunities to maximize revenue by maximizing payor mix across the organization
© Guidian Healthcare Consulting 2009
Presentation Overview
Payor Mix – The Big Picture
5 Important Reasons to Evaluate Payor Mix
ROLE OF PAYOR MIX IN OPERATIONS MANAGEMENT
Service Area Payor Mix
Optimizing Payor Mix thru Billing & CollectingOptimizing Payor Mix thru Billing & Collecting
Wrap-up and Questions
© Guidian Healthcare Consulting 2009
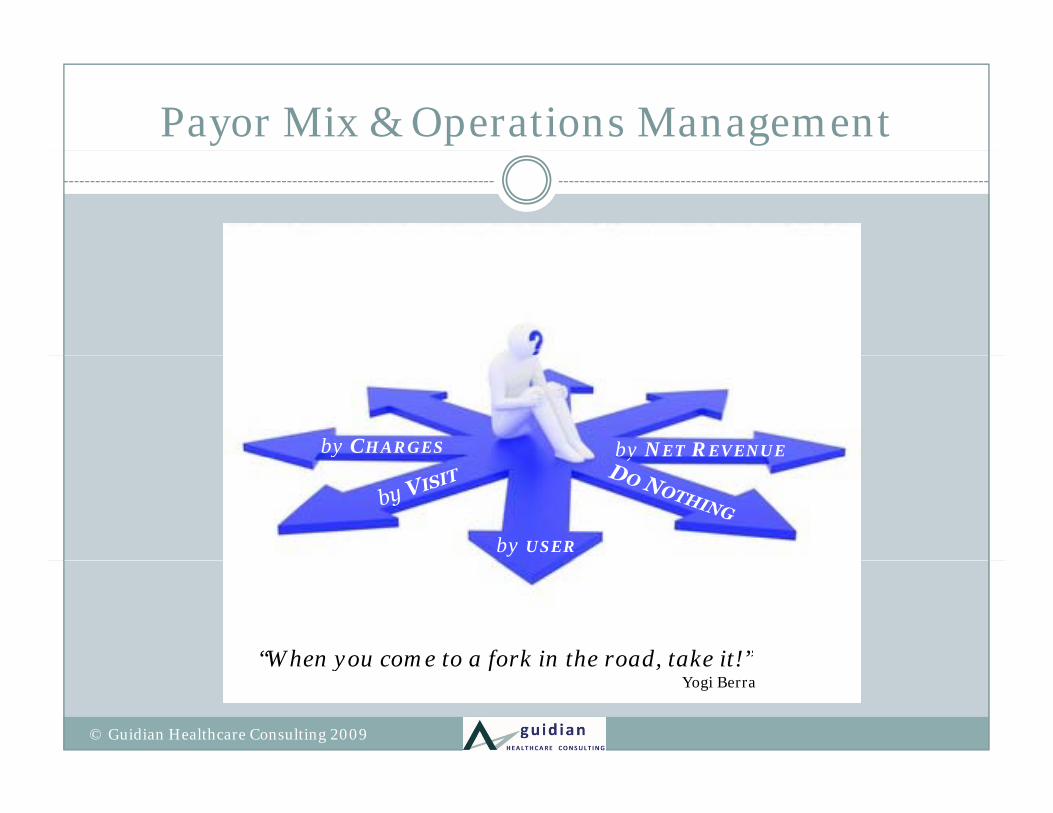
Payor Mix & Operations Management
by CHARGES by NET REVENUE
by USER
y
“When you come to a fork in the road take it!”When you come to a fork in the road, take it!Yogi Berra
© Guidian Healthcare Consulting 2009
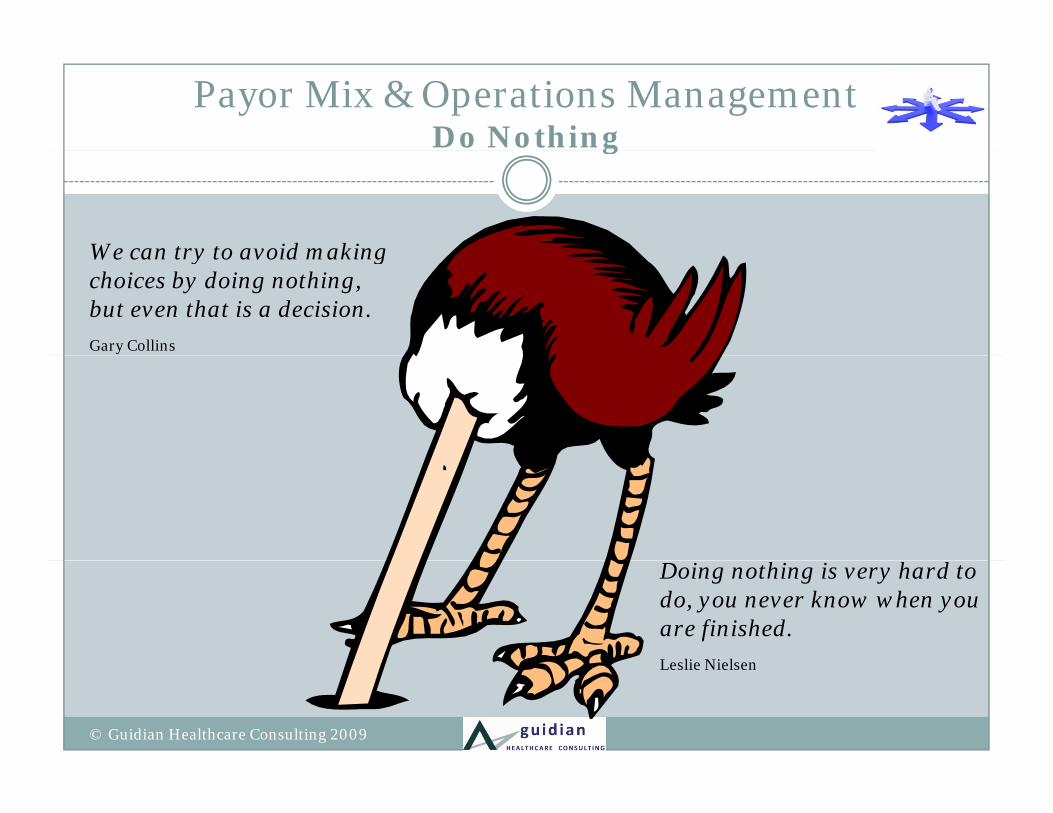
Payor Mix & Operations ManagementDo Nothingg
We can try to avoid makingWe can try to avoid makingchoices by doing nothing, but even that is a decision.Gary Collins
h h dDoing nothing is very hard todo, you never know when youare finished.Leslie NielsenLeslie Nielsen
© Guidian Healthcare Consulting 2009
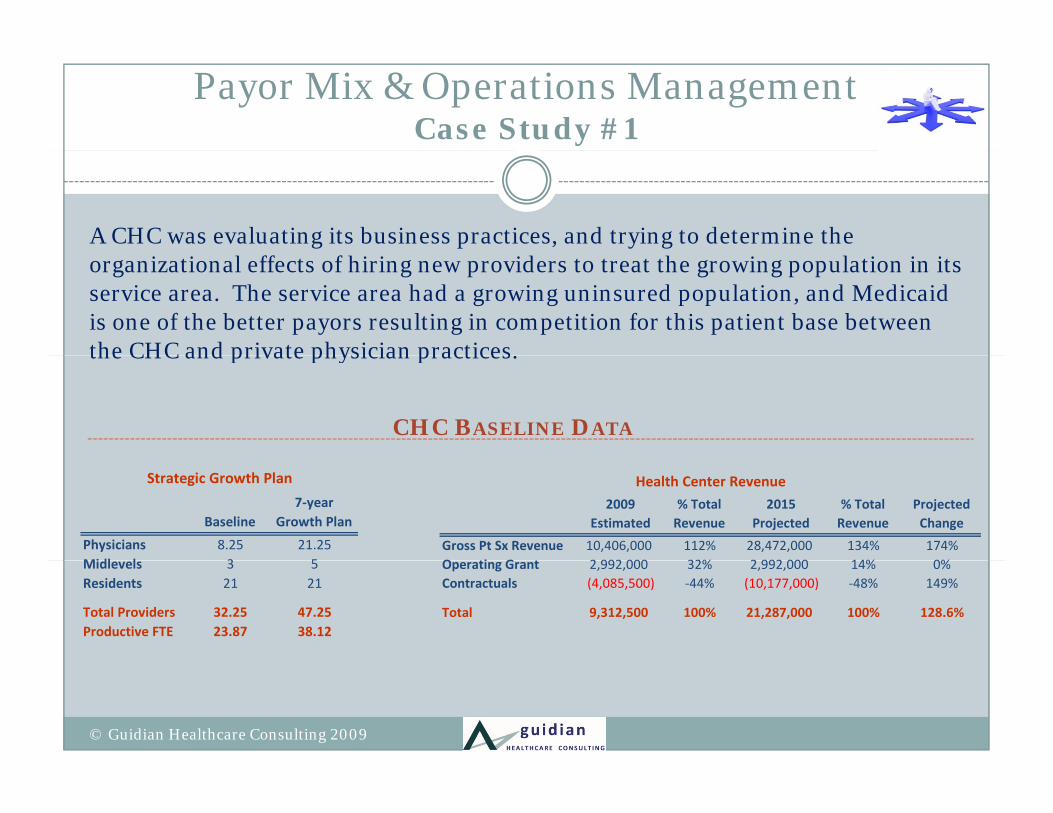
Payor Mix & Operations ManagementCase Study #1
A CHC was evaluating its business practices, and trying to determine the organizational effects of hiring new providers to treat the growing population in its service area. The service area had a growing uninsured population, and Medicaid is one of the better payors resulting in competition for this patient base between the CHC and private physician practices. the CHC and private physician practices.
CHC BASELINE DATA
Baseline 7‐year
Growth Plan
Physicians 8.25 21.25Midl l 3 5
Strategic Growth Plan
2009 Estimated
% Total Revenue
2015 Projected
% Total Revenue
Projected Change
Gross Pt Sx Revenue 10,406,000 112% 28,472,000 134% 174%O ti G t 2 992 000 32% 2 992 000 14% 0%
Health Center Revenue
Midlevels 3 5Residents 21 21
Total Providers 32.25 47.25Productive FTE 23.87 38.12
Operating Grant 2,992,000 32% 2,992,000 14% 0%Contractuals (4,085,500) ‐44% (10,177,000) ‐48% 149%
Total 9,312,500 100% 21,287,000 100% 128.6%
© Guidian Healthcare Consulting 2009
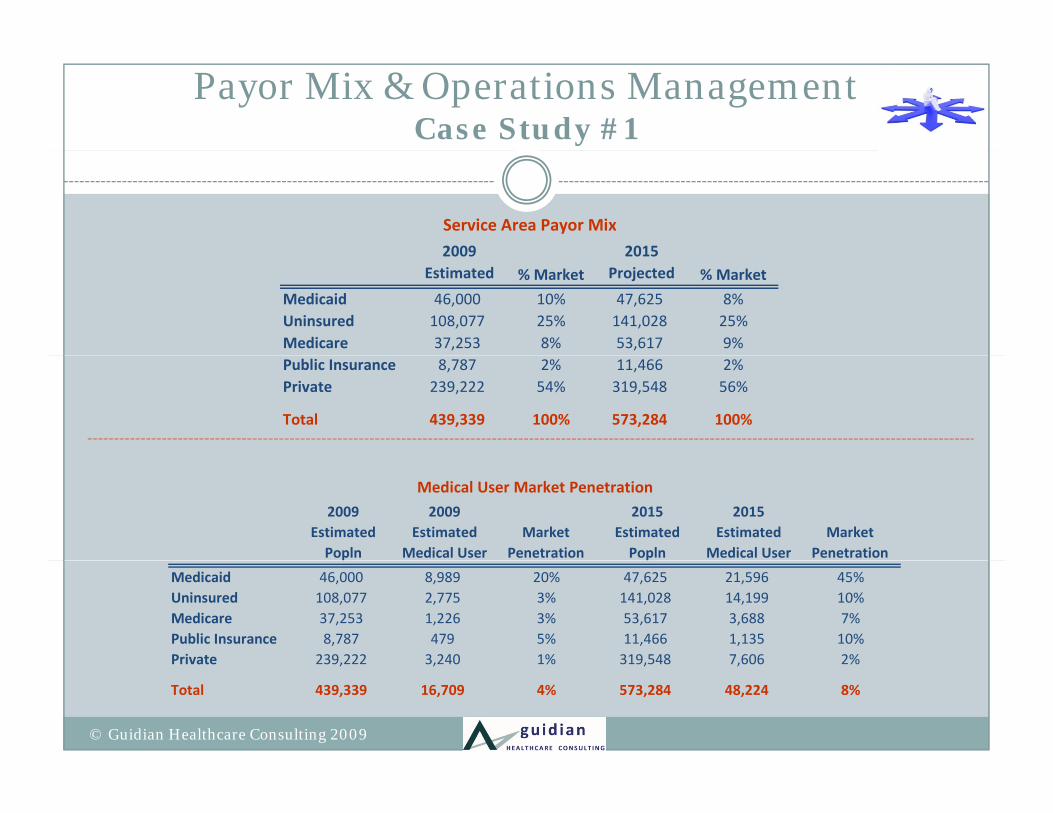
Payor Mix & Operations ManagementCase Study #1
2009 2015
Service Area Payor Mix2009
Estimated % Market2015
Projected % Market
Medicaid 46,000 10% 47,625 8%Uninsured 108,077 25% 141,028 25%Medicare 37,253 8% 53,617 9%Public Insurance 8,787 2% 11,466 2%Private 239,222 54% 319,548 56%
Total 439,339 100% 573,284 100%
2009 Estimated Popln
2009 Estimated
Medical UserMarket
Penetration
2015 Estimated Popln
2015 Estimated
Medical UserMarket
Penetration
Medical User Market Penetration
Medicaid 46,000 8,989 20% 47,625 21,596 45%Uninsured 108,077 2,775 3% 141,028 14,199 10%Medicare 37,253 1,226 3% 53,617 3,688 7%Public Insurance 8,787 479 5% 11,466 1,135 10%Private 239,222 3,240 1% 319,548 7,606 2%Private 239,222 3,240 1% 319,548 7,606 2%
Total 439,339 16,709 4% 573,284 48,224 8%
© Guidian Healthcare Consulting 2009
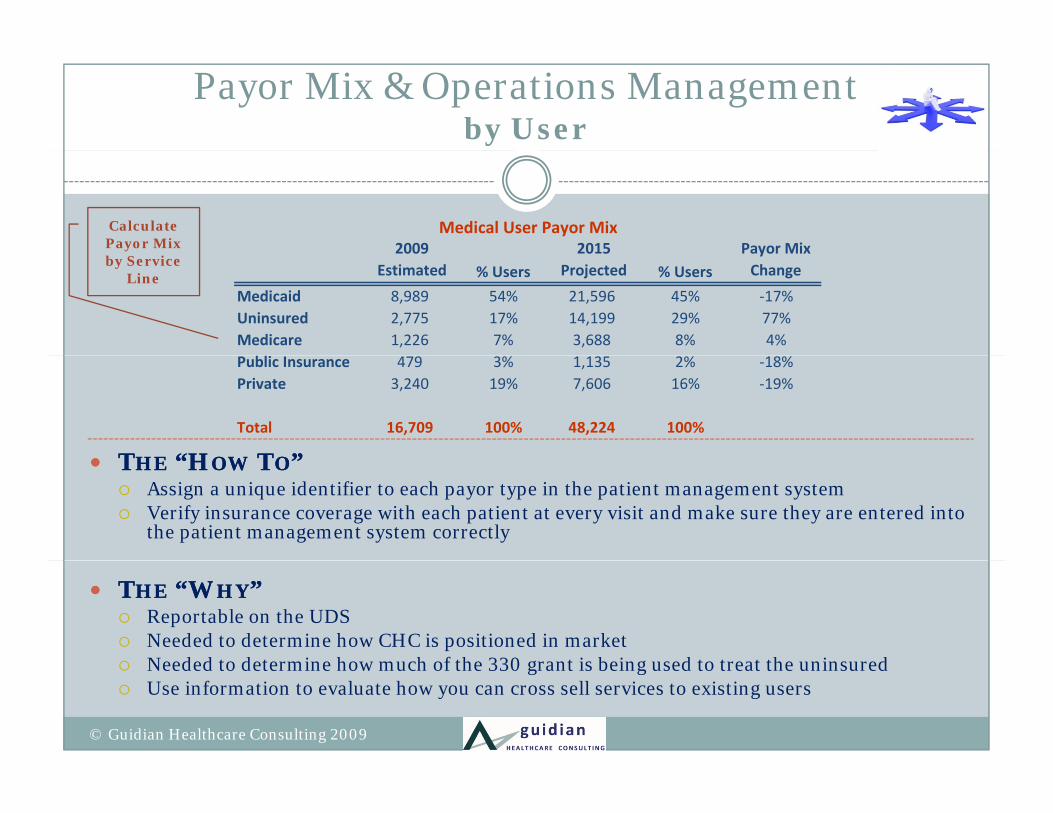
Payor Mix & Operations Managementby User
2009 2015 Payor MixMedical User Payor MixCalculate
Payor Mix 2009 Estimated % Users
2015 Projected % Users
Payor Mix Change
Medicaid 8,989 54% 21,596 45% ‐17%Uninsured 2,775 17% 14,199 29% 77%Medicare 1,226 7% 3,688 8% 4%
by Service Line
TTHEHE “H“HOWOW TTOO””
Public Insurance 479 3% 1,135 2% ‐18%Private 3,240 19% 7,606 16% ‐19%
Total 16,709 100% 48,224 100%
TTHEHE “H“HOWOW TTOO”” Assign a unique identifier to each payor type in the patient management system Verify insurance coverage with each patient at every visit and make sure they are entered into
the patient management system correctly
TTHEHE “W“WHYHY”” Reportable on the UDS Needed to determine how CHC is positioned in market Needed to determine how much of the 330 grant is being used to treat the uninsured Needed to determine how much of the 330 grant is being used to treat the uninsured Use information to evaluate how you can cross sell services to existing users
© Guidian Healthcare Consulting 2009
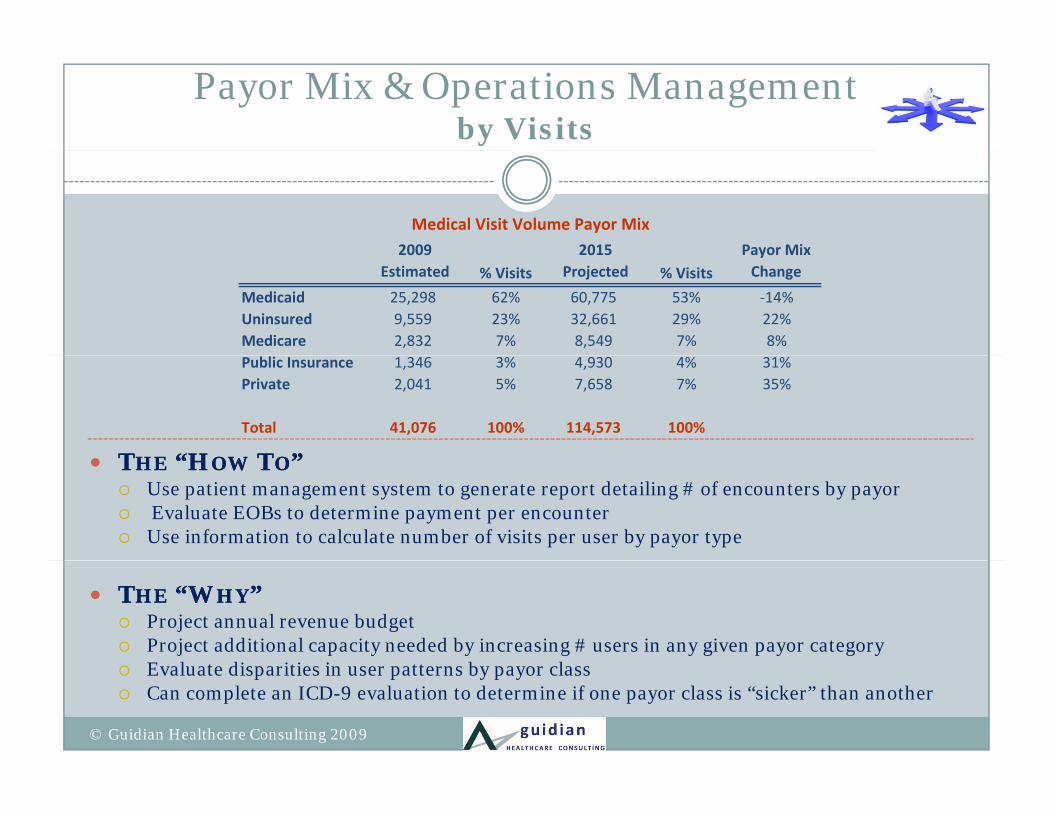
Payor Mix & Operations Managementby Visits
2009 2015 Payor Mix
Medical Visit Volume Payor Mix2009
Estimated % Visits2015
Projected % VisitsPayor Mix Change
Medicaid 25,298 62% 60,775 53% ‐14%Uninsured 9,559 23% 32,661 29% 22%Medicare 2,832 7% 8,549 7% 8%
TTHEHE “H“HOWOW TTOO””
Public Insurance 1,346 3% 4,930 4% 31%Private 2,041 5% 7,658 7% 35%
Total 41,076 100% 114,573 100%
TTHEHE “H“HOWOW TTOO”” Use patient management system to generate report detailing # of encounters by payor Evaluate EOBs to determine payment per encounter Use information to calculate number of visits per user by payor type
TTHEHE “W“WHYHY”” Project annual revenue budget Project additional capacity needed by increasing # users in any given payor category
E l t di iti i tt b l Evaluate disparities in user patterns by payor class Can complete an ICD-9 evaluation to determine if one payor class is “sicker” than another
© Guidian Healthcare Consulting 2009
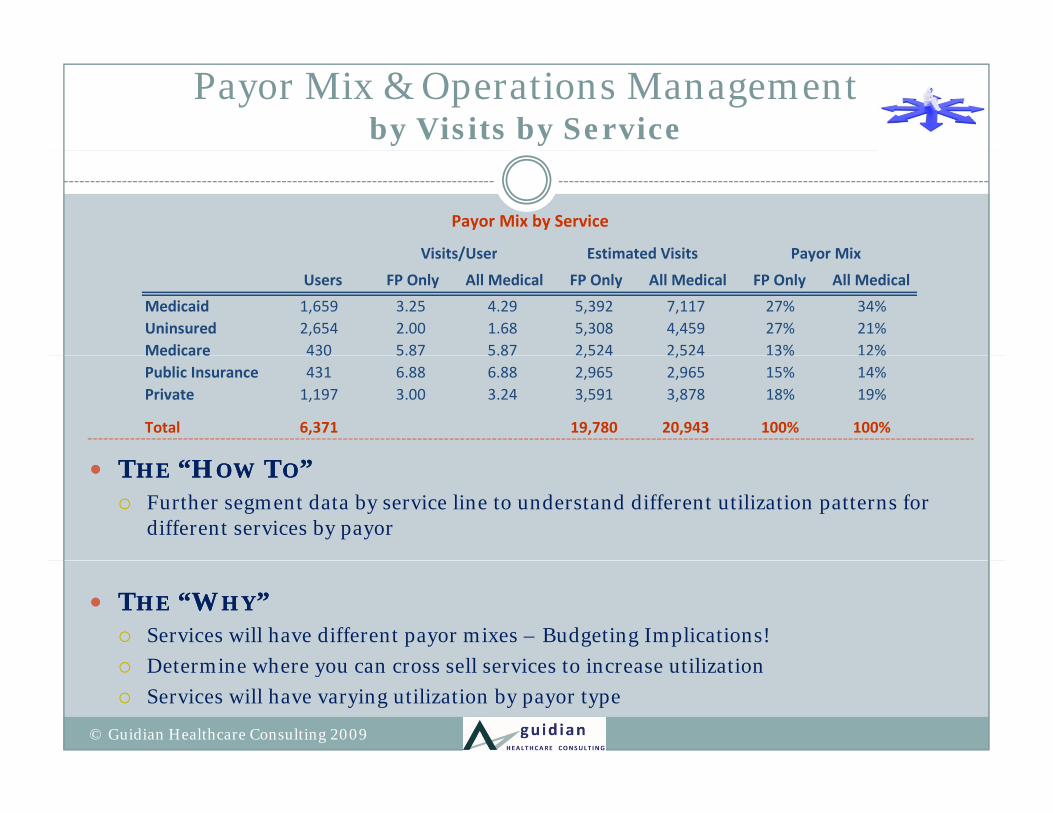
Payor Mix & Operations Managementby Visits by Service
Visits/User Estimated Visits Payor Mix
Payor Mix by Service
Users FP Only All Medical FP Only All Medical FP Only All Medical
Medicaid 1,659 3.25 4.29 5,392 7,117 27% 34%Uninsured 2,654 2.00 1.68 5,308 4,459 27% 21%Medicare 430 5.87 5.87 2,524 2,524 13% 12%
Visits/User Estimated Visits Payor Mix
““ ””
Medicare 430 5.87 5.87 ,5 4 ,5 4 3% %Public Insurance 431 6.88 6.88 2,965 2,965 15% 14%Private 1,197 3.00 3.24 3,591 3,878 18% 19%
Total 6,371 19,780 20,943 100% 100%
TTHEHE “H“HOWOW TTOO”” Further segment data by service line to understand different utilization patterns for
different services by payor
TTHEHE “W“WHYHY”” Services will have different payor mixes – Budgeting Implications! Determine where you can cross sell services to increase utilization Determine where you can cross sell services to increase utilization Services will have varying utilization by payor type
© Guidian Healthcare Consulting 2009
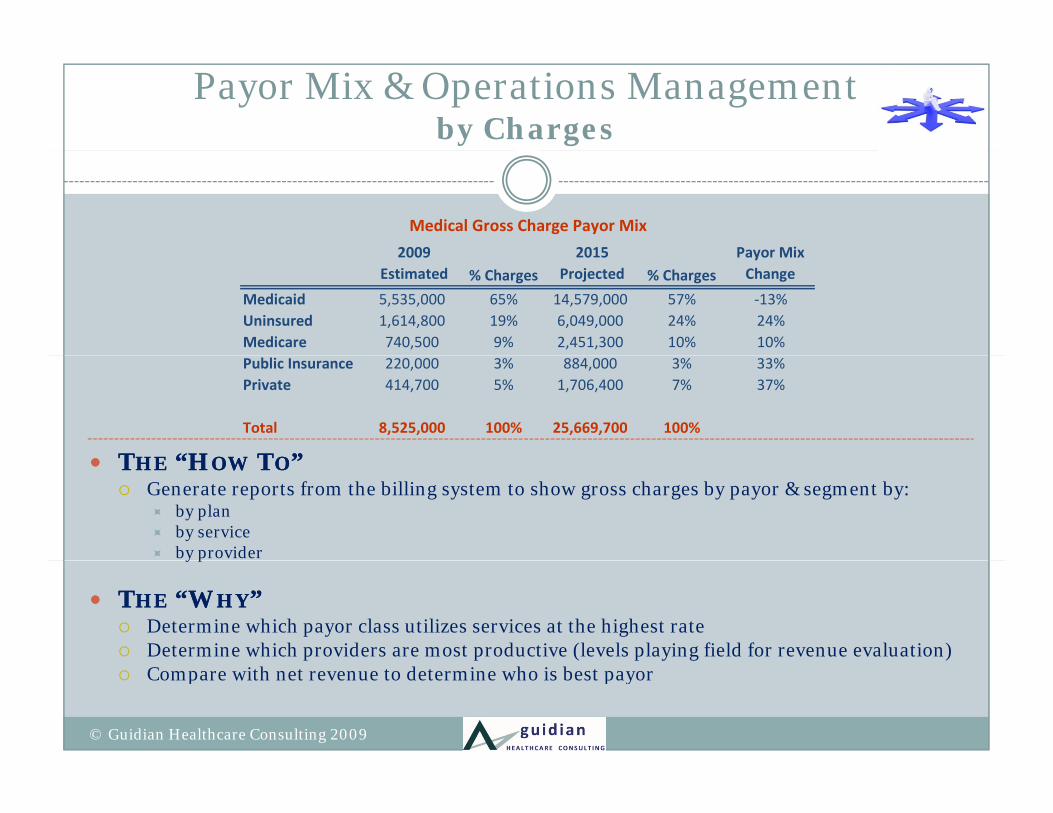
Payor Mix & Operations Managementby Charges
2009 2015 Payor Mix
Medical Gross Charge Payor Mix
2009 Estimated % Charges
2015 Projected % Charges
Payor Mix Change
Medicaid 5,535,000 65% 14,579,000 57% ‐13%Uninsured 1,614,800 19% 6,049,000 24% 24%Medicare 740,500 9% 2,451,300 10% 10%
TTHEHE “H“HOWOW TTOO””
Public Insurance 220,000 3% 884,000 3% 33%Private 414,700 5% 1,706,400 7% 37%
Total 8,525,000 100% 25,669,700 100%
TTHEHE “H“HOWOW TTOO”” Generate reports from the billing system to show gross charges by payor & segment by:
by plan by service by providery p
TTHEHE “W“WHYHY”” Determine which payor class utilizes services at the highest rate Determine which providers are most productive (levels playing field for revenue evaluation) Compare with net revenue to determine who is best payor
© Guidian Healthcare Consulting 2009
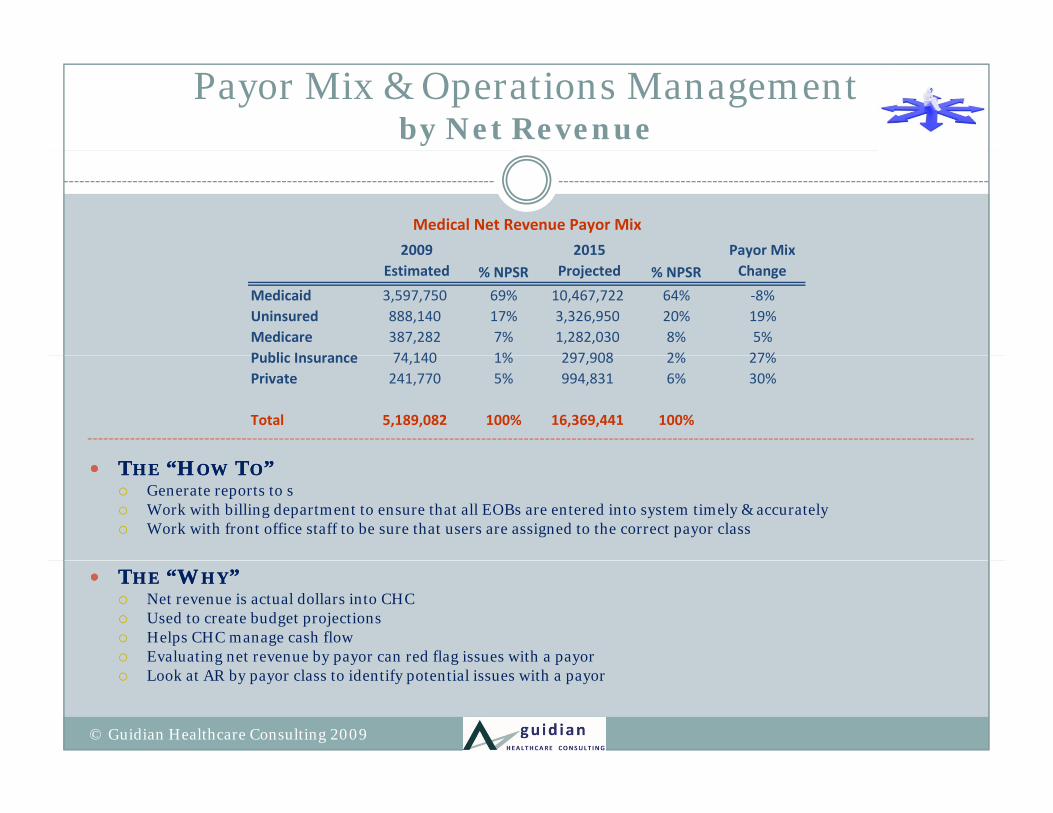
Payor Mix & Operations Managementby Net Revenue
2009 2015 Payor Mix
Medical Net Revenue Payor Mix
2009 Estimated % NPSR
2015 Projected % NPSR
Payor Mix Change
Medicaid 3,597,750 69% 10,467,722 64% ‐8%Uninsured 888,140 17% 3,326,950 20% 19%Medicare 387,282 7% 1,282,030 8% 5%Public Insurance 74 140 1% 297 908 2% 27%Public Insurance 74,140 1% 297,908 2% 27%Private 241,770 5% 994,831 6% 30%
Total 5,189,082 100% 16,369,441 100%
TTHEHE “H“HOWOW TTOO”” Generate reports to s Work with billing department to ensure that all EOBs are entered into system timely & accurately Work with front office staff to be sure that users are assigned to the correct payor class
TTHEHE “W“WHYHY”” Net revenue is actual dollars into CHC Used to create budget projections Helps CHC manage cash flow Evaluating net revenue by payor can red flag issues with a payorg y p y g p y Look at AR by payor class to identify potential issues with a payor
© Guidian Healthcare Consulting 2009
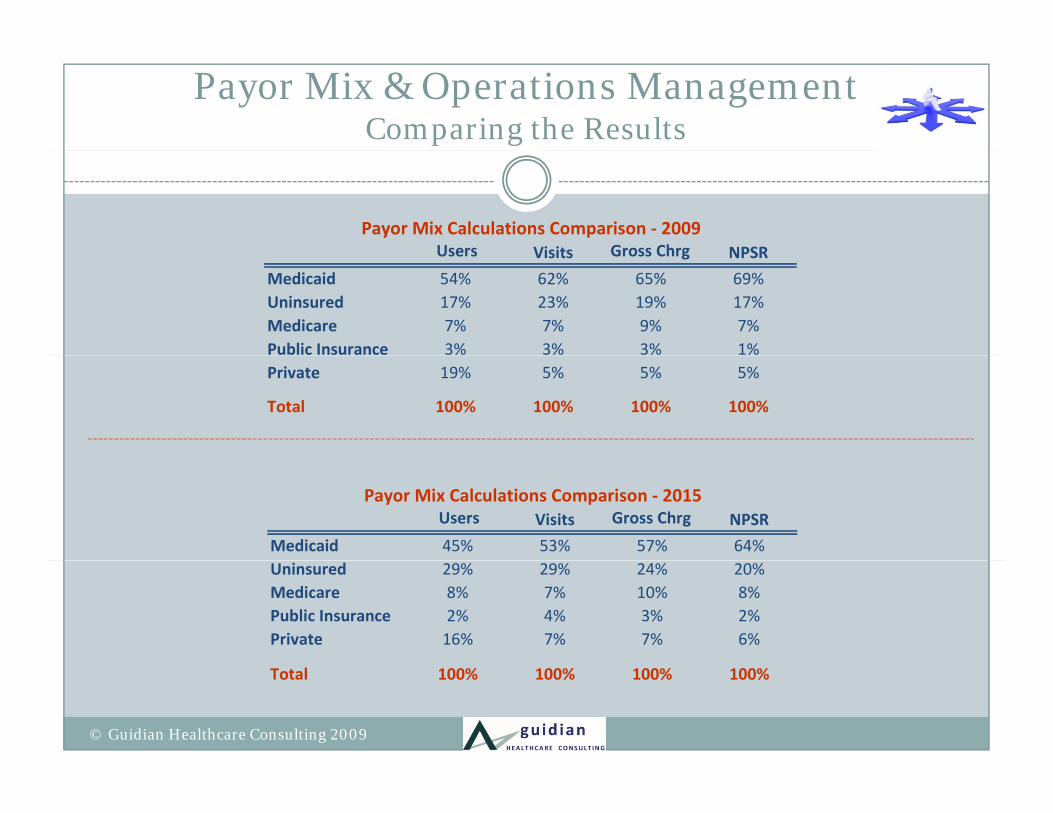
Payor Mix & Operations ManagementComparing the Results
Users Visits Gross Chrg NPSRPayor Mix Calculations Comparison ‐ 2009
Users Visits Gross Chrg NPSR
Medicaid 54% 62% 65% 69%Uninsured 17% 23% 19% 17%Medicare 7% 7% 9% 7%Public Insurance 3% 3% 3% 1%Private 19% 5% 5% 5%
Total 100% 100% 100% 100%
Users Visits Gross Chrg NPSR
Medicaid 45% 53% 57% 64%
Payor Mix Calculations Comparison ‐ 2015
Uninsured 29% 29% 24% 20%Medicare 8% 7% 10% 8%Public Insurance 2% 4% 3% 2%Private 16% 7% 7% 6%
Total 100% 100% 100% 100%
© Guidian Healthcare Consulting 2009
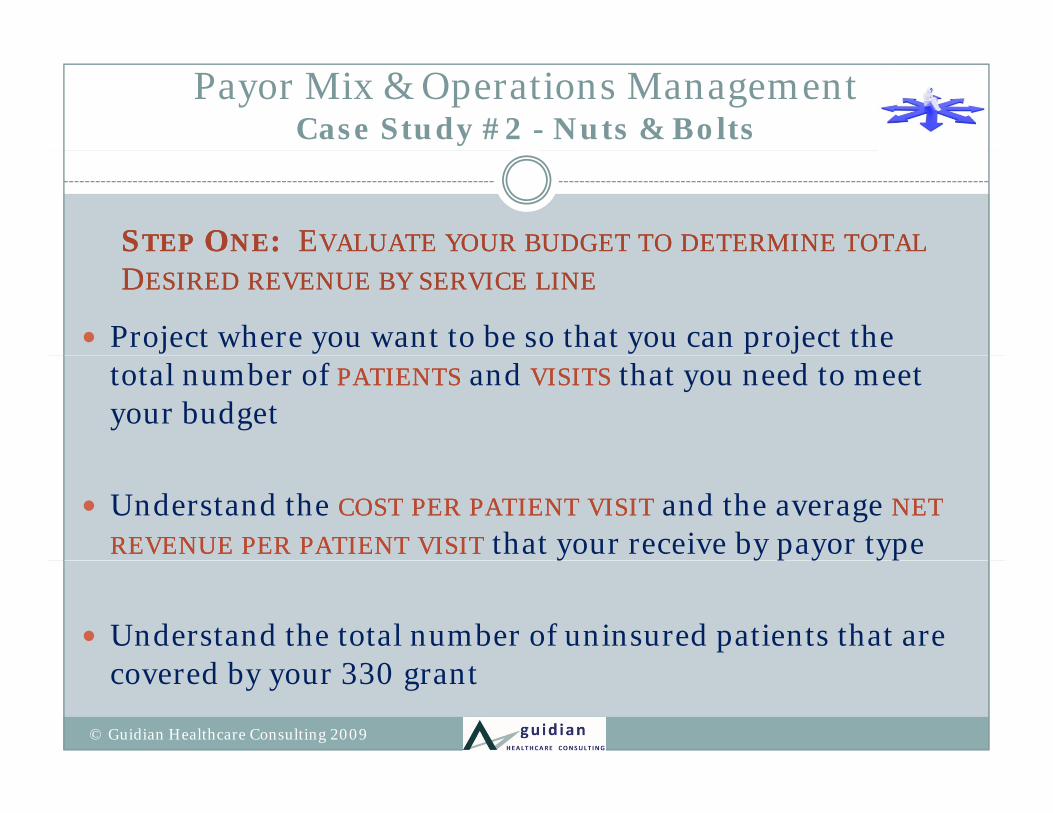
Payor Mix & Operations ManagementCase Study #2 - Nuts & Bolts
SSTEPTEP OONENE: : EEVALUATEVALUATE YOURYOUR BUDGETBUDGET TOTO DETERMINEDETERMINE TOTALTOTAL
Project where you want to be so that you can project the
DDESIREDESIRED REVENUEREVENUE BYBY SERVICESERVICE LINELINE
total number of PATIENTSPATIENTS and VISITSVISITS that you need to meet your budget
Understand the COSTCOST PERPER PATIENTPATIENT VISITVISIT and the average NETNETREVENUEREVENUE PERPER PATIENTPATIENT VISITVISIT that your receive by payor typey y p y yp
Understand the total number of uninsured patients that are d b covered by your 330 grant
© Guidian Healthcare Consulting 2009
Payor Mix & Operations ManagementCase Study #2 - Nuts & Bolts
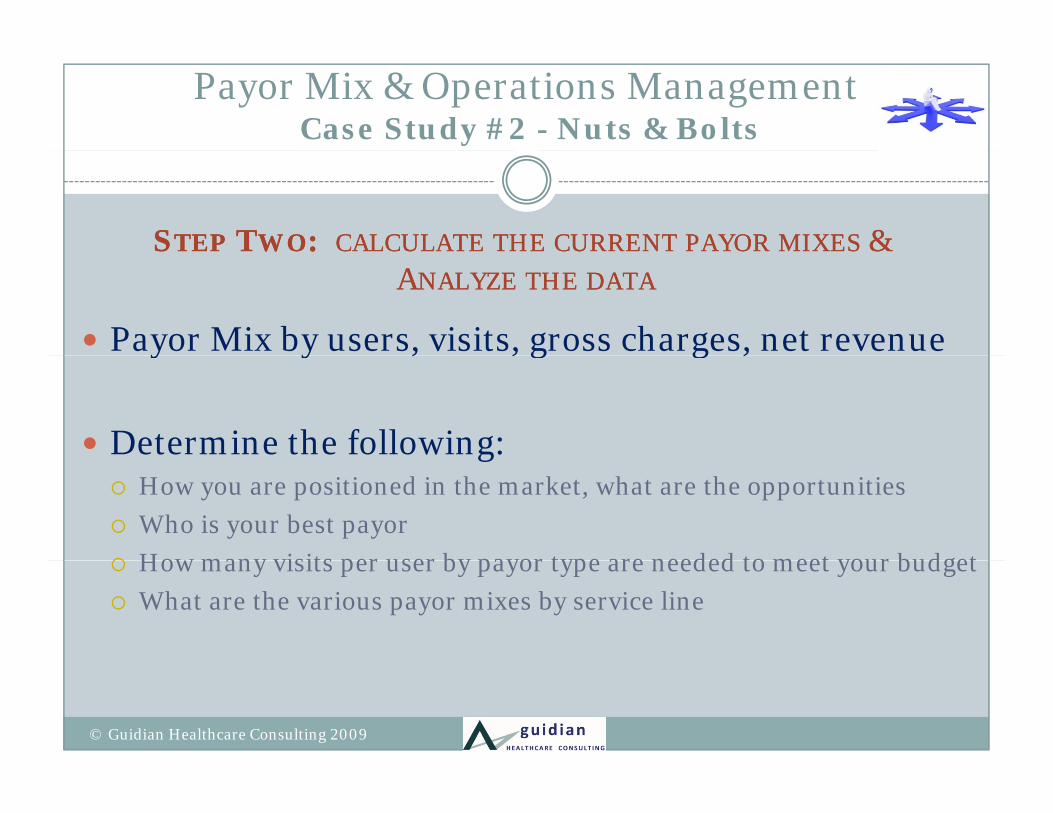
SSTEPTEP TTWOWO: : CALCULATECALCULATE THETHE CURRENTCURRENT PAYORPAYOR MIXESMIXES &&
Payor Mix by users, visits, gross charges, net revenue
AANALYZENALYZE THETHE DATADATA
y y , , g g ,
Determine the following:g How you are positioned in the market, what are the opportunities Who is your best payor How many visits per user by payor type are needed to meet your budget How many visits per user by payor type are needed to meet your budget What are the various payor mixes by service line
© Guidian Healthcare Consulting 2009
Payor Mix & Operations ManagementCase Study #2 - Nuts & Bolts
SSTEPTEP TTHREEHREE: : CCREATEREATE AA PLANPLAN TOTO OPTIMIZEOPTIMIZE PAYORPAYOR MIXMIX
Set targets for optimal payor mix
Determine the best way to attract the number of new patients needed by payor for each service line
Educate all staff about the plan
Implement your plan
© Guidian Healthcare Consulting 2009
Payor Mix & Operations ManagementCase Study #2 - Nuts & Bolts
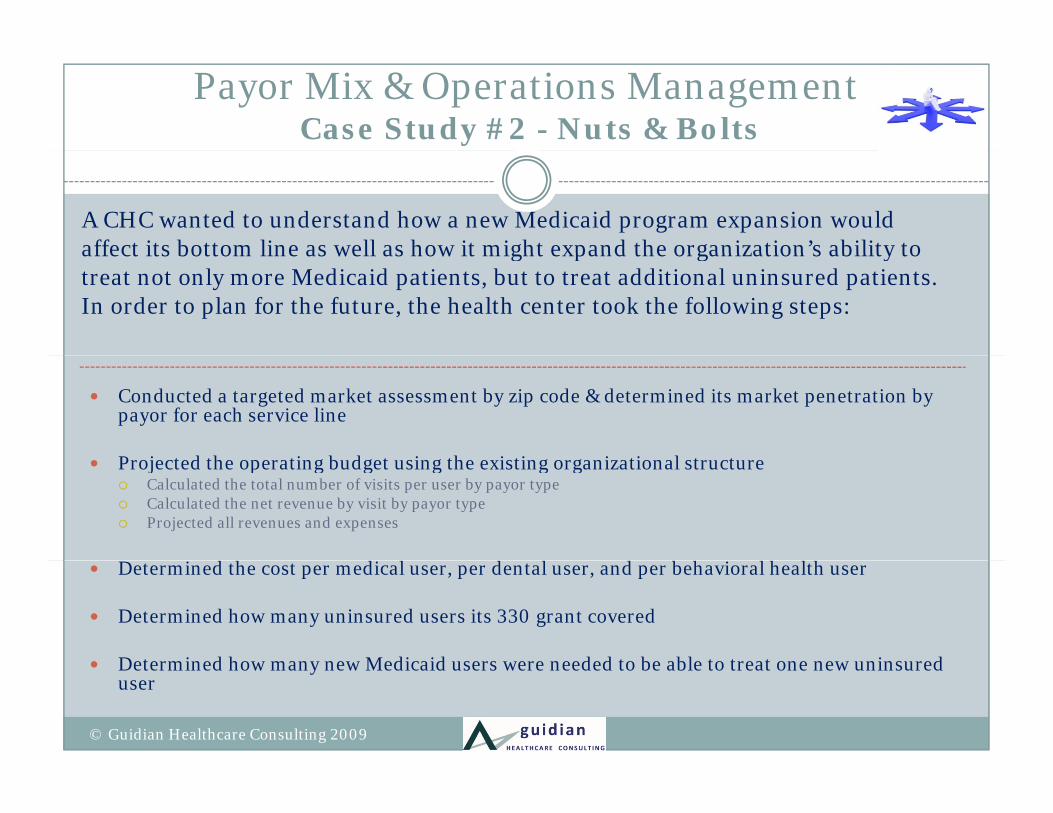
A CHC wanted to understand how a new Medicaid program expansion would affect its bottom line as well as how it might expand the organization’s ability to affect its bottom line as well as how it might expand the organization s ability to treat not only more Medicaid patients, but to treat additional uninsured patients. In order to plan for the future, the health center took the following steps:
Conducted a targeted market assessment by zip code & determined its market penetration by payor for each service line
P j t d th ti b d t i th i ti i ti l t t Projected the operating budget using the existing organizational structure Calculated the total number of visits per user by payor type Calculated the net revenue by visit by payor type Projected all revenues and expenses
i d h di l d l d b h i l h l h Determined the cost per medical user, per dental user, and per behavioral health user
Determined how many uninsured users its 330 grant covered
Determined how many new Medicaid users were needed to be able to treat one new uninsured Determined how many new Medicaid users were needed to be able to treat one new uninsured user
© Guidian Healthcare Consulting 2009
Payor Mix & Operations ManagementCase Study #2 - Nuts & Bolts
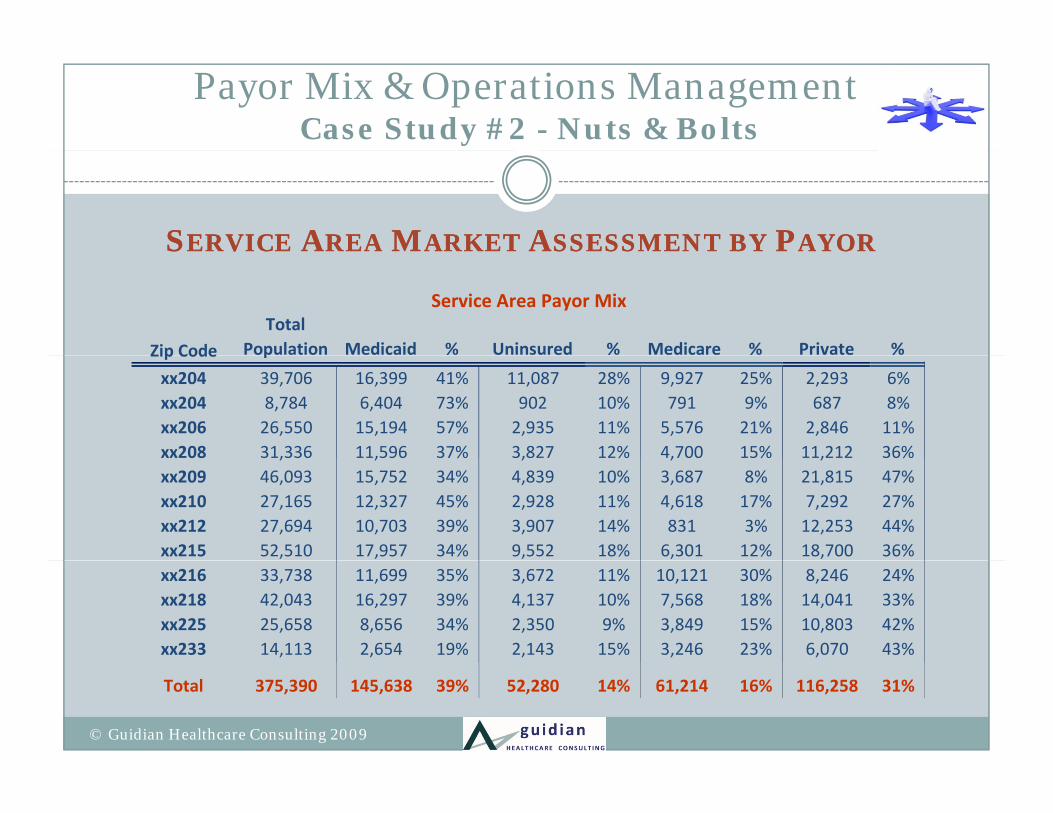
SSERVICEERVICE AAREAREA MMARKETARKET AASSESSMENTSSESSMENT BYBY PPAYORAYOR
Zip CodeTotal
Population Medicaid % Uninsured % Medicare % Private %
Service Area Payor Mix
Zip Code p
xx204 39,706 16,399 41% 11,087 28% 9,927 25% 2,293 6%xx204 8,784 6,404 73% 902 10% 791 9% 687 8%xx206 26,550 15,194 57% 2,935 11% 5,576 21% 2,846 11%xx208 31,336 11,596 37% 3,827 12% 4,700 15% 11,212 36%08 3 ,336 ,596 3 % 3,8 % , 00 5% , 36%xx209 46,093 15,752 34% 4,839 10% 3,687 8% 21,815 47%xx210 27,165 12,327 45% 2,928 11% 4,618 17% 7,292 27%xx212 27,694 10,703 39% 3,907 14% 831 3% 12,253 44%xx215 52,510 17,957 34% 9,552 18% 6,301 12% 18,700 36%xx216 33,738 11,699 35% 3,672 11% 10,121 30% 8,246 24%xx218 42,043 16,297 39% 4,137 10% 7,568 18% 14,041 33%xx225 25,658 8,656 34% 2,350 9% 3,849 15% 10,803 42%xx233 14,113 2,654 19% 2,143 15% 3,246 23% 6,070 43%
Total 375,390 145,638 39% 52,280 14% 61,214 16% 116,258 31%
© Guidian Healthcare Consulting 2009
Payor Mix & Operations ManagementCase Study #2 - Nuts & Bolts
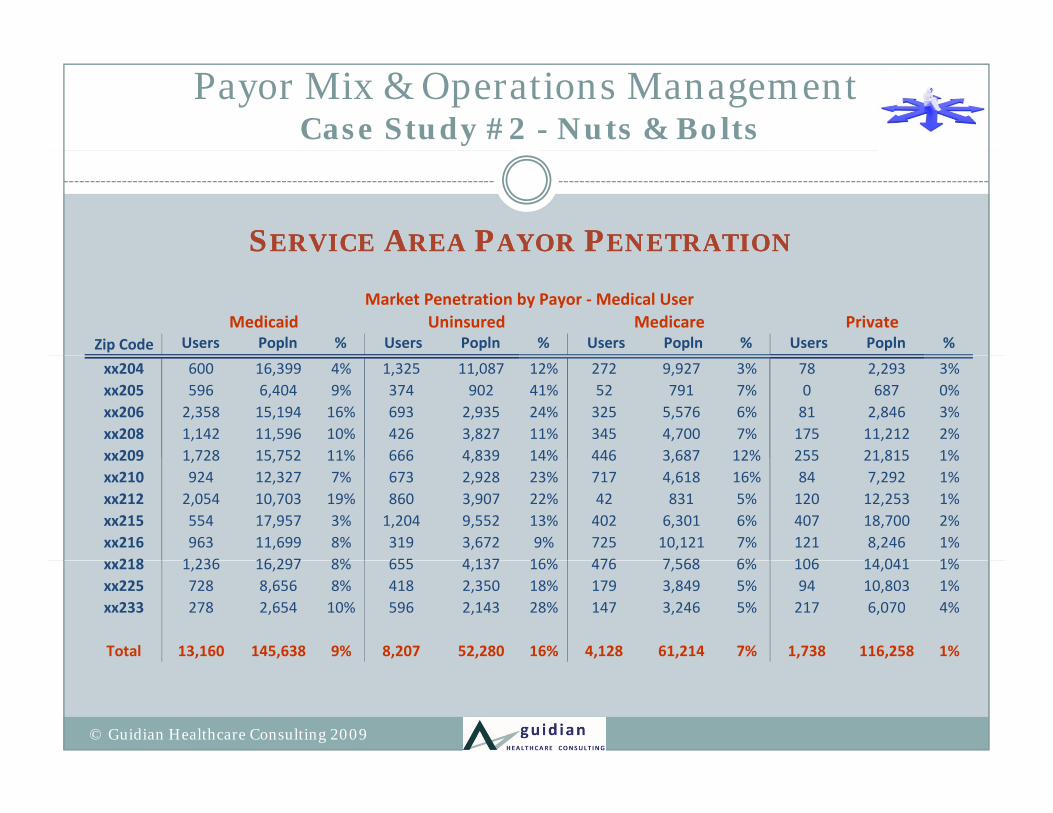
SSERVICEERVICE AAREAREA PPAYORAYOR PPENETRATIONENETRATION
Zip Code Users Popln % Users Popln % Users Popln % Users Popln %
Market Penetration by Payor ‐ Medical UserMedicaid Uninsured Medicare Private
xx204 600 16,399 4% 1,325 11,087 12% 272 9,927 3% 78 2,293 3%xx205 596 6,404 9% 374 902 41% 52 791 7% 0 687 0%xx206 2,358 15,194 16% 693 2,935 24% 325 5,576 6% 81 2,846 3%xx208 1,142 11,596 10% 426 3,827 11% 345 4,700 7% 175 11,212 2%xx209 1 728 15 752 11% 666 4 839 14% 446 3 687 12% 255 21 815 1%xx209 1,728 15,752 11% 666 4,839 14% 446 3,687 12% 255 21,815 1%xx210 924 12,327 7% 673 2,928 23% 717 4,618 16% 84 7,292 1%xx212 2,054 10,703 19% 860 3,907 22% 42 831 5% 120 12,253 1%xx215 554 17,957 3% 1,204 9,552 13% 402 6,301 6% 407 18,700 2%xx216 963 11,699 8% 319 3,672 9% 725 10,121 7% 121 8,246 1%218 1 236 16 297 8% 655 4 137 16% 476 7 568 6% 106 14 041 1%xx218 1,236 16,297 8% 655 4,137 16% 476 7,568 6% 106 14,041 1%
xx225 728 8,656 8% 418 2,350 18% 179 3,849 5% 94 10,803 1%xx233 278 2,654 10% 596 2,143 28% 147 3,246 5% 217 6,070 4%
Total 13,160 145,638 9% 8,207 52,280 16% 4,128 61,214 7% 1,738 116,258 1%
© Guidian Healthcare Consulting 2009
Payor Mix & Operations ManagementCase Study #2 - Nuts & Bolts
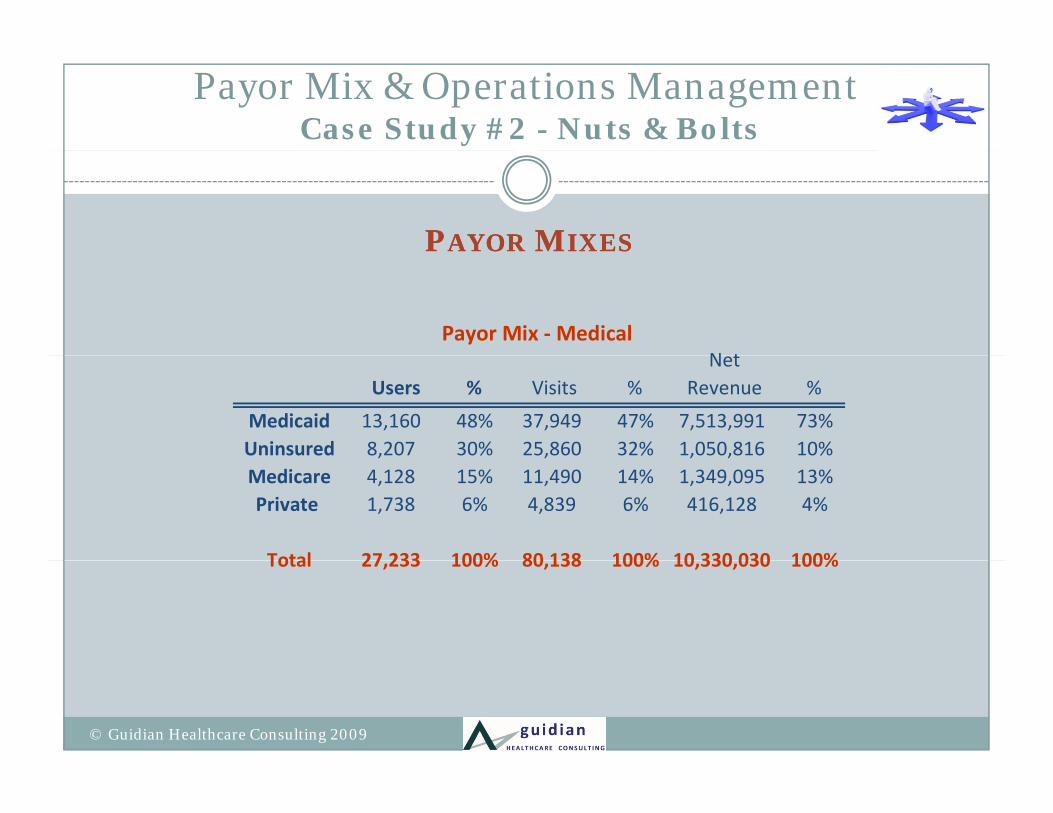
PPAYORAYOR MMIXESIXES
N tPayor Mix ‐ Medical
Users % Visits %Net
Revenue %
Medicaid 13,160 48% 37,949 47% 7,513,991 73%Uninsured 8,207 30% 25,860 32% 1,050,816 10%, , , ,Medicare 4,128 15% 11,490 14% 1,349,095 13%Private 1,738 6% 4,839 6% 416,128 4%
Total 27 233 100% 80 138 100% 10 330 030 100%Total 27,233 100% 80,138 100% 10,330,030 100%
© Guidian Healthcare Consulting 2009
Payor Mix & Operations ManagementCase Study #2 - Nuts & Bolts
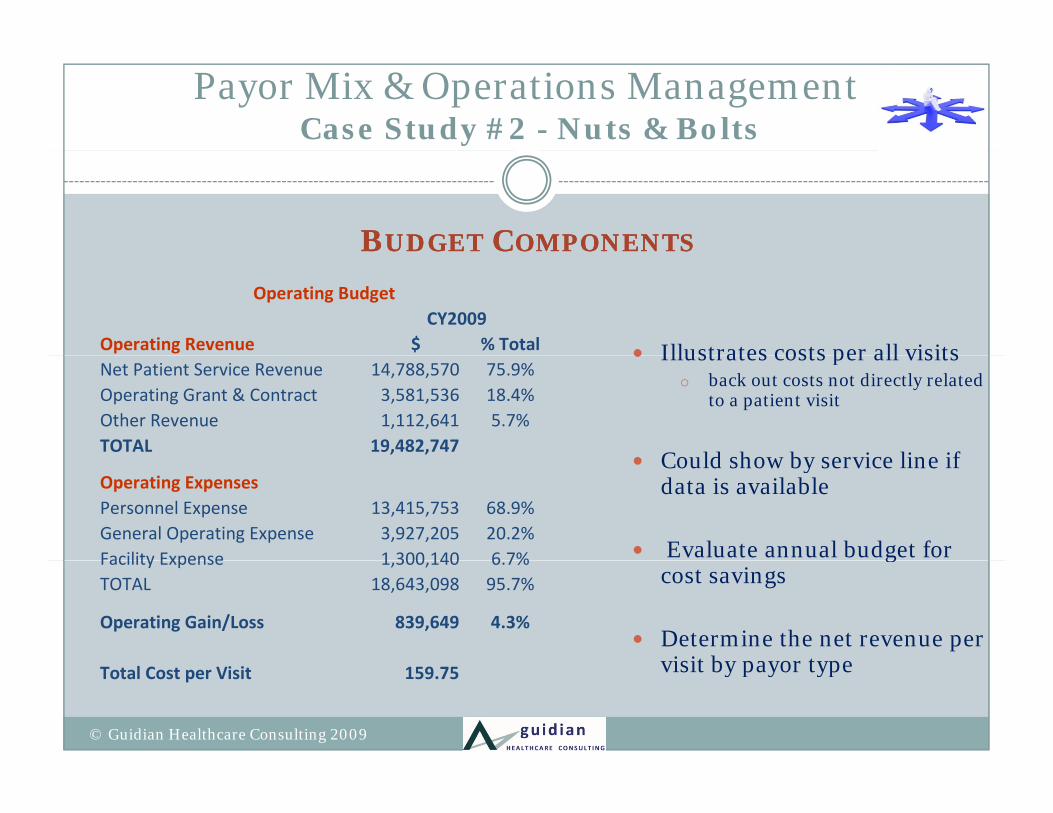
BBUDGETUDGET CCOMPONENTSOMPONENTS
Illustrates costs per all visits Operating Revenue $ % TotalCY2009
Operating Budget
Illustrates costs per all visits o back out costs not directly related
to a patient visit
Could show by service line if
Net Patient Service Revenue 14,788,570 75.9%Operating Grant & Contract 3,581,536 18.4%Other Revenue 1,112,641 5.7%TOTAL 19,482,747
Could show by service line if data is available
Evaluate annual budget for
Operating ExpensesPersonnel Expense 13,415,753 68.9%General Operating Expense 3,927,205 20.2%Facility Expense 1 300 140 6 7% g
cost savings
Determine the net revenue per visit by payor type
Facility Expense 1,300,140 6.7%TOTAL 18,643,098 95.7%
Operating Gain/Loss 839,649 4.3%
visit by payor typeTotal Cost per Visit 159.75
© Guidian Healthcare Consulting 2009
Payor Mix & Operations ManagementCase Study #2 - Nuts & Bolts
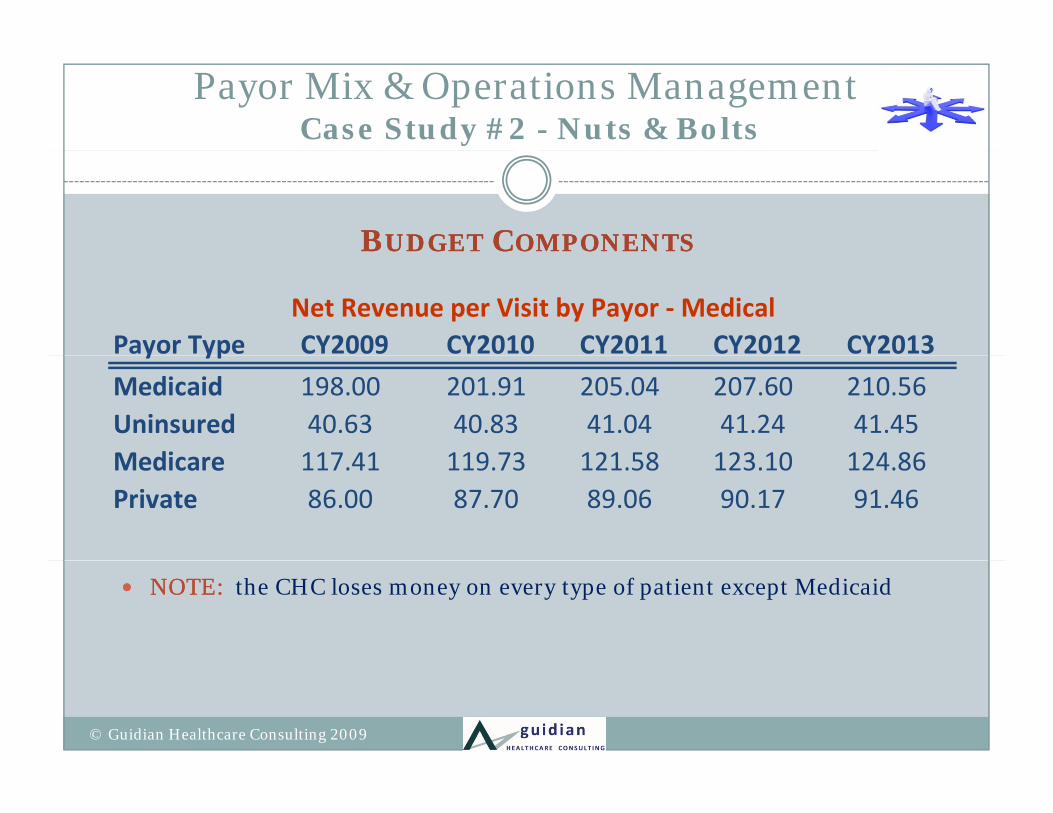
BBUDGETUDGET CCOMPONENTSOMPONENTS
Payor Type CY2009 CY2010 CY2011 CY2012 CY2013Net Revenue per Visit by Payor ‐ Medical
y yp
Medicaid 198.00 201.91 205.04 207.60 210.56Uninsured 40.63 40.83 41.04 41.24 41.45Medicare 117 41 119 73 121 58 123 10 124 86Medicare 117.41 119.73 121.58 123.10 124.86Private 86.00 87.70 89.06 90.17 91.46
NOTE: NOTE: the CHC loses money on every type of patient except Medicaid
© Guidian Healthcare Consulting 2009
Payor Mix & Operations ManagementCase Study #2 - Nuts & Bolts
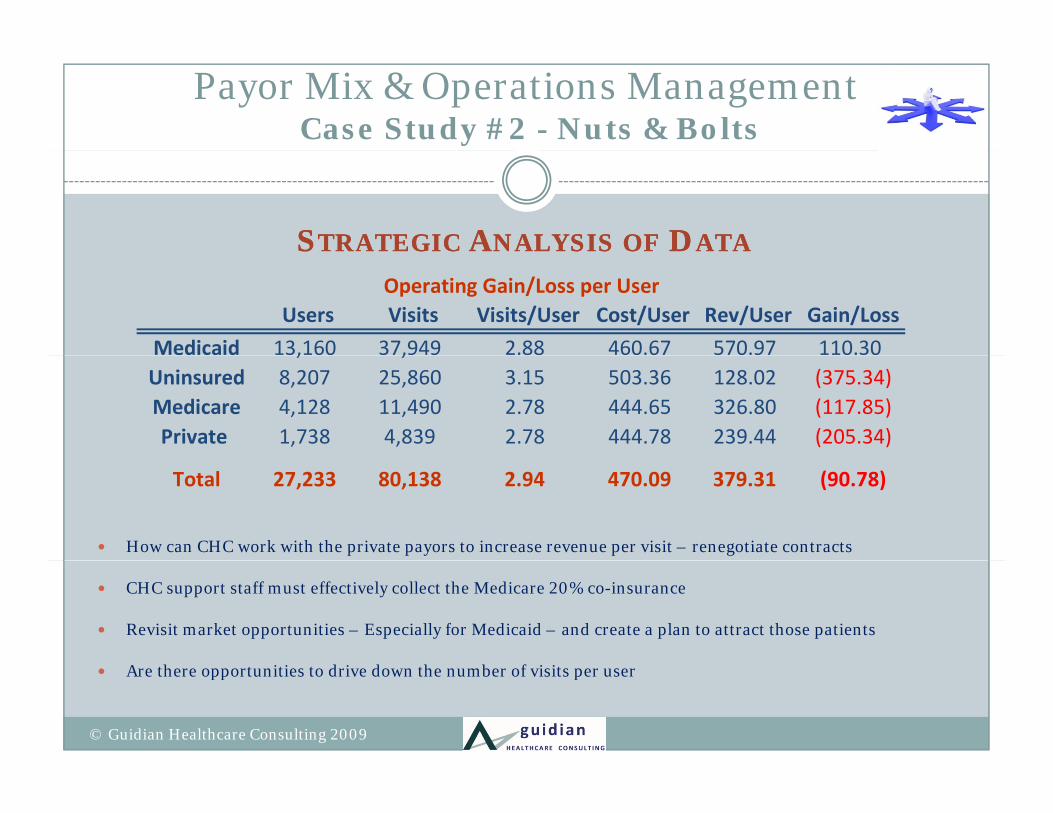
SSTRATEGICTRATEGIC AANALYSISNALYSIS OFOF DDATAATA
Users Visits Visits/User Cost/User Rev/User Gain/Loss
Medicaid 13,160 37,949 2.88 460.67 570.97 110.30
Operating Gain/Loss per User
, ,Uninsured 8,207 25,860 3.15 503.36 128.02 (375.34)Medicare 4,128 11,490 2.78 444.65 326.80 (117.85)Private 1,738 4,839 2.78 444.78 239.44 (205.34)
How can CHC work with the private payors to increase revenue per visit – renegotiate contracts
Total 27,233 80,138 2.94 470.09 379.31 (90.78)
CHC support staff must effectively collect the Medicare 20% co-insurance
Revisit market opportunities – Especially for Medicaid – and create a plan to attract those patients
Are there opportunities to drive down the number of visits per user
© Guidian Healthcare Consulting 2009

Payor Mix & Operations ManagementCase Study #2 - Nuts & Bolts
WWHATHAT DDOESOES GGRANTRANT FFUNDINGUNDING CCOVEROVER
330 Grant & Other Grants 3,336,691Cost to Treat Uninsured User 503.36Cost to Treat Uninsured User 503.36Total Users Covered by Grant 6,629
Excess Uninsured Users 1,578Excess Cost of Uninsured 4,131,135
NOTE: NOTE: the CHC will need to bring in 3.5 new Medicaid users for every new Uninsured user
© Guidian Healthcare Consulting 2009
Payor Mix & Operations ManagementCase Study #2 - Nuts & Bolts
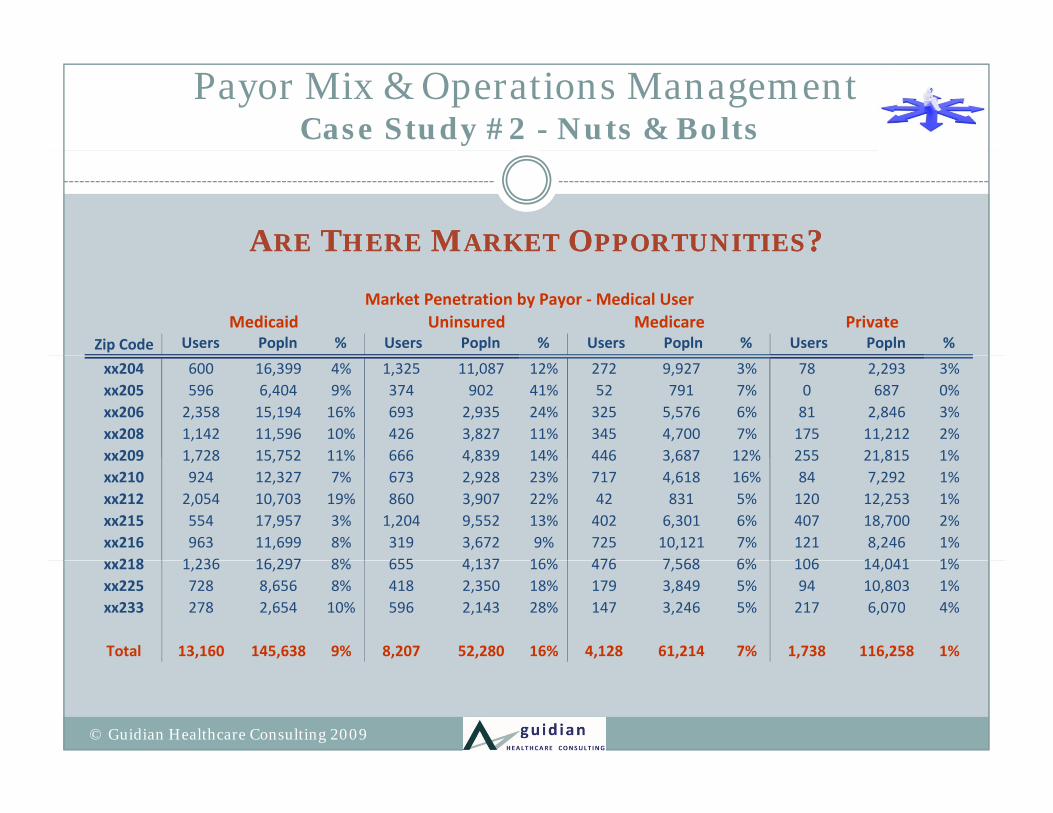
AARERE TTHEREHERE MMARKETARKET OOPPORTUNITIESPPORTUNITIES??
Zip Code Users Popln % Users Popln % Users Popln % Users Popln %
Market Penetration by Payor ‐ Medical UserMedicaid Uninsured Medicare Private
xx204 600 16,399 4% 1,325 11,087 12% 272 9,927 3% 78 2,293 3%xx205 596 6,404 9% 374 902 41% 52 791 7% 0 687 0%xx206 2,358 15,194 16% 693 2,935 24% 325 5,576 6% 81 2,846 3%xx208 1,142 11,596 10% 426 3,827 11% 345 4,700 7% 175 11,212 2%xx209 1 728 15 752 11% 666 4 839 14% 446 3 687 12% 255 21 815 1%xx209 1,728 15,752 11% 666 4,839 14% 446 3,687 12% 255 21,815 1%xx210 924 12,327 7% 673 2,928 23% 717 4,618 16% 84 7,292 1%xx212 2,054 10,703 19% 860 3,907 22% 42 831 5% 120 12,253 1%xx215 554 17,957 3% 1,204 9,552 13% 402 6,301 6% 407 18,700 2%xx216 963 11,699 8% 319 3,672 9% 725 10,121 7% 121 8,246 1%218 1 236 16 297 8% 655 4 137 16% 476 7 568 6% 106 14 041 1%xx218 1,236 16,297 8% 655 4,137 16% 476 7,568 6% 106 14,041 1%
xx225 728 8,656 8% 418 2,350 18% 179 3,849 5% 94 10,803 1%xx233 278 2,654 10% 596 2,143 28% 147 3,246 5% 217 6,070 4%
Total 13,160 145,638 9% 8,207 52,280 16% 4,128 61,214 7% 1,738 116,258 1%
© Guidian Healthcare Consulting 2009
Payor Mix & Operations ManagementCase Study #2 - Nuts & Bolts
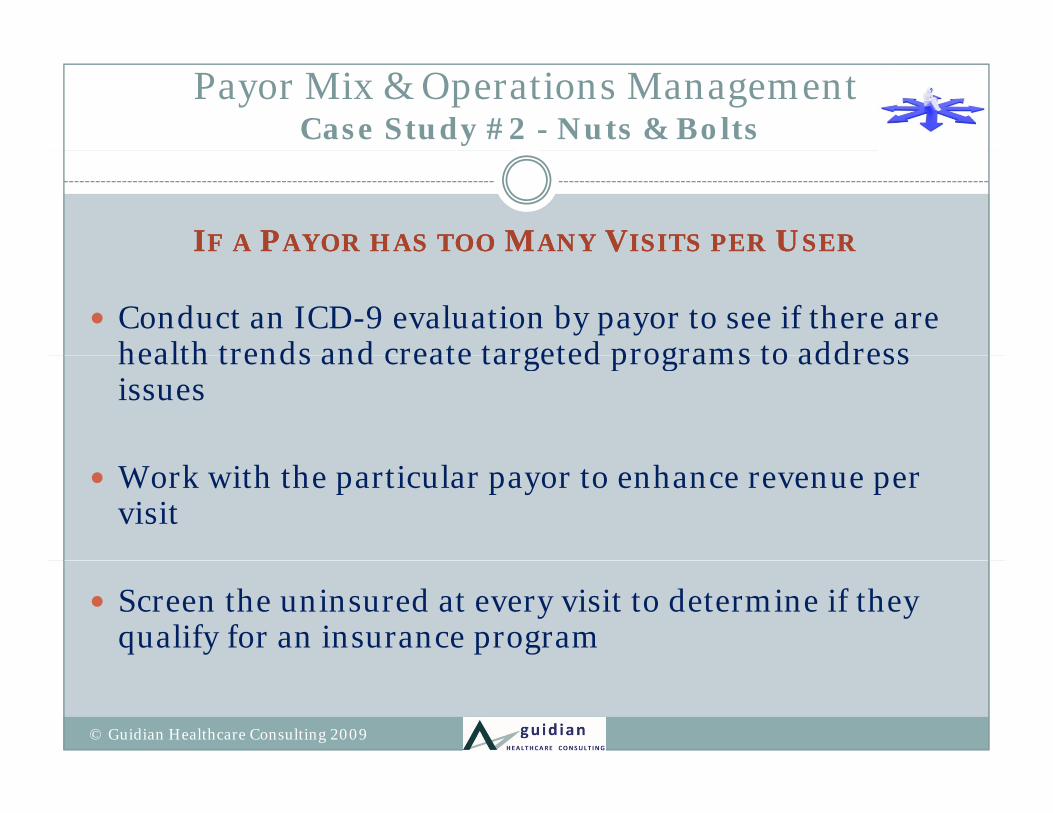
IIFF AA PPAYORAYOR HASHAS TOOTOO MMANYANY VVISITSISITS PERPER UUSERSER
Conduct an ICD-9 evaluation by payor to see if there are health trends and create targeted programs to address health trends and create targeted programs to address issues
Work with the particular payor to enhance revenue per visit
Screen the uninsured at every visit to determine if they qualify for an insurance program
© Guidian Healthcare Consulting 2009
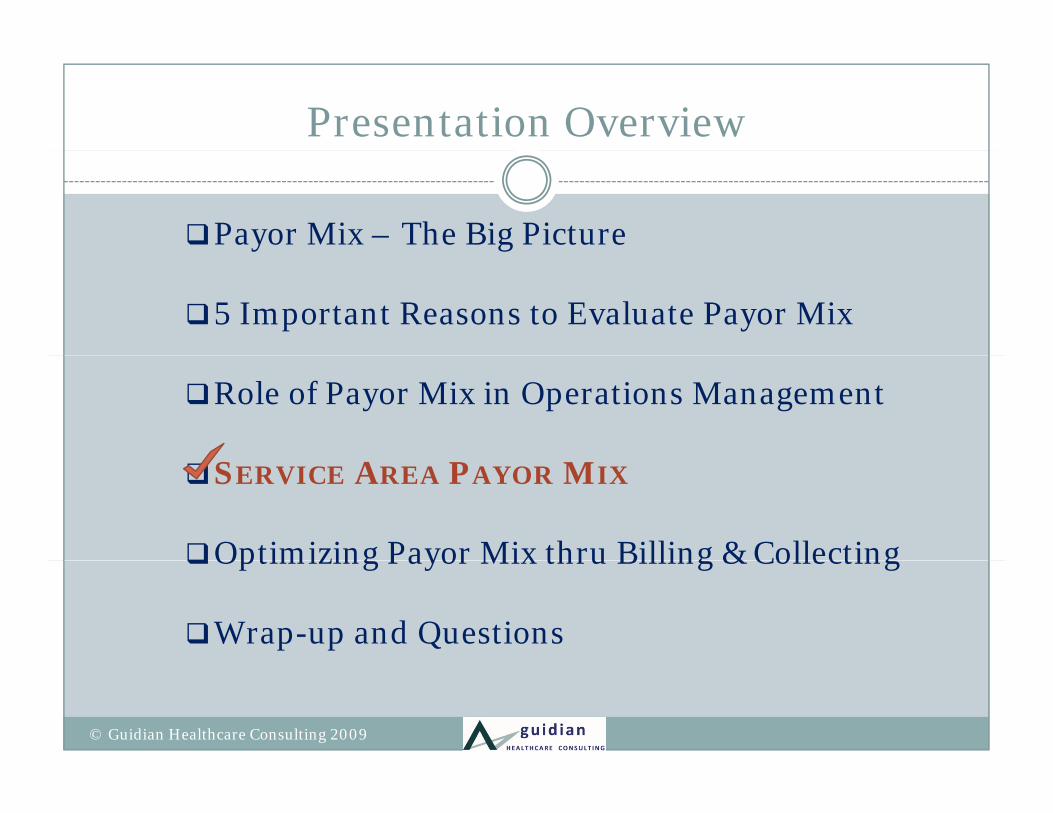
Presentation Overview
Payor Mix – The Big Picture
5 Important Reasons to Evaluate Payor Mix
Role of Payor Mix in Operations Management
SERVICE AREA PAYOR MIX
Optimizing Payor Mix thru Billing & CollectingOptimizing Payor Mix thru Billing & Collecting
Wrap-up and Questions
© Guidian Healthcare Consulting 2009
Service Area Payor Mix
……ISIS THETHE POPULATIONPOPULATION ININ YOURYOUR SERVICESERVICE AREAAREASEGMENTEDSEGMENTED BYBY PAYORPAYOR TYPETYPE
Managing payor mix means, in part, measuring progress towards the organization’s goal for payor mix and revenue.
Service area payor mix provides an objective benchmark by which these strategic goals may be defined.g g y
MMEASUREEASURE WHATWHAT YOUYOU WANTWANT TOTO MANAGEMANAGE
© Guidian Healthcare Consulting 2009
Service Area Payor MixCase Study y
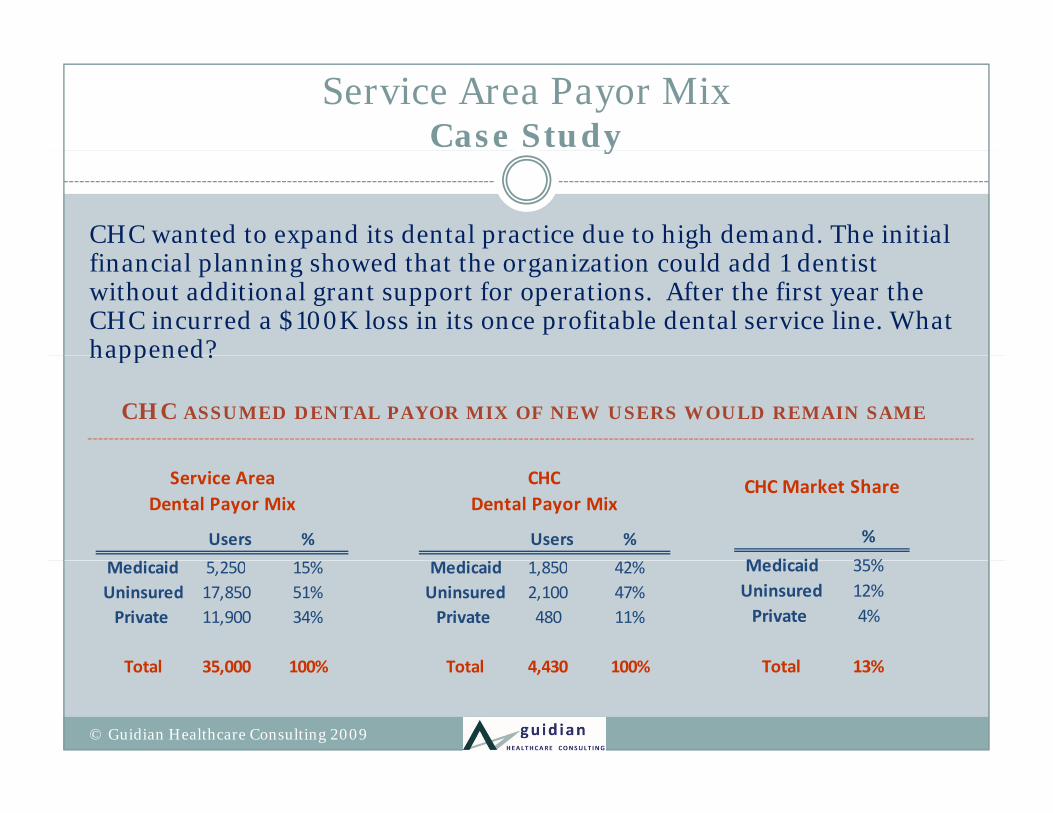
CHC wanted to expand its dental practice due to high demand. The initial fi i l l i h d h h i i ld dd d i financial planning showed that the organization could add 1 dentist without additional grant support for operations. After the first year the CHC incurred a $100K loss in its once profitable dental service line. What happened?happened?
CHC ASSUMED DENTAL PAYOR MIX OF NEW USERS WOULD REMAIN SAME
Users %
Service Area Dental Payor Mix
%
M di id 35%
CHC Market Share
Users %
CHC Dental Payor Mix
Medicaid 5,250 15%Uninsured 17,850 51%Private 11,900 34%
T t l 35 000 100%
Medicaid 35%Uninsured 12%Private 4%
T t l 13%
Medicaid 1,850 42%Uninsured 2,100 47%Private 480 11%
T t l 4 430 100%Total 35,000 100% Total 13%Total 4,430 100%
© Guidian Healthcare Consulting 2009

Service Area Payor MixCase Study y
CHC went from generating a small gain in dental to a $100K loss.Payor mix analysis would have shown that CHC needed grant support to expand dental.
NEW USERS 70% UNINSURED AND 20% MEDICAID
Users %
CHC Dental Payor Mix
Users %
CHC New Dental Payor Mix
Medicaid 1,850 42%Uninsured 2,100 47%Private 480 11%
T t l 4 430 100%
Medicaid 2,060 38%Uninsured 2,835 52%Private 585 11%
T t l 5 480 100%Total 4,430 100% Total 5,480 100%
© Guidian Healthcare Consulting 2009
Service Area Payor Mix
MMONITORINGONITORING SSERVICEERVICE AAREAREA PAYORPAYOR MIXMIX HELPSHELPSIDENTIFYIDENTIFY OPPORTUNITIESOPPORTUNITIES TOTO INCREASEINCREASE REVENUEREVENUE
By assessing the service area payor mix for each service line By assessing the service area payor mix for each service line, and comparing it to the CHC’s payor mix by service line, the organization can identify opportunities for increasing accessaccessand for improving revenuerevenue. Capturing more Medicaid users can create additional capacity to treat
new uninsured usersnew uninsured users.
Identify opportunities to cross refer between service lines.
© Guidian Healthcare Consulting 2009© Guidian Healthcare Consulting 2009
Service Area Payor MixCase Study y
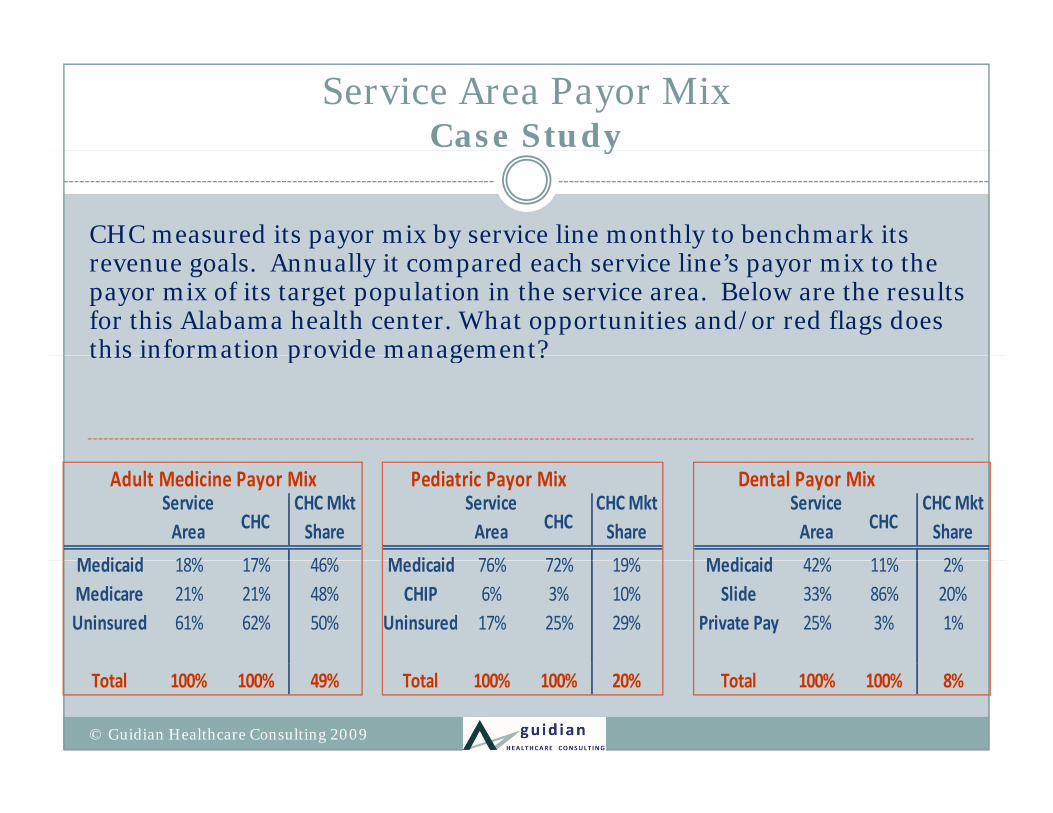
CHC measured its payor mix by service line monthly to benchmark its l A ll i d h i li ’ i h revenue goals. Annually it compared each service line’s payor mix to the
payor mix of its target population in the service area. Below are the results for this Alabama health center. What opportunities and/or red flags does this information provide management? this information provide management?
Service Area CHC
CHC Mkt Share
M di id 18% 17% 46%
Adult Medicine Payor MixService Area CHC
CHC Mkt Share
M di id 76% 72% 19%
Pediatric Payor MixService Area CHC
CHC Mkt Share
M di id 42% 11% 2%
Dental Payor Mix
Medicaid 18% 17% 46%Medicare 21% 21% 48%Uninsured 61% 62% 50%
Medicaid 76% 72% 19%CHIP 6% 3% 10%
Uninsured 17% 25% 29%
Medicaid 42% 11% 2%Slide 33% 86% 20%
Private Pay 25% 3% 1%
Total 100% 100% 49% Total 100% 100% 20% Total 100% 100% 8%
© Guidian Healthcare Consulting 2009
Service Area Payor Mix
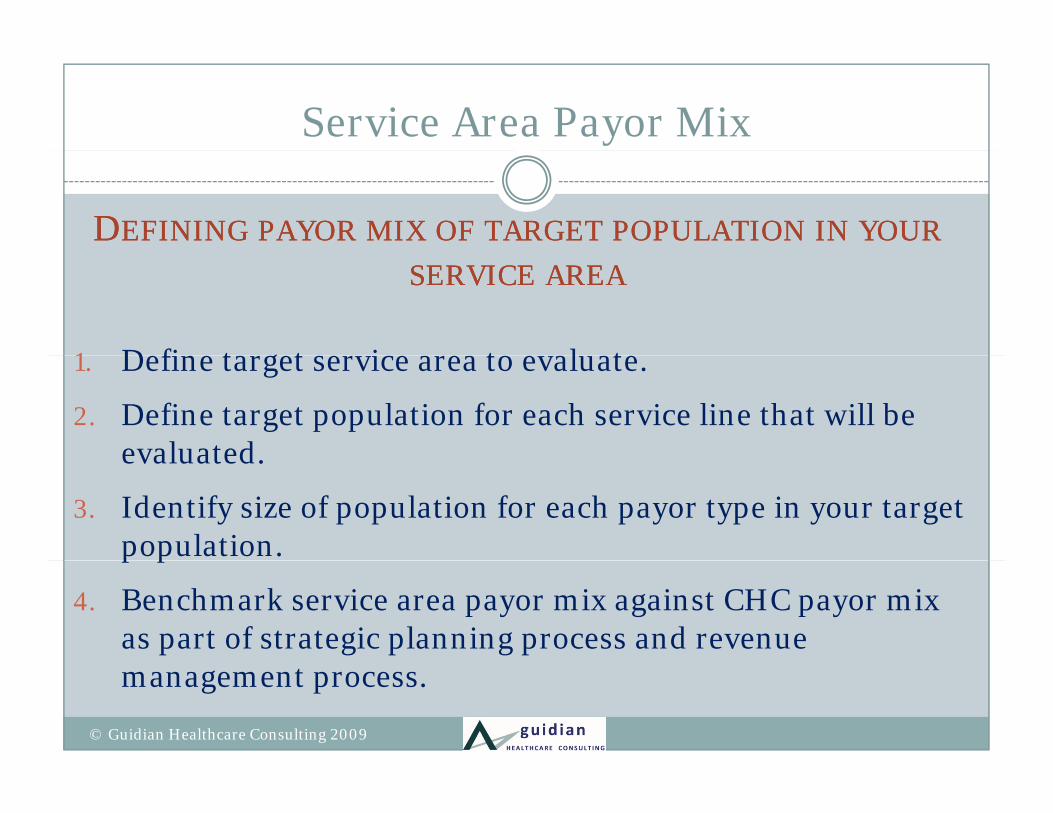
DDEFININGEFINING PAYORPAYOR MIXMIX OFOF TARGETTARGET POPULATIONPOPULATION ININ YOURYOURSERVICESERVICE AREAAREA
Define target service area to evaluate1. Define target service area to evaluate.
2. Define target population for each service line that will be evaluatedevaluated.
3. Identify size of population for each payor type in your target population.p p
4. Benchmark service area payor mix against CHC payor mix as part of strategic planning process and revenue management process.
© Guidian Healthcare Consulting 2009
Service Area Payor MixCalculating It
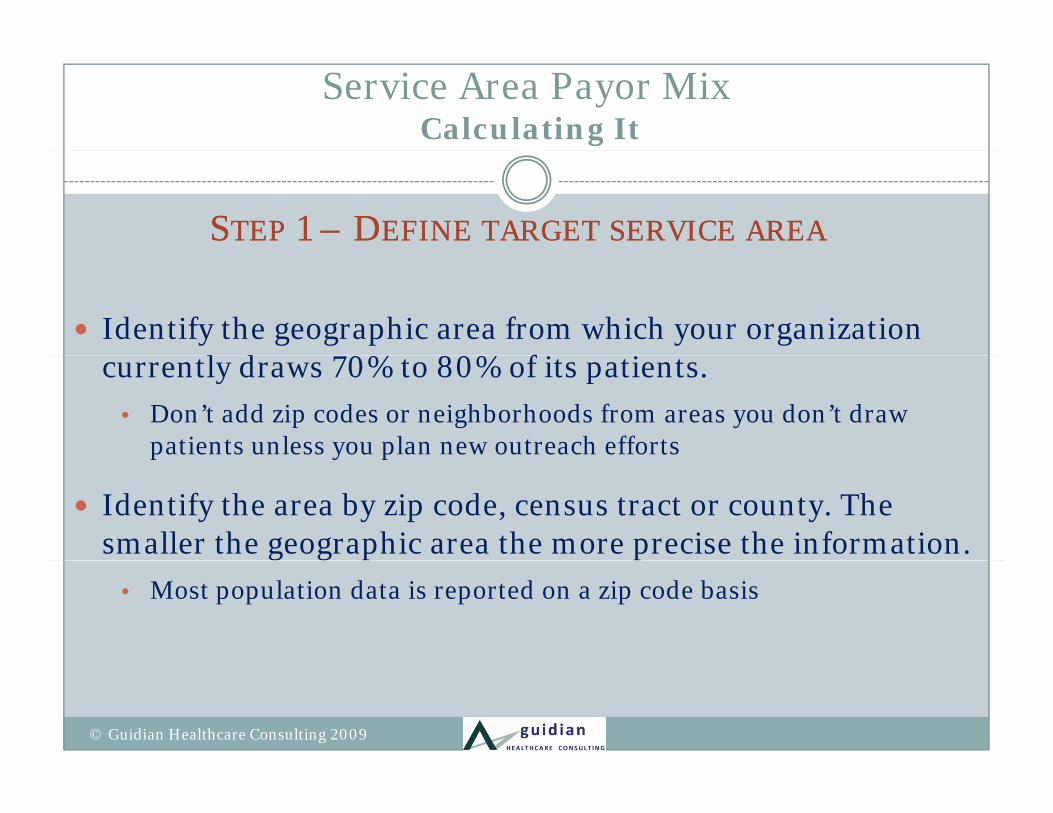
SSTEPTEP 1 1 –– DDEFINEEFINE TARGETTARGET SERVICESERVICE AREAAREA
Identify the geographic area from which your organization l d % 8 % f i icurrently draws 70% to 80% of its patients.
• Don’t add zip codes or neighborhoods from areas you don’t draw patients unless you plan new outreach effortsp y p
Identify the area by zip code, census tract or county. The smaller the geographic area the more precise the information.
• Most population data is reported on a zip code basis
© Guidian Healthcare Consulting 2009
Service Area Payor MixCalculating It
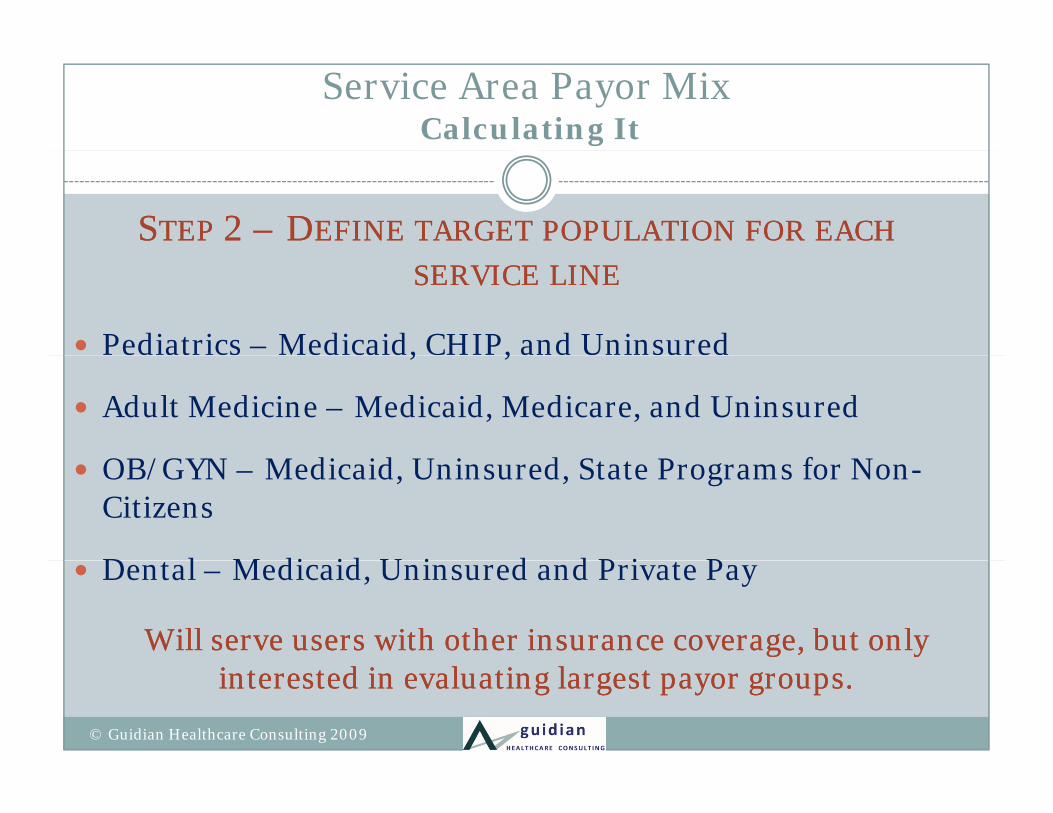
SSTEPTEP 2 2 –– DDEFINEEFINE TARGETTARGET POPULATIONPOPULATION FORFOR EACHEACHSERVICESERVICE LINELINE
Pediatrics – Medicaid, CHIP, and Uninsured, ,
Adult Medicine – Medicaid, Medicare, and Uninsured
OB/GYN M di id U i d S P f N OB/GYN – Medicaid, Uninsured, State Programs for Non-Citizens
D t l M di id U i d d P i t P Dental – Medicaid, Uninsured and Private Pay
Will serve users with other insurance coverage, but only Will serve users with other insurance coverage, but only interested in evaluating largest payor groups.interested in evaluating largest payor groups.
© Guidian Healthcare Consulting 2009
Service Area Payor MixCalculating It
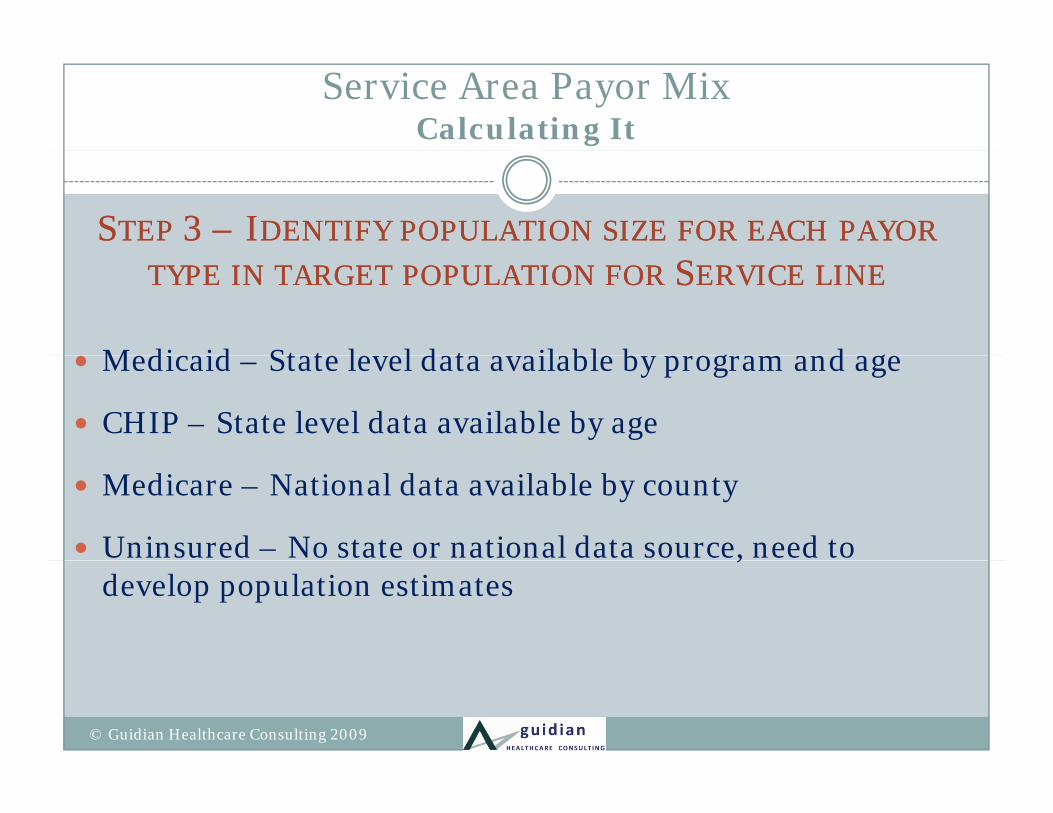
SSTEPTEP 3 3 –– IIDENTIFYDENTIFY POPULATIONPOPULATION SIZESIZE FORFOR EACHEACH PAYORPAYORTYPETYPE ININ TARGETTARGET POPULATIONPOPULATION FORFOR SSERVICEERVICE LINELINE
Medicaid State level data available by program and age Medicaid – State level data available by program and age
CHIP – State level data available by age
Medicare – National data available by county
Uninsured – No state or national data source, need to ,develop population estimates
© Guidian Healthcare Consulting 2009
Service Area Payor MixPayor Population Data
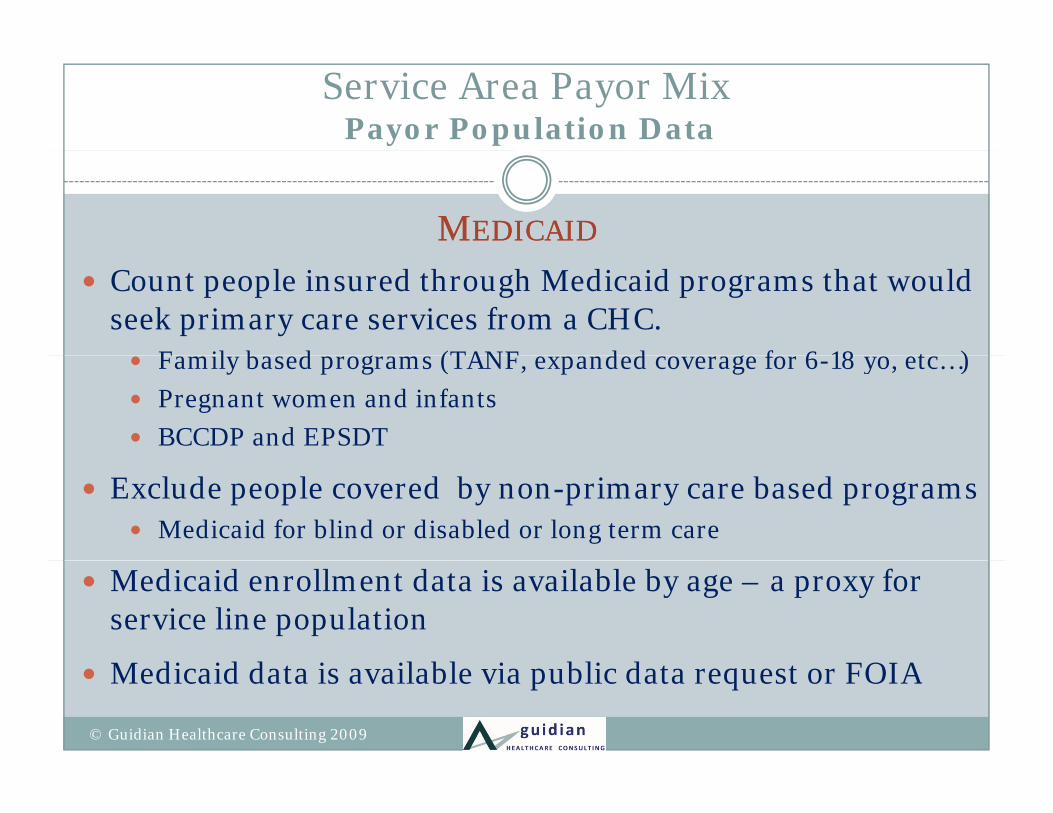
MMEDICAIDEDICAID
Count people insured through Medicaid programs that would seek primary care services from a CHC.
F il b d (TANF d d f 6 18 t ) Family based programs (TANF, expanded coverage for 6-18 yo, etc…) Pregnant women and infants BCCDP and EPSDT
Exclude people covered by non-primary care based programs Medicaid for blind or disabled or long term care
Medicaid enrollment data is available by age – a proxy for service line population
M di id d i il bl i bli d FOIA Medicaid data is available via public data request or FOIA
© Guidian Healthcare Consulting 2009
Service Area Payor MixPayor Population Data
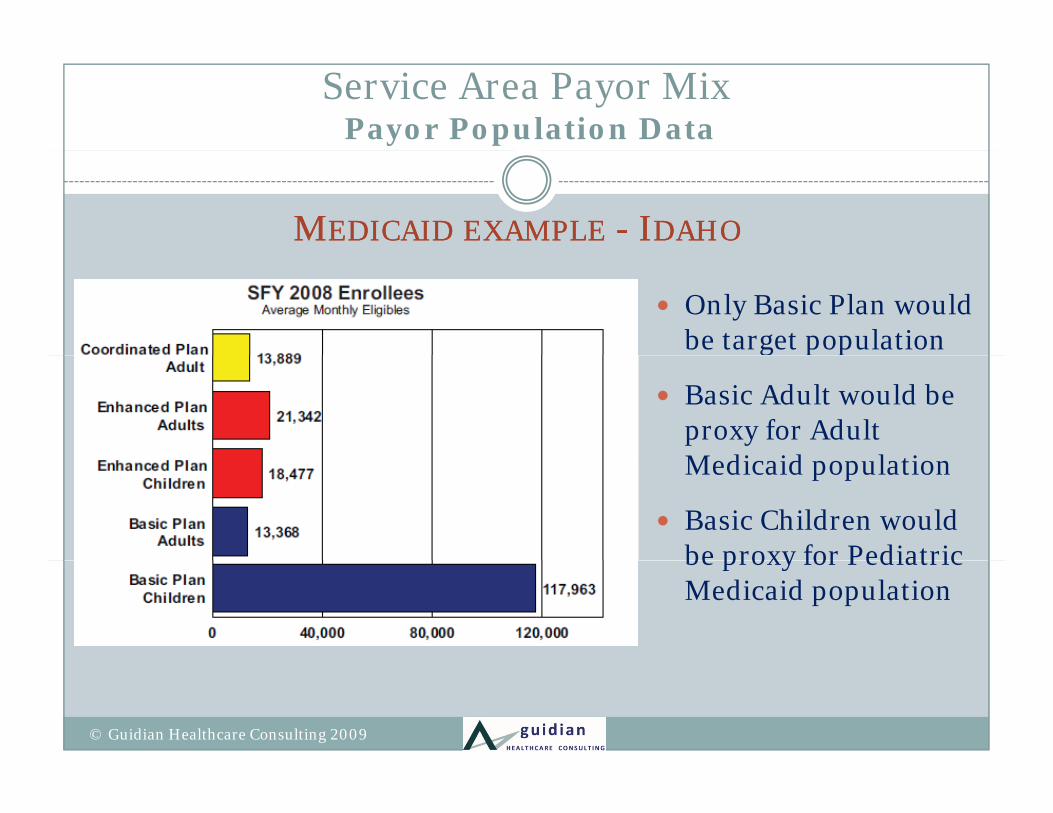
MMEDICAIDEDICAID EXAMPLEEXAMPLE -- IIDAHODAHO
Only Basic Plan would be target populationg p p
Basic Adult would be proxy for Adult M di id l tiMedicaid population
Basic Children would be proxy for Pediatric be proxy for Pediatric Medicaid population
© Guidian Healthcare Consulting 2009
Service Area Payor MixPayor Population Data
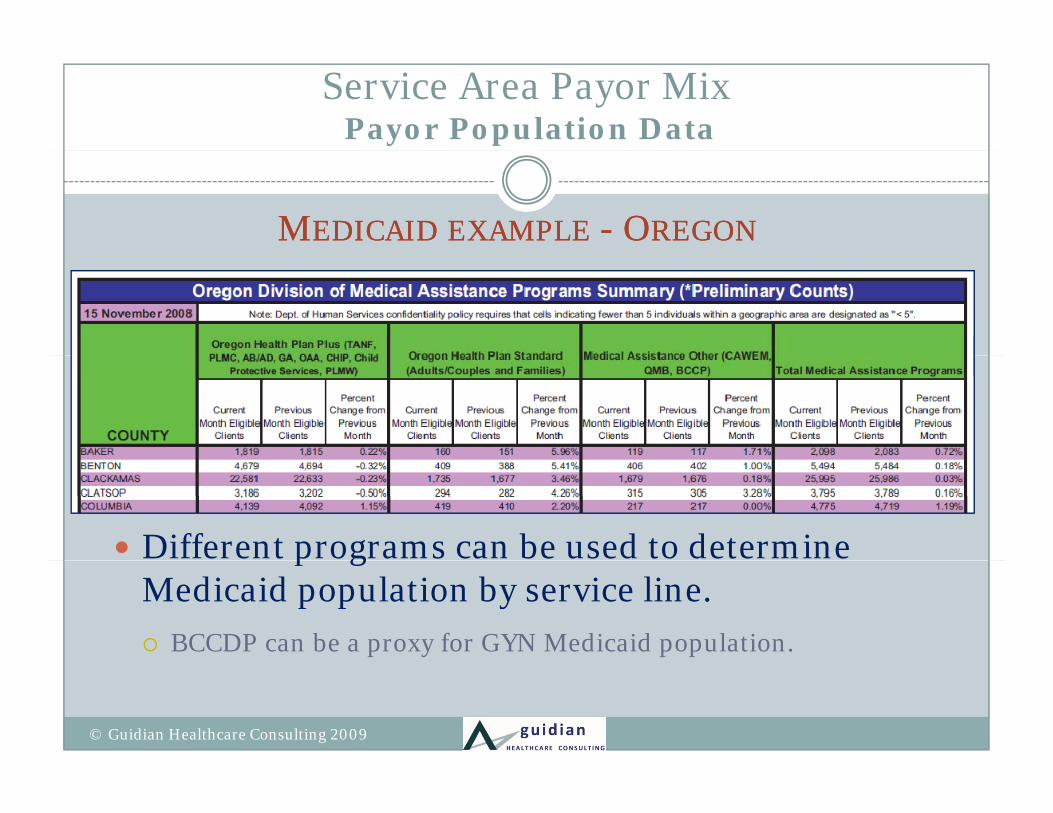
MMEDICAIDEDICAID EXAMPLEEXAMPLE -- OOREGONREGON
Different programs can be used to determine p gMedicaid population by service line. BCCDP can be a proxy for GYN Medicaid population.
© Guidian Healthcare Consulting 2009
Service Area Payor MixPayor Population Data
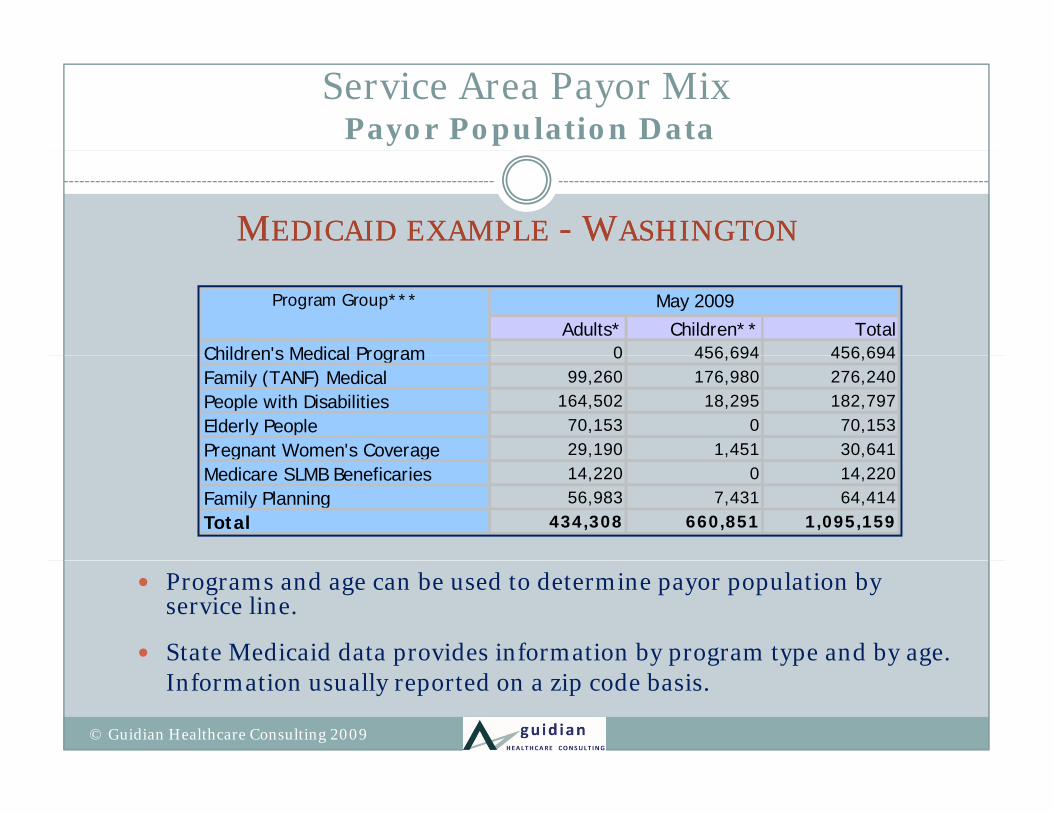
MMEDICAIDEDICAID EXAMPLEEXAMPLE -- WWASHINGTONASHINGTON
Total456 694Children's Medical Program 0 456 694
Adults* Children**
Program Group*** May 2009
456,694276,240182,79770,15330,641Pregnant Women's Coverage 29,190 1,451
Elderly People 70,153 0People with Disabilities 164,502 18,295Family (TANF) Medical 99,260 176,980Children s Medical Program 0 456,694
,14,22064,414
1,095,159Total 434,308 660,851Family Planning 56,983 7,431Medicare SLMB Beneficaries 14,220 0
g g , ,
Programs and age can be used to determine payor population by service line.
State Medicaid data provides information by program type and by age. p y p g yp y gInformation usually reported on a zip code basis.
© Guidian Healthcare Consulting 2009

Service Area Payor MixPayor Population Data
MMEDICAIDEDICAID
ALASKA• http://www.hss.state.ak.us/dpa/programs/medicaid/• http://hss state ak us/dhcs/DenaliKidCare/default htm• http://hss.state.ak.us/dhcs/DenaliKidCare/default.htm
IDAHO (public records request)• http://healthandwelfare.idaho.gov/AboutUs/PublicRecordsRequest/tabid/1p // g / b / b q / b /
32/Default.aspx
OREGON• http://www.oregon.gov/DHS/healthplan/data_pubs/main.shtml
WASHINGTONh //h d h / / ll i h• http://hrsa.dshs.wa.gov/News/EnrollmentFigures.htm
© Guidian Healthcare Consulting 2009
Service Area Payor MixPayor Population Data
UUNINSUREDNINSURED
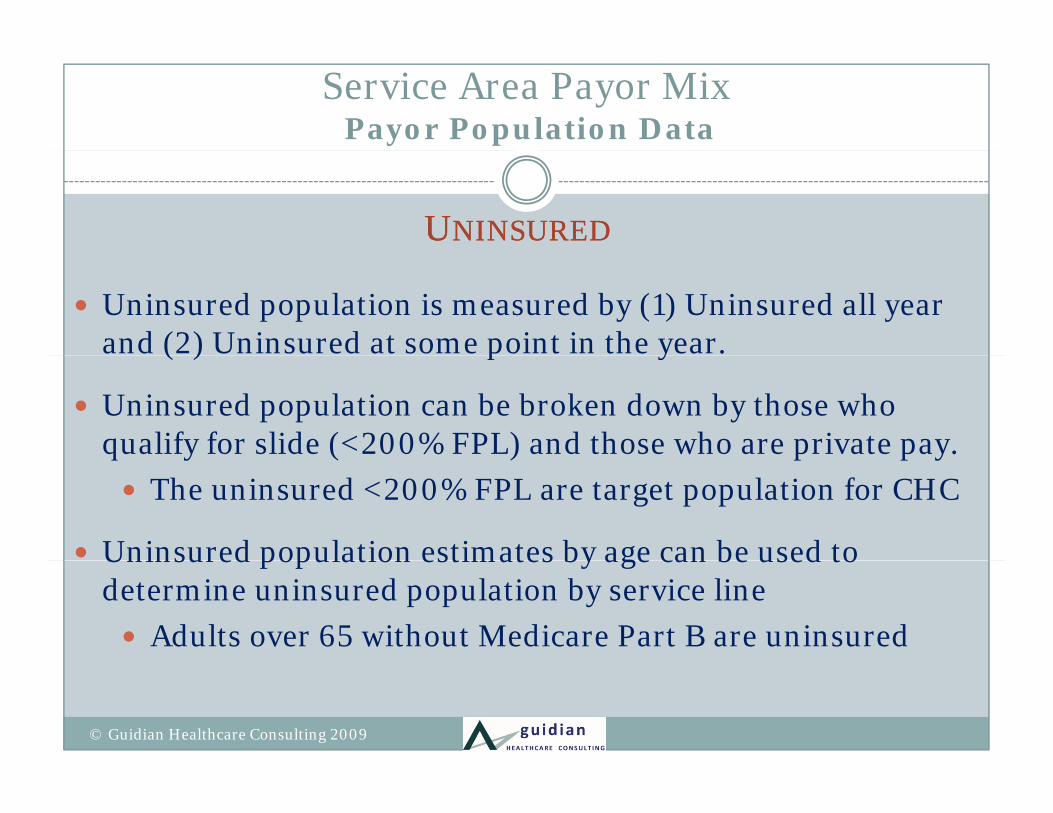
Uninsured population is measured by (1) Uninsured all year and (2) Uninsured at some point in the year.( ) p y
Uninsured population can be broken down by those who qualify for slide (<200% FPL) and those who are private pay.q y ( ) p p y The uninsured <200% FPL are target population for CHC
Uninsured population estimates by age can be used to Uninsured population estimates by age can be used to determine uninsured population by service line Adults over 65 without Medicare Part B are uninsured
© Guidian Healthcare Consulting 2009
Service Area Payor Mix
UUNINSUREDNINSURED
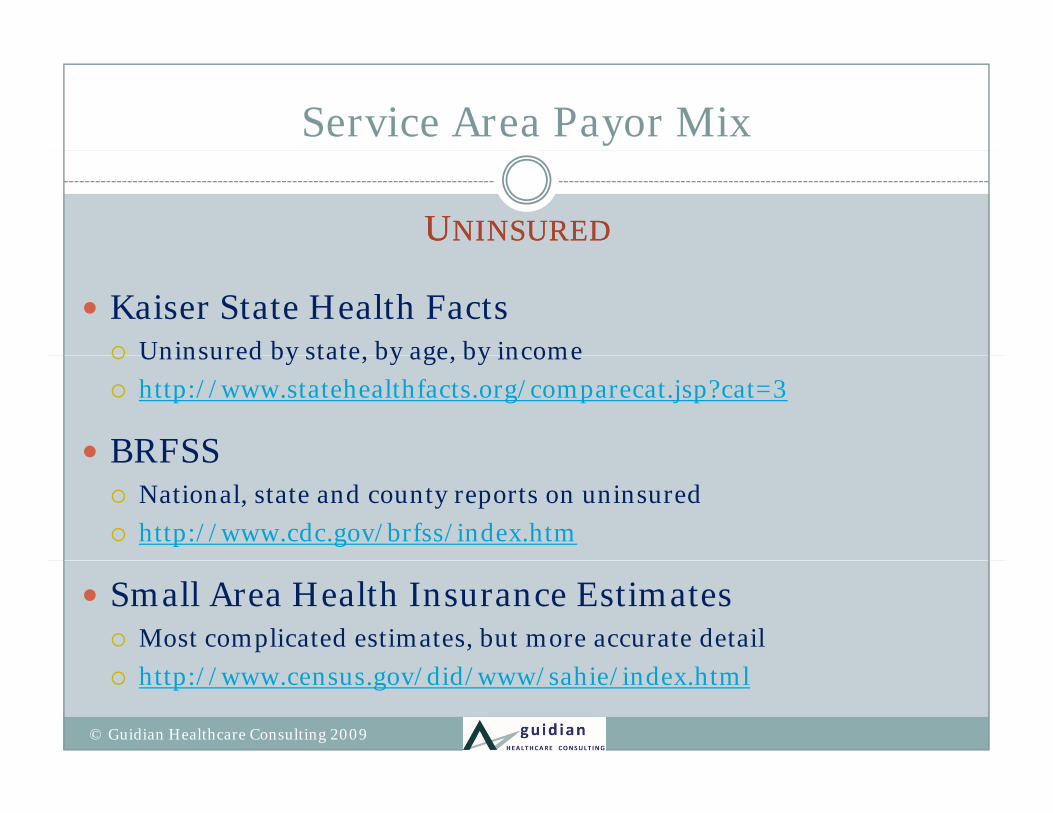
Kaiser State Health Facts Uninsured by state by age by income Uninsured by state, by age, by income http://www.statehealthfacts.org/comparecat.jsp?cat=3
BRFSSBRFSS National, state and county reports on uninsured http://www.cdc.gov/brfss/index.htm
Small Area Health Insurance Estimates Most complicated estimates, but more accurate detail http://www.census.gov/did/www/sahie/index.html
© Guidian Healthcare Consulting 2009
Service Area Payor Mix
MMEDICAREEDICARE
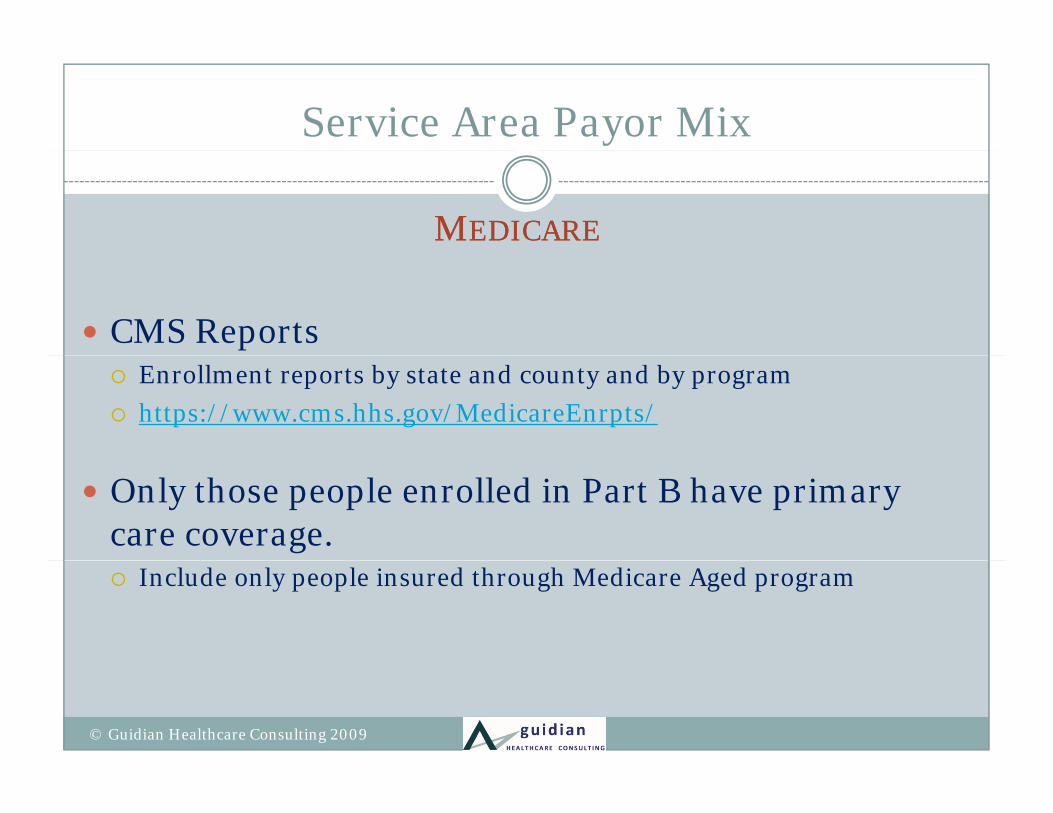
CMS Reports Enrollment reports by state and county and by program https://www.cms.hhs.gov/MedicareEnrpts/
Only those people enrolled in Part B have primary care coverage. Include only people insured through Medicare Aged program
© Guidian Healthcare Consulting 2009
Service Area Payor MixCalculating It
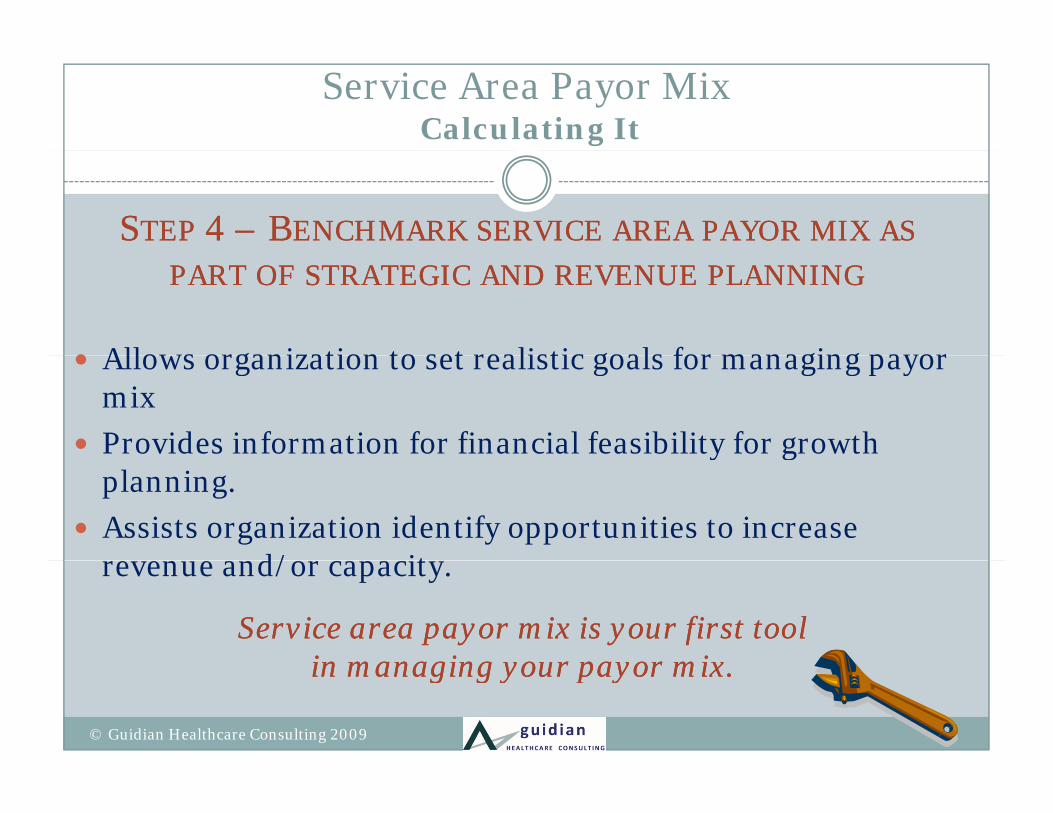
SSTEPTEP 4 4 –– BBENCHMARKENCHMARK SERVICESERVICE AREAAREA PAYORPAYOR MIXMIX ASASPARTPART OFOF STRATEGICSTRATEGIC ANDAND REVENUEREVENUE PLANNINGPLANNING
Allows organization to set realistic goals for managing payor Allows organization to set realistic goals for managing payor mix
Provides information for financial feasibility for growth y gplanning.
Assists organization identify opportunities to increase re enue and/or capacitrevenue and/or capacity.
Service area payor mix is your first tool Service area payor mix is your first tool in managing your payor mixin managing your payor mixin managing your payor mix.in managing your payor mix.
© Guidian Healthcare Consulting 2009
Presentation Overview
Payor Mix – The Big Picturey g
5 Important Reasons to Evaluate Payor Mix
The Role of Payor Mix in Operations Management
Service Area Payor Mix
OPTIMIZING PAYOR MIX THRU BILLING & COLLECTING
W d Q tiWrap-up and Questions
© Guidian Healthcare Consulting 2009
Optimizing Payor Mix
OOPTIMIZINGPTIMIZING PPAYORAYOR MMIXIX ATAT THETHE FFRONTRONT DDESKESK
First point of contact in Billing & Collections cycle is at the Front Desk
Educate front desk staff Understand whole revenue cycle Understand their role’s impact on the financial performance of
the organization
Ch k I i t i Check-In impact on payor mix Know appropriate co-pay and sliding fee & collecting fees Flagging and collecting outstanding balances (refer to collections)
V if i d d hi t i l l i Verify insurance coverage and demographics to insure a clean claim Direct uninsured users to financial counselor
© Guidian Healthcare Consulting 2009

Optimizing Payor Mix
OOPTIMIZINGPTIMIZING PPAYORAYOR MMIXIX ATAT THETHE FFRONTRONT DDESKESK
Check-Out impact on payor mix Talk to user about scheduling other services such as preventative
medical dental or GYN appointmentsmedical, dental or GYN appointments Know services covered by user’s insurance (imp for clinical staff as well) Flagging and collecting outstanding balances (refer to collections)
Financial counselor impact on payor mix Enroll uninsured users in Medicaid or other public programs Discuss and manage payment plans
Monitor processes and report data monthly to Front Desk so they can see the impact their efforts have on payor mix and financial performanceperformance.
© Guidian Healthcare Consulting 2009

Optimizing Payor Mix
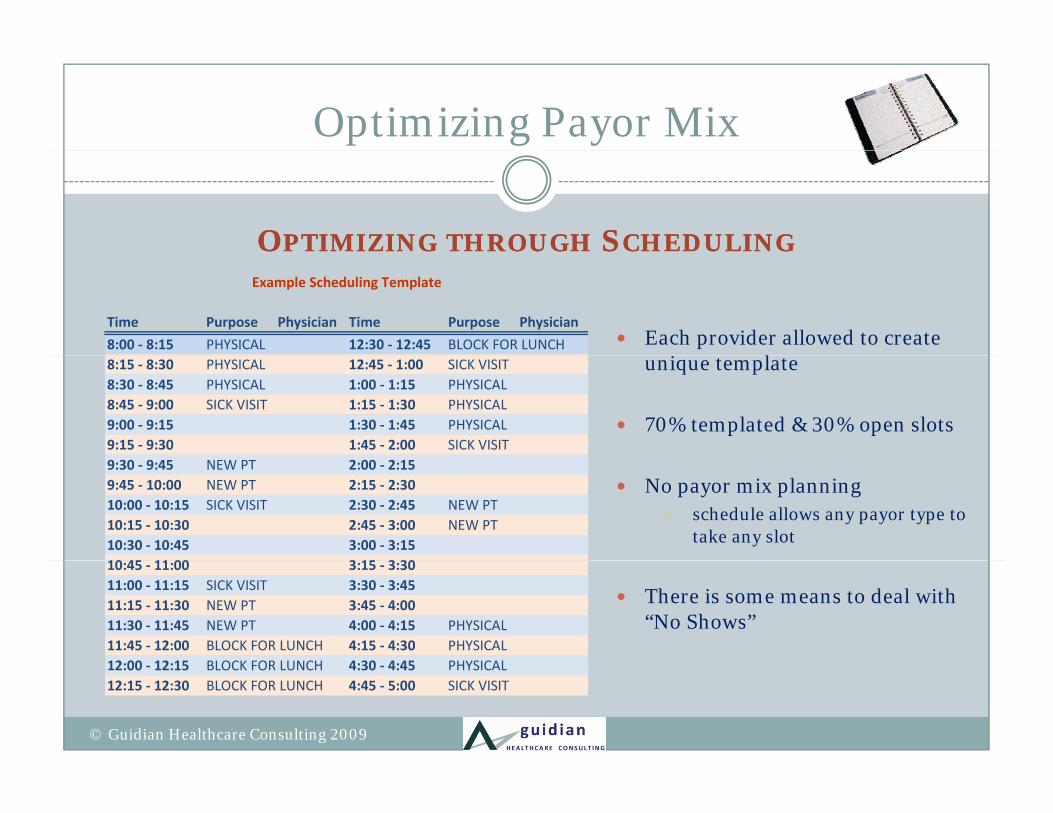
OOPTIMIZINGPTIMIZING THROUGHTHROUGH SSCHEDULINGCHEDULING
© Guidian Healthcare Consulting 2009
Optimizing Payor Mix
OOPTIMIZINGPTIMIZING THROUGHTHROUGH SSCHEDULINGCHEDULING
Time Purpose Physician Time Purpose Physician
8:00 ‐ 8:15 PHYSICAL 12:30 ‐ 12:45 BLOCK FOR LUNCH
Example Scheduling Template
Each provider allowed to create i l8:15 ‐ 8:30 PHYSICAL 12:45 ‐ 1:00 SICK VISIT
8:30 ‐ 8:45 PHYSICAL 1:00 ‐ 1:15 PHYSICAL8:45 ‐ 9:00 SICK VISIT 1:15 ‐ 1:30 PHYSICAL9:00 ‐ 9:15 1:30 ‐ 1:45 PHYSICAL9:15 ‐ 9:30 1:45 ‐ 2:00 SICK VISIT
unique template
70% templated & 30% open slots
9:30 ‐ 9:45 NEW PT 2:00 ‐ 2:159:45 ‐ 10:00 NEW PT 2:15 ‐ 2:3010:00 ‐ 10:15 SICK VISIT 2:30 ‐ 2:45 NEW PT10:15 ‐ 10:30 2:45 ‐ 3:00 NEW PT10:30 ‐ 10:45 3:00 ‐ 3:1510 45 11 00 3 15 3 30
No payor mix planningo schedule allows any payor type to
take any slot10:45 ‐ 11:00 3:15 ‐ 3:3011:00 ‐ 11:15 SICK VISIT 3:30 ‐ 3:4511:15 ‐ 11:30 NEW PT 3:45 ‐ 4:0011:30 ‐ 11:45 NEW PT 4:00 ‐ 4:15 PHYSICAL11:45 ‐ 12:00 BLOCK FOR LUNCH 4:15 ‐ 4:30 PHYSICAL12 00 12 15 BLOCK FOR LUNCH 4 30 4 45 PHYSICAL
There is some means to deal with “No Shows”
12:00 ‐ 12:15 BLOCK FOR LUNCH 4:30 ‐ 4:45 PHYSICAL12:15 ‐ 12:30 BLOCK FOR LUNCH 4:45 ‐ 5:00 SICK VISIT
© Guidian Healthcare Consulting 2009
Optimizing Payor Mix
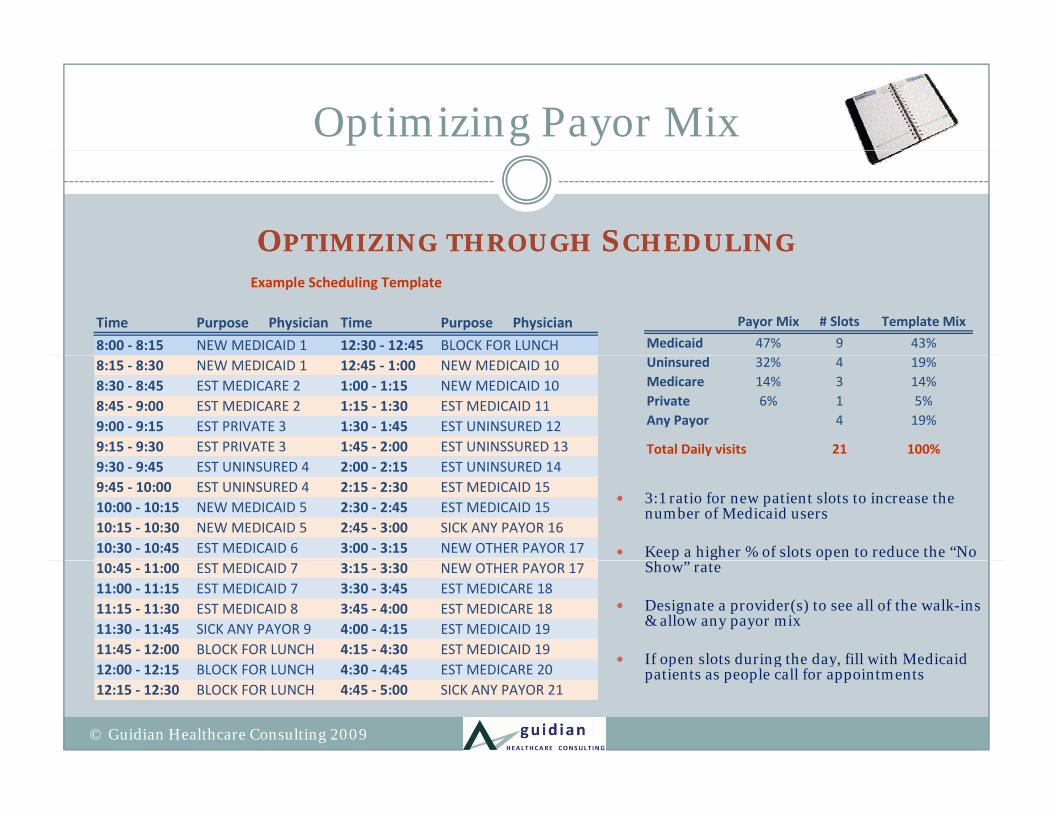
OOPTIMIZINGPTIMIZING THROUGHTHROUGH SSCHEDULINGCHEDULING
Time Purpose Physician Time Purpose Physician
8:00 ‐ 8:15 NEW MEDICAID 1 12:30 ‐ 12:45 BLOCK FOR LUNCH
Example Scheduling Template
Payor Mix # Slots Template Mix
Medicaid 47% 9 43%
8:15 ‐ 8:30 NEW MEDICAID 1 12:45 ‐ 1:00 NEW MEDICAID 108:30 ‐ 8:45 EST MEDICARE 2 1:00 ‐ 1:15 NEW MEDICAID 108:45 ‐ 9:00 EST MEDICARE 2 1:15 ‐ 1:30 EST MEDICAID 119:00 ‐ 9:15 EST PRIVATE 3 1:30 ‐ 1:45 EST UNINSURED 129:15 ‐ 9:30 EST PRIVATE 3 1:45 ‐ 2:00 EST UNINSSURED 13
Uninsured 32% 4 19%Medicare 14% 3 14%Private 6% 1 5%Any Payor 4 19%
Total Daily visits 21 100%
3:1 ratio for new patient slots to increase the number of Medicaid users
Keep a higher % of slots open to reduce the “No h ”
9:30 ‐ 9:45 EST UNINSURED 4 2:00 ‐ 2:15 EST UNINSURED 149:45 ‐ 10:00 EST UNINSURED 4 2:15 ‐ 2:30 EST MEDICAID 1510:00 ‐ 10:15 NEW MEDICAID 5 2:30 ‐ 2:45 EST MEDICAID 1510:15 ‐ 10:30 NEW MEDICAID 5 2:45 ‐ 3:00 SICK ANY PAYOR 1610:30 ‐ 10:45 EST MEDICAID 6 3:00 ‐ 3:15 NEW OTHER PAYOR 17
Show” rate
Designate a provider(s) to see all of the walk-ins & allow any payor mix
If open slots during the day, fill with Medicaid
10:45 ‐ 11:00 EST MEDICAID 7 3:15 ‐ 3:30 NEW OTHER PAYOR 1711:00 ‐ 11:15 EST MEDICAID 7 3:30 ‐ 3:45 EST MEDICARE 1811:15 ‐ 11:30 EST MEDICAID 8 3:45 ‐ 4:00 EST MEDICARE 1811:30 ‐ 11:45 SICK ANY PAYOR 9 4:00 ‐ 4:15 EST MEDICAID 1911:45 ‐ 12:00 BLOCK FOR LUNCH 4:15 ‐ 4:30 EST MEDICAID 19 If open slots during the day, fill with Medicaid
patients as people call for appointments12:00 ‐ 12:15 BLOCK FOR LUNCH 4:30 ‐ 4:45 EST MEDICARE 2012:15 ‐ 12:30 BLOCK FOR LUNCH 4:45 ‐ 5:00 SICK ANY PAYOR 21
© Guidian Healthcare Consulting 2009
How Billing & Collecting Effects Payor Mix
Even though your practice may have a Even though your practice may have a desirable payor mix from a user or visit standpoint, it is important to look at the p , pentire financial picture….
Comparing Payor Mix by Gross Charges to payor mix by NPSR can highlight red flags in billi d ll tibilling and collections.
© Guidian Healthcare Consulting 2009
Optimizing Payor Mix
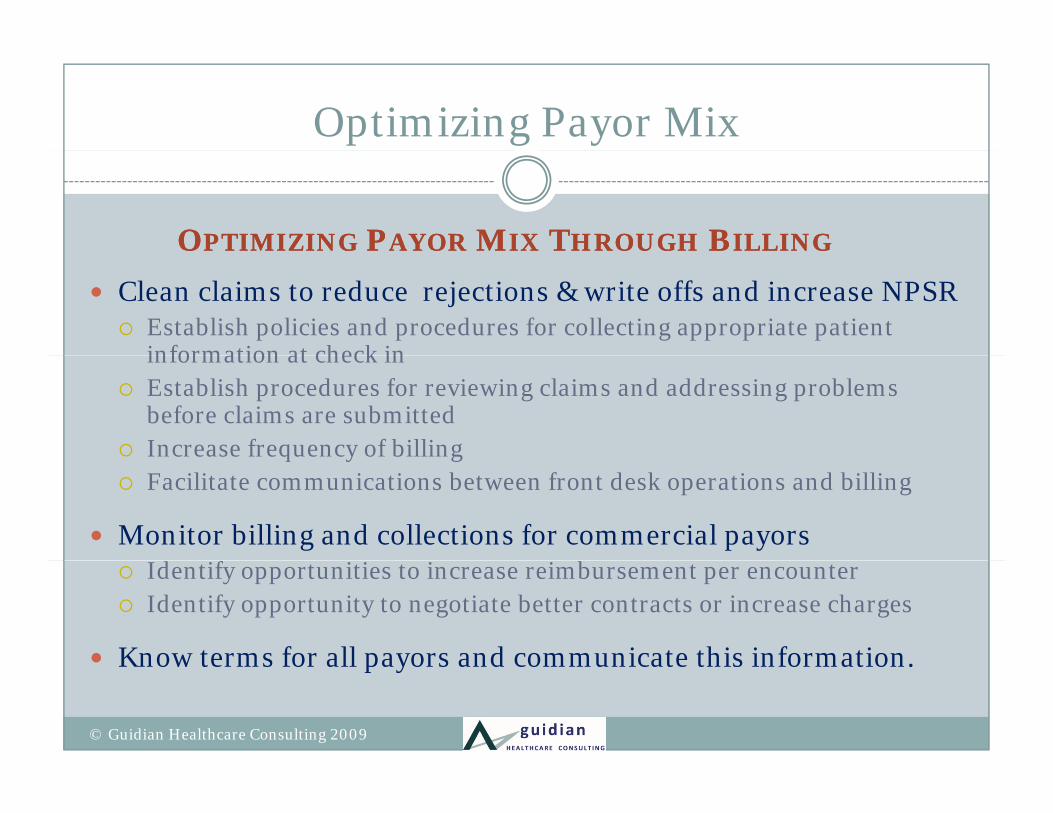
OOPTIMIZINGPTIMIZING PPAYORAYOR MMIXIX TTHROUGHHROUGH BBILLINGILLING
Clean claims to reduce rejections & write offs and increase NPSR Establish policies and procedures for collecting appropriate patient
information at check ininformation at check in Establish procedures for reviewing claims and addressing problems
before claims are submitted Increase frequency of billingq y g Facilitate communications between front desk operations and billing
Monitor billing and collections for commercial payorsd if i i i i b Identify opportunities to increase reimbursement per encounter
Identify opportunity to negotiate better contracts or increase charges
Know terms for all payors and communicate this information.Know terms for all payors and communicate this information.
© Guidian Healthcare Consulting 2009
Optimizing Payor Mix
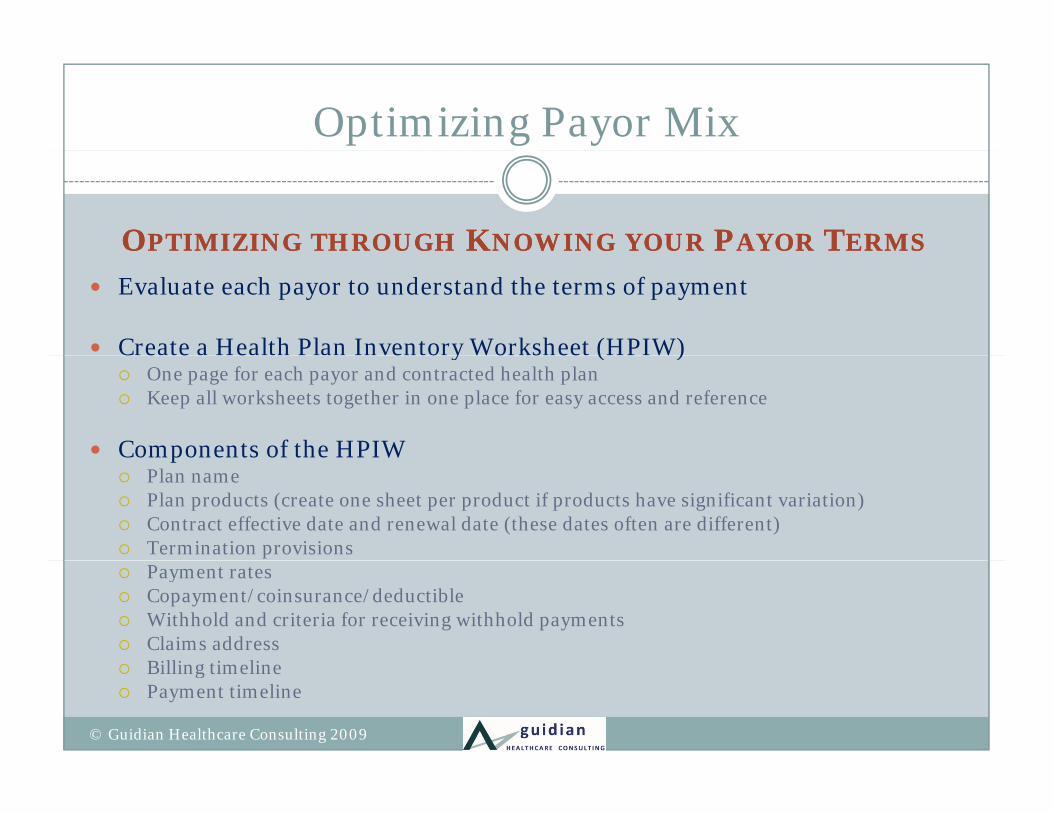
OOPTIMIZINGPTIMIZING THROUGHTHROUGH KKNOWINGNOWING YOURYOUR PPAYORAYOR TTERMSERMS
Evaluate each payor to understand the terms of payment
Create a Health Plan Inventory Worksheet (HPIW)C e e e e o y o s ee ( ) One page for each payor and contracted health plan Keep all worksheets together in one place for easy access and reference
Components of the HPIWp Plan name Plan products (create one sheet per product if products have significant variation) Contract effective date and renewal date (these dates often are different) Termination provisions Payment rates Copayment/coinsurance/deductible Withhold and criteria for receiving withhold payments Claims address
Billi ti li Billing timeline Payment timeline
© Guidian Healthcare Consulting 2009
Optimizing Payor Mix
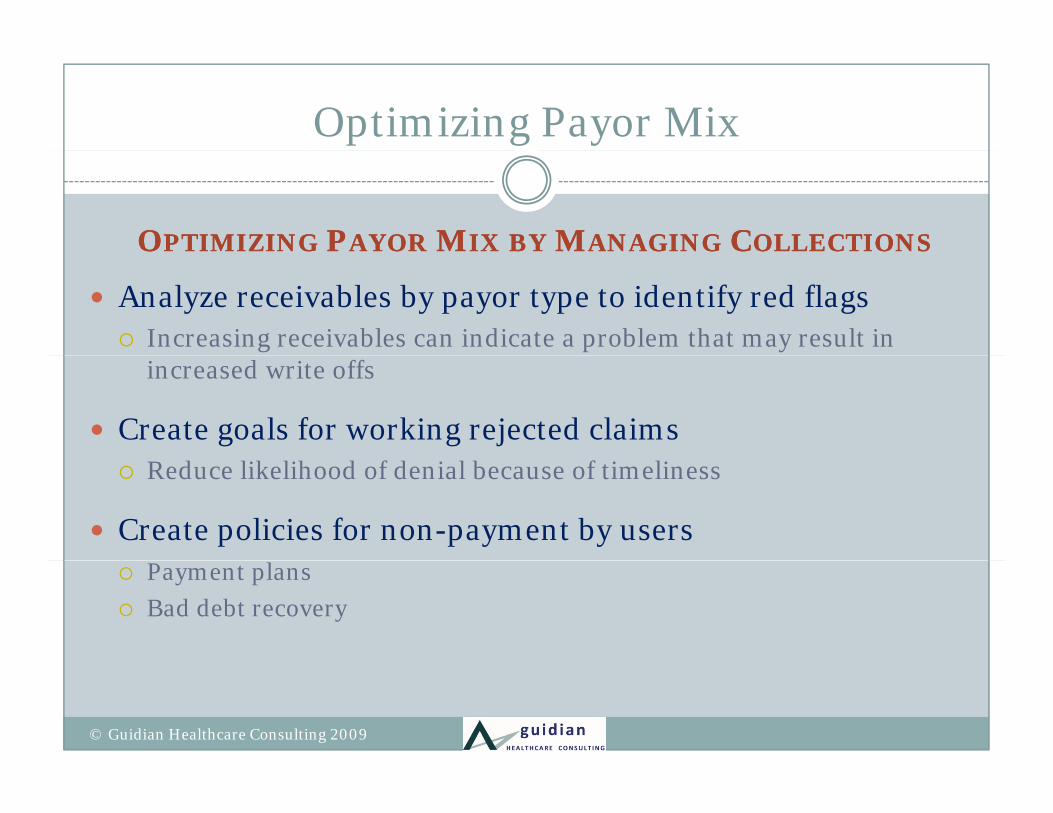
OOPTIMIZINGPTIMIZING PPAYORAYOR MMIXIX BYBY MMANAGINGANAGING CCOLLECTIONSOLLECTIONS
Analyze receivables by payor type to identify red flags Increasing receivables can indicate a problem that may result in
increased write offs
Create goals for working rejected claims Reduce likelihood of denial because of timeliness
Create policies for non-payment by users Payment plans Bad debt recovery
© Guidian Healthcare Consulting 2009

Optimizing Payor Mix
Plan
DoAct
Payor Mix is managed by
Managing your operations, DoAct
Measuring your performance,
Benchmarking your goals.
Studyy
© Guidian Healthcare Consulting 2009
Presentation Overview
Payor Mix – The Big Picture
5 Important Reasons to Evaluate Payor Mix
Role of Payor Mix in Operations Management
Service Area Payor Mix
The Effect of Billing & Collecting on Payor MixThe Effect of Billing & Collecting on Payor Mix
WRAP-UP AND QUESTIONS
© Guidian Healthcare Consulting 2009
Contact Information
MARY MURPHY, MANAGING PARTNER,Guidian Healthcare Consulting
617-302-3736mmurphy@guidianconsulting [email protected]
CATHY MARCHIANDO, MANAGING PARTNERCATHY MARCHIANDO, MANAGING PARTNERGuidian Healthcare Consulting
770-932-3230hi d @ idi [email protected]
© Guidian Healthcare Consulting 2009