optimizing and enhancing the lifetime of wireless · pdf fileoptimizing and enhancing the...
TRANSCRIPT
Optimizing and Enhancing the Lifetime of
Wireless Sensor Network (WSN)__________________________________________________________________By using an evolutionary multi-objective based approach and Operator Calculus to
deine path centrality, instead of shortest path, from all feasible paths.
Abdusy [email protected]
Jakarta, 27 March 2016

Background Propositions Conclusion
2

• Background
• State of the art
• Problems
• Objective
• Propositions• Evolutionary Multi-objective based
approach for WSN Deployment
• A new Path Operator Calculus Centrality
• A new Routing Algorithm
• Conclusion
3

Background
4

5

Source: http://www.isa.org
Global installed industrial Wireless Sensing Points (2011-
2016)
6ISA = International Society of Automation
In 2016 : there will be 24 million wireless-enabled sensing points. 39% will be new applications, uniquely enabled by WSN.
All respondents: WSN adoption stage


8

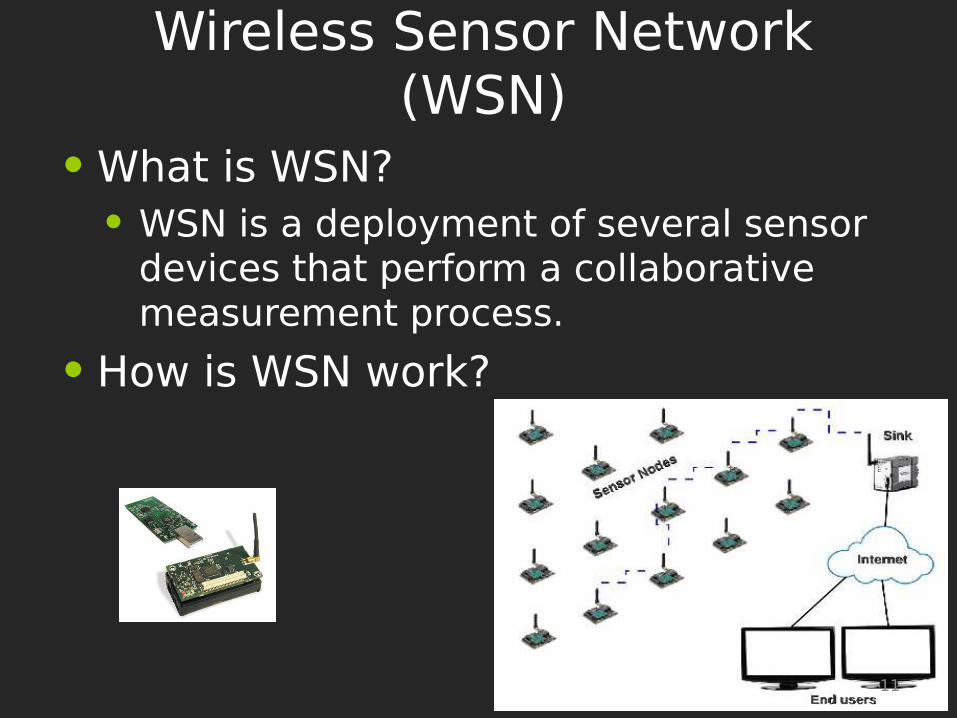
Wireless Sensor Network (WSN)
• What is WSN?
• WSN is a deployment of several sensor devices that perform a collaborative measurement process.
• How is WSN work?
11

Deployment Phase
• Pre-deployment and Deployment Phase.
– throwing from an air plane,
– launching by an artillery shell, missile or rocket.
• Post-deployment Phase.
– location,
– reachability.
• Re-deployment of Additional Nodes Phase 12
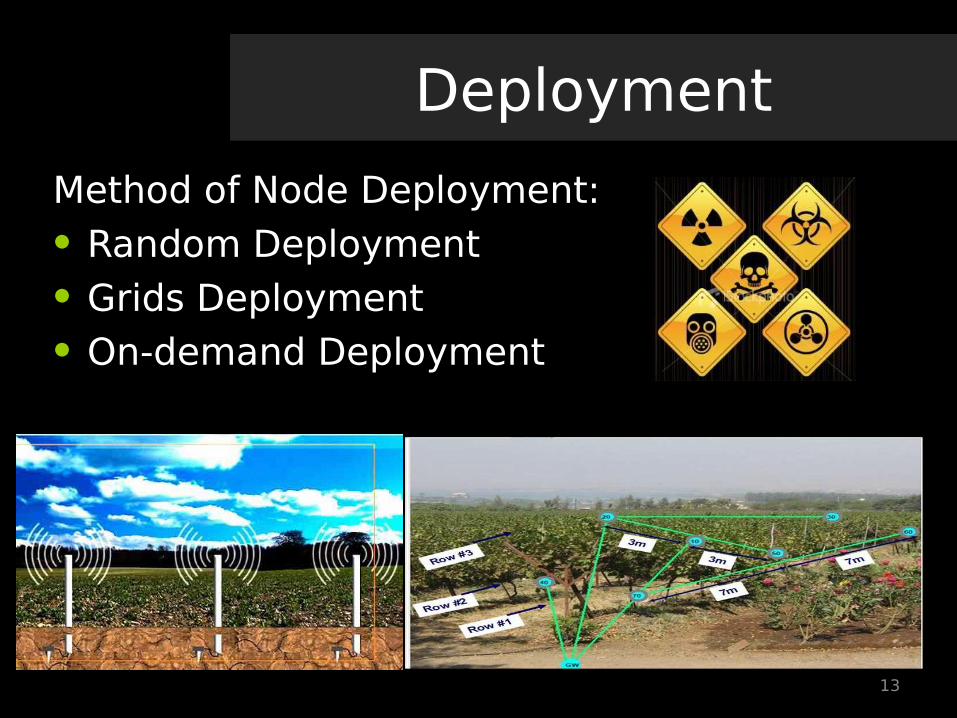
Deployment
Method of Node Deployment:
• Random Deployment
• Grids Deployment
• On-demand Deployment
13
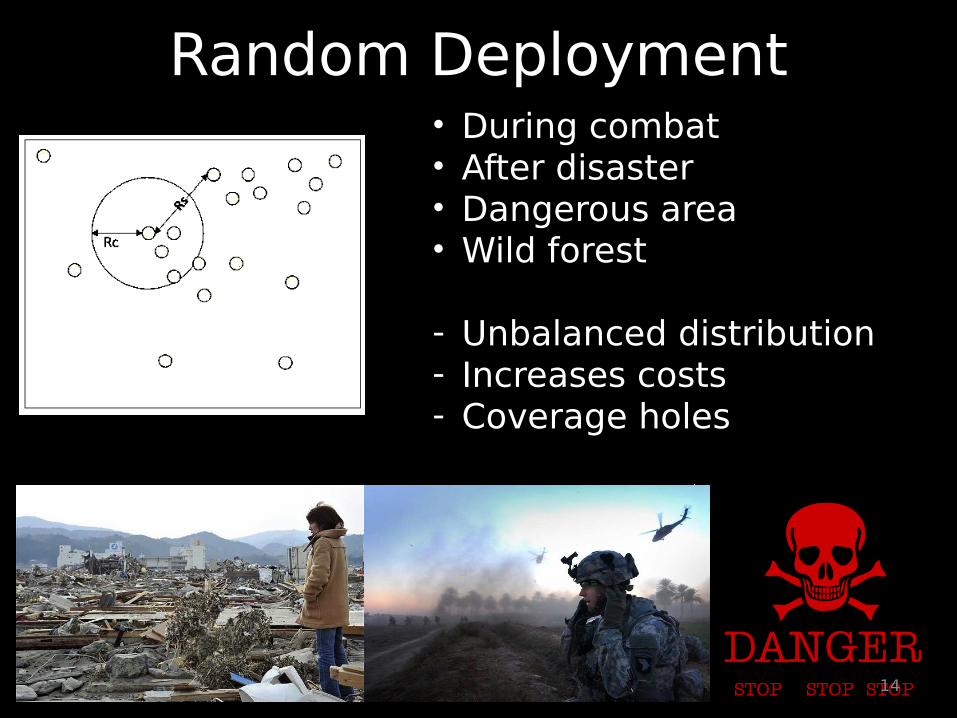
Random Deployment• During combat• After disaster• Dangerous area• Wild forest
- Unbalanced distribution- Increases costs- Coverage holes
14


• Degrade the functionality.
• Absorb or relect the RF signal.
• Cause packets looping backward and forward.
• The deployment approach is diferent.
18

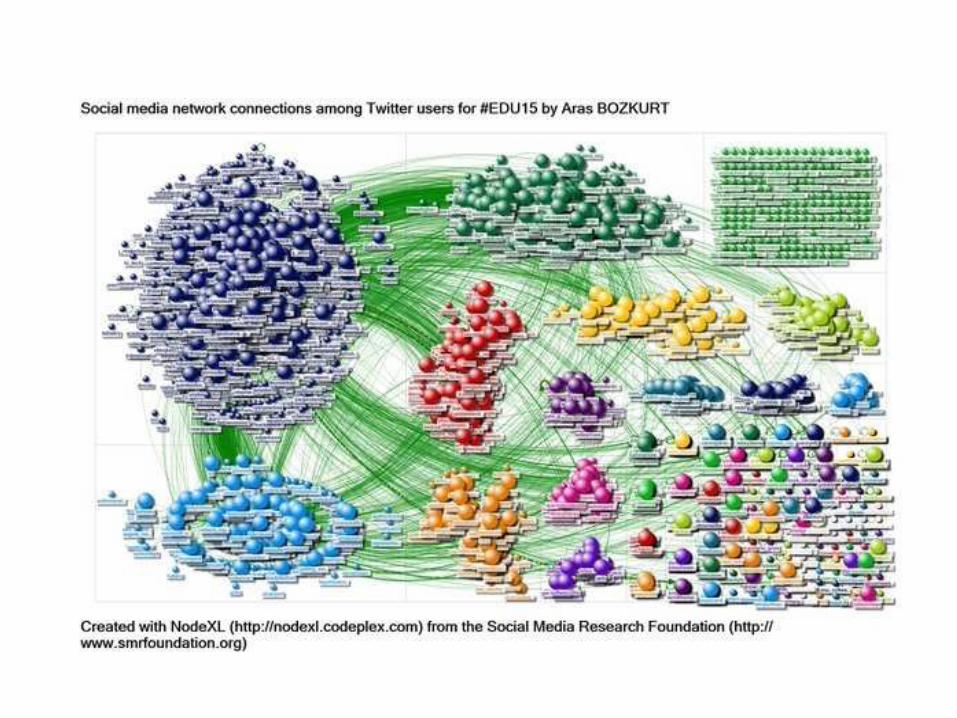
Social Network Analysis
• Who/What is most central to a network?
• Who/What has the greatest inluence in a group?
• How many diferent clusters can ind in a network?
• Which connections are pivotal for the functioning of a group?
• Who/What is the most popular? 19

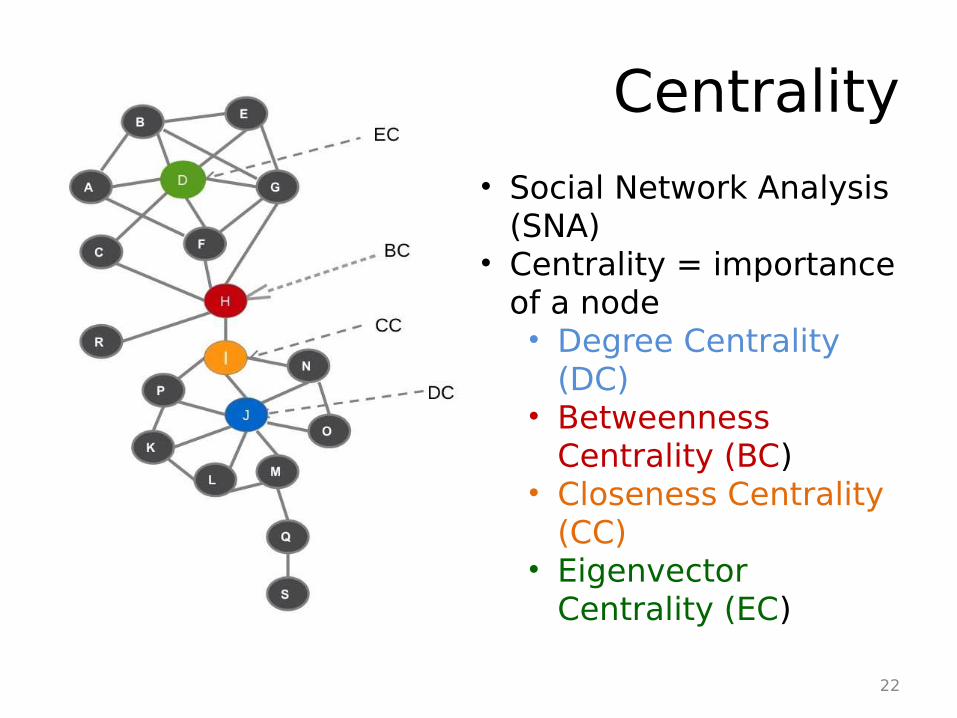
Centrality
• Social Network Analysis (SNA)
• Centrality = importance of a node• Degree Centrality
(DC)• Betweenness
Centrality (BC)• Closeness Centrality
(CC)• Eigenvector
Centrality (EC)
22

Routing Algorithm
• Many proposed routing protocols.
• Challenges :– Data redundancy
– Limited energy supply.
• New creative and innovative techniques are required.
23

24
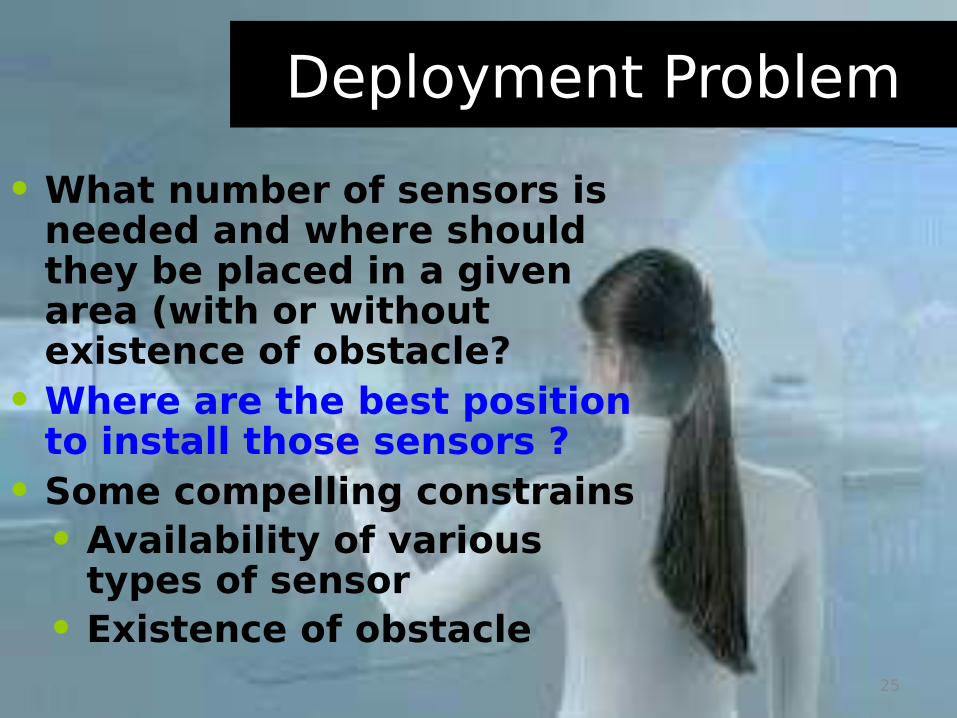
Deployment Problem
• What number of sensors is needed and where should they be placed in a given area (with or without existence of obstacle?
• Where are the best position to install those sensors ?
• Some compelling constrains
• Availability of various types of sensor
• Existence of obstacle
25

Energy and Routing Problem
• How to dispose energy ineiciencies?
• How to deine the “best” path?
• To deine Centrality nodes .
• To Prolong the network lifetime.
26
Research Questions
• How to optimizing the deployment of WSN by using an evolutionary multi-objective approach?
• Region without obstacle
• Region with obstacle
• How to prolong the network lifetime by using SNA (centrality metric) and operator calculus ?
27

The Purposes of Study
• To provide coverage and connectivity as the key of Quality of Service (QoS).
• To design a topology planning algorithm, which take into account the presence of obstacles.
• To ind the minimal cost deployment.
• To design a routing algorithm based on centrality metric.
28

Multi-objective Optimisation Problem (MOP)
• Optimization problems involved more than one object functions.
• Competing objectives: cannot be optimized simultaneously.
• MOP – Search for a set of “acceptable” – maybe only suboptimal for one objective - solutions is the goal.
• Example: Buying an Automobile
• Objectives:
• Reduce cost, while maximizing comfort
• Maximizing performance, while minimizing fuel consumption and emission of pollutants of a vehicle
• Which solution is best (1,A,B,C,2)???
29
Why MOP? Deploying a WSN
• Objectives :
• Maximizing Coverage: to guarantee that the area of target is absolutely sensed.
• Maximizing Connectivity: to make certain event is successfully transmitted and received at BS.
• Minimizing no. of nodes: to reduce the deployed node, include the cost.
• Both coverage and connectivity collectively can be treated as a measure of Quality of Service (QoS).
30

Non-dominated Sorting Genetic Algorithm (NSGA-II)
• NSGA-II is a recent and eicient multi-objective evolutionary algorithm using an elitist approach, proposed by Deb Kalyanmoy.
• NSGA-II relies on two main notions:
• Non-dominated ranking and
• Crowding distance
31
32

33
PROPOSITIONS
Deployment Strategy Based-on NSGA-II
• Initialisation
• Selection
• Crossover
• Mutation
• Fitness Function
34
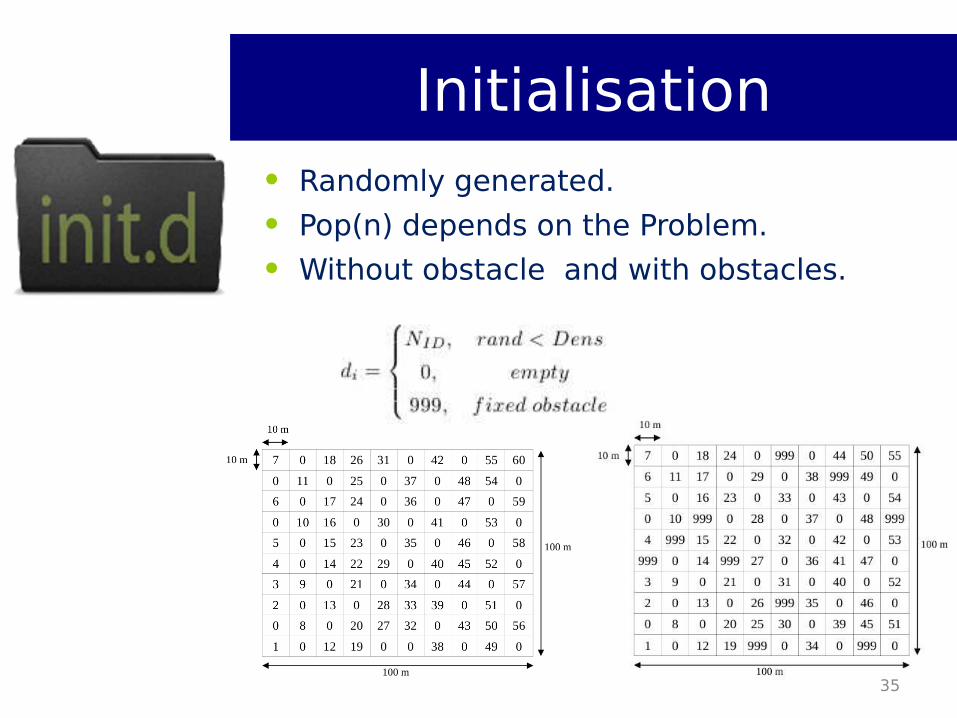
Initialisation
• Randomly generated.
• Pop(n) depends on the Problem.
• Without obstacle and with obstacles.
35

Evaluation
• The algorithm computes multi-objective function value for each chromosome produced in the initialization step.
• Verify the connectivity
• Verify the coverage
• Verify the no. of nodes
• Example:• F_obj[1] = 95.0
• F_obj[2] = 100.0
• F_obj[12] = 0.0
36

Selection
• Selection is one of genetic operations which created new population and aims to identify individuals which should reproduce.
37

Crossover
Enrich the variety of population.
Planned with 2 parents and 2 children.
38
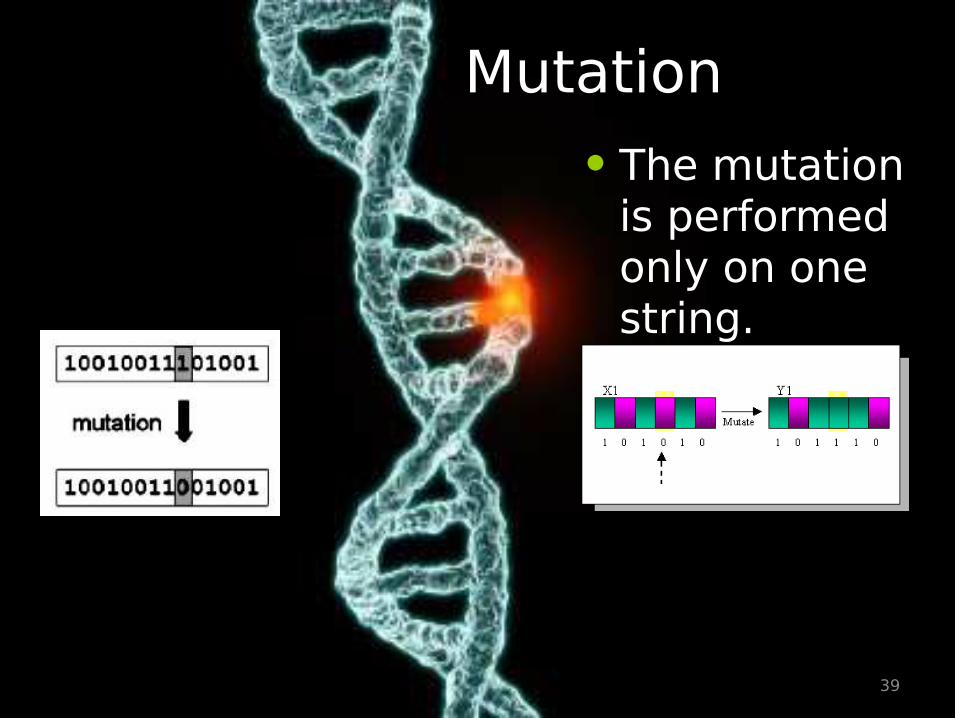
Mutation
• The mutation is performed only on one string.
39

Fitness Function
• Compute the set goals for each solution.
• F1 Calculates the no. of sensor deployed.
• F2 Two objectives:• Ensure each sensor is
positioned within the Rc.
• Prevent sensor nodes become close to each others.
40
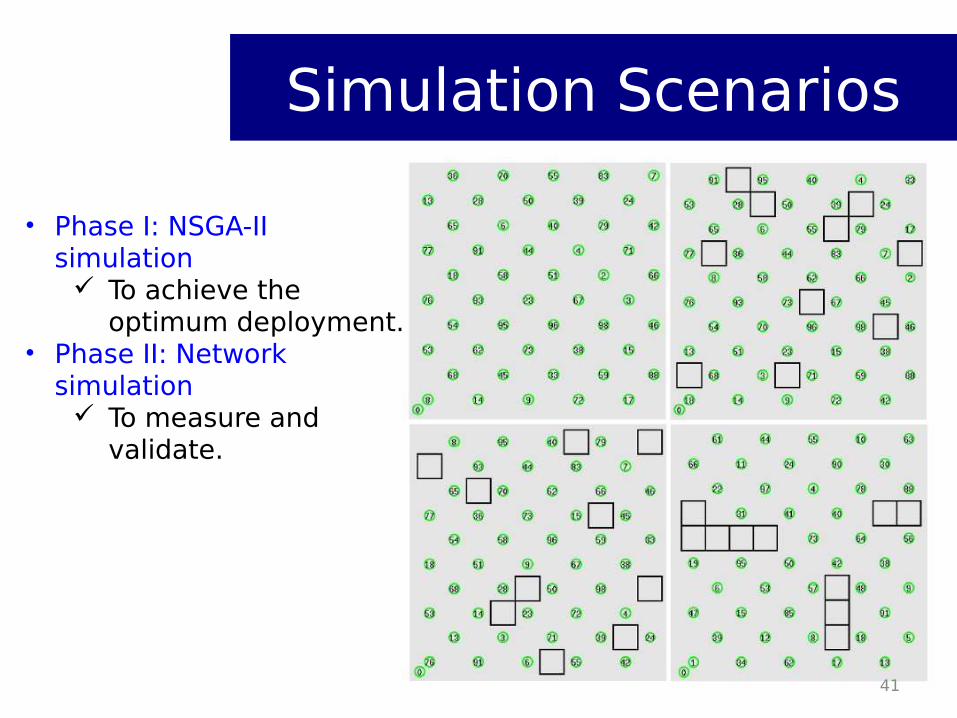
Simulation Scenarios
• Phase I: NSGA-II simulation To achieve the
optimum deployment.• Phase II: Network
simulation To measure and
validate.
41

Result: Number of nodes
• Required Number of Node for Diferent Deployment vs Rc/Rs Ratio
42

Result : Delay
• Average and standard deviation of delay between random and proposed deployment.
• Delay comparison between Random and Proposed Deployment (with 10% Obstacles)
<#>
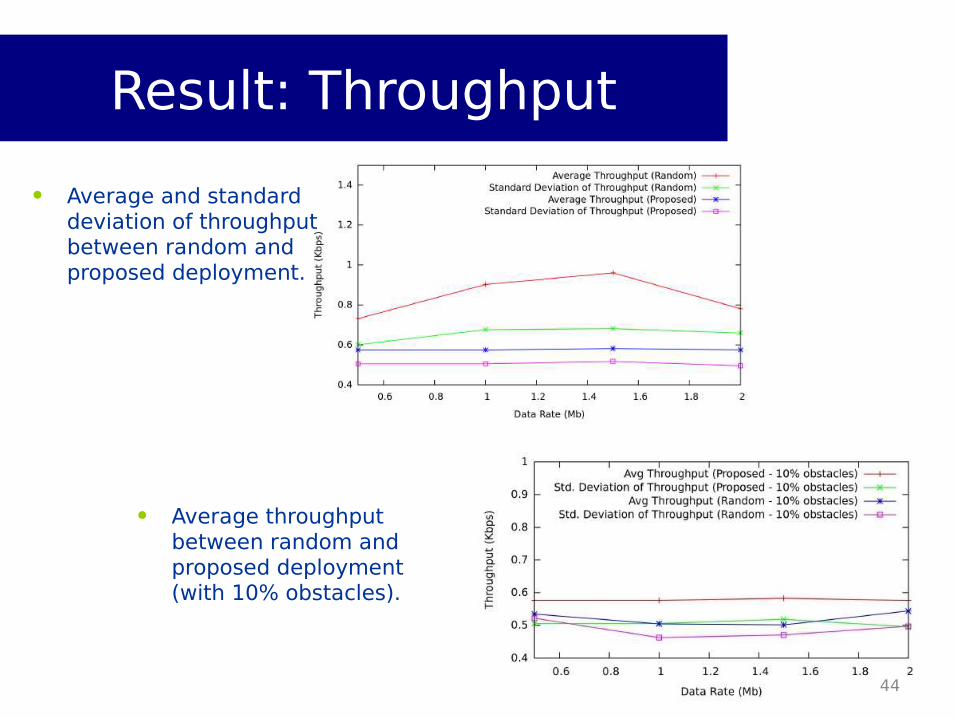
Result: Throughput
• Average and standard deviation of throughput between random and proposed deployment.
• Average throughput between random and proposed deployment (with 10% obstacles).
44
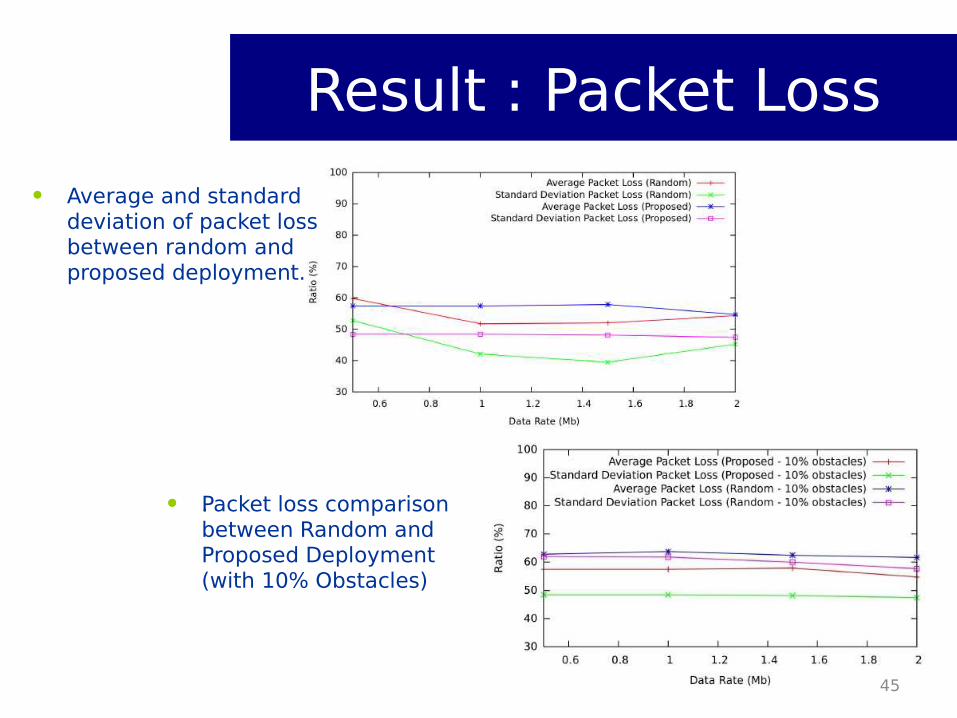
Result : Packet Loss
• Average and standard deviation of packet loss between random and proposed deployment.
• .• Packet loss comparison between Random and Proposed Deployment (with 10% Obstacles)
45

Proposition #2
46

New Path Centrality
• Based on Operator Calculus
• C = (40,27,30,40)
• Feasible Paths:
47
S
D

New Path Centrality
48

Result : avg PDR
49
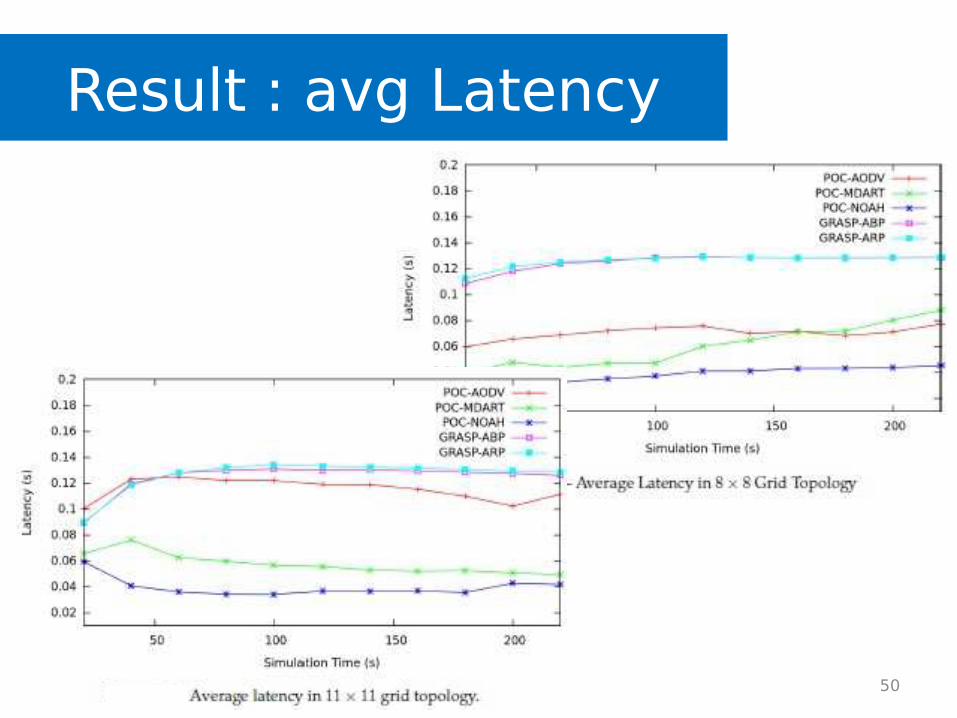
Result : avg Latency
50
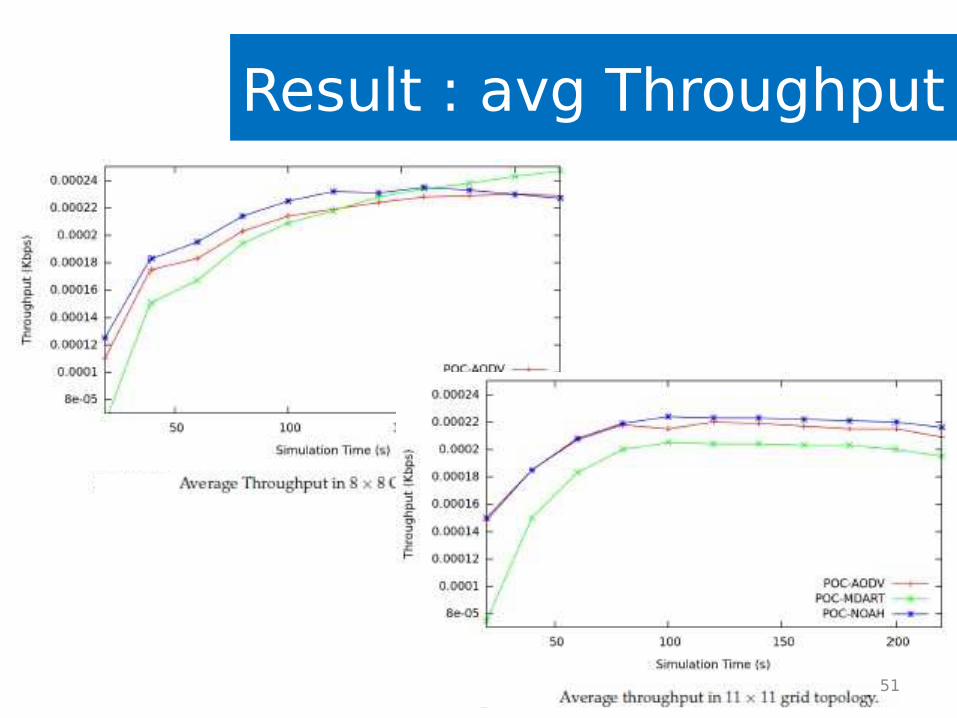
Result : avg Throughput
51

Result : avg Energy
52
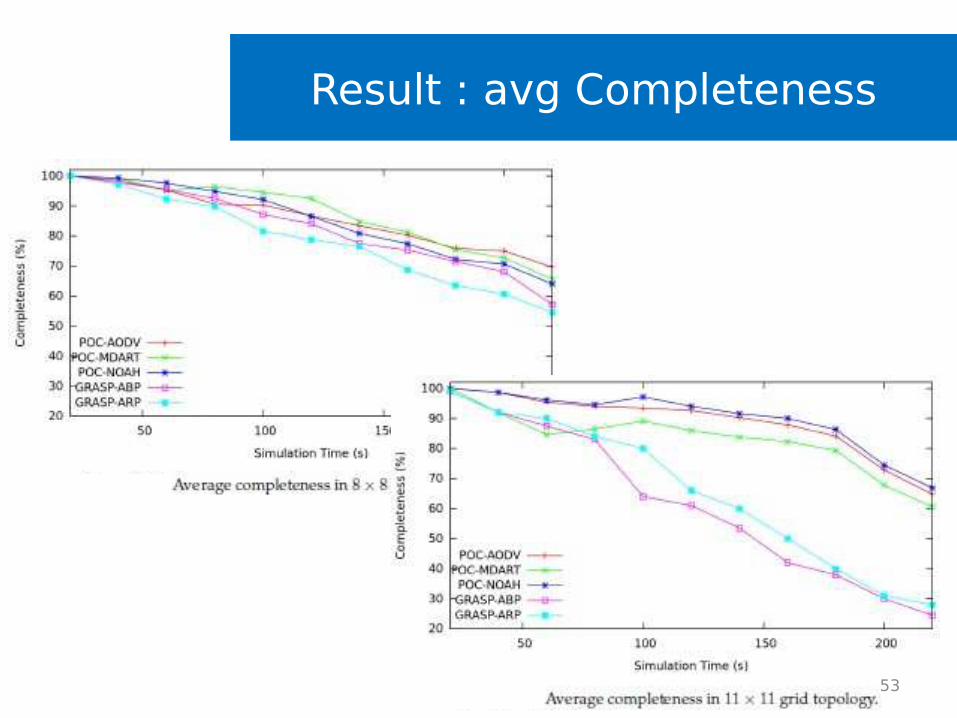
Result : avg Completeness
53

Result : avg Routing Overhead
54

55
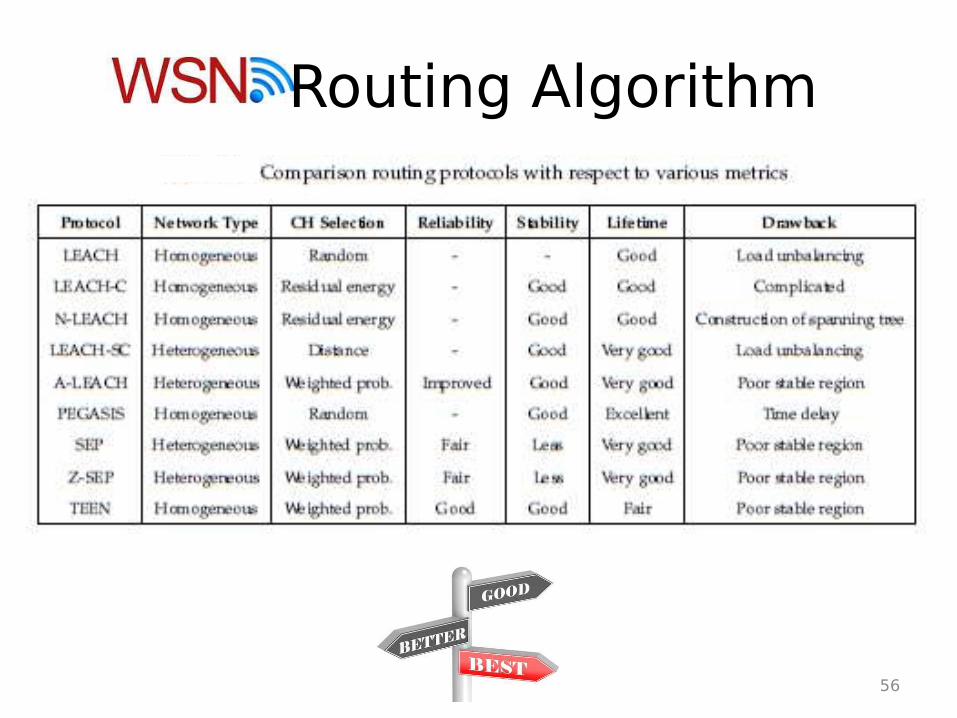
Routing Algorithm
56
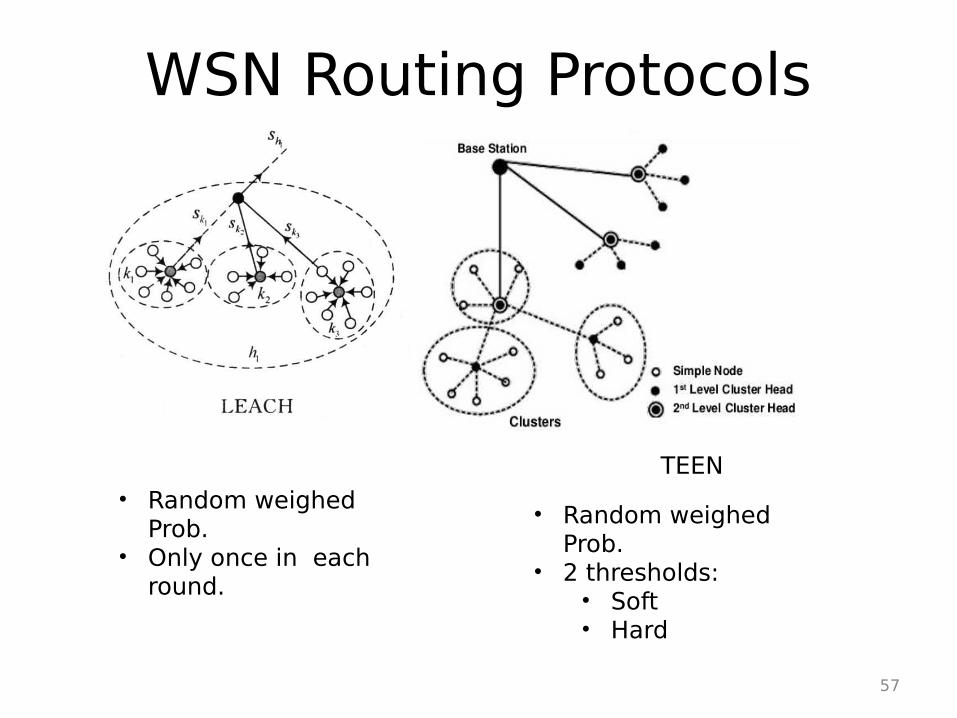
WSN Routing Protocols
• Random weighed Prob.
• 2 thresholds: • Soft • Hard
• Random weighed Prob.
• Only once in each round.
TEEN
57
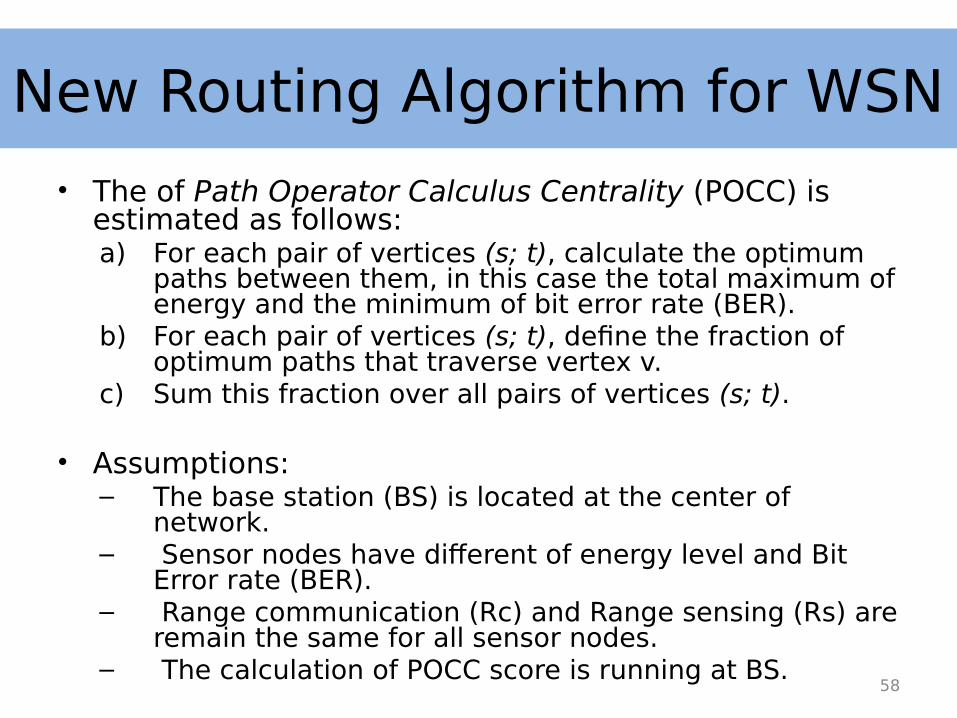
• The of Path Operator Calculus Centrality (POCC) is estimated as follows:a) For each pair of vertices (s; t), calculate the optimum
paths between them, in this case the total maximum of energy and the minimum of bit error rate (BER).
b) For each pair of vertices (s; t), deine the fraction of optimum paths that traverse vertex v.
c) Sum this fraction over all pairs of vertices (s; t).
• Assumptions:– The base station (BS) is located at the center of
network.– Sensor nodes have diferent of energy level and Bit
Error rate (BER).– Range communication (Rc) and Range sensing (Rs) are
remain the same for all sensor nodes.– The calculation of POCC score is running at BS.
New Routing Algorithm for WSN
58
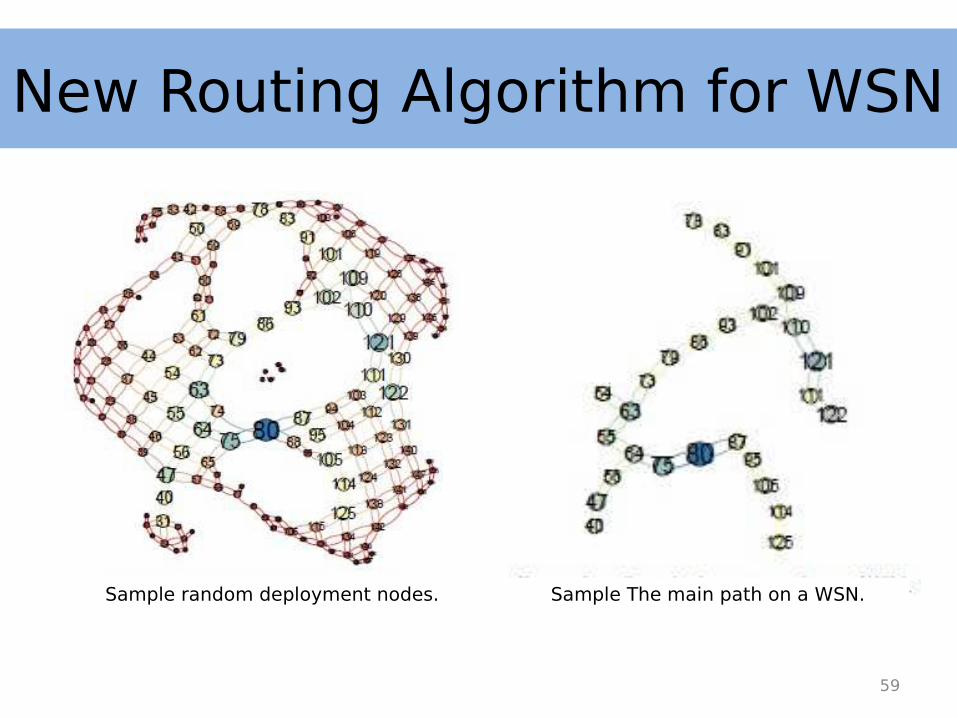
New Routing Algorithm for WSN
59
Sample random deployment nodes. Sample The main path on a WSN.

Updating Topology
60
Topology before updating. Topology after updating.
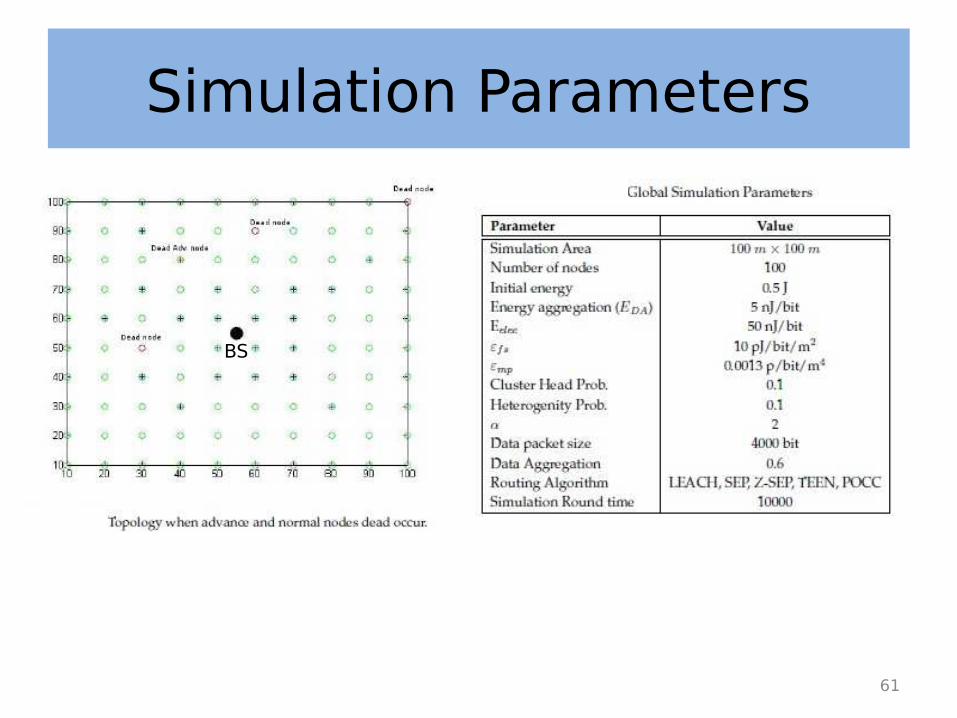
Simulation Parameters
61
BS
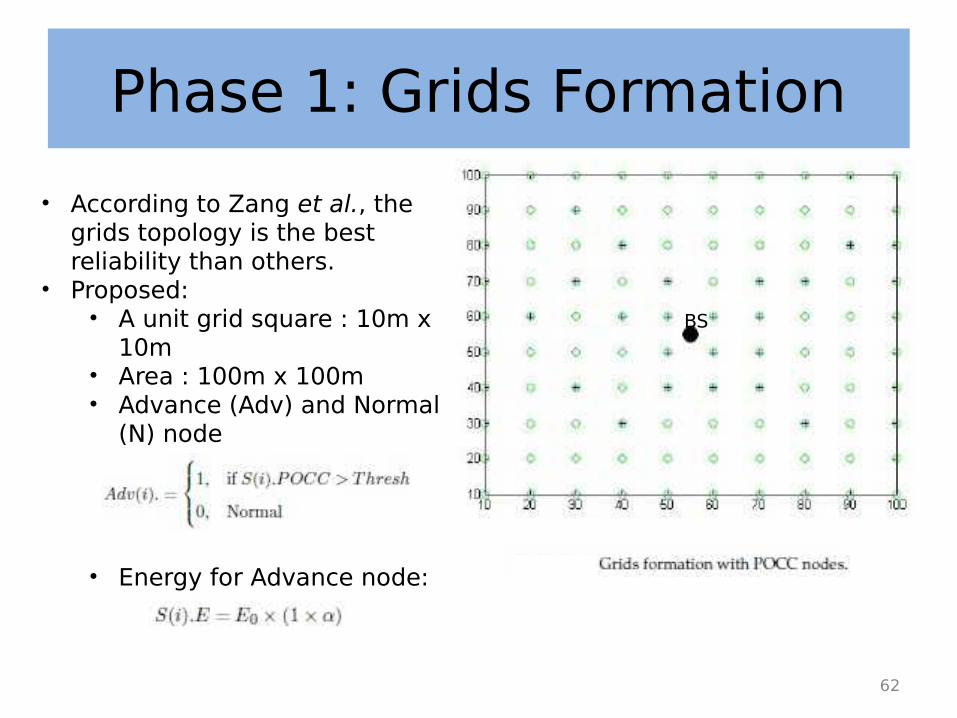
Phase 1: Grids Formation
• According to Zang et al., the grids topology is the best reliability than others.
• Proposed:• A unit grid square : 10m x
10m• Area : 100m x 100m• Advance (Adv) and Normal
(N) node
• Energy for Advance node:
BS
62
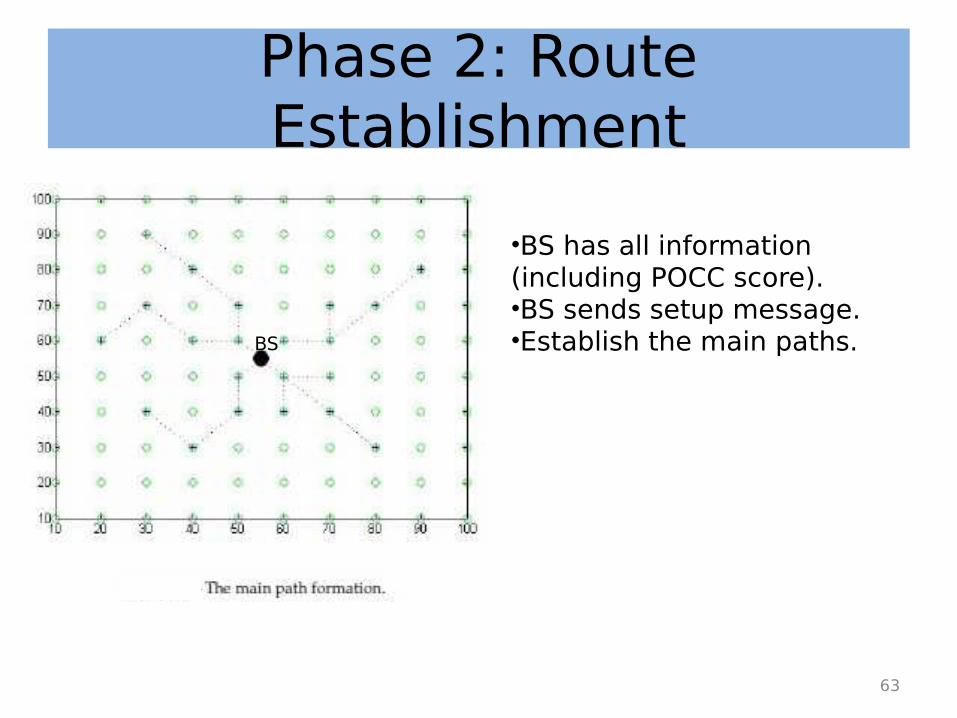
Phase 2: Route Establishment
•BS has all information (including POCC score).•BS sends setup message.•Establish the main paths.BS
63
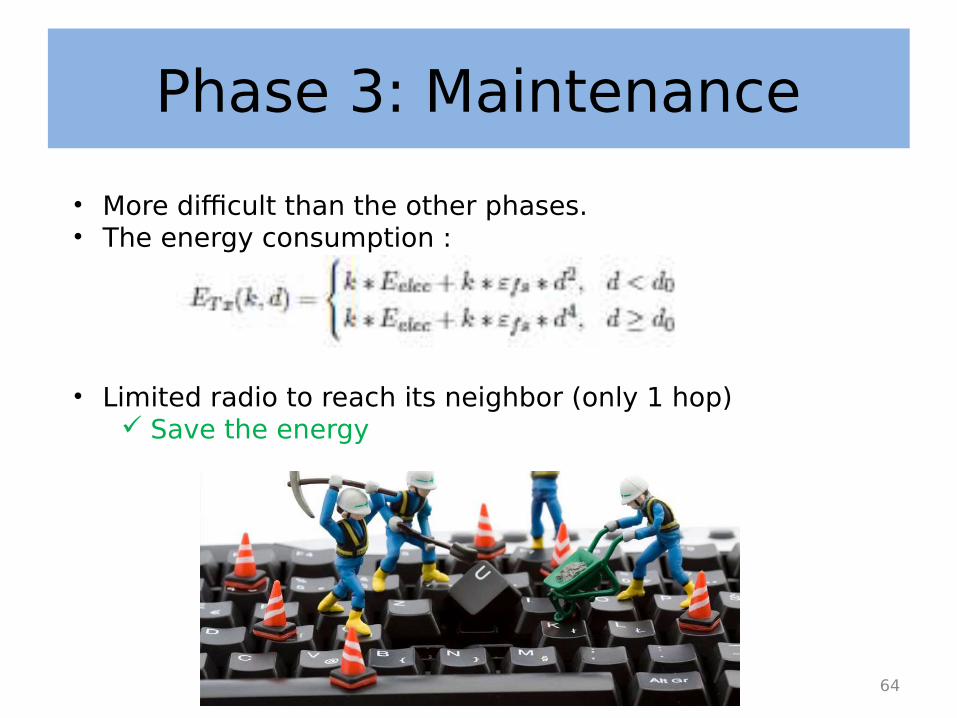
Phase 3: Maintenance
• More diicult than the other phases.• The energy consumption :
• Limited radio to reach its neighbor (only 1 hop) Save the energy
64
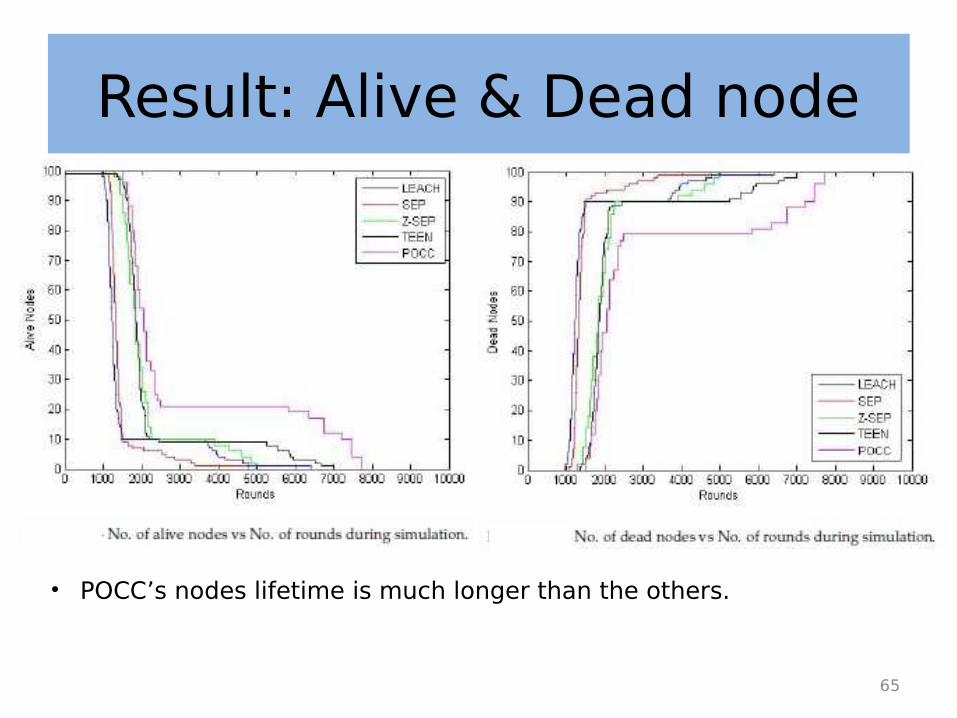
Result: Alive & Dead node
• POCC’s nodes lifetime is much longer than the others.
65
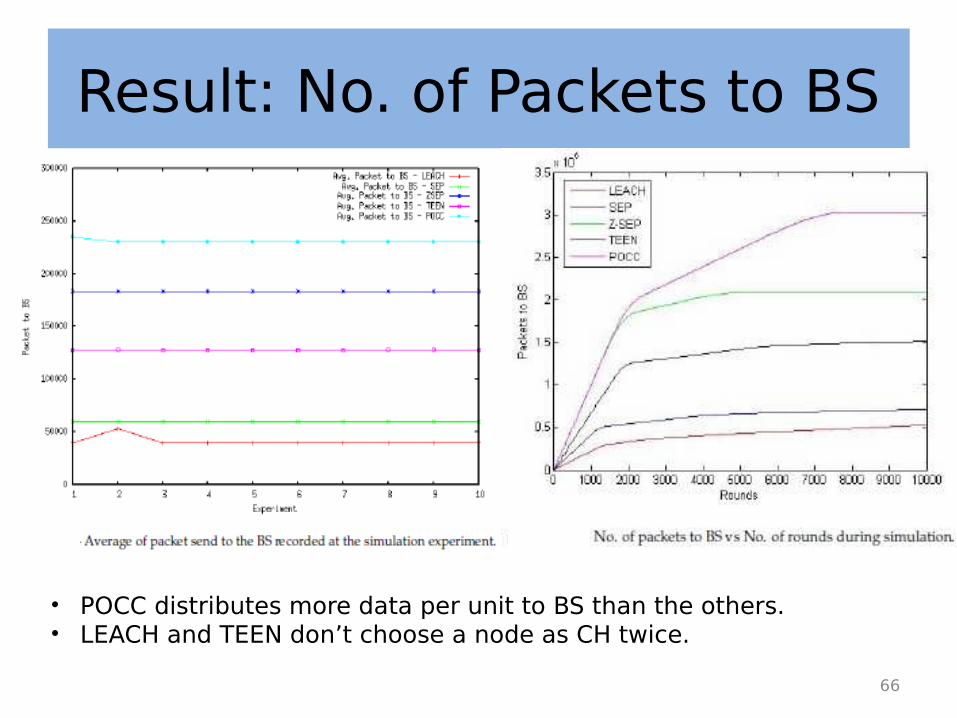
Result: No. of Packets to BS
• POCC distributes more data per unit to BS than the others.• LEACH and TEEN don’t choose a node as CH twice.
66

Result: Network Lifetime
• POCC has the longest network lifetime than the others. POCC transfers packet data in 1 hop. POCC keeps the density and connectivity. 67
• Time until the irst sensor node in a WSN runs out of its energy.

68
Summary
• An evolutionary multi-objective approach for WSN deployment with and/or without the presence of obstacles has been proposed to optimizing the coverage and the connectivity of WSN.
• A new centrality algorithm which deine the optimum path in weighted node. The proposed scheme is based on operator calculus which provide an optimum solution for multi-path constraints from each source node to its destination.
• The routing algorithm for enhancing the lifetime of WSN deployment is proposed.
• POCC performs better performance.
69

• Take into account a group of sensors that cooperatively perform the same deployment task in a distributed manner and also take into consideration the obstacle.
• To allow an evolutionary step and improve the coverage in presence of a massive quantity of obstacles for the implementation of another self-property for autonomous WSNs.
• Possibility on combining the genetic algorithm with neural network and/or fuzzy logic.
• Load balancing, stability, reliability or other social network analysis in order to provide the reliability and fault tolerant of proposed routing scheme.
70

Publication1. A. Syarif, A. Abouaissa, L. Idoumghar, P. Lorenz, R. Schott and G.S. Staples, ”New Path
Centrality Based on Operator Calculus Approach for Wireless Sensor Network Deployment", IEEE Transactions on Emerging Topics in Computing (TETC), Acceped on March 2016.
2. A. Syarif, A. Abouaissa, L. Idoumghar, A. Kodar, and P. Lorenz, “Search Based Software Engineering on Evolutionary Multi-Objective Approach", IEEE International Conference on Communications, Kuala Lumpur, Malaysia, 23-26 May, 2016.
3. A. Syarif, I. Benyahia, A. Abouaissa, L. Idoumghar, R.F. Sari, and P. Lorenz, “Evolutionary Multi-Objective Based Approach for Wireless Sensor Network Deployment", IEEE International Conference on Communication, Sydney, Australia, 10–14 June, 2014. (Best Paper Award).
4. A. Syarif, A. Abouaissa, L. Idoumghar, R.F. Sari, and P. Lorenz, “Performance Analysis of Evolutionary Multi-Objective Based Approach for Deployment Wireless Sensor Network with The Presence of Fixed Obstacles", IEEE Global Communications Conference (Globecom) 2014, Austin, Texas, USA.
5. A. Syarif, A. Abouaissa, R.F. Sari, P. Lorenz,“Performance Comparison of Modiied AODV in Reference Point Group Mobility and Random Waypoint Mobility Models", IEEE International Conference on Communications, ICC’13, pp. 2135–2139, Budapest, Hungary, June 9–13, 2013. (Best Paper Award).
6. A. Syarif, H. Simaremare, A. Abouaissa, and P. Lorenz, “Comparison and Performance Analysis of AntNet and Distance Vector Routing Protocol in Telecommunication Networks", IEEE International Conference of Information and Communication Technology (ICoICT), Bandung, Indonesia, 20–22 March 2013.
71


73