optimized structures for heavy duty block pavements
TRANSCRIPT

Optimized Structures for Heavy Duty Block Pavements R. Blab & W. Kluger-Eigl Center of Road and Airfield Engineering, Vienna University of Technology, Vienna, Austria J. Füssl Center of Mechanics of Material and Structures, Vienna University of Technology, Vienna, Austria ABSTRACT: To optimize the structure and thickness of block and slab pavements as well as to test new large-format slabs an accelerated pavement test (APT) using the New Mobile Load Simulator (MLS10) was carried out in Austria from September to October 2010. The APT was an international cooperation with the Swiss Federal Laboratories of Material Science and Technology, the Austrian block paving industry and the Vienna University of Technology. The experiment included seven different types of slab and block pavements, and some were instrumented with soil pressure cells and horizontal strain gauges in order to assess the primary response under the moving wheel load. For the APT a wheel load of 65 kN was applied by super single tires of the MLS10. The test speed was 22 km/h and no lateral wandering and no application of water was used during the tests. Falling Weight Deflectometer (FWD) measurements were taken after construction of the test sections and after completion of loading. Deformation of the surface (rut depth) was determined periodically. The results of the APT are used to validate the parameters for a Finite-Element Model (FEM) specifically developed for slab and block pavements, which enables realistic simulation of the whole superstructure, traffic loads and thermal stresses. This FEM is used to optimize slab and block pavement design for industrial and heavy traffic areas. KEY WORDS: Block pavement, accelerated pavement test, new mobile load simulator, falling weight deflectometer, finite-element-model.
1 INTRODUCTION
Block pavements or slab pavements made of concrete or natural stones are mainly used for communal areas, where a variety in creation (shape, color, texture) is very welcome. Also the economically efficiency respectively the lifespan of the pavement is very important in such areas. At bus stops or pedestrian precincts for example, which are also trafficked by delivery trucks, often high vertical and horizontal loads (braking and accelerating) occur. If the layers of the pavement superstructure were not properly designed, the pavement often suffers damage and as a result of this an expensive reconstruction is necessary. To avoid such damage in Austria standard pavement types with blocks or slabs are only provided for areas with light or low traffic loads, e.g. load class VI to IV and VI to III, respectively, according to the Austrian regulation RVS 03.08.63 (FSV 2008a). In this regulation the thickness of the blocks and slabs as well as of the layers for the superstructure is determined on the basis of a given design traffic load (ESAL) for two different pavement types, with a unbound base and one rigid base (porous concrete) layer. Also the maximum sizes and the geometry (aspect

ratio) for blocks and slabs are defined in this regulation. For heavy-duty trafficked areas, high traffic-loads and other formats individual structural design is mandatory. To optimize the thickness of slab and block pavements for special areas of applications and also to design new large-format slabs a research project was started in December 2009. A new Finite-Element Model (FEM) was created and should be evaluated with the data of an accelerated pavement test (APT). The APT was carried out in Austria from September to October 2010 using the New Mobile Load Simulator (MLS10) from Switzerland.
This research project represented a challenge with no precedents for the partners involved and it was the first time an APT was executed in Austria on block pavements. The international cooperation involved two research institutes, Technical University Vienna (TU) and the Swiss Federal Laboratories of Material Science and Technology (EMPA), and the an Austrian industrial partner SEB, an international operation company, whose main activity is the development, production and sale of concrete block and slab pavers.
2 CONCEPT FOR ACCELERATED PAVEMENT TEST
2.1 Layout, construction and instrumentation of the test sections
For the APT seven different test sections were built in summer 2010 on a privately owned plot. TU and SEB designed and constructed the testing sites including measuring devices whereas EMPA provided and operated the MLS10 with the support of SEB.
Slab pavement test sections were 6.4 m long and 5.0 m wide and block pavement test sec-tions were 6.4 m long and 4.0 m wide (Figure 1). The length of each test section was adjusted to the length between the corner jacks of the MLS10, because the machine should not stand on the pavement itself during the traffic simulation. All sections were surrounded with a concrete foundation to support the MLS10 and to confine the pavement. Because of the construction of the MLS10 (corner jacks) the maximum difference in height between the surface of the pavement and the foundation was limited to ±20 mm. The test sections were built flat with no slope in longitudinal or cross direction.
The superstructure of each test section was chosen according to the requirements in RVS 03.08.63 (FSV 2008a), depending on the calculated loading class (Table 1). For laying pattern a stretcher bond was selected for each test section. Bedding sand (2/4 mm), jointing sand (0/2 mm and 0/4 mm), base materials (0/63 mm and 0/32 mm), and porous concrete (C16/20) were chosen according to the requirements in regulations RVS 08.18.01 (FSV 2009) and RVS 08.15.01 (FSV 2008b).
The test sections 2, 4, 5 and 7 were instrumented in the main loading line of the MLS10 with following devices to determine the response under loading condition (Fig. 2 and Fig. 3): Strain gauges (type DMS LY 41-50/120) in-stalled on the bottom of the slabs in the
center and at the edge of the slab to monitor expansion. Soil pressure cells (type EBKE 20/30 K10 A) in-stalled on the surface of the subgrade
and the un-bound base course to measure vertical pressure. Special strain gauges (type EKD 1002) installed on the bottom edge of the porous
concrete to measure expansion. Thermocouples to measure air, surface and bed-ding sand temperatures.

Table1: Superstructures of test sections.
The exact position and designation of the instrumentation is show in Figure 2 with following abbreviations: U Soil pressure cell on subgrade O Soil pressure cell on base course DMS Strain gauge on bottom edge of slab BD Special strain gauge on bottom edge of porous concrete
Test section
Thickness [cm]
Pavement layer Instrumentation
18,0 Slab 100/50 cm
3,0 Bedding
20,0 Unbound base course
30,0 Frost protection
- Subgrade
18,0 Interlocking slab 125/62,5 cm 6 strain gauges
3,0 Bedding
20,0 Unbound base coarse 2 pressure cells
30,0 Frost protection
- Subgrade 2 pressure cells
14,0 Interlocking slab 125/62,5 cm
3,0 Bedding
20,0 Unbound base course
30,0 Frost protection
- Subgrade
12,0 Interlocking slab 125/62,5 cm 6 strain gauges
3,0 Bedding
20,0 Unbound base course 2 pressure cells
30,0 Frost protection
- Subgrade 2 pressure cells
10,0 Interlocking block 20/20 cm
3,0 Bedding
20,0 Unbound base course 2 pressure cells
30,0 Frost protection
- Subgrade 2 pressure cells
10,0 Interlocking block double T
3,0 Bedding
20,0 Unbound base course
30,0 Frost protection
- Subgrade
10,0 Interlocking block 20/20 cm
3,0 Bedding
20,0 Porous concrete 4 strain gauges
15,0 Frost protection
- Subgrade 2 pressure cells
7
5
6 -
3 -
4
1 -
2

Figure1: Layout of the seven test sections.
Figure2: Layout of instrumentation on slab and block pavements.

Figure3: Strain and stress measuring devices.
2.2 Test program
2.2.1 Visual inspection A visual inspection was done before and after the APT and included the following checks on each test section: Laying pattern and width of joints Filling of joints Damage of blocks or slabs Surface evenness and rut depth (also during maintenance stops of the MLS10) 2.2.2 Falling Weight Deflectometer measurements Falling Weight Deflection (FWD) measurements were conducted on the surface of each pavement be-fore and after the accelerated loading to assess the development of the bearing capacity of the test pavements. The measurements followed a fixed scheme as given in Figure 4 with an applied load of 50 kN. The following distances between the geophones were chosen: 0 – 200 – 300 – 450 – 600 – 900 – 1200 – 1500 – 1800 mm. Geophones were never positioned over a joint. 2.2.3 Response measurements Four test sections were instrumented with different strain and stress measurement devices to determine the primary response under wheel load to verify the results of the developed FEM. A scan rate frequency of 100 Hz was used for all sensors. The maximum, minimum, average and standard deviation per minute were calculated for each sensor for later analysis.

Figure4: Scheme of FWD measurement points.
2.3 Traffic simulation with New Mobile Load Simulator
The New Mobile Load Simulator MLS10 from Switzerland (Partl 2008) was used for the APT (Figure 5). Due to the given time and budget restrictions of two months for the tests it was necessary to increase the wheel load in order to reach the same amount of deterioration as for a standard axle load in Austria. Total testing was limited to a maximum of about 1.2 million load applications for all test sections.
The MLS10 was equipped with Goodyear 455/40 R22.5 super single tires with a tire pressure of 1.06 N/mm² (10.6 bar) and a wheel load of 65 kN. Changes in the geometry of the machine to accommodate these wheels were done prior to transporting the machine from Switzerland to Austria.
At the start of the APT the wheel load was adjusted with a calibrated static scale and controlled with a mobile Weight in Motion device (WIM) to achieve a wheel load of exactly 65 kN. Before the traffic simulation a pre-loading phase with reduced wheel load and a speed of 7.2 km/h was completed on each test section for about 15 minutes (1.000 passes). During this time the MLS10 was not fully lowered to the pavement. After this initial phase, the MLS10 was lowered to the pavement and the speed was increased to 22 km/h. During the tests no lateral wandering or application of water was performed.
The MLS10 was in Austria for 55 days and operated on 31 days with a total of 1,189,353 load applications distributed over the seven different pavements. This averaged 38,400 load cycles per day. Table 2 gives the numbers of the projected and applied loading of each test section as well as the respective loading class according to the Austrian design standard (FSV 2008a).
This study was also the first use of the MLS10 for testing block and slab pavements, in the past it has only been used for asphalt or concrete pavements. The main concern was the possibility of exposing the machine, especially the loading system, to damage. If no lateral wandering is used, rutting on block pavements will depend on how the wheel path of the APT

device is located in relation to the laying pattern of the blocks. Some blocks will get the full load of the tires whereas others next to them have partial or no loading. This can result in uneven settlement/compaction of the bedding under the blocks resulting in an uneven surface with sharp borders that could be detrimental to the machine. Table2: Projected and applied loading numbers at different test sections, load 65 kN,
1,06 MPa, super single tire Test section
#1 #2 #3 #4 #5 #6 #7
Projected 35.000 100.000 100.000 35.000 285.000 285.000 285.000 applied 100.000 100.000 100.000
(damage at 50.000 and 75.000
35.000 (damage at 8.000)
250.000 (rut depth >25 mm)
285.000 285.000
Load class1)
IV IV V VI IV III III
1) Acc. To Austrian design standard (FSV 2008a).
The most critical scenario would occur if a slab or block broke and was dislodged from the pavement and interfered with the loading action. To avoid this problem and to have a more representative situation of how loading distributes in real block pavements, the MLS10 was carefully positioned in order to set the wheel path so that it covered as many blocks as possible. Regular visual inspections of the surface were also carried out to check that the surface did not have unevenness of more than 20 mm. This is also the threshold value for rut depth in Austria.
Figure5: New Mobile Load Simulator MLS10 with super single tires.
3 FINITE ELEMENT MODEL
3.1 Description of the FEM
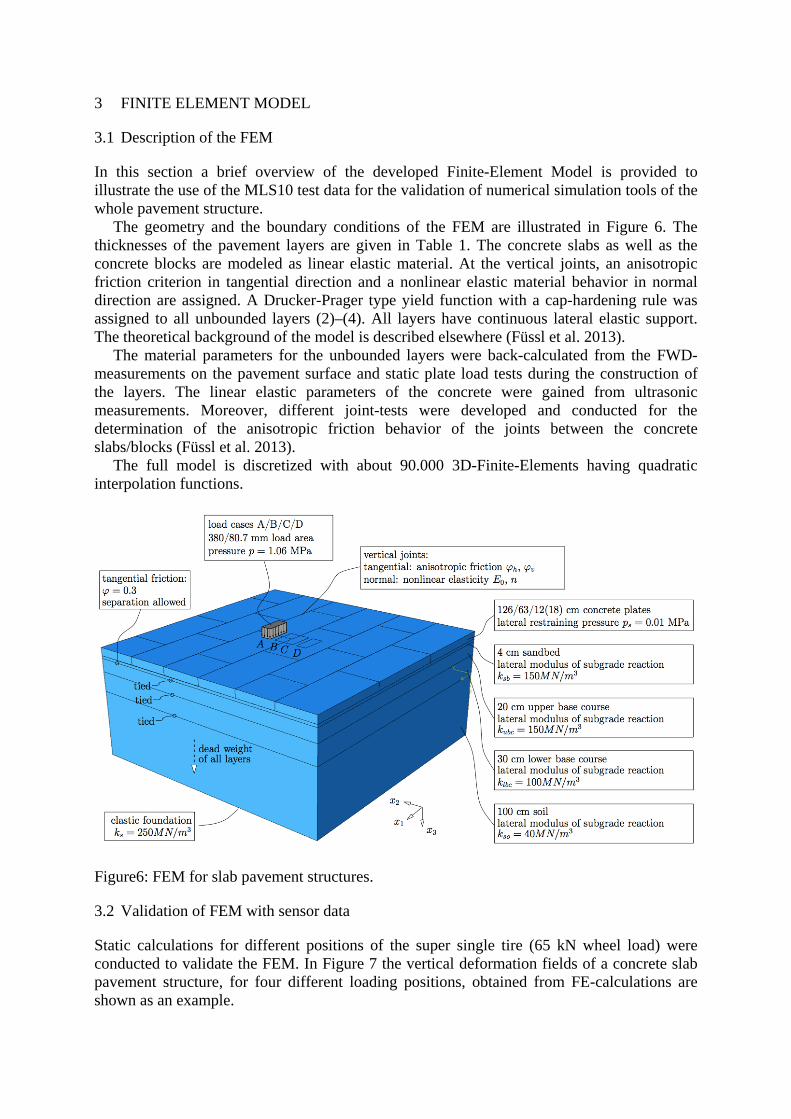
In this section a brief overview of the developed Finite-Element Model is provided to illustrate the use of the MLS10 test data for the validation of numerical simulation tools of the whole pavement structure.
The geometry and the boundary conditions of the FEM are illustrated in Figure 6. The thicknesses of the pavement layers are given in Table 1. The concrete slabs as well as the concrete blocks are modeled as linear elastic material. At the vertical joints, an anisotropic friction criterion in tangential direction and a nonlinear elastic material behavior in normal direction are assigned. A Drucker-Prager type yield function with a cap-hardening rule was assigned to all unbounded layers (2)–(4). All layers have continuous lateral elastic support. The theoretical background of the model is described elsewhere (Füssl et al. 2013).
The material parameters for the unbounded layers were back-calculated from the FWD-measurements on the pavement surface and static plate load tests during the construction of the layers. The linear elastic parameters of the concrete were gained from ultrasonic measurements. Moreover, different joint-tests were developed and conducted for the determination of the anisotropic friction behavior of the joints between the concrete slabs/blocks (Füssl et al. 2013).
The full model is discretized with about 90.000 3D-Finite-Elements having quadratic interpolation functions.
Figure6: FEM for slab pavement structures.
3.2 Validation of FEM with sensor data
Static calculations for different positions of the super single tire (65 kN wheel load) were conducted to validate the FEM. In Figure 7 the vertical deformation fields of a concrete slab pavement structure, for four different loading positions, obtained from FE-calculations are shown as an example.

Figure7: Computed vertical deformation of a concrete slab pavement structure loaded with a wheel load of 65 kN.
The results were compared to the sensor data gained from the MLS10 tests. Both the
strains measured with the strain gauges applied at the concrete slabs and the pressure measured in the unbound layers agreed well with the results obtained from the Finite-Element simulations, e.g. in Figure 8. Comprehensive comparisons of the Finite-Element results with the experimental test data are presented elsewhere (Füssl et al. 2013).
Figure8: Sensor data of strain gauges (SG) and soil pressure sensors (SPS) compared to FE-
results for slabs with a thickness of 12 cm (O1 and O2 denote SPS at the top of the upper base course and U1 and U2 denote SPS at the top of the soil).

Hence, this FEM validated on ATP field data allows mechanically-sound design and optimization of the full pavement structures. Furthermore realistic pressure and deformation conditions within all layers are can be computed.
4 EXPERIENCES AND CONCLUSIONS
4.1 Execution of APT
The main problem of the APT was the rapid loss of jointing sand, since the sand joints within the newly constructed slab and block test sections had no time to consolidate and develop conventional inter-locking status. Therefore it was necessary to add jointing sand during the maintenance stops of the MLS10. However, inspection and refilling of joints are regular maintenance actions for block and slab pavements during their life time. For further tests on these types of pavements, it is recommended that new test sections are exposed to environmental conditions (rain, dust) for a few weeks before the start of the APT until the jointing material consolidates.
Although a few slabs and blocks were damaged, and some surfaces were deformed during the APT, this had no influences on the operation of the MLS10. To minimize damage to moving parts of the MLS10 from jointing sand and water, the APT was undertaken without application of water to the pavement surface. The authors are aware of the un-realistic conditions for the test pavements, but the risk of damaging the MLS10 during the APT needed to be minimized.
In summary it can be stated that the execution of the APT and the planned load applications were completed successfully and considerable time was saved compared to test sections on public roads with high traffic volumes.
4.2 Performance of test sections
The Test Section 1 performed as expected within the allowable loading limits of the load class since it was a standard structure given by the Austria design catalogue (FSV 2008a). No slabs were damaged and vertical deformation (rutting) was within the allowed tolerances. After the application of additional load passes deformation increased slightly and some slabs started to tip. The lager slabs with the same thickness used in Test Section 2 with dimensions not permitted in the Austrian design standard also performed well, no slabs were damaged and vertical deformation was less than on Section 1 (Figure 9).
The thinner slabs on Test Sections 3 and 4 broke in the center along the loading line of the MLS10. This was expected since these design formats are outside the regulations of the Austrian standards. However, a significant number of load passes could be determined up to the failure. Thus design reserves in the Austrian design catalogue for lower trafficked areas could be identified. Vertical deformation was higher than on Sections 1 and 2, because of the loss of joint material and tipping of the slabs, which were loaded at the edge.

Figure9. Rut depth of slab and block pavements.
On Test Section 5, the APT was stopped before reaching the projected load passes because of a rut depth of more than 20 mm, which is the threshold value in Austria and also the maximum tolerance for the operating of MLS10. The largest deformation was induced directly above the soil pressure cells installed at the formation level of the unbound base course. It was concluded that the compaction of the base course in the surrounding of the instrumentation was unsatisfactory. Although considerable deformation was measured, no blocks were broken and only minimal spalling on two loaded stones occurred. The width of joints in the middle of the load line after construction was less than the allowable tolerances, which may have contributed to the exhibited performance.
On Test Section 6 the rut depth was 20 mm at the planned end of the APT loading, but no damage was visible on the blocks. Some horizontal deformation and a little tipping of two pavers were observed in the touchdown area of the super single tires. The width of joints in the middle of the load line was mostly below 1 mm.
The structure with porous concrete on Test Section 7 is a new construction method in Austria for which there is only limited knowledge and experience. The performance of this pavement was excellent, with no measurable deformation and no visible damage.
In summary, it can be assumed that the performance of the test sections showed realistic behavior during the APT compared to real traffic loads. The only shortcoming of the MLS10 is that no horizontal forces can be applied on the pavement surface. For further tests an additional braking system for the MLS10 would be desirable to evaluate the behavior of different block/slab pavements under partially braking load. However, this disadvantage can be overcome by using the developed FEM to simulate the performance under different horizontal force components.
0,0
5,0
10,0
15,0
20,0
25,0
30,0
0 50.000 100.000 150.000 200.000 250.000 300.000
Ru
t de
pth
[mm
]
Section 1
Section 2
Section 3
Section 4
Section 5
Section 6
Section 7

5 ACKNOWLEDGMENTS
The authors wish to express their thanks to Semmelrock Stein+Design GmbH & CoKG and the Austrian Research Promotion Agency (FFG) for financing the project. And also special thanks to the operating staff of the MLS10 for their support and hard work.
REFERENCES
FSV, 2008a. RVS 03.08.63 Straßenplanung – Bautechnische Details – Oberbaubemessung,
Österreichische Forschungsgesellschaft Straße-Schiene-Verkehr, Vienna, Austria. FSV, 2008b. RVS 08.15.01 Technische Vertragsbedingungen – Unterbauplanum und
ungebundene Tragschichten – Ungebundene Tragschichten, Österreichische Forschungsgesellschaft Straße-Schiene-Verkehr, Vienna, Austria.
FSV, 2009. RVS 08.18.01 Technische Vertragsbedingungen – Pflasterarbeiten,
Randbegrenzungen – Pflasterstein- und Pflasterplattendecken, Randeinfassungen, Vienna: Österreichische Forschungsgesellschaft Straße-Schiene-Verkehr, Vienna, Austria.
Füssl J., Kluger-Eigl W. and Blab R. Experimental identification and mechanical interpretation of the interaction behavior between concrete paving blocks with sand filled joints. In preparation. Füssl J., Kluger-Eigl W. and Blab R. Finite-Element model for rigid pavement structures of concrete plates validated by full-scale accelerated pavement testing. In preparation. Partl M.N., 2008. Full-Scale Accelerated Pavement Testing APT at EMPA – the New Mobile
Load Simulator, EMPA Duebendorf, Duebendorf, Switzerland.