optimization of the method wastewater treatment of unit ...€¦ · faculty of medicine and...
TRANSCRIPT

JMES, 2017, 8 (4), pp. 1235-1246 1235
JMES, 2017 Volume 8, Issue 4, Page 1235-1246
http://www.jmaterenvironsci.com /
1. Introduction The tanning industry is an important activity which involves the processing of leather animal skin by removing
fat and hair by different processes and treatments of the skin to make it unalterable and rigid [1]. Two methods
of tanning are used, chrome tanning and vegetable tanning. At a global level, between 70% and 80% of leather
are produced by chrome tanning [2, 3].Tannery industries use a lot of chemicals and produce huge volumes of
wastewater and solid waste [4].
Tanneries effluents are highly polluted. They contain fragments of flesh and hair, protein colloids, fats, tannins,
dyes and toxic elements such as sulphide and chromium [5, 6]. These various loads have an impact on the
environment and on health. Chromium is found naturally in many vegetables, fruits, meats, grains and yeasts.
Chromium III is an essential nutrient for humans. An excessive absorption of chromium III can cause health
problems (metabolic disruption and diabetes) [7]. Under certain conditions, the trivalent chromium the most
common form in tanning can oxidize on chromium VI which is carcinogenic and harmful to humans and
animals when it seeps into the water supply [8-12]. Hydrogen sulfide can poison various organs, prolonged
sulfide inhalation can cause degeneration of the olfactory nerve and cause death just after few breaths.
Inhalation of the gas even in small amounts can lead to a loss of consciousness [13-16].
Several previous research works have proven the effectiveness of certain chromium treatment processes such as
activated carbon adsorption, ions exchange [17-19] and precipitation with ferric chloride [20,21].Currently, a
dechromatation station is installed at Dokkarat industrial district of Fez with a treatment capacity of 50 m3/day.
Chromium is 98% recovered by precipitation under conditions of pH and coagulant charge, although
determined. However, sulfides used during the tanning process are not treated and have critical impacts on
health and the environment.
The objective of this study is, in the first part, evaluating the pollution load of different wastewater operating of
a hide tannery processing units. In the second, studying aims to treatment of wastewater loaded with sulfide of
unhairing-liming units.
Journal of Materials and Environmental Sciences ISSN : 2028-2508
Copyright © 2017,
University of Mohammed Premier
Oujda Morocco
http://www.jmaterenvironsci.com/
Optimization of the method wastewater treatment of unit bovine hides’s
unhairing liming
A. Omor
1*, Z. Rais
1, K. El Rhazi
2, M. Merzouki
3, K. El Karrach
3, N. Elallaoui
1, M. Taleb
1
1: Laboratory of Electrochemistry Engineering, Modeling and Environment. Science Faculty of Dhar El Mahraz, University
Sidi Mohamed Ben Abdallah, Fez, MOROCCO
2: Laboratory of Epidemiology, Clinical Research and Community Health. Faculty of Medicine and Pharmacy, University Sidi
Mohamed Ben Abdallah, Fez, MOROCCO
3: Biotechnology Laboratory. Science Faculty of Dhar El Mahraz, University Sidi Mohamed Ben Abdallah, Fez, MOROCCO
Abstract
The mean object of this work is to evaluate the pollution degree of the various
operating units (capacity of 2.5 tons of cattle/day) of tanning hide treatment, and
treat effluents of the unit unhairing-liming by precipitation. The physico-chemical
and biological characterization of wastewater studied operating units and the final
discharge shows that the waters of all units are slightly basic, with a low
biodegradable organic load and absence of fecal bacteria, but with a low
concentration of flora mesophilic aerobic total. Settling of all characterized
wastewater for one hour allowed a polluting load reduction of 10 to 35% with the
exception of sulfide ions and electrical conductivity of the effluent have not
changed almost their concentrations. The treatment of settled effluents,
characterized by high load sulfide ions, of unhairing-liming unit by ferric
chloride in basic medium has contributed to the elimination of approximately
90% of these ions as a precipitate.
Received 13 Sep 2016,
Revised 03 Nov 2016,
Accepted 05 Nov 2016
Keywords
Tannery sulphide
toxicity, organic load, characterization, chemical treatment
Tel: +212 6 20 18 59 11
JMES, 2017, 8 (4), pp. 1235-1246 1236
2. Materials and Methods
2.2. Sampling
Industrial effluents used in this work come from the river of a tannery workshop located in industrial area of
Dokkarat: Fes, Morocco, which deals essentially bovine hides.
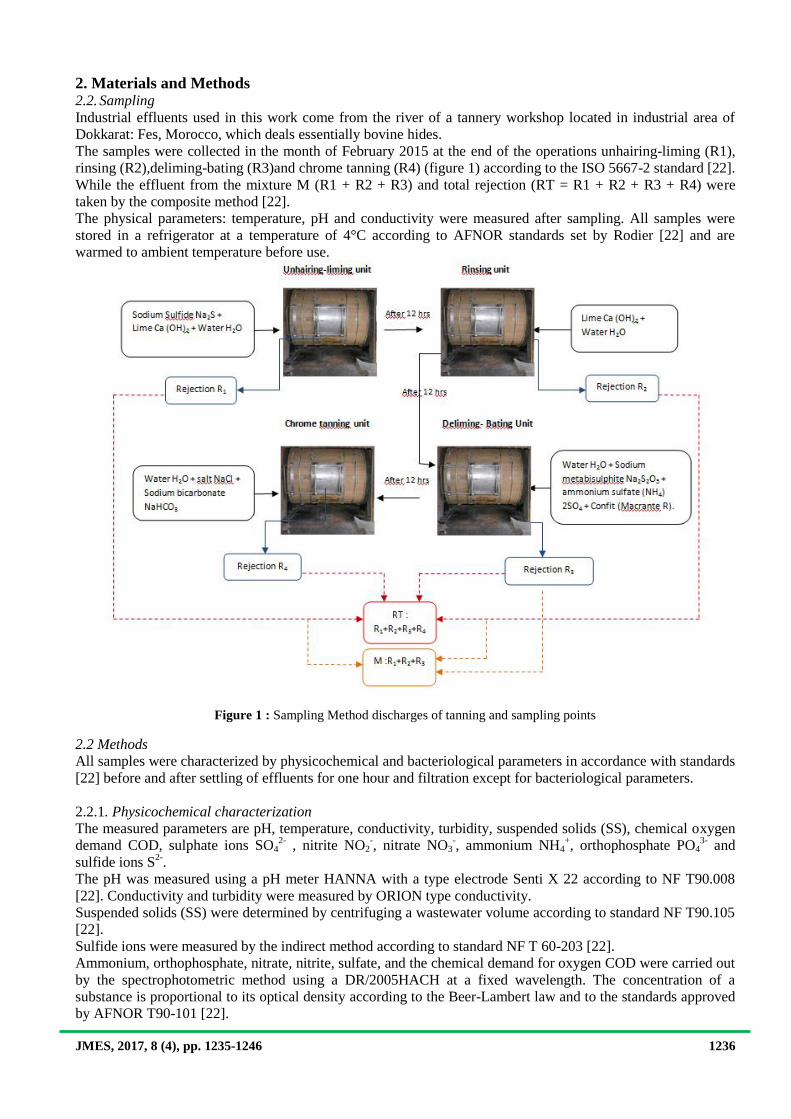
The samples were collected in the month of February 2015 at the end of the operations unhairing-liming (R1),
rinsing (R2),deliming-bating (R3)and chrome tanning (R4) (figure 1) according to the ISO 5667-2 standard [22].
While the effluent from the mixture M (R1 + R2 + R3) and total rejection (RT = R1 + R2 + R3 + R4) were
taken by the composite method [22].
The physical parameters: temperature, pH and conductivity were measured after sampling. All samples were
stored in a refrigerator at a temperature of 4°C according to AFNOR standards set by Rodier [22] and are
warmed to ambient temperature before use.
Figure 1 : Sampling Method discharges of tanning and sampling points
2.2 Methods
All samples were characterized by physicochemical and bacteriological parameters in accordance with standards
[22] before and after settling of effluents for one hour and filtration except for bacteriological parameters.
2.2.1. Physicochemical characterization
The measured parameters are pH, temperature, conductivity, turbidity, suspended solids (SS), chemical oxygen
demand COD, sulphate ions SO42-
, nitrite NO2-, nitrate NO3
-, ammonium NH4
+, orthophosphate PO4
3- and
sulfide ions S2-
.
The pH was measured using a pH meter HANNA with a type electrode Senti X 22 according to NF T90.008
[22]. Conductivity and turbidity were measured by ORION type conductivity.
Suspended solids (SS) were determined by centrifuging a wastewater volume according to standard NF T90.105
[22].
Sulfide ions were measured by the indirect method according to standard NF T 60-203 [22].
Ammonium, orthophosphate, nitrate, nitrite, sulfate, and the chemical demand for oxygen COD were carried out
by the spectrophotometric method using a DR/2005HACH at a fixed wavelength. The concentration of a
substance is proportional to its optical density according to the Beer-Lambert law and to the standards approved
by AFNOR T90-101 [22].

JMES, 2017, 8 (4), pp. 1235-1246 1237
2.2.2. Bacteriological characterization of effluents from tanneries
The bacteriological parameters evaluated are biological oxygen demand BOD5, total coliform (TC), faecal
coliform (FC), fecal sterptocoques (SF), total aerobic mesophilic (FMAT) and staphylococci.
The samples were collected in sterilized bottles of 1 L.
The biological oxygen demand in 5 days (BOD5) was measured by the incubation method during 5 days using
an OxiTop IS6 device according to standard NF EN 1899-1 [22].
The counting of FC and TC were held under the indirect method of multiple tube fermentation in lactose broth.
The number was deducted following statistically most probable number method [22].
The enumeration of staphylococci and fecal sterptocoques (SF) were performed respectively on medium
Chapman and Slanetz [22].
Enumeration of total aerobic mesophilic flora and yeast were made respectively on nutrient agar and Peptones
Yeast Glucose (YPG) which is added chloramphenicol and ampicillin as antibiotics to inhibit bacterial growth
[22].
2.2.3. Effluent treatment of the unit unhairing-liming
Effluent treatment of the unhairing-liming unit consists of elimination of sulfur compounds after a preliminary
settling for one hour and filtration in sintered glass of porosity 10 microns and diameter of 70 mm.
In a beaker of 300 mL, a volume of 200 ml of waste water is added to V ml of a FeCl3 solution until
precipitation to a well studied pH as Pourbaix diagram [23]. The two phases are separated mechanically and
only the liquid phase was analyzed.
3. Results and discussion 3.2. Characterization of discharges studied
The results of the physico-chemical and biological characterization of the wastewater of different operating
tanning units studied before and after settling for one hour and filtering are listed in Figures 3 to 12 and in Table
1.
Table 1: Characterization of bacterial wastewater operative units studied of leather tanning.
Effluents Faecal
coliform(FC)
Total coliform
(TC)
Fecal
sterptocoques(SF)
FMAT Staphylococci Yeast
R1 (UFC/mL) 0 0 0 300 0 0
R2
(UFC/mL)
0 0 0 0 0 0
R3
(UFC/mL)
0 0 0 100 0 20
RT
(UFC/mL)
0 0 0 700 0 10
The analysis of the results of the various figures and table shows that wastewater from all study units are a
temperature between 24 and 27 °C and don’t contain a load of fecal origin, but microbial FMAT load (Flora
Mesophilic aerobic Total) 300 CFU/mL for wastewater from the unhairing-liming unit, 100 CFU/mL for
sampling points R3 corresponding wastewater from the deliming-bating unit and 700 CFU/mL for the total
rejection RT (Table 1). This is explained by the concentration of dissolved salts of these discharges. These can
inhibit microbial activity and cause a rise of suspended solids in the effluent [24]. Indeed, from 10 to 12 mg of
chromium (VI) per liter may inhibit the development of soil bacteria. Whereas, the same concentrations of
chromium (III) have no effect on this growth [25].
The rejects of the units unhairing-liming and rinsing are characterized by high alkalinity and those of others
units are slightly alkaline (Figure 2). The values obtained are comparable to those found in previous work on
wastewater from tanneries that have a weakly basic pH [26, 27].

JMES, 2017, 8 (4), pp. 1235-1246 1238
Figure 2 : pH of the wastewater studied operation units of leather tanning before and after settling.
As for the conductivity it ranges between 10 and 30 ms/cm largely exceeding the Moroccan standards [28]. The
largest values are recorded for effluent from units of the unhairing-liming (R1) and deliming-bating (R3)
(Figure 3). These high values of conductivity show a significant use of salt during the tanning process.
Figure 3: Wastewater conductivity of the studied operative units of leather tanning before and after settling.
For suspended solids (SS), they are around 5000 mg / L for wastewater from the all units except those of the
final reject which is almost 10 times higher (Figure 4).
The examination of the nitrogenous load (Figure 5) reveals that the nitrate levels recorded at the R1 discharges
is about 24 mg.L-1
for raw waters and are reduced by about 80% after settling.
For other sampling points, the nitrate is very low compared to Moroccan standards of wastewater discharges
into surface waters [28]. Similarly to the results for nitrite and ammonium ions (Figure 5). The results thus
obtained in terms of nitrate, nitrite and ammonium ions are consistent with those of some authors [29, 17, 1].
Concerning the phosphate load (Figure 6), it is lower than the Moroccan standards of discharges into the
receiving environment for the effluents of all sampling points [28]. Whereas their load of sulfate ions exceeds
the standards for all wastewater studied [28] except for the second sampling point R2 (Figure 7). These high
loads are due to the use of weak acids-based deliming agents to neutralize the lime when the hair and flesh
adhered to the skin are removed [30]. For the final discharge effluent (RT), they are very rich in chromium
sulphate not absorbed by the leather (30-50%) [30]. The same results were found by [17, 19, 31, 32].
0
2
4
6
8
10
12
14
R1 R2 R3 M RT
pH
Sampling point
Before settling
After settling
limit value
0
5000
10000
15000
20000
25000
30000
35000
R1 R2 R3 M RT
(µ
s/cm
)
Sampling point
Before settling
After settling
limit value

JMES, 2017, 8 (4), pp. 1235-1246 1239
Figure 4 : suspending matter from wastewater studied operation units of leather tanning before and after settling.
Figure 5 : Nitrogenous feed of effluents studied before and after settling.
1
10
100
1000
10000
100000
R1 R2 R3 M RT
SS (
mg/
L)
Sampling point
Before settling
After settling
limit value
0
5
10
15
20
25
30
35
R1 R2 R3 M RT
NO
3-(
mg/
L)
Sampling point
before settling
After settling
limit value
0
0.5
1
1.5
2
R1 R2 R3 M RT
NO
2-(
mg/
L)
Sampling point
0
0.5
1
1.5
2
2.5
3
R1 R2 R3 M RT
NH
4+(
mg/
L)
Sampling point

JMES, 2017, 8 (4), pp. 1235-1246 1240
Figure 6 : Orthophosphate ions of the effluent studied before and after settling.
Figure 7 : Sulfate ions of the effluent studied before and after settling.
Similarly to the organic load of the effluent that is evaluated by measuring the chemical oxygen demand COD
and biological oxygen demand BOD5 (Figure 8). The Figure 8 shows that all effluents are a no biodegradable
organic load considerably exceeding the standard Moroccan rejection of wastewater in the receiving
environment [28] (VLRE, 2013); 100 times for COD and 50 times for BOD5. In addition to the report, 9≤ COD
/ BOD 5 ≤50 is much higher (Figure 9) to the normalized value (≈ 2.5) corresponding to the boundary of
organic matter biodegradation. This high load is mainly due to biogenic materials skins and organic chemicals.
The concentrations found in COD are comparable to results obtained by [33, 34].
Figure 8: Chemical and biological oxygen demand (COD and BOD5) of the effluent studied before and after settling.
0
2
4
6
8
10
12
R1 R2 R3 M RTP
O43-
( m
g/L)
Sampling point
Before settling
After settling
limit value
0
500
1000
1500
2000
2500
R1 R2 R3 M RT
SO42
-(
mg/
L)
Sampling point
Before settling
After settling
1
10
100
1000
10000
100000
R1 R2 R3 M RT
CO
D (
mg
O2/
L)
Sampling point
Before settlingAfter settling limit value
0
500
1000
1500
2000
R1 R2 R3 M RT
BO
D5
( m
g O
2/L)
Sampling point
Before settling
After settling
limit value
JMES, 2017, 8 (4), pp. 1235-1246 1241
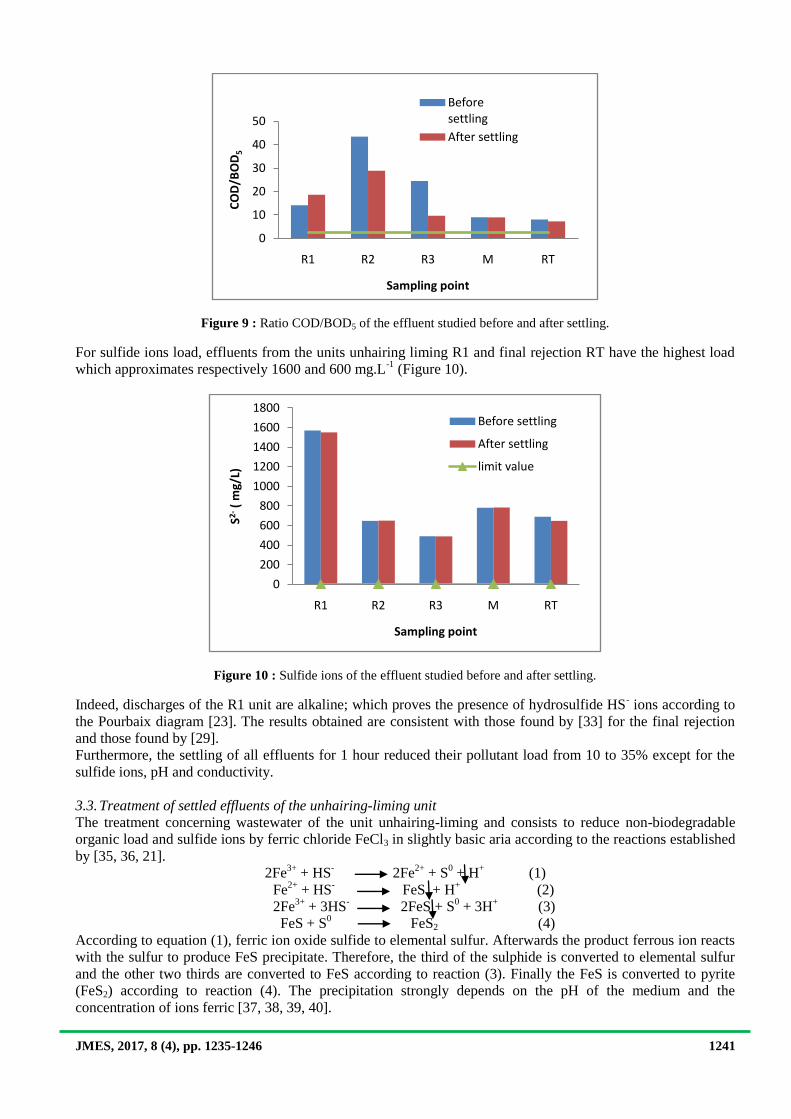
Figure 9 : Ratio COD/BOD5 of the effluent studied before and after settling.
For sulfide ions load, effluents from the units unhairing liming R1 and final rejection RT have the highest load
which approximates respectively 1600 and 600 mg.L-1
(Figure 10).
Figure 10 : Sulfide ions of the effluent studied before and after settling.
Indeed, discharges of the R1 unit are alkaline; which proves the presence of hydrosulfide HS- ions according to
the Pourbaix diagram [23]. The results obtained are consistent with those found by [33] for the final rejection
and those found by [29].
Furthermore, the settling of all effluents for 1 hour reduced their pollutant load from 10 to 35% except for the
sulfide ions, pH and conductivity.
3.3. Treatment of settled effluents of the unhairing-liming unit
The treatment concerning wastewater of the unit unhairing-liming and consists to reduce non-biodegradable
organic load and sulfide ions by ferric chloride FeCl3 in slightly basic aria according to the reactions established
by [35, 36, 21].
2Fe3+
+ HS- 2Fe
2+ + S
0 + H
+ (1)
Fe2+
+ HS-
FeS + H+ (2)
2Fe3+
+ 3HS- 2FeS + S
0 + 3H
+ (3)
FeS + S0
FeS2 (4)
According to equation (1), ferric ion oxide sulfide to elemental sulfur. Afterwards the product ferrous ion reacts
with the sulfur to produce FeS precipitate. Therefore, the third of the sulphide is converted to elemental sulfur
and the other two thirds are converted to FeS according to reaction (3). Finally the FeS is converted to pyrite
(FeS2) according to reaction (4). The precipitation strongly depends on the pH of the medium and the
concentration of ions ferric [37, 38, 39, 40].
0
10
20
30
40
50
R1 R2 R3 M RT
CO
D/B
OD
5
Sampling point
Before settling
After settling
0
200
400
600
800
1000
1200
1400
1600
1800
R1 R2 R3 M RT
S2-(
mg/
L)
Sampling point
Before settling
After settling
limit value

JMES, 2017, 8 (4), pp. 1235-1246 1242
Analysis of the results of Figure 11 reveals that the removal rate of sulphide ions and the chemical oxygen
demand at the pH of the medium increases with the concentration of ferric ions (Fe3+
) to stabilize at a value of
about 85% and 89 % respectively for a ferric ions concentration of 1.4 mol L-1
. This is explained by the
presence of hydrogenosulfide (HS-) ions according to the Pourbaix diagram Figure 12 [23] and the oxidation of
sulphide to elemental sulfur according to reaction (1).
Figure 11 : Elimination rate of sulfide ions in terms of the concentration of ferric ions at the pH of the medium (Operating
Conditions: pH = 12.14, T = 24 ° C, [S2-
]0 = 1570.94 mg.L-1
).
Figure 12 : Potential-pH diagram of the sulfur [23].
3.3.1. pH optimizing
The pH aria adjustment was conducted by addition of sulfuric acid (H2SO4) at a concentration of 2 mol.L-1
to
attain pH values between 7 and 12.Optimization of pH was studied for different ferric ions concentrations
ranging from 0.2 to 1.8 mol.L-1
(Figure 13).
Analysis of the results listed in Figure 13 shows that the no biodegradable organic matter evaluated by
measuring the COD and sulfide ions has the same tendency of elimination depending on the pH and
concentration of ferric ions. However, the rate of COD removal is greater than that of the sulfide ions to all pH
with the exception of the pH = 9. It reaches 90% for pH 7, 8 and 11 at concentrations of ferric ion 1 mol.L-1
; 1.2
and 0.8 mol.L-1
respectively. As to sulfide ions, there is a reduction of 90% and 84% only at pH = 7 and 8 for
ferric ions concentrations of 1.6 and 1.8 mol.L-1
respectively.
Figure 14 summarizes the results treatment of unhairing-liming effluent unit with a concentration of ferric
chloride (1.4 mol.L-1
) depending on the pH of the medium, and allowed us to conclude that the optimum pH is
between 7 and 8. The Pourbaix diagram confirms the result obtained [23]. Note further that the final pH values
were lower than initial values. This is due to the consumption of sulfide ions by ferric ions.
0
20
40
60
80
100
0.2 0.4 0.6 0.8 1 1.2 1.4 1.6 1.8
Re
mo
val r
ate
(%
)
[Fe3+] (mol.L-1)
Sulfide ions
Chemical oxygen demand

JMES, 2017, 8 (4), pp. 1235-1246 1243
Figure 13 : COD and sulfide ions removal rate depending on the pH and the concentration of Fe3+
ions.
Figure 14 : Effect of pH on the removal of sulfide ions and COD of effluent unhairing-liming.
3.3.2. Concentration of ferric ions optimizing
The removal of sulfide ions and COD of the unhairing-liming effluent of the hides was evaluated at various
concentrations of ferric chloride FeCl3 to pH 8 and are illustrated in Figure 15.
0
20
40
60
80
100
0.2 0.4 0.6 0.8 1 1.2 1.4 1.6 1.8
Re
mo
val r
ate
(%
)
[Fe3+] (mol.L-1)
pH7
Sulfide ions
Chemical oxygen demand
0
20
40
60
80
100
0.2 0.4 0.6 0.8 1 1.2 1.4 1.6 1.8
Re
mo
val r
ate
(%
)
[Fe3+] (mol.L-1)
pH 8
Sulfide ions
Chemical oxygen demand
0
20
40
60
80
100
0.2 0.4 0.6 0.8 1 1.2 1.4 1.6 1.8
Re
mo
val r
ate
(%
)
[Fe3+] (mol.L-1)
pH 9
Sulfide ions 0
50
100
0.2 0.4 0.6 0.8 1 1.2 1.4 1.6 1.8Re
mo
val r
ate
(%
)
[Fe3+] (mol.L-1)
pH 10
Sulfide ions
Chemical oxygen demand
0
20
40
60
80
100
0.2 0.4 0.6 0.8 1 1.2 1.4 1.6 1.8
Re
mo
val r
ate
(%
)
[Fe3+] (mol.L-1)
pH 11
Sulfide ionsChemical oxygen demand
0
20
40
60
80
100
0.2 0.4 0.6 0.8 1 1.2 1.4 1.6 1.8
Re
mo
val r
ate
(%
)
[Fe3+] (mol.L-1)
pH12
Sulfide ionsChemical oxygen demand
0
20
40
60
80
100
7 8 9 10 11 12
Re
mo
val r
ate
(%
)
pH
Sulfide ions
Chemical oxygen demand

JMES, 2017, 8 (4), pp. 1235-1246 1244
Figure 15 : Effect of the ferric ions concentration on the removal of sulfide ions and COD.
The curves of Figures 14 and 15 show that at pH 8, the two parameters are stabilizing at the same rate of
reduction by about 90% with Fe3+
ions concentration of 1.4 mol L-1
.
3.3.3. Effect of time and the stirring speed
In addition to optimizing the pH and the concentration of ferric ions, we sought to improve the reduction yields
of sulfide ions and the chemical oxygen demand (COD) depending of the duration and the rate of agitation. The
main results are shown in the curves 16 and 17 which show that the maximum removal is obtained after 15
minutes with a stirring speed of 150 rpm.
Figure 16 : Effect of the stirring time on the removal of sulfide ions and chemical oxygen demand.
Figure 17 : Effect of the stirring speed on the removal of sulfide ions and chemical oxygen demand.
0
20
40
60
80
100
0.2 0.4 0.6 0.8 1 1.2 1.4 1.6 1.8
Re
mo
val r
ate
(%
)
[Fe3+] ( mol.L-1)
Sulfide ions
Chemical oxygen demand
0
20
40
60
80
100
10 15 20 25 30 35
Re
mo
val r
ate
(%
)
Stirring time (min)
Sulfide ions
Chemical oxygen demand
0
20
40
60
80
100
50 100 150 200 250 300
Re
mo
val r
ate
(%
)
Stirring speed ( rpm)
Sulfide ions
Chemical oxygen demand

JMES, 2017, 8 (4), pp. 1235-1246 1245
Beyond the 150 rpm, the rate of removal of the sulphide ions and chemical oxygen demand stops increasing and
then stabilizes. This period of 15 minutes and a stirring speed of 150 rpm would therefore the time and speed
necessary for the iron flocs adsorb a fraction of the pollution expressed in terms of the chemical Demand
oxygen (COD) and ions sulfide (S2-
).
Conclusion The study of tannery effluent has led to the following conclusions:
The physicochemical and bacteriological characterization carried out for the wastewater of different operating
units and the final rejection before and after settling for one hour and filtration, shows that the wastewater from
all units are basic, pH ranging from 8 to 12, temperature between 24 °C and 27 °C, don’t contain any load of
the nitrogen, phosphate and fecal. However, wastewater from all units are characterized by FMAT microbial
load, heavy load of the suspended matter (SS), mineral and organic matter no biodegradable and sulphide and
sulphate for especially unhairing-liming units (R1).
The treatment of settled sewage of the unit unhairing-liming by ferric chloride under optimal pH conditions (8)
and ferric ions concentration (1.4 mol.L-1
) has reduced the load organic and a desulfurization by about 90%.
In conclusion, the wastewater from the unhairing-liming unit of the hides can be separated from those the other
operating units and treated separately by the precipitation method. This solution could contribute a part in the
protection of wildlife and flora of the intense pollution from sulfide ions. On the other hand, it will participate in
the reduction of the emission of greenhouse gases (Hydrogen Sulfide).
Acknowledgments-The authors gratefully acknowledge the Tannery Adam Group, the Biotechnology Laboratory of the Faculty
of Sciences Dhar El Mahraz and process engineering laboratory of the Superior School of Technology, University Sidi Mohamed Ben
Abdallah, Fez, MOROCCO for their cooperation and for technical assistance during the study.
References:
1. Sawadogo R., Guiguemde I., Diendere F., Diarra J., Bary A., J. Biol. Chem. Sci. 6 (2012) 7087.
2. Aboulhassan MA., Souabi S., Yaacoubi A., Zaim N., Bouthir FZ., J. Water Sci. 21 (2008) 463-465.
3. Bajza Z., Hitrec P., Muzic M., J. Desalination. 171 (2004) 13.
4. Ramesh Babu R., Bhadrinarayana N.S., Meera Sheriffa Begum K.M., Anantharaman N., J. of the University
of Chemical Technology and Metallurgy. 2 (2007) 201.
5. Dantas Ne to A.A., Dantas C., Ale ncar Mo ura M.C.P., J. Hazardous Mater. B114 (2004) 115.
6. Hydar S., Aziz J.A : J. Eng. Technol. 27 (2008) 441.
7. Xin H., Yun Z., Zhuhong D., Tijian W., Hongzhen L., Yuanyuan S., Jichun W., J. Atmospheric Environment.
57 (2012) 146-152.
8. Zhao Y.G., Shen H.Y., Pan S.D., Hu M.Q., Xia Q.H., J. Mater. Sci. 45 (2010) 5291.
9. Luther S., Brogfeld N., Kim J., Parsons J.G., J. Colloid Interface Sci. 400 (2013) 97.
10. Xiaofang T., Xianchao G., Feng Y., Yeqing L., Mao J.D., Lixiang Z., J. Geoderma. 159 (3) (2010) 270.
11. Inui T., Fujita K., Kitano M., Nakamura T., J. Anal. Sci. 26 (2010) 1093.
12. Kim M., Stripeikis J., Tudino M., J. Spectrochim. Acta Part B. 64 (2009) 500.
13. World Health Organization (WHO), Human Health Aspects.(2003) 53.
14. Report of US Environmental Protection Agency (USEPA), Toxicological Review of Hydrogen Sulfide,
USA (2003) https://www3.epa.gov/
15. Chena Y., Wang R., J. Respiratory Physiology et Neurobiology. 184 (2012) 130.
16. Beauchamp R.J., Bus J.S., Popp J.A., Boreiko C.J., Andjelkovich D.A., J. Toxicol. 13 (1984) 25.
17. Fahim N.F., Barsoum B.N., Eid A.E., Khalil M.S., J. Hazardous Materials. B136 (2006) 303.
18. Ayoub G.M., Hamzeh A., Semerjian L., J. Desalination. 273 (2011) 359.
19. Sahu S.K., Meshram. P., Pandey. B.D., Kumar. V., Mankhand. T.R., J. Hydrometallurgy. 99 (2009) 170.
20. Gutierrez O., Park D., Sharma K.R. and Yuan Z., J. Water Research. 44 (2010) 3467.
21. Nielsen A.H., Lens P., Vollertsen J. and Hvitved-Jacobsen T., J. Water Research. 39 (2005) 2747.
22. Rodier J., L’analyse de l’eau – eaux naturelles, eaux résiduaires, eau de mer, 9ème édition, Paris, Dunod,
(2009)1475.
23. Pourbaix M., C.R. 3rd Meeting CITCE. Berne (1951) 128.
24. Eckenfelder W. W., Edition Lavoisier technical and document. (1982) 7 - 8 – 9.
25. Ross D.S., Sjogren R.F., Bartlett R.J., J. Environ. Qual. 10, 2 (1981) 145.

JMES, 2017, 8 (4), pp. 1235-1246 1246
26. Djermakoye MM. Thesis of Pharmacy, University of Bamako, Mali. (2005) 50.
27. Cooman K., Gajardo M., Nieto J., Bornhardt C., Vidal G., J. Environ. Toxicol. 17 (2003). 45.
28. Official Bulletin of the Minister of the Interior, the Minister of Energy, Mines, Water and Environment., the
Minister of Industry. (2013) N° 2942-13.
29. Vidal G., Nieto J., Coomana K., Gajardo M., Bornhardt C., J. Hazardous Materials. B112 (2004) 143.
30. Bosnic M., Buljan J., Daniels R.P., Rajamani S., O.N.U.D.I (2003) 220.
31. Galiana-Aleixandre M.V., Iborra-Clar A., Bes-Pià A., Mendoza-Roca J.A., Cuartas-Uribe B., Iborra-Clar
M.I., J. Desalination. 179 (2005) 307.
32. Galiana-Aleixandre M.V., Mendoza-Roca J.A., Bes-Pià A., J. Cleaner Production. 19 (2011) 91.
33. Sundarapandiyan S., Chandrasekar R., Ramanaiah B., Krishnan S., Saravanan P., J. Hazard Mater. (2010)
180.
34. Mendoza-Roca J.A., Galiana-Aleixandre M.V., Lora-García J., Bes-Piá A., J. Separation and Purification
Technology. 70 (2010) 296.
35. Ge H., Zhang L., Batstone D.J., Keller J. and Yuan Z., J. Environmental Engineering. 139 (2012) 594.
36. Nielsen P.H. and Keiding K., J. Water Research. 32 (1998) 313.
37. Charerntanyarak L., Water Sci. Technol. 39 (1999) 135.
38. Subbiah R.M., Sastry C.A., Agamuthu P., Environ. Prog. 19 (2000) 299.
39. Veeken A.H.M., Akoto L., Hulshoff P.L.W., Weijma J., Water Res. 37 (2003) 3709.
40. Jin A., Pasuta T., Piyarat C., J. Hazardous Materials. 141 (2007) 5.
(2017) ; http://www.jmaterenvironsci.com