optimization of fixation methods for observation of ... · optimization of fixation methods for...
TRANSCRIPT
METHODS AND PROTOCOLS
Optimization of fixation methods for observation of bacterialcell morphology and surface ultrastructures by atomicforce microscopy
Yuanqing Chao & Tong Zhang
Received: 10 June 2011 /Revised: 6 August 2011 /Accepted: 13 August 2011 /Published online: 1 September 2011# The Author(s) 2011. This article is published with open access at Springerlink.com
Abstract Fixation ability of five common fixation solutions,including 2.5% glutaraldehyde, 10% formalin, 4% paraformal-dehyde, methanol/acetone (1:1), and ethanol/acetic acid (3:1)were evaluated by using atomic force microscopy in the presentstudy. Three model bacteria, i.e., Escherichia coli, Pseudomo-nas putida, and Bacillus subtilis were applied to observe theabove fixation methods for the morphology preservation ofbacterial cells and surface ultrastructures. All the fixationmethods could effectively preserve cell morphology. However,for preserving bacterial surface ultrastructures, the methodsapplying aldehyde fixations performed much better than thoseusing alcohols, since the alcohols could detach the surfacefilaments (i.e., flagella and pili) significantly. Based on thequantitative and qualitative assessments, the 2.5% glutaralde-hyde was proposed as a promising fixation solution both forobserving morphology of both bacterial cell and surfaceultrastructures, while the methonal/acetone mixture was theworst fixation solution which may obtain unreliable results.
Keywords Fixation methods . Cell morphology .
Ultrastructure . Atomic force microscopy
Introduction
The observation of the morphology of bacterial cell and theirultrastructures is fundamental for understanding the structure
and behavior of bacteria, since morphology is one way forbacteria to cope with their environment and gain a competitiveadvantage (Young 2007). To facilitate accurate observation,various fixation methods were widely applied to fix cells(Moloney et al. 2004). The main objectives of fixation were toinhibit cellular autolysis, to preserve cellular components andmorphology, and to present cells with a distinct microscopicalappearance (Paavilainen et al. 2010). Fixation methods can bedivided into two groups: additive and denaturing fixations (St-Laurent et al. 2006). Additive fixation solutions (also calledcross-linking fixations) contain various aldehydes, includingformaldehyde, paraformaldehyde, glutaraldehyde, etc., andcan create covalent chemical bonds between proteins (Dapson2007). This method can preserve the natural structure ofproteins, i.e., secondary and tertiary structures (Meade et al.2010). Another group is the denaturing (or precipitating)fixations. These methods can denature proteins by reducingtheir solubility and/or disrupting the hydrophobic interactions,and thus modify the tertiary structures of proteins as well asinactivate enzymes (St-Laurent et al. 2006). Alcohols, such asmethanol and ethanol, are commonly used for denaturingfixation. However, alcohols are seldom solely applied sincethey can induce serious cell shrinkage. Other denaturingchemicals, like acetone and acetic acid, are usually combinedwith alcohols to enhance the fixation performance (Moloneyet al. 2004).
To select the promising fixation methods, a numberof studies have been conducted to evaluate the perfor-mance of different methods in fixing various cells or tissues(Suthipintawong et al. 1996; Hoetelmans et al. 2001;Moloney et al. 2004; Vekemans et al. 2004; Celie et al.2005; St-Laurent et al. 2006; Meade et al. 2010). Unfortu-nately, the above studies mainly focused on the cells ortissues from animals or human. The effects of differentfixation methods on bacterial morphology were rarelystudied, and thus research gaps still remained in this issue.
Electronic supplementary material The online version of this article(doi:10.1007/s00253-011-3551-5) contains supplementary material,which is available to authorized users.
Y. Chao : T. Zhang (*)Environmental Biotechnology Laboratory,The University of Hong Kong,Pokfulam Road,Hong Kong, SAR, Chinae-mail: [email protected]
Appl Microbiol Biotechnol (2011) 92:381–392DOI 10.1007/s00253-011-3551-5

Microscopical methods were commonly used in previousstudies to evaluate the performance of the fixation methods,including light microscopy (St-Laurent et al. 2006), reflectioncontrast microscopy (Hoetelmans et al. 2001), fluorescencemicroscopy (Celie et al. 2005), Raman microscopy (Meade etal. 2010), electron microscopy (Hoetelmans et al. 2001), aswell as atomic force microscopy (Moloney et al. 2004).Atomic force microscopy (AFM) has been widely used in allfields of surface science since its invention in 1986, includingmicrobiological studies (Bolshakova et al. 2004). Comparingwith other traditional microscopes, one of AFM’s advantagesis acquiring three-dimensional morphological images atnanometer or sub-nanometer scales under either dry or wetconditions (Gaboriaud and Dufrêne 2007). This providesgreat application potentials for quantitative measurements ofthe morphology of bacterial cells and surface ultrastructures.A few previous studies evaluated the effects of differentAFM scanning modes on the cell morphology of severalbacteria (Camesano et al. 2000; Bolshakova et al. 2001;Pelling et al. 2005; Arce et al. 2009). Moreover, the bacterialultrastructures, including flagella (Touhami et al. 2006), pili(Pelling et al. 2005; Touhami et al. 2006; Arce et al. 2009),and capsules (Stukalov et al. 2008), were also observed andquantified, based on the exquisite sensitivity and high spatialresolution of AFM. However, as far as we know, studies wererarely conducted to evaluate the effects of fixation methodson morphology of bacterial cells and ultrastructures by usingAFM.
To fill the mentioned research gaps, the present studywas conducted to determine the effects of different fixationmethods on the morphology of bacterial cell and itsultrastructures by using AFM and to evaluate the fixationability of applied methods via both qualitative andquantitative assessments.
Materials and methods
Bacterial strains and culture
Three reference bacterial strains were used in the presentstudy. Two Gram-negative bacteria, Escherichia coli wild-type strain K-12 and Pseudomonas putida DSM 291 typestrain, were purchased from the E. coli Genetic Stock Center(Department of Biology, Yale University) and DeutscheSammlung von Mikroorganismen und Zellkulturen GmbH(DSMZ), respectively. Gram-positive bacterium, Bacillussubtilis ATCC 6633, was purchased from Difco Laboratories(Detroit, USA).
The bacteria were cultivated at 37°C and 150 rpm insterilized (121°C for 20 min) Luria–Bertani (LB) medium.Then, the cells were harvested in the Log phase at aconcentration equivalent to an optical density at 600 nm
(OD600 nm) value of ∼0.1. These bacterial cells were thenused for further experiments immediately.
Substrata preparation
Glass slide was chosen as the substratum for AFMmeasurement in the present study. Glass slides were firstlyimmersed in ethanol/HCl (v/v 70/1) solution overnight.After that, slides were washed by sonication for 10 min insterilized DI water. This procedure was repeated twice.Then, the washed slides were placed in sterilized Petridishes and dried at room temperature for 12 h. Finally, theprepared glass slides were stored in a desiccator before use.
Fixation methods
Before fixation, bacterial cells were washed twice inphosphate-buffered saline (PBS, 8.475 g NaCl, 1.093 gNa2HPO4, and 0.276 g NaH2PO4 in 1 L DI water; pH 7.4).Five common fixation methods (Moloney et al. 2004; Celieet al. 2005) were applied to fix the washed cells, including2.5% glutaraldehyde in PBS for 2 h, 4% paraformaldehydein PBS for 30 min, 10% formalin in PBS for 10 min,methanol/acetone (1:1) for 10 min, and ethanol/acetic acid(3:1) for 10 min. All fixations were conducted at roomtemperature. After fixation, the cells were washed twice inPBS and then re-suspended in sterilized ultrapure water toavoid salts crystallization during dry process and subse-quent influence on AFM measurement. Finally, 100 μL ofprepared bacterial solution was dripped onto the glass slideand air-dried. All the samples were stored at 4°C beforeAFM measurement. All fixation methods were conductedwith two to three duplicates.
AFM measurements
AFM images were acquired by using tapping mode of JPKNanoWizard AFM (JPK Instruments, Germany). Siliconcantilever Tap300 (Budgetsensors, Bulgaria) with a reso-nance frequency of 300 kHz and a spring constant of 40 N/m was applied to analyze the air-dried samples in air. Thetip radius of cantilever is less than 10 nm and opening angleis between 40° and 50° according to the manufacturer. Todecrease the applied force between cantilever tip andbacteria to minimize the influence to the bacterial morphologyduring AFM scanning, the amplitude set point was maintainedat a high level relative to the free amplitude of the cantilever(Camesano et al. 2000), since the applied force to samplefrom cantilever is negatively correlated with the amplitudevalue under AFM tapping mode. Measurements were startedby scanning a random area of 50×50 μm2 which couldcontain several to dozens of bacterial cells. These imageswere used to evaluate the morphology of bacterial cells.
382 Appl Microbiol Biotechnol (2011) 92:381–392
Then, the scan size was decreased gradually until bacterialpili or flagella could be observed clearly.
Amplitude and phase images were recorded simulta-neously with height images. Height images revealed thesample topography and were applied to quantify themorphology of bacterial cells, flagella, and pili. Heightimages were also used to calculate the roughness ofbacterial surface based on root mean square (RMS) values,i.e., the standard deviation of all the height values withinthe given area (Camesano et al. 2000). RMS roughness waswidely used as an important parameter to describe bacterialmorphology in previous studies (Auerbach et al. 2000;Camesano et al. 2000; Pelling et al. 2005; Alsteens et al.2008; Andre et al. 2010). The measurements wereconducted over two different areas (0.5×0.5 μm2) on thesurface of one individual cell, and there were 10 to 20measurement duplicates for each bacterium/fixation combi-nation. Amplitude images were captured to analyze surfacefeatures since they have higher sensitivity than heightimages (Pelling et al. 2005). Phase images were applied toreveal the sample heterogeneity since the phase signal issensitive to properties of the tip-sample interaction andmay show overall mechanical, chemical, and topographicproperties of the samples (Camesano et al. 2000). Morethan eight images were captured for each treatment. Ten totwenty cells, flagella, and pili were taken into morphologyanalysis for each treatment.
Noticeably, due to the “side-wall” artifact (Fig. S1), theimage width of bacterial filaments (e.g., flagella and pili)might be overestimated comparing to their true width(Bolshakova et al. 2004; Harada et al. 2008; Kuznetsovand McPherson 2011). The error between the image andtrue width is a function of the width of the cantilever tip(Kuznetsov and McPherson 2011). In the present study, theerror was predicted and the true width of bacterial filamentswas corrected to accurately evaluate the fixation ability(please refer to the Supporting information for details). Forbacterial cells, no correction was conducted since the “side-wall” artifact could be negligible at micron scale.
Results
Effect of fixation methods on cell morphology
As shown in Fig. 1, single E. coli (Fig. 1a) and P. putida(Fig. 1b) cells were evenly separated on the glass slide,while B. subtilis formed multicellular chains (Fig. 1c). Themorphological data (Table 1) showed that the fixed andunfixed cells were flattened on the glass slide since theheight values of bacteria were lower than the width values.Thus, to quantitatively evaluate the effect of fixationmethods on bacterial morphology, the width/height ratio
(W/H) was firstly used as an index to reflect thepreservation of bacterial cell shape after fixation since thenatural W/H of an intact cell is about one for rod-shapedbacteria. The results in Table 1 showed that all the W/Hvalues of cells after the fixation treatments were signifi-cantly lower (P<0.01) than those of no fixation treatmentsexcept for P. putida (P=0.09) and B. subtilis (P=0.87)treated by the methanol/acetone mixture. This revealed thatthe applied fixation methods could reduce the influence ofdehydration during air-dry process and therefore effectivelymaintain cell morphology. Among these fixation solutions,the ethanol/acetic acid solution performed the best since theW/H ratios of cells fixed by it was the closest to 1,especially for P. putida and B. subtilis. The 2.5% glutaral-dehyde, 10% formalin, and 4% paraformaldehyde solutionsshowed their medium preservation ability, while themethanol/acetone solution had the highest W/H andtherefore showed the worst performance among the fivefixation methods.
Bacterial surface roughness, in terms of the RMS value,was another quantitative index to evaluate the cell surfacemorphology. The results in Table 1 showed that the testedbacteria had rough surfaces. For the two Gram-negativestrains, i.e., E. coli and P. putida, their RMS roughnessvalues fells into the similar ranges, i.e., 9.1–20 and 8.1–21 nm, respectively. However, the roughness of Gram-positive strain B. subtilis was in a higher range varyingfrom 18 to 40 nm.
Effect of fixation methods on cell surface ultrastructures
Several cellular ultrastructures were detected from AFMimages, including flagella, pili, and extracellular polymericsubstance (EPS). To eliminate the “side-wall” artifacts, thecorrected widths for bacterial filaments (i.e., flagella andpili) were calculated according to the image width and tipgeometry of applied cantilever (please refer to Supportinginformation for details). Multiple flagella could be observedfor all the tested bacteria, having a width of 40–90 nm anda height of 8–12 nm (Table 2). The peritrichous E. coli andB. subtilis had flagella all round the cell while the flagellaof P. putida were only found at the cell pole. The flagella ofbacterial cells fixed by 2.5% glutaraldehyde and 10%formalin were preserved better than those without fixation(Fig. 2). The flagella could also be detected in the treatmentusing 4% paraformaldehyde. However, the amount offlagella per cell decreased significantly and many of themwere detached from the cell body or had incompletestructure (white arrows in Fig. 2 A-d and C-d). For themethanol/acetone and ethanol/acetic acid groups, theflagella totally disappeared.
Pili are another filamentous structure and only detectedfrom E. coli. There were several distinct differences between
Appl Microbiol Biotechnol (2011) 92:381–392 383

pili and flagella in AFM images. First, the size of pili wassignificantly smaller than flagella with corrected widths of17–33 nm and heights of 4.3–6.2 nm, respectively (Table 2).Second, the pili had linear structure while flagella were
helical filaments. Third, the length of pili was significantlyshorter than that of flagella (Figs. 2 and 3). The lengths of E.coli flagella and pili were 2.7±0.69 and 0.82±0.21 μm,respectively (P<0.001; n=10). The results showed that the
-100
100
300
500
0 1000 2000 3000
Distance across cell (nm)
Hei
ght (
nm)
-100
100
300
500
0 1000 2000 3000
Distance across cell (nm)
Hei
ght (
nm)
-100
100
300
500
0 1000 2000 3000 4000
Distance across cell (nm)
Hei
ght (
nm)
No fixation 2.5% glutaraldehyde
10% formalin 4% paraformaldehyde
Methanol/Acetone Ethanol/Acetic acid
Fig. 1 AFM height images of E. coli (a), P. putida (b) and B. subtilis(c) which were air-dried only (a) and fixed by 2.5% glutaraldehyde(b), 10% formalin (c), 4% paraformaldehyde (d), the methanol/
acetone (e) and ethanol/acetic acid (f) solutions. The profiles of blacklines in images were shown in the figures (A-g, B-g, and C-g) at thebottom
384 Appl Microbiol Biotechnol (2011) 92:381–392
pili fixed by 4% paraformaldehyde, methanol/acetone, andethanol/acetic acid totally disappeared in AFM images (Table3). For the treatment using 10% formalin, most of pili werealso detached from the cell body (Fig. 3c). However, the
detached pili still remained on the substrata surface, and thustheir morphology could be measured. The 2.5% glutaralde-hyde solution showed the best performance since the piliwere intact and maintained in the natural morphology.
Table 1 Cell morphology of E. coli, P. putida, and B. subtilis
Bacteria Fixations Length (μm) Width (μm) Height (μm) W/H ratio RMS roughness (nm)a No. of cells
E. coli No fixation 3.7±1.1 1.7±0.56 0.17±0.023 10±3.6 9.8±2.6 10
2.5% Glutaraldehyde 2.9±0.35 1.2±0.28 0.29±0.042 4.0±0.77 18±3.2 10
10% Formalin 2.9±0.39 1.2±0.12 0.40±0.075 3.0±0.64 20±4.9 16
4% Paraformaldehyde 3.3±0.43 1.2±0.090 0.31±0.049 4.0±0.61 20±7.2 18
Methanol/acetone 3.3±0.44 1.4±0.047 0.18±0.014 7.5±0.58 9.1±1.9 20
Ethanol/acetic acid 2.8±0.33 1.1±0.13 0.37±0.050 3.0±0.47 19±5.0 20
P. putida No fixation 3.5±0.32 1.1±0.10 0.16±0.020 6.6±0.76 8.1±3.6 15
2.5% Glutaraldehyde 3.4±0.40 1.0±0.11 0.32±0.043 3.2±0.50 21±11 16
10% Formalin 3.3±0.33 1.2±0.13 0.30±0.039 3.9±0.73 17±7.2 19
4% Paraformaldehyde 3.4±0.40 1.2±0.10 0.27±0.042 4.5±0.65 17±4.1 20
Methanol/acetone 3.3±0.31 1.1±0.10 0.19±0.029 6.1±1.2 13±5.7 19
Ethanol/acetic acid 2.9±0.32 0.89±0.17 0.48±0.060 1.8±0.26 23±4.8 17
B. subtilis No fixation 4.9±0.86 1.1±0.20 0.20±0.035 5.2±0.96 23±7.1 17
2.5% Glutaraldehyde 4.8±0.85 0.96±0.12 0.35±0.049 2.8±0.62 26±7.9 20
10% Formalin 4.8±0.59 0.94±0.14 0.35±0.031 2.7±0.47 22±7.4 13
4% Paraformaldehyde 5.0±1.3 1.0±0.10 0.29±0.040 3.5±0.48 28±13 17
Methanol/acetone 4.8±0.91 1.0±0.12 0.20±0.042 5.2±1.3 18±6.6 12
Ethanol/acetic acid 4.7±0.80 0.86±0.065 0.42±0.070 2.1±0.44 40±14 16
a 0.5×0.5 μm2 area was used to measure the cell surface RMS roughness
Table 2 Flagellar morphology of E. coli, P. putida, and B. subtilis
Bacteria Fixations Image width (nm) Corrected width (nm) Height (nm) W/H ratio No. of flagella
E. coli No fixation 105±16 88±16 8.9±1.1 10±1.8 10
2.5% Glutaraldehyde 55±4.2 37±4.1 9.9±1.9 3.9±0.86 12
10% Formalin 77±9.8 59±9.6 10±1.4 5.7±1.1 15
4% Paraformaldehyde 81±11 64±11 9.6±1.5 6.7±1.1 11
Methanol/acetone N. D.a
Ethanol/acetic acid N. D.
P. putida No fixation 86±14 69±14 9.5±1.3 7.4±1.8 15
2.5% Glutaraldehyde 77±15 59±15 12±1.6 5.1±1.5 13
10% Formalin 84±12 67±12 8.7±1.9 8.0±2.0 13
4% Paraformaldehyde 65±8.8 48±8.7 10±1.2 4.7±1.0 14
Methanol/acetone N. D.
Ethanol/acetic acid N. D.
B. subtilis No fixation 94±16 77±16 8.2±1.7 9.6±2.0 15
2.5% Glutaraldehyde 80±11 63±11 9.8±1.0 6.5±1.2 20
10% Formalin 66±11 49±11 9.3±1.7 5.5±1.7 12
4% Paraformaldehyde 83±11 67±11 8.6±1.0 7.8±0.96 12
Methanol/acetone N. D.
Ethanol/acetic acid N. D.
a No detection of flagella
Appl Microbiol Biotechnol (2011) 92:381–392 385
-2
0
2
4
6
8
10
12
0 500 1000 1500 2000
Distance across sample (nm)
Hei
ght
(nm
)
-2
0
2
4
6
8
10
12
14
16
18
0 500 1000 1500 2000Distance across sample (nm)
Hei
ght
(nm
)
-2
0
2
4
6
8
10
12
0 500 1000 1500 2000
Distance across sample (nm)
Hei
ght
(nm
)
-2
-1
0
1
2
3
4
5
6
0 500 1000 1500 2000Distance across sample (nm)
Hei
ght
(nm
)
-4
-2
0
2
4
6
8
10
12
0 500 1000 1500 2000
Distance across sample (nm)
Hei
ght
(nm
)
-2
0
2
4
6
8
10
12
14
0 500 1000 1500 2000
Distance across sample (nm)
Hei
ght
(nm
)
-4
-2
0
2
4
6
8
10
0 500 1000 1500 2000
Distance across sample (nm)
Hei
ght
(nm
)
-2
0
2
4
6
8
10
12
14
0 500 1000 1500 2000
Distance across sample (nm)
Hei
ght
(nm
)
-4
-2
0
2
4
6
8
10
0 500 1000 1500 2000
Distance across sample (nm)
Hei
ght
(nm
)
-2
0
2
4
6
8
10
12
14
0 500 1000 1500 2000
Distance across sample (nm)
Hei
ght
(nm
)
-6
-4
-2
0
2
4
6
8
0 500 1000 1500 2000
Distance across sample (nm)
Hei
ght
(nm
)
-10
-8
-6
-4
-2
0
2
4
6
8
0 500 1000 1500 2000
Distance across sample (nm)
Hei
ght
(nm
)
Fig. 2 AFM amplitude images of E. coli (a), P. putida (b), and B.subtilis (c) which were air-dried only (a) and fixed by 2.5%glutaraldehyde (b), 10% formalin (c), and 4% paraformaldehyde (d).The right images (a’, b’, c’, and d’) showed the profiles of black linesobtained from corresponding height images (not shown here). The
white arrows in the images of A-d and C-d showed a detachedflagellum from E. coli cell body and the incomplete flagellar structureon B. subtilis cell, respectively. The black arrow in A-c indicated thecoating artifacts
386 Appl Microbiol Biotechnol (2011) 92:381–392

EPS could also be observed in the phase images since itsphysicochemical and topographic properties were differentfrom bacterial cells (Fig. 4). The EPS of E. coli and B.subtilis was observed in several fixation treatments, includ-ing 10% formalin, 4% paraformaldehyde, and the methanol/acetone solutions (Figs. 1, 2, and 4). This indicated otherfixation methods using 2.5% glutaraldehyde, and theethanol/acetic acid solution significantly removed the EPS.
This is a good point for observing the morphology ofbacterial cells and surface ultrastructures since (1) the EPSmight interfere the cell edge estimation and consequentlyaffect the morphology observation, (2) other ultrastructureslike flagella and pili might be covered by the dehydratedEPS and thus could not be observed in AFM images, and (3)EPS might contaminate the cantilever tip during scanningand finally deteriorate the image quality.
-1
0
1
2
3
4
0 100 200 300 400 500Distance across sample (nm)
Hei
ght
(nm
)
a-c’a-a’
200nm
a-b’
200nm
-2
0
2
4
6
8
0 100 200 300 400 500
Distance across sample (nm)
Hei
ght
(nm
)
b-c’b-a’
200nm
b-b’
200nm
-2
0
2
4
6
8
0 100 200 300 400 500
Distance across sample (nm)
Hei
ght
(nm
)
c-c’c-a’
500nm
c-b’
500nm
Fig. 3 AFM height (a’) andphase (b’) images of E. coliwhich were air-dried only (a)and fixed by 2.5% glutaralde-hyde (b), 10% formalin (c). Theright images (c’) showed theprofiles of black lines in heightimages (a). The white arrows inc-b’ showed the detached pilifrom cell body. The black arrowin c-b’ indicated the coatingartifacts
Table 3 Pili morphology of E. coli
Fixations Image width (nm) Corrected width (nm) Height (nm) W/H ratio No. of pili
No fixation 48±9.1 33±9.0 4.3±0.46 7.8±1.8 11
2.5% Glutaraldehyde 32±2.5 17±2.4 6.2±0.51 2.7±0.45 10
10% Formalin 38±11 23±11 4.8±0.94 5.2±3.1 15
4% Paraformaldehyde N. D.a
Methanol/acetone N. D.
Ethanol/acetic acid N. D.
a No detection of pili
Appl Microbiol Biotechnol (2011) 92:381–392 387
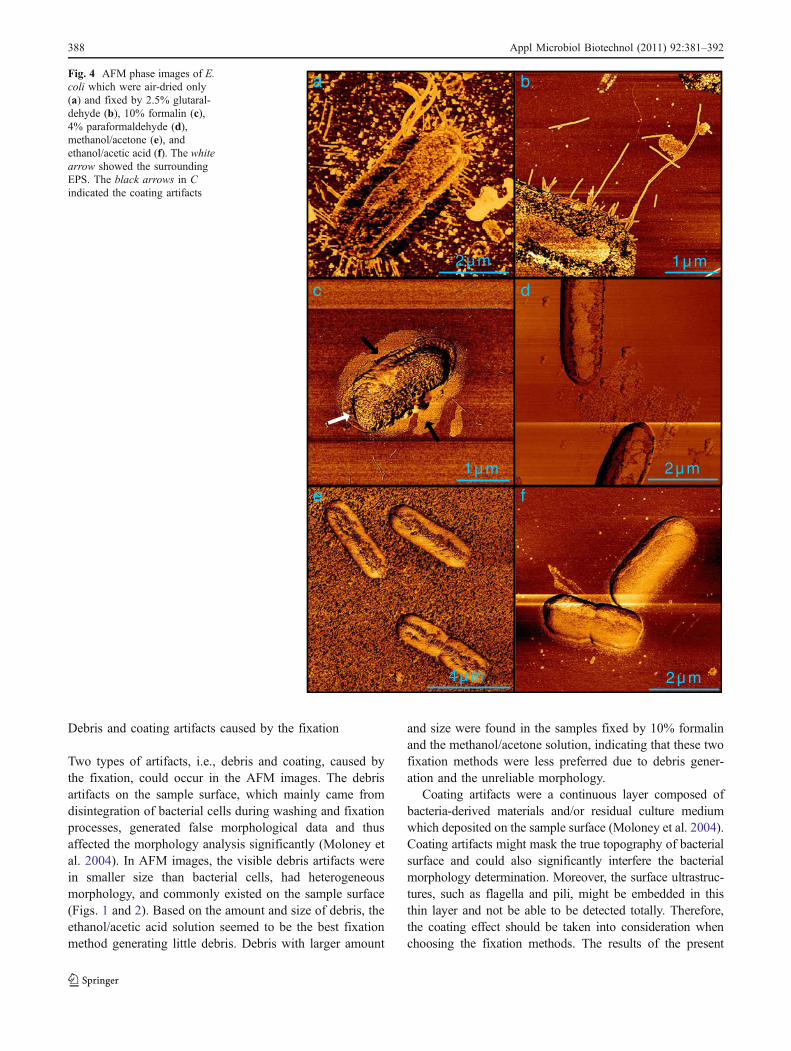
Debris and coating artifacts caused by the fixation
Two types of artifacts, i.e., debris and coating, caused bythe fixation, could occur in the AFM images. The debrisartifacts on the sample surface, which mainly came fromdisintegration of bacterial cells during washing and fixationprocesses, generated false morphological data and thusaffected the morphology analysis significantly (Moloney etal. 2004). In AFM images, the visible debris artifacts werein smaller size than bacterial cells, had heterogeneousmorphology, and commonly existed on the sample surface(Figs. 1 and 2). Based on the amount and size of debris, theethanol/acetic acid solution seemed to be the best fixationmethod generating little debris. Debris with larger amount
and size were found in the samples fixed by 10% formalinand the methanol/acetone solution, indicating that these twofixation methods were less preferred due to debris gener-ation and the unreliable morphology.
Coating artifacts were a continuous layer composed ofbacteria-derived materials and/or residual culture mediumwhich deposited on the sample surface (Moloney et al. 2004).Coating artifacts might mask the true topography of bacterialsurface and could also significantly interfere the bacterialmorphology determination. Moreover, the surface ultrastruc-tures, such as flagella and pili, might be embedded in thisthin layer and not be able to be detected totally. Therefore,the coating effect should be taken into consideration whenchoosing the fixation methods. The results of the present
a
2µ m
b
1µ m
c
1µ m
d
2µ m
e
4µ m 2µ m
f
Fig. 4 AFM phase images of E.coli which were air-dried only(a) and fixed by 2.5% glutaral-dehyde (b), 10% formalin (c),4% paraformaldehyde (d),methanol/acetone (e), andethanol/acetic acid (f). The whitearrow showed the surroundingEPS. The black arrows in Cindicated the coating artifacts
388 Appl Microbiol Biotechnol (2011) 92:381–392

study showed the coating artifacts appeared in the AFMimages of several fixation methods, especially 10% formalin(black arrows in Figs. 2, 3, and 4). This revealed that theAFM images of samples fixed by 10% formalin might facethe problem of coating artifacts.
Discussion
Cells and ultrastructure morphology
Several studies had been conducted to determine the cellmorphology of various bacterial species using differentAFM operational modes either in air or under aqueousconditions (Table 4). The observed bacteria were not naturalrod- or sphere-shape, but flattened to certain extents.Several factors, including environmental variables as wellas AFM operations, could significantly interfere themorphology determination (Bolshakova et al. 2004). Thescanning conditions were critical for acquiring the bacterialmorphology. Typically, bacterial morphology in air wasflatter than those in liquid (Table 4), since the dehydrationof cell and surface EPS in air might mainly affect themeasurement. Another factor was AFM scanning mode, i.e., contact and tapping modes. For the contact mode, thecantilever tip was always touching with the bacterial cellsunder a given force during scanning. Although the selected
cantilever for the contact mode was relative soft, theinteraction between the cantilever tip and the cells couldsignificantly interfere the cell morphology observation,such as bacterial distortion or detachment caused by thelateral force as well as artifacts caused by the cantilevercontamination, especially for the soft cell and deformableEPS. For the tapping mode, the contact between thecantilever tip and cell surface only lasts for a small portionof oscillation cycle, i.e., about at the lowest point of anoscillation cycle. This scanning mode could significantlydecrease the sample damage and lateral force (Camesano etal. 2000). In the present study, the relatively “light” tappingmode by applying larger oscillation amplitude furtherreduced the influence of interaction between the cantilevertip and cells on cell morphology determination.
The bacterial filamentous structures, such as flagellum andpili, were observed using AFM in a few previous studies(Pelling et al. 2005; Touhami et al. 2006; Arce et al. 2009).Unlike bacterial cells, the filamentous structures were difficultto be detected in aqueous environments via AFM since theforce to detach bacterial filaments from the substrata wasrelatively small, and thus these structures were easily detachedin a fluid medium (Touhami et al. 2006). However, it waseasier to detect these filamentous structures after drying andby scanning in air since the adhesion strength increasedsignificantly after drying (Roosjen et al. 2005). In the presentstudy, the flagella of three tested bacteria and pili of E. coli
Table 4 Bacterial morphology determined by AFM under various conditions in previous studies
Bacteria Width/diameter(μm)a
Height(μm)
W/H ratio AFM operation Reference
Acinetobacter venetianus RAG-1 1.1±0.05 0.66±0.03 1.7 Tapping mode, in phosphate buffer Dorobantu et al. 2008
Escherichia coli DH5α 0.9±0.05 0.4±0.02 2.3 Tapping mode, in phosphate buffer Sahu et al. 2009
Escherichia coli DH12S 1.3±0.1 0.1±0.05 13 Contact mode, in air Lomonosov et al. 2003
Escherichia coli DH12S 1.5±0.2 0.2±0.05 7.5 Contact mode, in distillated water Lomonosov et al. 2003
Escherichia coli K12 J62 0.83±0.06 0.17±0.04 4.9 Contact mode, in air Bolshakova et al. 2001
Escherichia coli K12 J62 1.1±0.5 0.26±0.05 4.2 Contact mode, in distillated water Bolshakova et al. 2001
Escherichia coli JM109 0.8±0.1 0.28±0.08 2.9 Contact mode, in air Bolshakova et al. 2001
Escherichia coli JM109 1.1±0.2 0.5±0.1 2.2 Contact mode, in distillated water Bolshakova et al. 2001
Escherichia coli JM109 0.8±0.2 0.3±0.07 2.7 Tapping mode, in air Bolshakova et al. 2001
Escherichia coli JM109 1.0±0.4 0.08±0.04 13 Tapping mode, in distillated water Bolshakova et al. 2001
Escherichia coli XLIB 0.8±0.1 0.2±0.05 4.0 Contact mode, in air Lomonosov et al. 2003
Escherichia coli XLIB 1.0±0.1 0.3±0.05 3.3 Contact mode, in distillated water Lomonosov et al. 2003
Haemophilus influenzae PittGG 0.76±0.15 0.21±0.06 3.6 Tapping mode, in air Arce et al. 2009
Haemophilus influenzae PittEE 0.88±0.24 0.26±0.07 3.5 Tapping mode, in air Arce et al. 2009
Pseudomonas stutzeri KCb 1.1 0.15 7.3 Tapping mode, in MOPS buffer Camesano et al. 2000
Rhodococcus erythropolis 20S-E1-c 1.5±0.03 0.71±0.05 2.1 Tapping mode, in phosphate buffer Dorobantu et al. 2008
Staphylococcus aureus 0.70±0.08 0.35±0.05 2.0 Tapping mode, in phosphate buffer Sahu et al. 2009
a For rod-shaped bacteria, the data were widths values; for spherical bacteria, the data were diameterb The data were collected from figures of cross-section profile in reference
Appl Microbiol Biotechnol (2011) 92:381–392 389
were clearly observed in air, and their morphologies weredetermined accordingly by analyzing AFM height images.
The dimension of bacterial flagella in the present studyvaried between 40 and 90 nm in width (the “side-wall”artifact was taken into consideration) and between 8 and12 nm in height (Table 2) and was compatible with theflagellar sizes of others’ studies, which had a width of 17–48 nm and a height of 5.5–6.5 nm (Jaschke et al. 1994), aswell as a width of 50–150 nm and a height of ∼4 nm(Schmid et al. 2008). Assuming that flagella were deform-able and the cross section was ellipse, the perimeter of theellipse was equal to that of circular cross section of naturaland undeformed flagella (i.e., L ¼ pH þ 2ðW � HÞ ¼ pD).From the corrected data of flagellar width and height, theconverted diameters of the three tested bacteria could becalculated (D ¼ H þ 2ðW � HÞ=p). The converted diame-ters varied from 14 to 28 nm for E. coli, 17 to 24 nm for P.putida, and 17 to 23 nm for B. subtilis. This was the typicaldimension of bacterial flagella within the diameter of 12 to25 nm (Namba and Vonderviszt 1997; Samatey et al. 2001;Maki-Yonekura et al. 2010). For E. coli pili, the dimensionobserved in the present study had a corrected width of 17 to33 nm, a height of 4 to 6 nm, and a converted diameter of 6to 10 nm. This was also compatible with the typicaldimension of bacterial pili, which had 4 to 7 nm diameteraccording to previous reports (Korhonen et al. 1980;Telford et al. 2006; Touhami et al. 2006; Arce et al. 2009).
Effect of fixation methods
To optimize the fixation methods for the morphologyobservation of bacterial cells and surface ultrastructures,
five common fixation solutions were evaluated on theirpreservation ability in the present study. The resultsstrongly suggested that the fixation methods couldsignificantly affect the morphology of bacterial cell aswell as the surface ultrastructures. The fixation methodscontaining alcohols (including the methanol/acetone andethanol/acetic acid solutions) obtained biased morphol-ogy than those containing aldehydes (including 2.5%glutaraldehyde, 10% formalin, and 4% paraformalde-hyde), since the filamentous structures (flagella and pili)disappeared on the cell surface. This might be mainlycaused by the alcohols in these fixation solutions whichcould dissolve the membrane lipids, form large pores inthe cell, and detach the surface macromolecules on thecell surface (Vekemans et al. 2004). For the cellmorphology, the ethanol/acetic acid solution could obtainbetter preservation than the methanol/acetone solution(Table 1 and Fig. 1). In the ethanol/acetic acid combina-tion, acetic acid could swell cell and thus counteracted theshrinkage induced by ethanol, while the main role ofacetone in the methanol/acetone solution was penetratingcell to facilitate the consequent fixation by methanol (St-Laurent et al. 2006). Thus, the bacteria cell fixed by themethanol/acetone solution shrank seriously, and the bac-terial morphology was poorly preserved. Other studiesalso revealed that no reliable morphology could beobtained after acetone/methanol fixation (Hoetelmans etal. 2001; St-Laurent et al. 2006).
The fixation methods applying aldehydes showed medi-um preservation ability for cell morphology judging fromthe W/H ratios (Table 1). For bacterial filaments morphol-ogy, the aldehyde fixations performed much better than
Table 5 Assessments and comments for the applied fixation methods
Fixations Cell morphologypreservation
Flagella/pilipreservation
EPS removal Debrisartifactsb
Coatingartifactsb
Overall Comments
2.5% Glutaraldehyde ○a + + ○ ○ + The best option of the appliedfixation methods for observingmorphology of both cells andultrastructures
10% Formalin ○ ○ ○ − − ○ The coating and debris artifacts mayaffect morphology observation
4% Paraformaldehyde ○ − − ○ ○ ○ The existed EPS may cover surfacefeatures, and some filaments likepili may detach from cells
Methanol/acetone − − − − ○ − The worst fixation method whichmay obtain biased results
Ethanol/acetic acid + − + + + + The best option for evaluating cellmorphology, but poor forobserving bacterial filaments
a + means good; ○ means medium; − means poorb Good: little debris and coating artifacts appear; medium: debris and coating appear but not serious; poor: debris and coating appear seriously
390 Appl Microbiol Biotechnol (2011) 92:381–392

alcohols since aldehydes fixed cell by forming covalentchemical bonds between proteins and therefore couldmaintain the integrality of membrane lipids as well as thesurface macromolecules (Dapson 2007). In the presentstudy, 2.5% glutaraldehyde showed the best performancefor fixation of filaments, following by 10% formalin and4% paraformaldehyde. Paraformaldehyde, the polymerizedform of formaldehyde, would be depolymerized to formal-dehyde when dissolved (Kiernan 2000). Therefore, the 4%paraformaldehyde solution contained pure formaldehyde.For the 10% formalin solution, the major component isformaldehyde but also contains 1% methanol which isadded to slow down the polymerization of formaldehyde(Kiernan 2000). This might be the main reason to explainthe slightly different performances between 10% formalinand 4% paraformaldehyde (Tables 1 and 2). Comparingwith formaldehyde, glutaraldehyde could fix sample moretightly since it has longer molecule and two aldehydegroups which has potential to link more distant proteinmolecules (Kiernan 2000). This might explain the bestperformance of glutaraldehyde in fixing the bacterialfilaments among the applied fixation methods.
The bacterial surfaces were not smooth but with lots ofspherical structures (phase images in Figs. 3 and 4). Thesestructures were always observed in the images of differentbacteria fixed with aldehydes, indicating they were thebacterial morphological feature, instead of artifacts formedin drying and fixation or due to the cantilever contamination.These spherical structures were also observed in a fewprevious studies and considered to be the surface proteins(Camesano et al. 2000; Micic et al. 2004) and/or lip-opolysaccharides (Micic et al. 2004; Handa et al. 2010;McEwen et al. 2010). Comparing with aldehyde fixations, thebacteria fixed by alcohols showed obscure spherical struc-tures (Fig. 4). This further indicated that the alcohols couldremove the surface proteins and/or lipopolysaccharides.
To comprehensively evaluate the applied fixation methodsand determine which one was the most promising method,quantitative and qualitative assessments were conducted in thepresent study (Table 5). Quantitative assessments were basedon the morphology preservation of both bacterial cell andsurface filaments by comparing the W/H ratios of cells fixedusing different methods. Qualitative assessments were basedon the EPS removal, debris, and coating artifacts byanalyzing AFM images. Other possible artifacts, such as saltcrystals and streaking artifacts (Moloney et al. 2004), couldalso affect the morphological analysis. Salt crystals mightderive from washing buffer (PBS or others) after drying. Toavoid crystals generation, the ultrapure water was applied tore-suspend the fixed cells before drying in air. The AFMimages also showed no salt crystals generated on the samplesurface. Streaking artifacts are mainly caused by theinappropriate AFM operation or tip contamination which
might lead into inaccurate measurements and consequentlyinterfere the morphology analysis, but having nothing to dowith the fixation methods. In the present study, the operationparameters such as set points and scan rates were optimizedin the pre-experiments and also adjusted during scanning toavoid the streaking artifacts due to inappropriate AFMoperations. For bacterial samples, the tip contamination wasalmost inevitable since the cell or debris which adheredloosely on the cell surface easily adhered to the tip duringscanning. The strategy applied in the present study was toreplace the contaminated cantilever immediately with a newone when the streaking artifacts appeared in an image.Therefore, the salt crystals and streaking artifacts were nottaken into consideration for the assessments of the fixationmethods. Based on above assessments, several commentswere also proposed in Table 5 for future applications.
Acknowledgements The authors wish to thank the Hong KongUGC One-off Special Equipment Grant Scheme (SEG HKU10) forthe financial support on this study, and Yuanqing Chao wishes to thankthe University of Hong Kong for the postgraduate studentship. Thetechnical assistance of Ms. Vicky Fung is greatly appreciated.
Open Access This article is distributed under the terms of theCreative Commons Attribution Noncommercial License which per-mits any noncommercial use, distribution, and reproduction in anymedium, provided the original author(s) and source are credited.
References
Alsteens D, Verbelen C, Dague E, Raze D, Baulard AR, Dufrêne YF(2008) Organization of the mycobacterial cell wall: a nanoscaleview. Pflugers Arch Eur J Physiol 456:117–125
Andre G, Kulakauskas S, Chapot-Chartier MP, Navet B, Deghorain M,Bernard E, Hols P, Dufrêne YF (2010) Imaging the nanoscaleorganization of peptidoglycan in living Lactococcus lactis cells.Nat Commun 1:27
Arce FT, Carlson R, Monds J, Veeh R, Hu FZ, Stewart PS, Lal R,Ehrlich GD, Avci R (2009) Nanoscale structural and mechanicalproperties of nontypeable Haemophilus influenzae biofilms. JBacteriol 191:2512–2520
Auerbach ID, Sorensen C, Hansma HG, Holden PA (2000) Physicalmorphology and surface properties of unsaturated Pseudomonasputida biofilms. J Bacteriol 182:3809–3815
Bolshakova AV, Kiselyova OI, Filonov AS, Frolova OY, LyubchenkoYL, Yaminsky IV (2001) Comparative studies of bacteria with anatomic force microscopy operating in different modes. Ultra-microscopy 86:121–128
Bolshakova AV, Kiselyova OI, Yaminsky IV (2004) Microbial surfacesinvestigated using atomic force microscopy. Biotechnol Prog20:1615–1622
Camesano TA, Natan MJ, Logan BE (2000) Observation of changes inbacterial cell morphology using tapping mode atomic forcemicroscopy. Langmuir 16:4563–4572
Celie JWAM, Beelen RHJ, van den Born J (2005) Effect of fixationprotocols on in situ detection of L-selectin ligands. J ImmunolMethods 298:155–159
Dapson RW (2007) Macromolecular changes caused by formalinfixation and antigen retrieval. Biotech Histochem 82:133–140
Appl Microbiol Biotechnol (2011) 92:381–392 391
Dorobantu LS, Bhattacharjee S, Foght JM, Gray MR (2008) Atomicforce microscopy measurement of heterogeneity in bacterialsurface hydrophobicity. Langmuir 24:4944–4951
Gaboriaud F, Dufrêne YF (2007) Atomic force microscopy of microbialcells: application to nanomechanical properties, surface forces andmolecular recognition forces. Colloids Surf B 54:10–19
Handa H, Gurczynski S, Jackson MP, Mao G (2010) Immobilizationand molecular interactions between bacteriophage and lipopoly-saccharide bilayers. Langmuir 26:12095–12103
Harada Y, Sone H, Hosaka S (2008) Estimation of three-dimensionalatomic force microscope tip shape from atomic force microscopeimage for accurate measurement. Jpn J Appl Phys 47:6186–6189
Hoetelmans RWM, Prins FA, Cornelese-ten Velde I, van derMeer J, van derVelde CJH, van Dierendonck JH (2001) Effects of acetone, methanol,or paraformaldehyde on cellular structure, visualized by reflectioncontrast microscopy and transmission and scanning electron micros-copy. Appl Immunohistochem Mol Morphol 9:346–351
Jaschke M, Butt HJ, Wolff EK (1994) Imaging flagella of Halobacteriaby atomic force microscopy. Analyst 119:1943–1946
Kiernan JA (2000) Formaldehyde, formalin, paraformaldehyde andglutaraldehyde: what they are and what they do. Microsc Today00–1:8–12
Korhonen TK, Lounatmaa K, Ranta H, Kuusi N (1980) Characteriza-tion of type 1 pili of Salmonella typhimurium LT2. J Bacteriol144:800–805
Kuznetsov YG, McPherson A (2011) Atomic force microscopy inimaging of viruses and virus-infected cells. Microbiol Mol BiolRev 75:268–285
Lomonosov AM, Egorov SN, Gallyamov MO, Yaminsky IV (2003)AFM of bacterial cells subjected to different factors. Phys Low-Dim Struct 3(4):125–130
Maki-Yonekura S, Yonekura K, Namba K (2010) Conformationalchange of flagellin for polymorphic supercoiling of the flagellarfilament. Nat Struct Mol Biol 17:417–423
McEwen GD, Wu YZ, Zhou AH (2010) Probing nanostructures ofbacterial extracellular polymeric substances versus culture timeby Raman microspectroscopy and atomic force microscopy.Biopolymers 93:171–177
Meade AD, Clarke C, Draux F, Sockalingum GD, Manfait M, LyngFM, Byrne HJ (2010) Studies of chemical fixation effects inhuman cell lines using Raman microspectroscopy. Anal BioanalChem 396:1781–1791
Micic M, Hu D, Suh YD, Newton G, Romine M, Lu HP (2004)Correlated atomic force microscopy and fluorescence lifetimeimaging of live bacterial cells. Colloids Surf B 34:205–212
Moloney M, McDonnell L, O’Shea H (2004) Atomic force microscopyof BHK-21 cells: an investigation of cell fixation techniques.Ultramicroscopy 100:153–161
Namba K, Vonderviszt F (1997) Molecular architecture of bacterialflagellum. Q Rev Biophys 30:1–65
Paavilainen L, Edvinsson Å, Asplund A, Hober S, Kampf C, Pontén F,Wester K (2010) The impact of tissue fixatives on morphologyand antibody-based protein profiling in tissues and cells. JHistochem Cytochem 58:237–246
Pelling AE, Li Y, Shi W, Gimzewski JK (2005) Nanoscale visualizationand characterization ofMyxococcus xanthus cells with atomic forcemicroscopy. Proc Natl Acad Sci U S A 102:6484–6489
Roosjen A, Boks NP, van der Mei HC, Busscher HJ, Norde W (2005)Influence of shear on microbial adhesion to PEO-brushes andglass by convective-diffusion and sedimentation in a parallelplate flow chamber. Colloids Surf B 46:1–6
Sahu K, Bansal H, Mukherjee C, Sharma M, Gupta PK (2009)Atomic force microscopic study on morphological alterationsinduced by photodynamic action of toluidine blue O inStaphylococcus aureus and Escherichia coli. J PhotochemPhotobiol B 96:9–16
Samatey FA, Imada K, Nagashima S, Vonderviszt F, Kumasaka T,Yamamoto M, Namba K (2001) Structure of the bacterialflagellar protofilament and implications for a switch for super-coiling. Nature 410:331–337
Schmid T, Burkhard J, Yeo BS, Zhang W, Zenobi R (2008)Towards chemical analysis of nanostructures in biofilms I:imaging of biological nanostructures. Anal Bioanal Chem391:1899–1905
St-Laurent J, Boulay ME, Prince P, Bissonnette E, Boulet LP (2006)Comparison of cell fixation methods of induced sputum speci-mens: an immunocytochemical analysis. J Immunol Methods308:36–42
Stukalov O, Korenevsky A, Beveridge TJ, Dutcher JR (2008) Use ofatomic force microscopy and transmission electron microscopyfor correlative studies of bacterial capsules. Appl EnvironMicrobiol 74:5457–5465
Suthipintawong C, Leong ASY, Vinyuvat S (1996) Immunostaining ofcell preparations: a comparative evaluation of common fixativesand protocols. Diagn Cytopathol 15:167–174
Telford JL, Barocchi MA, Margarit I, Rappuoli R, Grandi G (2006)Pili in Gram-positive pathogens. Nat Rev Microbiol 4:509–519
Touhami A, Jericho MH, Boyd JM, Beveridge TJ (2006) Nanoscalecharacterization and determination of adhesion forces of Pseu-domonas aeruginosa pili by using atomic force microscopy. JBacteriol 188:370–377
Vekemans K, Rosseel L, Wisse E, Braet F (2004) Immuno-localizationof Fas and FasL in rat hepatic endothelial cells: influence ofdifferent fixation protocols. Micron 35:303–306
Young KD (2007) Bacterial morphology: why have different shapes?Curr Opin Microbiol 10:596–600
392 Appl Microbiol Biotechnol (2011) 92:381–392