optimization of deep drawing process parameters for mul
TRANSCRIPT

Resource Efficient Vehicles Conference14 – 16 June 2021
Optimization of deep drawing process parameters for mul-tiple functional requirements
V. K. Balla1,3,*, E. Deckers1,2, B. Pluymers1,2, J. Stroobants4, H. G. Sakinala3 and W.Dismet1,2
1KU Leuven, Department of Mechanical Engineering,Celestijnenlaan 300, B-3001, Heverlee, Belgium2DMMS Core Lab, Flanders Make, Belgium3Member R&D, TVS Motor Company Ltd., Hosur-635110, Tamilnadu, India4CodesignS Core Lab, Flanders Make, Belgium*Corresponding author. Email: [email protected]
In this work, a cylindrical cup design is investigated for meeting the dimensional accuracy, vibro-acoustic and crash performance simultaneously. Cylindrical cup forming simulations are per-formed using different deep drawing process parameters—Blank Holder Force (BHF), FrictionCoefficient, Blank thickness and misalignment—to predict geometric profile and thickness vari-ations. The formed geometry is used to simulate the vibro-acoustics performance of the design.The cylindrical cup has nominal dimensions of 80 mm diameter, 24 mm deep and 0.97 mm thick-ness. Forming simulations are performed to quantify the vibro-acoustic variability caused bychanges in process parameters. The vibro-acoustic variability is attributed to the geometry profileand thickness distribution changes of the deep drawing manufacturing process. To investigate thesame, the Design Of Experiments (DOE) studies, based on Taguchi orthogonal arrays, are carriedout to characterize the effect of individual process parameters on the response. The deep drawinganalysis and the subsequent vibro-acoustic simulations are instrumental in optimizing both func-tional requirements. The crash performance of the component is predicted using the empiricalformula mentioned in the literature. It is shown that a careful selection of process parameters helpto optimize the response for multiple functional requirements.
© 2021 by the authors. Published by the Resource Efficient Vehicles Conference.This is an open access article under the CC BY license (http://creativecommons.org/licenses/by/4.0/).
1. Introduction
The ever-increasing demands of customers must be satisfied in order to improve the brand imageof products. The number of components required to meet functional needs is increasing due to reasonas mentioned earlier. Furthermore, stringent mass emission and other regulatory standards preventweight addition, thus limiting the number of components in the product. Consequently, there aremultiple functional requirements for a component. Optimization of design parameters that aim tomeet the most often not the contradictory functional requirements shall be carried out during theinitial phase to take advantage of the maximum possible design space. Although the design space atthe initial stage of the product is less restricted, the domain knowledge—generated through virtualsimulations, surrogate product experiments, or empirical models—is crucial to select the optimumdesign parameters.
The deep drawing manufacturing process is used for manufacturing sheet metal components [1].The weight advantages of sheet metal components over castings or forged components help to design
© 2021 by the authors. Published by the Resource Efficient Vehicles Conference.This is an open access article under the CC BY license (http://creativecommons.org/licenses/by/4.0/).

Resource Efficient Vehicles Conference – rev2021
resource-efficient products. The advancements in the sheet metal industry are likely to benefit theautomobile industry as a typical Body-In-White (BIW) weight of an automobile consists of about75% sheet metal parts [2] produced through stamping or deep drawing processes. The sheet metalpart contribution to dimensional stability, vibro-acoustic and crash performance is quite significant,and this work emphasizes achieving the attributes mentioned above simultaneously by studying anarchetype sheet metal cylindrical cup component.
2. Component description
The cylindrical cup has a nominal diameter, depth and thickness of 80 mm, 24 mm and 0.97 mm,respectively, as shown in Figure 1. Additionally, cylindrical cups with the same diameter and depthbut with a thickness of 1.21 mm are also produced. The BHF used for cylindrical cup manufactur-ing is 35 kN or 45 kN. The cylindrical cup is made of DP600. Table 1 presents the details of thecombinations of cylindrical cups considered in the present work. The blank diameter used for themanufacturing is 100 mm, along with a punch diameter of 50 mm. The die opening is 52.88 mm, andthe die entry radius is 3 mm. The punch speed is 50 mm/min.
Figure 1: Top and side views of the cylindrical cup (All dimensions are in mm).
Table 1: Cylindrical cup geometry, BHF, part number description, and weight details.
Depth (mm) BHF (kN)Thickness (mm)
0.97 1.21Cup no. Weight (g) Cup no. Weight (g)
2445 1 59.17 9 74.4735 2 58.52 10 76.07
The cylindrical cup geometries are manufactured using two different BHF values. The acceptablerange of BHF variation, as mentioned in literature [3], is about 25%. The vibrational behaviour canbe assessed by studying the dynamic behaviour of these cups subjected to two different BHF values.Cups 1, 2 are produced using 45 kN BHF and 35 kN BHF respectively .
3. Results and Discussion
3.1 Simulation model validation
The deep drawing analysis is carried out using the explicit finite element method. The main goalof this analysis is to arrive at a more representative geometry to imitate the actual manufactured partand predict the influence of the geometry profile and thickness variations on the natural frequenciesand the mode shapes. Additionally, having a numerical model in place also allows verifying the in-fluence of process parameter variations. The analysis is performed using Radioss software [4]. Thedeep drawing of the cylindrical cup is complete, and the thickness distribution is shown in Figure 2a.
Resource Efficient Vehicles Conference – rev2021
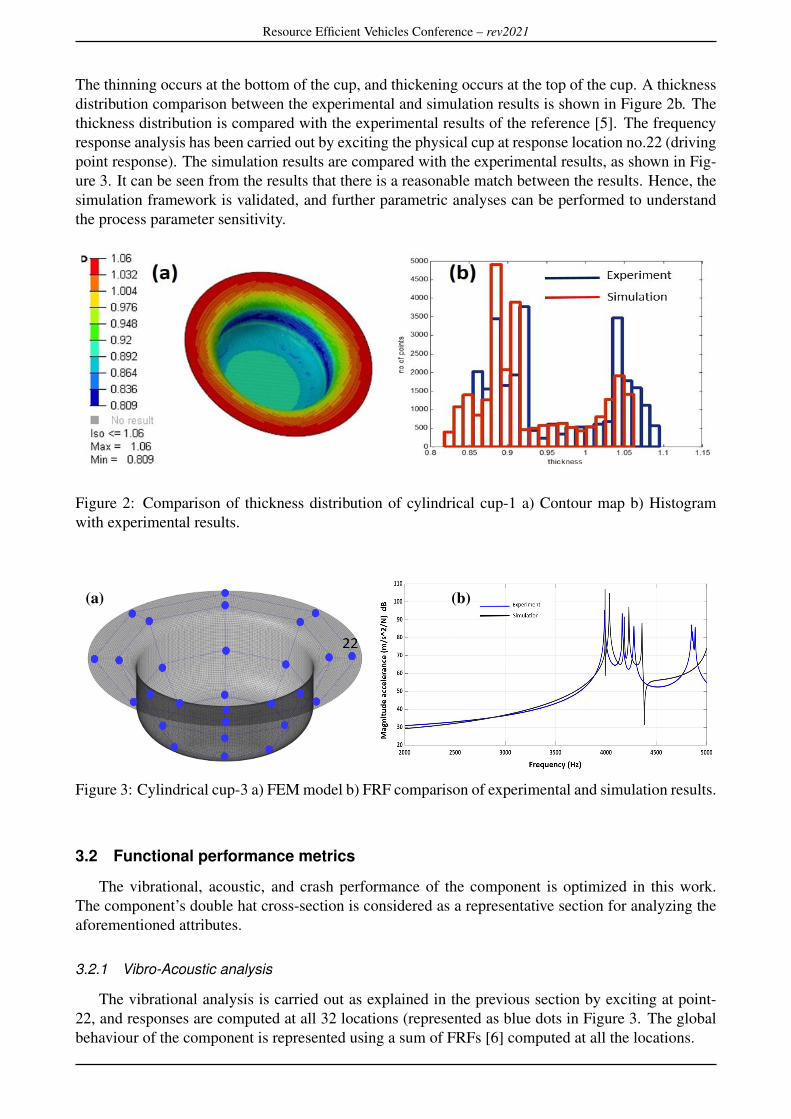
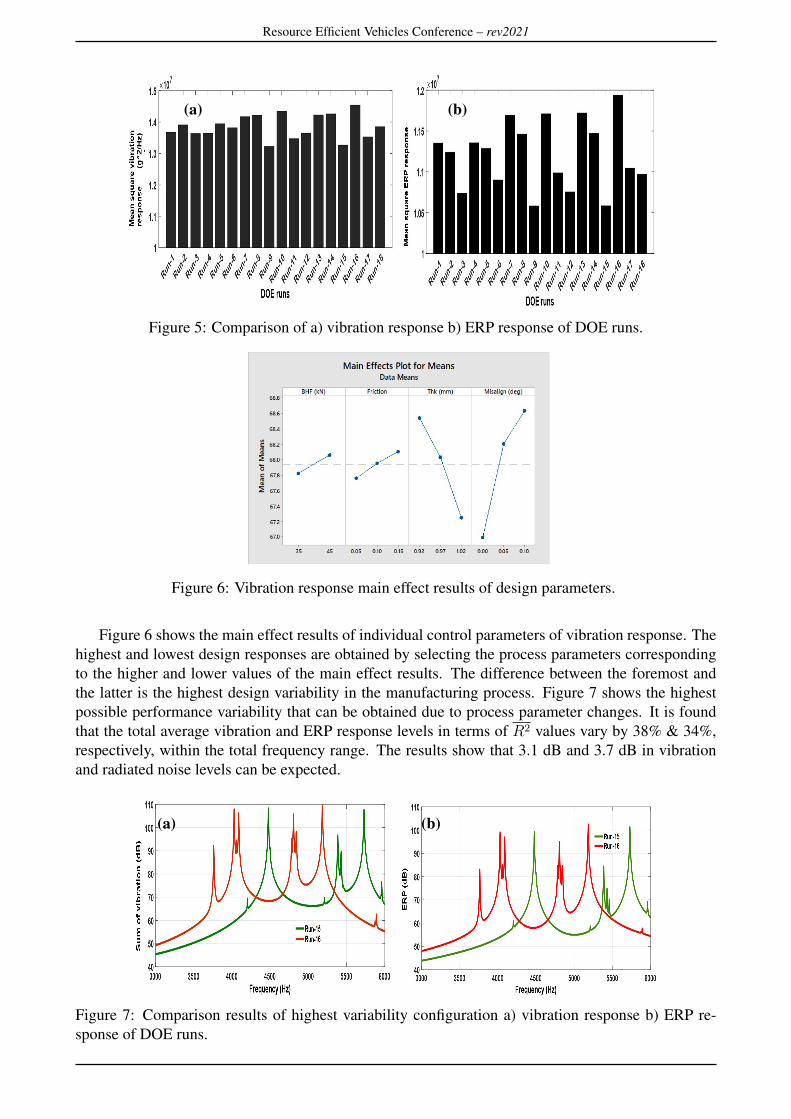
The thinning occurs at the bottom of the cup, and thickening occurs at the top of the cup. A thicknessdistribution comparison between the experimental and simulation results is shown in Figure 2b. Thethickness distribution is compared with the experimental results of the reference [5]. The frequencyresponse analysis has been carried out by exciting the physical cup at response location no.22 (drivingpoint response). The simulation results are compared with the experimental results, as shown in Fig-ure 3. It can be seen from the results that there is a reasonable match between the results. Hence, thesimulation framework is validated, and further parametric analyses can be performed to understandthe process parameter sensitivity.
Figure 2: Comparison of thickness distribution of cylindrical cup-1 a) Contour map b) Histogramwith experimental results.
(a) (b)
Figure 3: Cylindrical cup-3 a) FEM model b) FRF comparison of experimental and simulation results.
3.2 Functional performance metrics
The vibrational, acoustic, and crash performance of the component is optimized in this work.The component’s double hat cross-section is considered as a representative section for analyzing theaforementioned attributes.
3.2.1 Vibro-Acoustic analysis
The vibrational analysis is carried out as explained in the previous section by exciting at point-22, and responses are computed at all 32 locations (represented as blue dots in Figure 3. The globalbehaviour of the component is represented using a sum of FRFs [6] computed at all the locations.

Resource Efficient Vehicles Conference – rev2021
The radiated noise of the cylindrical cup is predicted using the equivalent radiated power (ERP)approach [7]. It is possible to identify the structural regions that contribute most in the frequencyrange of interest. This computation mainly depends on the evaluation of velocity responses on theradiating surface, and it is defined as:
ERP =1
2ρc
Ne∑e=1
AeV2e . (1)
whereAe is elemental area, and Ve velocity magnitude at the element centre, ρ is fluid density, c speedof sound.
3.2.2 Crash analysis
Crash-worthiness is described as the ability of a part to withstand crash loads without undue defor-mation while also absorbing and dissipating the kinetic energy of the impact. The midrail componentand a quarter vehicle subsystem from a General Motors’ production vehicle are investigated [8]. Ac-cording to the author, the general formula for the energy absorbed can be written as:
ETR,SR = EBT,BS (1.467 ∗ TR− 0.447)(0.791 ∗ SR + 0.208) (2)
where TR is thickness ratio relative to baseline thickness and SR stress ratio relative to baselinestress.
3.3 Parametric studies
The following parameters are considered for quantifying the performance of deep drawn parts:i) blank holder force, ii) friction coefficient, iii) nominal blank thickness variation iv) misalignment,based on the literature. The manufacturing/misalignment error is defined as the angle between thepunch and the die cavity.
The individual effects of each of these process parameters are assessed by keeping all other vari-ables at the nominal level. For example, the effect of BHF is evaluated by varying it at different levels35 kN, 45 kN, 55 kN while keeping friction coefficient as 0.1 and nominal blank thickness as 0.97mm with no misalignment. The thickness distribution histogram and the sum of the FRFs of all thenodes corresponding to the measurement locations are given in Figure 4a & b, respectively. The lowerand upper bounds of BHF values are obtained from the reference [9]. The high BHF value increasedthe resistance of material flow into the die cavity and thus increased the thinning phenomenon. Thisphenomenon reduced the stiffness of the geometry, and hence eigenfrequencies have shifted to thelower side with the highest BHF value. Figure 4c & d show the impact of friction changes on boththickness distribution and frequency response function. The thinning phenomenon reduced with thereduction in friction value, and eigenfrequencies shifted to the higher side. The lower and upperbounds of friction values are obtained from the reference [3]. The effect of blank nominal thicknessis shown in Figure 4e & f.
The lower and upper bounds of thickness variation are obtained from the reference [10]. Thehigher nominal thickness increased the highest thickness of the formed cup, while the lower nominalblank thickness increased the propensity of thinning. The shift in eigenfrequencies and amplitudechanges are more evident due to variations in the nominal blank thickness. Hence, it can be statedthat the effect of these process parameters is different and the nominal thickness has the highestimpact on the vibro-acoustic properties. In addition, a small misalignment that could possibly happenduring the deep drawing process is also considered. Slavic et al. [11] showed that misalignmentscause unbalanced thickness and increase the load required for the drawing process. The upper andlower bounds of variation in the present study are obtained from [11, 12].

Resource Efficient Vehicles Conference – rev2021
(a) BHF (b) BHF
(c) Frictioncoefficient
(d) Frictioncoefficient
(e) Blank thickness (f) Blankthickness
(g) Friction coefficient (h) Blank thickness
Figure 4: Influence results of a) BHF on thickness distribution b) BHF on FRF c) Friction on thicknessdistribution d) Friction on FRF e) Blank thickness on thickness distribution f) Blank thickness on FRFg) Friction on ERP h) Blank thickness on ERP.

Resource Efficient Vehicles Conference – rev2021
The ERP values of all the configurations mentioned above are computed. However, the results ofthe friction and the nominal blank thickness effects are only shown in Figure 4g & h, respectively.The amplitude and frequency changes are quite evident from the results.
3.4 Design of Experiments
In order to further quantify the effect of the process parameters, a Design of Experiments (DOE)of the simulation model is carried out in the Minitab software [13]. The four factors considered areBHF, friction coefficient, blank nominal thickness and misalignment. The process parameters arevaried at three levels, except for BHF, which is varied at two levels. The full factorial experiments54 (21 × 33) are required to analyze the complete design. However, to reduce the computational timewithout compromising the accuracy of findings, the orthogonal array (L18) proposed by Taguchi [14]is used in the present study. The control factors and corresponding levels of all the experiments are asshown in Table 2.
Table 2: Control factors and levels.Sl. No. BHF (kN) Friction Thk (mm) Misalign (deg)
1 35 0.05 0.92 0.002 35 0.05 0.97 0.053 35 0.05 1.02 0.104 35 0.10 0.92 0.005 35 0.10 0.97 0.056 35 0.10 1.02 0.107 35 0.15 0.92 0.058 35 0.15 0.97 0.109 35 0.15 1.02 0.00
10 45 0.05 0.92 0.1011 45 0.05 0.97 0.0012 45 0.05 1.02 0.0513 45 0.10 0.92 0.0514 45 0.10 0.97 0.1015 45 0.10 1.02 0.0016 45 0.15 0.92 0.1017 45 0.15 0.97 0.0018 45 0.15 1.02 0.05
The mean square response is considered as a metric to characterize the vibro-acoustic response.The mean square response, R2 in any preferred frequency band, is the integral of the spectral densityresponse within the frequency limits of the specified band, i.e., the area under the response spectraldensity curve [15] as follows:
R2 =
∫ f2
f1
f(ω)|H(ω)|2dω (3)
where f(ω) and H(ω) are force and transfer functions, respectively.The vibration response at all of the corresponding measurement locations is computed, and ERP is
evaluated for the complete cup geometry. The vibration and ERP levels i.e., R2 of each configurationin the design of experiment (DOE) runs, is considered as the corresponding response. Figure 5a & bshow R2 results of vibration and ERP response, respectively. It can be seen from the results that thevibration R2 response of Run-15 has registered the lowest response. Similarly, the same DOE run’sERP can be considered the lowest in the case of radiated noise of the cups.
Resource Efficient Vehicles Conference – rev2021
(a) (b)
Figure 5: Comparison of a) vibration response b) ERP response of DOE runs.
Figure 6: Vibration response main effect results of design parameters.
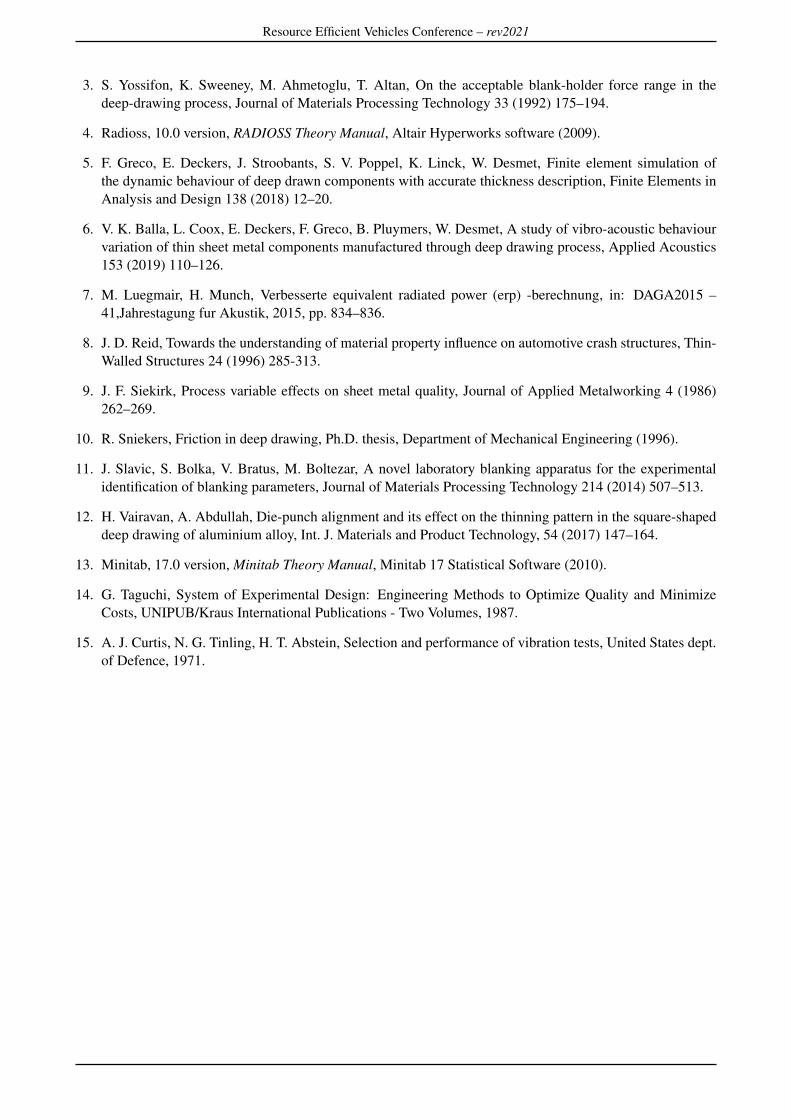
Figure 6 shows the main effect results of individual control parameters of vibration response. Thehighest and lowest design responses are obtained by selecting the process parameters correspondingto the higher and lower values of the main effect results. The difference between the foremost andthe latter is the highest design variability in the manufacturing process. Figure 7 shows the highestpossible performance variability that can be obtained due to process parameter changes. It is foundthat the total average vibration and ERP response levels in terms of R2 values vary by 38% & 34%,respectively, within the total frequency range. The results show that 3.1 dB and 3.7 dB in vibrationand radiated noise levels can be expected.
(a) (b)
Figure 7: Comparison results of highest variability configuration a) vibration response b) ERP re-sponse of DOE runs.

Resource Efficient Vehicles Conference – rev2021
The optimization of vibro-acoustic response can be carried out by a careful selection of processparameters. The lowest vibration response value achieved is 66.2 dB for the Run-15. However, furtherreduction of mean response can be achieved by keeping all the process parameters at the lowest levels,as indicated by the main effects plot. The variability can be controlled most effectively by minimisingthe nominal blank thickness variation and misalignment changes during the process.
The crash response is determined by the minimum thickness and stresses induced in the compo-nent. Figure 8 shows DOE results of minimum thickness and stresses induced in the component. Thethickness and stress changes among the runs are about 19% and 43%, respectively. According to theliterature, for a specific thickness, a 10% change in stress (relative to the baseline stress) results in a7.03% and for a specific stress, a 10% change in thickness (relative to the baseline thickness) resultsin a 14.71% change in energy absorption respectively. Since the changes in stresses and thickness aregreater than mentioned in the literature, the crash performance of these components is likely to varysignificantly.
(a) (b)
Figure 8: Comparison results of a) Minimum thickness b) Stresses of DOE runs.
4. Conclusions
The forming simulations of cylindrical cups are carried out, and the simulation results of thick-ness distribution and frequency response functions are validated with the experimental results. Theindividual process parameter changes, i.e. BHF, friction coefficient, blank thickness and misalign-ment of the press showed considerable changes in the thickness distribution, vibration responses.Besides, the sensitivity of these parameters to the radiated noise variability—rather difficult to quan-tify through physical experiments, due to difficulties in repeatability concerns of lightweight compo-nents—is demonstrated through equivalent radiated power (ERP) simulation results. Starting fromthese results, the authors carried out further analysis using a Design of Experiments (DOE) Taguchiapproach to identify process parameters to optimize vibro-acoustic and crash performance. The au-thors propose future work to carry out the crash analysis to quantify the influence of the processparameters. Besides, the interaction of control factors is not considered in the present study, due tothe nature DOE table. The authors consider the study of interactions as another interesting field ofthis research work.
References
1. H. Tschaetsch, Deep drawing. In: Metal Forming Practise, Springer, Berlin, Heidelberg, 2006.
2. Hirsch, J. Aluminium in innovative light-weight car design. Materials Transactions, 52(5) (2011), 818–824.
Resource Efficient Vehicles Conference – rev2021
3. S. Yossifon, K. Sweeney, M. Ahmetoglu, T. Altan, On the acceptable blank-holder force range in thedeep-drawing process, Journal of Materials Processing Technology 33 (1992) 175–194.
4. Radioss, 10.0 version, RADIOSS Theory Manual, Altair Hyperworks software (2009).
5. F. Greco, E. Deckers, J. Stroobants, S. V. Poppel, K. Linck, W. Desmet, Finite element simulation ofthe dynamic behaviour of deep drawn components with accurate thickness description, Finite Elements inAnalysis and Design 138 (2018) 12–20.
6. V. K. Balla, L. Coox, E. Deckers, F. Greco, B. Pluymers, W. Desmet, A study of vibro-acoustic behaviourvariation of thin sheet metal components manufactured through deep drawing process, Applied Acoustics153 (2019) 110–126.
7. M. Luegmair, H. Munch, Verbesserte equivalent radiated power (erp) -berechnung, in: DAGA2015 –41,Jahrestagung fur Akustik, 2015, pp. 834–836.
8. J. D. Reid, Towards the understanding of material property influence on automotive crash structures, Thin-Walled Structures 24 (1996) 285-313.
9. J. F. Siekirk, Process variable effects on sheet metal quality, Journal of Applied Metalworking 4 (1986)262–269.
10. R. Sniekers, Friction in deep drawing, Ph.D. thesis, Department of Mechanical Engineering (1996).
11. J. Slavic, S. Bolka, V. Bratus, M. Boltezar, A novel laboratory blanking apparatus for the experimentalidentification of blanking parameters, Journal of Materials Processing Technology 214 (2014) 507–513.
12. H. Vairavan, A. Abdullah, Die-punch alignment and its effect on the thinning pattern in the square-shapeddeep drawing of aluminium alloy, Int. J. Materials and Product Technology, 54 (2017) 147–164.
13. Minitab, 17.0 version, Minitab Theory Manual, Minitab 17 Statistical Software (2010).
14. G. Taguchi, System of Experimental Design: Engineering Methods to Optimize Quality and MinimizeCosts, UNIPUB/Kraus International Publications - Two Volumes, 1987.
15. A. J. Curtis, N. G. Tinling, H. T. Abstein, Selection and performance of vibration tests, United States dept.of Defence, 1971.