optimization of a bioassay to evaluate escherichia coli...
TRANSCRIPT

UNIVERSIDADE DE LISBOA
FACULDADE DE CIÊNCIAS
DEPARTAMENTO DE BIOLOGIA VEGETAL
Optimization of a Bioassay to Evaluate
Escherichia coli Stress Responses
Ana Lúcia Evaristo Russo
Mestrado em Microbiologia Aplicada
Dissertação orientada por:
Cecília R.C. Calado
Ana Tenreiro
2017

Optimization of a Bioassay to Evaluate Escherichia coli Stress Responses
2017
II
Acknowledgments
First of all, I would like to express my sincere gratitude to my advisors, Professor Cecília
Calado for giving me the opportunity to work in a totally different area from mine and with a very
innovative technique, the infrared spectroscopy. Thank you as well for all the support, availability and
advise given during this project. To the Instituto Superior de Engenharia de Lisboa (ISEL) for having
received me in the second year of the master's degree.
I also appreciate to DrugsPlatf-2017 and GenTox-2017 projects, financed by Instituto
Politécnico de Lisboa, for supporting this work.
To Bernardo Cunha for all the patience to guide me in the first practical tests, for all the
advices and also for having done all the data processing, which was crucial for the analysis of my
results.
I also want to thank to all my post-graduation professors for all the knowledge they passed to
me, which have been very useful during my master thesis and to Faculdade de Ciências da
Universidade de Lisboa for having accepted my candidature in the Master of Microbiology.
A hearthfelt thank to my colleagues that shared this academic journey with me, who supported
me and gave me the strength to continue. We started this journey together but, unfortunately, we had
to finish it apart. However, I am very grateful for meeting you. To all of my friends for supporting me.
To my beloved boyfriend, Miguel Mataloto, the greatest thanks for all the patience and
unconditionally support during this last year and for having accompanied me in all the stages of this
journey. I am truly sure that I could not made it without you.
Last but not least, an enormous thank to my family, especially my mother, father, sister,
grandmother and grandfathers, who had support me more than anyone at all stages of my life. To my
parent’s thank you for allowing me to have an education, this would be completely impossible without
you.
Optimization of a Bioassay to Evaluate Escherichia coli Stress Responses
2017
III
Abstract
In the last decade, Fourier Transform Infrared Spectroscopy (FTIR) has been applied in
several areas, being an increasingly used technique in microbiology, especially for whole cell
metabolomics fingerprint. However, the reproducibility of this technique is influenced by a large
number of factors such as the physiological state of cells, sample manipulation and growth conditions.
In order to solve this problem, the present work intends to optimize a bioassay for evaluating the
response of microorganisms to stress conditions, using Escherichia coli as a model, as its metabolic
pathways share pronounced similarities to mainstream pathways across other microorganisms.
The bioassay was optimized in terms of nutrient medium concentration, E.coli growth phase
and exposed time to the stress agents. The stress agents used were: ethanol, bleach, sodium chloride,
hydrochloric acid and sodium hydroxide. These agents were chosen for having different mechanisms
of action in microorganism’s cells. A bioassay which allows to evaluate the metabolic response of the
microorganism cell when exposed to stress conditions is important to increase knowledge about
microbial metabolism and for example for the development of new drugs. After the bioassay
optimization, it was decided to test the assay exposing the E. coli cells to six antibiotics, whose
mechanism of action is known. This allows to observe if the optimization of the bioassay meets the
objective of differentiating samples exposed to different substances. It was observed that the
conditions that allow higher reproducibility and sensitivity of the bioassay are different for each type
of stress agent, but as a general rule exposing the cells to stress agents for 24 hrs, use the nutrient
medium 1.25x concentrate and the cells in the stationary growth phase were the global optimal
conditions to distinguish the various mechanisms of action on the metabolism of E. coli cells.
The approach described allowed to identify the impact of each parameter on the metabolic
resolution of the biomolecular fingerprint acquired by FTIR spectroscopy, and therefore, the adapted
bioassay maximizes the metabolic fingerprinting ability of the method, namely to characterize
different metabolic stress responses.
KEYWORDS: Stress Response, Escherichia coli, Fourier transform Infra-red Spectroscopy,
Bioassay, Metabolic Fingerprinting
III
Resumo
Na última década, a espectroscopia por transformada de Fourier (FTIR) tem vindo a ser
aplicada às mais diversificadas áreas, sendo uma técnica cada vez mais utilizada em microbiologia,
por permitir obter resultados num curto espaço de tempo e por ter um baixo custo por análise. No
entanto, a reprodutibilidade desta técnica é influenciada por um grande número de fatores, entre os
quais, o estado fisiológico das células, o método de manipulação da amostra e as condições de
crescimento. Para tentar solucionar este problema, o presente trabalho pretende otimizar um bioensaio,
baseado em espectroscopia de infravermelho, para avaliar a resposta metabólica dos microrganismos
quando expostos a condições de stress, utilizando a bactéria Escherichia coli como modelo, uma vez
que as suas vias metabólicas são muito semelhantes com as de outros microrganismos.
O bioensaio foi otimizado em termos da concentração de nutriente do meio de cultura,
(tendo sido testadas as concentrações 1.25, 2.5 e 5x), fase de crescimento da bactéria E. coli (onde
foram utilizadas células na fase exponencial, no início da fase estacionária e na fase estacionária) e o
tempo de exposição das células aos agentes de stress (1, 8 e 24 h). Os agentes de stress utilizados
foram: álcool, lixívia, cloreto de sódio, ácido clorídrico e hidróxido de sódio. Estes agentes foram
escolhidos por teres diferentes mecanismos de ação nas células dos microrganismos. É de extrema
importância o desenvolvimento e otimização de bioensaios que permitam avaliar a resposta metabólica
das células dos microrganismos quando expostos a condições adversas, para aumentar o conhecimento
sobre o metabolismo microbiano e, por exemplo, para o desenvolvimento de novos antibióticos. Após
a otimização do bioensaio, foi decidido testar o ensaio expondo as células de E. coli a seis antibióticos
diferentes, cujos mecanismos de ação são conhecidos. Desta maneira, é possível observar se a
otimização do bioensaio cumpre o objetivo de diferenciar amostras expostas a diferentes substâncias.
Observou-se que as condições que permitem obter uma maior reprodutibilidade e
sensibilidade do bioensaio são diferentes para cada tipo de agente de stress, mas regra geral, expor as
células aos agentes de stress durante 24 horas, usar o meio 1.25x concentrado e as células na fase de
crescimento estacionária permite distinguir os vários mecanismos de ação no metabolismo das células
de E. coli.
A metodologia descrita permitiu identificar o impacto de cada parâmetro na resolução
metabólica da impressão digital biomolécula adquirida pela espectroscopia FTIR e, portanto, o
bioensaio otimizado maximiza a capacidade metabólica de impressão digital do método,
nomeadamente ao caracterizar diferentes respostas metabólico ao stress.
Palavras-Chave: Resposta ao stress, Escherichia coli, Espectroscopia de infravermelho por
transformada de Frourier, Bioensaio, Impressão metabólica
Optimization of a Bioassay to Evaluate Escherichia coli Stress Responses
2017
IV
Table of contents
List of figures ........................................................................................................................................... V
List of Abbreviations ................................................................................................................................ X
1. Thesis overview ............................................................................................................................... 1
1.1 Objectives ...................................................................................................................................... 1
1.2 Thesis Outline ............................................................................................................................... 1
2. Introduction ..................................................................................................................................... 2
2.1 Infrared spectroscopy .................................................................................................................... 2
2.1.1 Instrumentation ....................................................................................................................... 4
2.1.2 Acquisition Modes ................................................................................................................. 6
2.1.3 Applications to Microbiology................................................................................................. 6
2.1.4 Chemometrics and Spectral pre-processing techniques ......................................................... 8
2.2 Bioassay optimization ................................................................................................................. 11
2.2.1 Escherichia coli bacteria and stress responses ..................................................................... 12
2.2.2 Application of the bioassay .................................................................................................. 14
3. Materials and methods ................................................................................................................. 16
3.1 Culture growth conditions and Bioassay ..................................................................................... 16
3.2. Preparation of solutions of stress agents .................................................................................... 17
3.3 Preparation of antibiotic solutions ............................................................................................... 18
3.4 FTIR spectra acquisition, preprocessing and analysis ................................................................. 19
4. Results and Discussion .................................................................................................................. 20
4.1 Bioassay optimization ................................................................................................................. 20
4.1.1 Effect of nutrient media concentration ................................................................................. 21
4.1.2 Effect of E. coli growth phase .............................................................................................. 31
4.1.3 Incubation time ..................................................................................................................... 38
4.1.4 Global analysis of the bioassay ............................................................................................ 48
4.2 Application of the bioassay ......................................................................................................... 50
5. Conclusions and prospects ............................................................................................................ 59
6. References ..................................................................................................................................... 60

Optimization of a Bioassay to Evaluate Escherichia coli Stress Responses
2017
V
List of figures
Figure 2.1 - Electromagnetic spectrum (Adapted from: KHANACADEMY, 2017) ............................. 2
Figure 2.2 - Regions of the infrared spectrum (Adapted from: Edmund Scientific, 2017) .................... 3
Figure 2.3 - MIR absorption spectrum with bands associated to molecular bounds of biomolecules
highlighted (Graça et al., 2013) ............................................................................................................... 8
Figure 2.4 - Spectral derivatives (Adapted from: ASDinc, 2017) ............................................................. 10
Figure 2.5 – PCA of different E. coli isolates to see if the unidentified isolates correspond to the
known isolate. The different colours represent the different isolates of E.coli, the black ones are
identified as ST131 isolates, while other colours indicate groups of unknown sequence types
(Adapted from: Harrison and Hanson, 2007) ........................................................................................ 11
Figure 4.1 - FTIR spectra obtained from quintuplicates of assays of E. coli cells incubated for 1 hour
(T1) with ethanol concentrations of 0 (C0), 2 (C1) and 10% (C2) (v/v) a) without preprocessing, b)
preprocessed by baseline correction, normalization and MSC, c) preprocessing by second derivative.
............................................................................................................................................................... 20
Figure 4.2 - PCA score plot of FTIR spectra of E.coli submitted to different ethanol concentrations
(C0 = 0; C1 = 2; C2 = 10% (V/V)) and incubated with different nutrient media concentration (M
1.25x, 2.5x and 5x). a) without preprocessing b) preprocessed by base line correction and
normalization Amide I. PC1, PC2 and PC3 represents 95%, 4% and 1% of data variance, respectively
............................................................................................................................................................... 22
Figure 4.3 - PCA score plot of FTIR spectra of E. coli submitted to different bleach concentrations
(C0 = 0; C1 = 10; C2 = 80 ppm) and incubated with different nutrient media concentration (M 1.25x,
2.5x and 5x) a) preprocessed by base line correction and Min Max normalization b) preprocessed
second derivative. PC1, PC2 and PC3 represent 98%, 1% and 1% of data variance, respectively....... 23
Figure 4.4 – PCA score plot of FTIR spectra of E. coli submitted to different sodium chloride
concentrations (C0 = 0; C1 = 4; C2 = 8% (W/V)) and incubated with different nutrient media
concentration (M 1.25x, 2.5x and 5x) a) preprocessed by base line correction, Min Amide I
normalization and MSC b) preprocessed by base line correction, MinMax normalization and MSC.
PC1, PC2 and PC3 represent 98%, 1% and 1% of data variance, respectively..................................... 25
Figure 4.5 - PCA score plot of FTIR spectra of E. coli submitted to different hydrochloric acid
concentrations (C0 = 0; C1 = 250; C2 = 500 μL) and incubated with different nutrient media
concentration (M 1.25x, 2.5x and 5x) a) preprocessed by base line correction, Min Amide I
normalization and MSC b) preprocessed by second derivative. PC1, PC2 and PC3 represent 95%, 4%
and 1% of data variance, respectively ................................................................................................... 27
Figure 4.6 - PCA score plot of FTIR spectra of E. coli submitted to different sodium hydroxide
concentrations (C0 = 0; C1 = 250; C2 = 500 μL) and incubated with different nutrient media
concentration (M 1.25x, 2.5x and 5x) a) preprocessed by base line correction b) preprocessed by
MinMax normalization and MSC. PC1, PC2 and PC3 represent 95%, 4% and 1% of data variance,
respectively ............................................................................................................................................ 29
Figure 4.7 - PCA score plot of FTIR spectra of E. coli submitted to different concentrations (C) of the
stress agents ethanol (A1), bleach (A2), sodium chloride (A3), hydrochloric acid (A4) and sodium
hydroxide (A5) and different nutrient media concentration (M 1.25x, 2.5x and 5x) a) medium 1.25x,
with spectra preprocessed by second derivative, b) medium 2.5x, with spectra preprocessed by base
line correction, MinMax normalization and MSC c) medium 5x, with spectra preprocessed by Min

Optimization of a Bioassay to Evaluate Escherichia coli Stress Responses
2017
VI
Amide I normalization and MSC. PC1, PC2 and PC3 represent 96%, 3% and 1% of data variance,
respectively ............................................................................................................................................ 30
Figure 4.8 - PCA score plot of FTIR spectra of E. coli submitted to different ethanol concentrations
(C0 = 0; C1 = 2; C2 = 10% (V/V)) and in different growth phase (8, 16 and 24 hrs), preprocessed by
base line correction and Min Amide I normalization. PC1, PC2 and PC3 represent 98%, 1% and 1% of
data variance, respectively .................................................................................................................... 31
Figure 4.9 - PCA score plot of FTIR spectra of E. coli submitted to different bleach concentrations
(C0 = 0; C1 = 10; C2 = 80 ppm) and in different growth phase (8, 16 and 24 hrs), preprocessed by
base line correction, MinMax normalization and MSC. PC1, PC2 and PC3 represent 98%, 1% and 1%
of data variance, respectively ................................................................................................................ 32
Figure 4.10 - PCA score plot of FTIR spectra of E. coli submitted to different sodium chloride
concentrations (C0 = 0; C1 = 4; C2 = 8% (W/V)) and in different growth phase (8, 16 and 24 hrs),
preprocessed by base line correction. PC1, PC2 and PC3 represent 95%, 4% and 1% of data variance,
respectively ............................................................................................................................................ 33
Figure 4.11 - PCA score plot of FTIR spectra of E. coli submitted to different hydrochloric acid
concentrations (C0 = 0; C1 = 250; C2 = 500 μL) and in different growth phase (8, 16 and 24 hrs), a)
preprocessed by second derivative. PC1, PC2 and PC3 represent 94%, 5% and 1% of data variance,
respectively. ........................................................................................................................................... 34
Figure 4.12 - PCA score plot of FTIR spectra of E. coli submitted to different sodium hydroxide
concentrations (C0 = 0; C1 = 250; C2 = 500 μL) and in different growth phase (8, 16 and 24 hrs),
preprocessed by second derivative. PC1, PC2 and PC3 represent 91%, 6% and 3% of data variance,
respectively ............................................................................................................................................ 35
Figure 4.13 - PCA score plot of FTIR spectra of E. coli submitted to different concentrations (C) of
the stress agents ethanol (A1), bleach (A2), sodium chloride (A3), hydrochloric acid (A4) and sodium
hydroxide (A5) and different in different growth phase (8, 16 and 24 hrs) a) after eight hrs of growth,
preprocessed by second derivative b) after sixteen hrs of growth, preprocessed by base line correction,
Min Amide I normalization and MSC c) after twenty-four hrs of growth, preprocessed by second
derivative. PC1, PC2 and PC3 represent 98%, 1% and 1% of data variance, respectively ................... 37
Figure 4.14 - PCA score plot of FTIR spectra of E. coli submitted to different ethanol concentrations
(C0 = 0; C1 = 2; C2 = 10%) and with different incubation times (1, 8 and 24 hrs) a) preprocessed by
base line correction and MinMax normalization b) preprocessed by second derivative. PC1, PC2 and
PC3 represent 98%, 1% and 1% of data variance, respectively ............................................................ 38
Figure 4.15 - PCA score plot of FTIR spectra of E. coli submitted to different bleach concentrations
(C0 = 0; C1 = 10; C2 = 80 ppm) and with different incubation times (1, 8 and 24 hrs) a) preprocessed
by second derivative b) preprocessed by Min Amide I normalization and MSC. PC1, PC2 and PC3
represent 98%, 1% and 1% of data variance, respectively .................................................................... 40
Figure 4.16 - PCA score plot of FTIR spectra of E. coli submitted to different sodium chloride
concentrations (C0 = 0; C1 = 4; C2 = 8% (W/V)) and with different incubation times (1, 8 and 24 hrs)
a) without preprocessing b) preprocessed by MinMax normalization and MSC. PC1, PC2 and PC3
represent 98%, 1% and 1% of data variance, respectively .................................................................... 42
Figure 4.17 - PCA score plot of FTIR spectra of E. coli submitted to different hydrochloric acid
concentrations (C0 = 0; C1 = 250; C2 = 500 μL) and with different incubation times (1, 8 and 24 hrs)
a) without preprocessing b) preprocessed by second derivative. PC1, PC2 and PC3 represent 95%, 4%
and 1% of data variance, respectively. .................................................................................................. 44
Figure 4.18 - PCA score plot of FTIR spectra of E. coli submitted to different sodium hydroxide
concentrations (C0 = 0; C1 = 250; C2 = 500 μL) and with different incubation times (1, 8 and 24 hrs)

Optimization of a Bioassay to Evaluate Escherichia coli Stress Responses
2017
VII
a) preprocessed by base line correction, Min Amide I normalization and MSC b) preprocessed by
second derivative. PC1, PC2 and PC3 represent 88%, 8% and 4% of data variance, respectively....... 45
Figure 4.19 - PCA score plot of FTIR spectra of E. coli submitted to different concentrations (C) of
the stress agents ethanol (A1), bleach (A2), sodium chloride (A3), hydrochloric acid (A4) and sodium
hydroxide (A5) and with different incubation times (1, 8 and 24 hrs) a) after one hr of incubation,
preprocessed by second derivative b) after eight hrs of incubation, preprocessed by second derivative
c) after twenty four hrs of incubation, preprocessed by second derivative. PC1, PC2 and PC3 represent
95%, 4% and 1% of data variance, respectively. .................................................................................. 47
Figure 4.20 - PCA score plot of FTIR spectra of E. coli submitted to different concentrations of the
antibiotic amoxicillin (C0 = 0; C1 = 0.01; C2 = 0.04; C3 = 0.2; C4 = 5; C5 = 25; C6 = 62.5; C7 = 125
mg/μL) a) preprocessed by second derivative b) preprocessed by second derivative. PC1, PC2 and
PC3 represent 98%, 1% and 1% of data variance, respectively. ........................................................... 51
Figure 4.21 - PCA score plot of FTIR spectra of E. coli submitted to different concentrations of the
antibiotic ampicillin (C0 = 0; C1 = 0.01; C2 = 0.04; C3 = 0.2; C4 = 5; C5 = 25; C6 = 62.5; C7 = 125
mg/μL) a) without preprocessing b) preprocessed by second derivative. PC1, PC2 and PC3 represent
98%, 1% and 1% of data variance, respectively. .................................................................................. 52
Figure 4.22 - PCA sore plot of FTIR spectra of E. coli submitted to different concentrations of the
antibiotic ciprofloxacin (C0 = 0; C1 = 0.01; C2 = 0.04; C3 = 0.2; C4 = 5; C5 = 25; C6 = 62.5; C7 =
125 mg/μL) a) preprocessed by base line correction and Min Amide I normalization b) preprocessed
by Min Amide I normalization. PC1, PC2 and PC3 represent 98%, 1% and 1% of data variance,
respectively ............................................................................................................................................ 53
Figure 4.23 - PCA sore plot of FTIR spectra of E. coli submitted to different concentrations of the
antibiotic erythromycin (C0 = 0; C1 = 0.01; C2 = 0.04; C3 = 0.2; C4 = 5; C5 = 25; C6 = 62.5; C7 =
125 mg/μL) a) preprocessed by base line correction and Min Amide I normalization b) preprocessed
by second derivative. PC1, PC2 and PC3 represent 98%, 1% and 1% of data variance, respectively.. 54
Figure 4.24 - PCA sore plot FTIR spectra of E. coli submitted to different concentrations of the
antibiotic metronidazole (C0 = 0; C1 = 0.01; C2 = 0.04; C3 = 0.2; C4 = 5; C5 = 25; C6 = 62.5; C7 =
125 mg/ μL) a) preprocessed by base line correction, Min Amide I normalization and MSC b)
preprocessed by Min Max normalization. PC1, PC2 and PC3 represent 98%, 1% and 1% of data
variance, respectively ............................................................................................................................ 55
Figure 4.25 - PCA sore plot FTIR spectra of E. coli submitted to different concentrations of the
antibiotic neomycin (C0 = 0; C1 = 0.01; C2 = 0.04; C3 = 0.2; C4 = 5; C5 = 25; C6 = 62.5; C7 = 125
mg/μL) a) preprocessed by base line correction, Min Amide I normalization and MSC b) preprocessed
by Min Max normalization. PC1, PC2 and PC3 represent 98%, 1% and 1% of data variance,
respectively ............................................................................................................................................ 56
Figure 4.26 - PCA sore plot FTIR spectra of E. coli submitted to different concentrations of the all
antibiotics tested (amoxicillin, ampicillin, ciprofloxacin, erythromycin, metronidazole and neomycin)
a) preprocessed by base line correction and Min Amide I normalization b) pre-processed by base line
correction and Min Amide I normalization. PC1, PC2 and PC3 represent 98%, 1% and 1% of data
variance, respectively ............................................................................................................................ 58
Optimization of a Bioassay to Evaluate Escherichia coli Stress Responses
2017
VIII
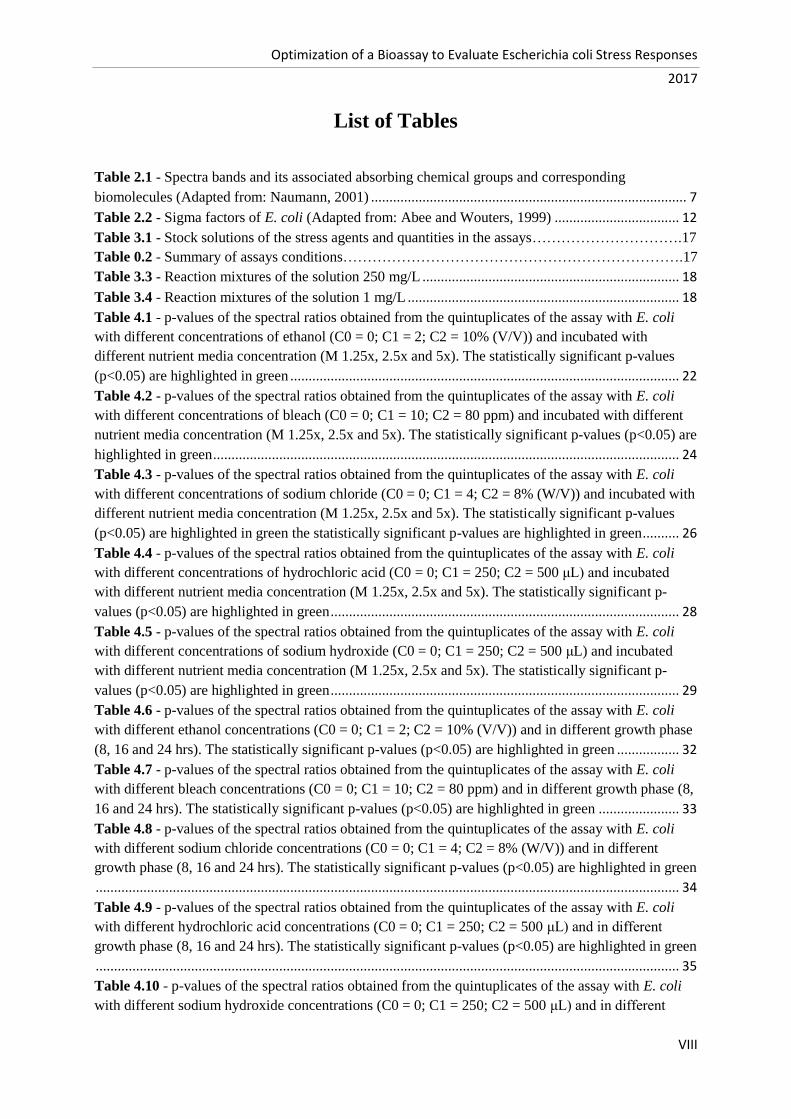
List of Tables
Table 2.1 - Spectra bands and its associated absorbing chemical groups and corresponding
biomolecules (Adapted from: Naumann, 2001) ...................................................................................... 7
Table 2.2 - Sigma factors of E. coli (Adapted from: Abee and Wouters, 1999) .................................. 12
Table 3.1 - Stock solutions of the stress agents and quantities in the assays………………………….17
Table 0.2 - Summary of assays conditions…………………………………………………………….17
Table 3.3 - Reaction mixtures of the solution 250 mg/L ...................................................................... 18
Table 3.4 - Reaction mixtures of the solution 1 mg/L .......................................................................... 18
Table 4.1 - p-values of the spectral ratios obtained from the quintuplicates of the assay with E. coli
with different concentrations of ethanol (C0 = 0; C1 = 2; C2 = 10% (V/V)) and incubated with
different nutrient media concentration (M 1.25x, 2.5x and 5x). The statistically significant p-values
(p<0.05) are highlighted in green .......................................................................................................... 22
Table 4.2 - p-values of the spectral ratios obtained from the quintuplicates of the assay with E. coli
with different concentrations of bleach (C0 = 0; C1 = 10; C2 = 80 ppm) and incubated with different
nutrient media concentration (M 1.25x, 2.5x and 5x). The statistically significant p-values (p<0.05) are
highlighted in green ............................................................................................................................... 24
Table 4.3 - p-values of the spectral ratios obtained from the quintuplicates of the assay with E. coli
with different concentrations of sodium chloride (C0 = 0; C1 = 4; C2 = 8% (W/V)) and incubated with
different nutrient media concentration (M 1.25x, 2.5x and 5x). The statistically significant p-values
(p<0.05) are highlighted in green the statistically significant p-values are highlighted in green .......... 26
Table 4.4 - p-values of the spectral ratios obtained from the quintuplicates of the assay with E. coli
with different concentrations of hydrochloric acid (C0 = 0; C1 = 250; C2 = 500 μL) and incubated
with different nutrient media concentration (M 1.25x, 2.5x and 5x). The statistically significant p-
values (p<0.05) are highlighted in green ............................................................................................... 28
Table 4.5 - p-values of the spectral ratios obtained from the quintuplicates of the assay with E. coli
with different concentrations of sodium hydroxide (C0 = 0; C1 = 250; C2 = 500 μL) and incubated
with different nutrient media concentration (M 1.25x, 2.5x and 5x). The statistically significant p-
values (p<0.05) are highlighted in green ............................................................................................... 29
Table 4.6 - p-values of the spectral ratios obtained from the quintuplicates of the assay with E. coli
with different ethanol concentrations (C0 = 0; C1 = 2; C2 = 10% (V/V)) and in different growth phase
(8, 16 and 24 hrs). The statistically significant p-values (p<0.05) are highlighted in green ................. 32
Table 4.7 - p-values of the spectral ratios obtained from the quintuplicates of the assay with E. coli
with different bleach concentrations (C0 = 0; C1 = 10; C2 = 80 ppm) and in different growth phase (8,
16 and 24 hrs). The statistically significant p-values (p<0.05) are highlighted in green ...................... 33
Table 4.8 - p-values of the spectral ratios obtained from the quintuplicates of the assay with E. coli
with different sodium chloride concentrations (C0 = 0; C1 = 4; C2 = 8% (W/V)) and in different
growth phase (8, 16 and 24 hrs). The statistically significant p-values (p<0.05) are highlighted in green
............................................................................................................................................................... 34
Table 4.9 - p-values of the spectral ratios obtained from the quintuplicates of the assay with E. coli
with different hydrochloric acid concentrations (C0 = 0; C1 = 250; C2 = 500 μL) and in different
growth phase (8, 16 and 24 hrs). The statistically significant p-values (p<0.05) are highlighted in green
............................................................................................................................................................... 35
Table 4.10 - p-values of the spectral ratios obtained from the quintuplicates of the assay with E. coli
with different sodium hydroxide concentrations (C0 = 0; C1 = 250; C2 = 500 μL) and in different

Optimization of a Bioassay to Evaluate Escherichia coli Stress Responses
2017
IX
growth phase (8, 16 and 24 hrs). The statistically significant p-values (p<0.05) are highlighted in green
............................................................................................................................................................... 36
Table 4.11 - p-values of the spectral ratios obtained from the quintuplicates of the assay with E. coli
with different ethanol concentrations (C0 = 0; C1 = 2; C2 = 10%) and with different incubation times
(1, 8 and 24 hrs). The statistically significant p-values (p<0.05) are highlighted in green ................... 39
Table 4.12 - p-values of the spectral ratios obtained from the quintuplicates of the assay with E. coli
with different bleach concentrations (C0 = 0; C1 = 10; C2 = 80 ppm) and with different incubation
times (1, 8 and 24 hrs). The statistically significant p-values (p<0.05) are highlighted in green the
statistically significant p-values are highlighted in green ..................................................................... 41
Table 4.13 - p-values of the spectral ratios obtained from the quintuplicates of the assay with E. coli
with different sodium chloride concentrations (C0 = 0; C1 = 4; C2 = 8% (W/V)) and with different
incubation times (1, 8 and 24 hrs). The statistically significant p-values (p<0.05) are highlighted in
green ...................................................................................................................................................... 43
Table 4.14 - p-values of the spectral ratios obtained from the quintuplicates of the assay with E. coli
with different acid hydrochloric concentrations (C0 = 0; C1 = 250; C2 = 500 μL) and with different
incubation times (1, 8 and 24 hrs). The statistically significant p-values (p<0.05) are highlighted in
green ...................................................................................................................................................... 44
Table 4.15 - p-values of the spectral ratios obtained from the quintuplicates of the assay with E. coli
with different sodium hydroxide concentrations (C0 = 0; C1 = 250; C2 = 500 μL) and with different
incubation times (1, 8 and 24 hrs). The statistically significant p-values (p<0.05) are highlighted in
green ...................................................................................................................................................... 46
Table 4.16 - Optimal conditions for the bioassay for each stress agent taking into account nutrient
concentration, E. coli growth phase and incubation time ...................................................................... 48
Table 4.17 - Main spectral ratios that reflected the effect of each stress agents on the cell metabolism
............................................................................................................................................................... 50
Table 4.18 - p-values of the spectral ratios obtained from the quintuplicates of the assay with E. coli
with different amoxicillin concentrations (C0 = 0; C1 = 0.01; C2 = 0.04; C3 = 0.2; C4 = 5; C5 = 25;
C6 = 62.5; C7 = 125 mg/μL). The statistically significant p-values (p<0.05) are highlighted in green.
............................................................................................................................................................... 51
Table 4.19 - p-values of the spectral ratios obtained from the quintuplicates of the assay with E. coli
with different ampicillin concentrations (C0 = 0; C1 = 0.01; C2 = 0.04; C3 = 0.2; C4 = 5; C5 = 25; C6
= 62.5; C7 = 125 mg/μL). The statistically significant p-values (p<0.05) are highlighted in green ..... 53
Table 4.20 - p-values of the spectral ratios obtained from the quintuplicates of the assay with E. coli
with different ciprofloxacin concentrations (C0 = 0; C1 = 0.01; C2 = 0.04; C3 = 0.2; C4 = 5; C5 = 25;
C6 = 62.5; C7 = 125 mg/μL). The statistically significant p-values (p<0.05) are highlighted in green 54
Table 4.21 - p-values of the spectral ratios obtained from the quintuplicates of the assay with E. coli
with different erythromycin concentrations (C0 = 0; C1 = 0.01; C2 = 0.04; C3 = 0.2; C4 = 5; C5 = 25;
C6 = 62.5; C7 = 125 mg/μL). The statistically significant p-values (p<0.05) are highlighted in green 55
Table 4.22 - p-values of the spectral ratios obtained from the quintuplicates of the assay with E. coli
with different metronidazole concentrations (C0 = 0; C1 = 0.01; C2 = 0.04; C3 = 0.2; C4 = 5; C5 = 25;
C6 = 62.5; C7 = 125 mg/μL). The statistically significant p-values (p<0.05) are highlighted in green.
............................................................................................................................................................... 56
Table 4.23 - p-values of the spectral ratios obtained from the quintuplicates of the assay with E. coli
with different neomycin concentrations (C0 = 0; C1 = 0.01; C2 = 0.04; C3 = 0.2; C4 = 5; C5 = 25; C6
= 62.5; C7 = 125 mg/μL). The statistically significant p-values (p<0.05) are highlighted in green ..... 57

Optimization of a Bioassay to Evaluate Escherichia coli Stress Responses
2017
X
List of Abbreviations
ATR: Attenuated total reflection
BT: Bacto tryptone
DPT: Data point table
Far-IR: Far infrared
FTIR: Fourier Transform Infrared
IR: Infrared
MIR: Mid-Infrared
MSC: Multiple scattering correction
NIR: Near-Infrared
OD: Optical density
PC: Principal component
PCA: Principal component analysis
RNAP: RNA polymerase
ROS: Reactive oxygen species
SNR: Signal-to-noise ratio
YE: Yeast extract

1
1. Thesis overview
1.1 Objectives
The main goal of the present study was to optimize a bioassay to evaluate the biochemical and
metabolic profile of Escherichia coli (E. coli) bacteria, when exposed to diverse environmental
conditions as stress agents as: ethanol, bleach, sodium chloride, hydrochloric acid, sodium hydroxide
and antibiotics. The bioassay is based on Fourier Transform Infrared (FTIR) spectroscopy analysis of
micro volume of an incubation mixture of E. coli cells with a nutrient medium and the stress agents.
The FTIR spectra are acquired in a simple, rapid, economic, sensitive and high-throughput mode. In
order to reach a high sensitivity in the evaluation the effect of environmental conditions in the bacteria
metabolism, it is intended to optimise the following conditions related to the incubation mixture of the
bacteria with the stress agents: nutrient medium concentration, E. coli growth phase and incubation
time. Another goal was to find spectral biomarkers for the changes that occur in the metabolism of
bacteria when exposed to stress conditions.
1.2 Thesis Outline
The present work is divided into three parts: general introduction, optimization of a bioassay
based on Fourier Transform Infrared spectroscopy and bioassay testing through exposure of E. coli to
different antibiotics. The first part includes a description of IR spectroscopy, where some theoretical
explanations about the technique and the description of the analysis methods are presented. The last
two sections of this work are related to the experimental work carried out. For the bioassay
optimization, the following parameters of the bacteria incubation mixture with the stress agents were
evaluated: the growth phase of the bacteria, incubation time of the reaction mixture with the stress
agents and the composition of the nutrient medium used on the incubation mixture. Finally, the
optimized bioassay was used to evaluate the effect of six different antibiotics on the bacteria
metabolism that affects the bacteria metabolism by different mechanisms as by inhibiting the cell
membrane synthesis, the protein synthesis and DNA synthesis.

Optimization of a Bioassay to Evaluate Escherichia coli Stress Responses
2017
2
2. Introduction
2.1 Infrared spectroscopy
Spectroscopy consists in the study of electromagnetic radiation emitted or absorbed by a body.
The term began to be used at the end of the XIX century, after Bunsen and Kirchhoff, in 1860, found
that absorption and emission spectra made it possible to determine the presence of certain chemical
elements in a sample, which allowed the discovery of cesium, rubidium and thallium (Thomas, 1991).
Nowadays, a spectrum is understood as the representation of a given magnitude referring to a study
object as a function of the frequency, energy or wavelength of the absorbed or emitted radiation.
Absorption occurs when the emitted radiation is attenuated by the sample and emission takes place
when radiation is produced by the sample due to excitation by a light source (Thomas, 1991). The set
of electromagnetic radiation constitutes the electromagnetic spectrum, which is dividing into several
regions: gamma rays, x-rays, ultraviolet, visible, infrared, microwave, radio (figure 2.1).
In this work was intended to use infrared (IR) radiation to study the metabolic changes in E.
coli bacteria when exposed to adverse conditions. In 1800, William Herschel discovered that IR is a
non-ionizing radiation in the invisible portion of the electromagnetic spectrum that is adjacent to the
long wavelengths. Herschel placed a mercury thermometer on the spectrum obtained by a crystal
prism with the purpose of measuring the heat emitted by each colour. He found that the heat was
stronger closer to the red light of the spectrum. This was the first experiment that observed that heat
can be captured in the image form, as with visible light (Oliveira and Silva, 2014). The IR region can
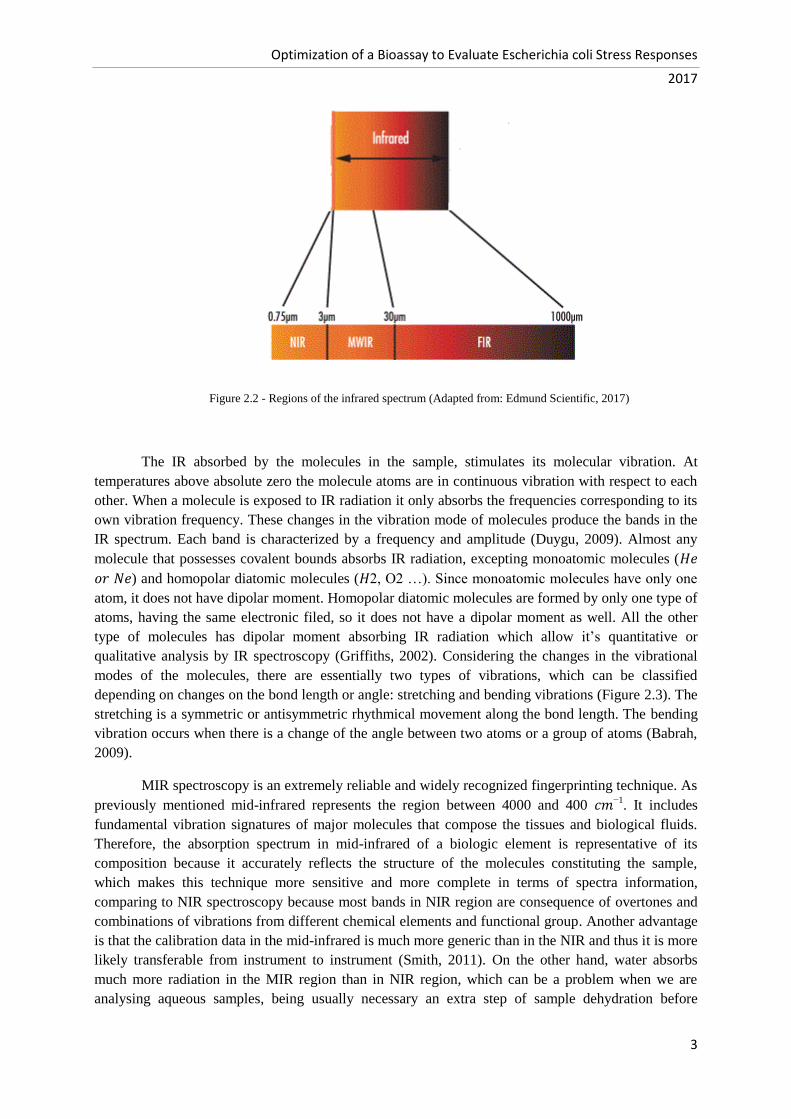
be subdivided into three distinct zones, according to the wavelength: near infrared (NIR), medium
infrared (MIR) and far infrared (far-IR). Far-IR ranges from 400 to 4 𝑐𝑚−1 in the IR spectrum, MIR
represents the region between 4000 and 400 𝑐𝑚−1 and NIR the region between 14000 and 4000 𝑐𝑚−1
(Figure 2.2) (Smith, 2011). In this work, was used the MIR radiation, which will be discussed later.
Figure 2.1 - Electromagnetic spectrum (Adapted from: KHANACADEMY, 2017)
Optimization of a Bioassay to Evaluate Escherichia coli Stress Responses
2017
3
Figure 2.2 - Regions of the infrared spectrum (Adapted from: Edmund Scientific, 2017)
The IR absorbed by the molecules in the sample, stimulates its molecular vibration. At
temperatures above absolute zero the molecule atoms are in continuous vibration with respect to each
other. When a molecule is exposed to IR radiation it only absorbs the frequencies corresponding to its
own vibration frequency. These changes in the vibration mode of molecules produce the bands in the
IR spectrum. Each band is characterized by a frequency and amplitude (Duygu, 2009). Almost any
molecule that possesses covalent bounds absorbs IR radiation, excepting monoatomic molecules (𝐻𝑒
𝑜𝑟 𝑁𝑒) and homopolar diatomic molecules (𝐻2, O2 …). Since monoatomic molecules have only one
atom, it does not have dipolar moment. Homopolar diatomic molecules are formed by only one type of
atoms, having the same electronic filed, so it does not have a dipolar moment as well. All the other
type of molecules has dipolar moment absorbing IR radiation which allow it’s quantitative or
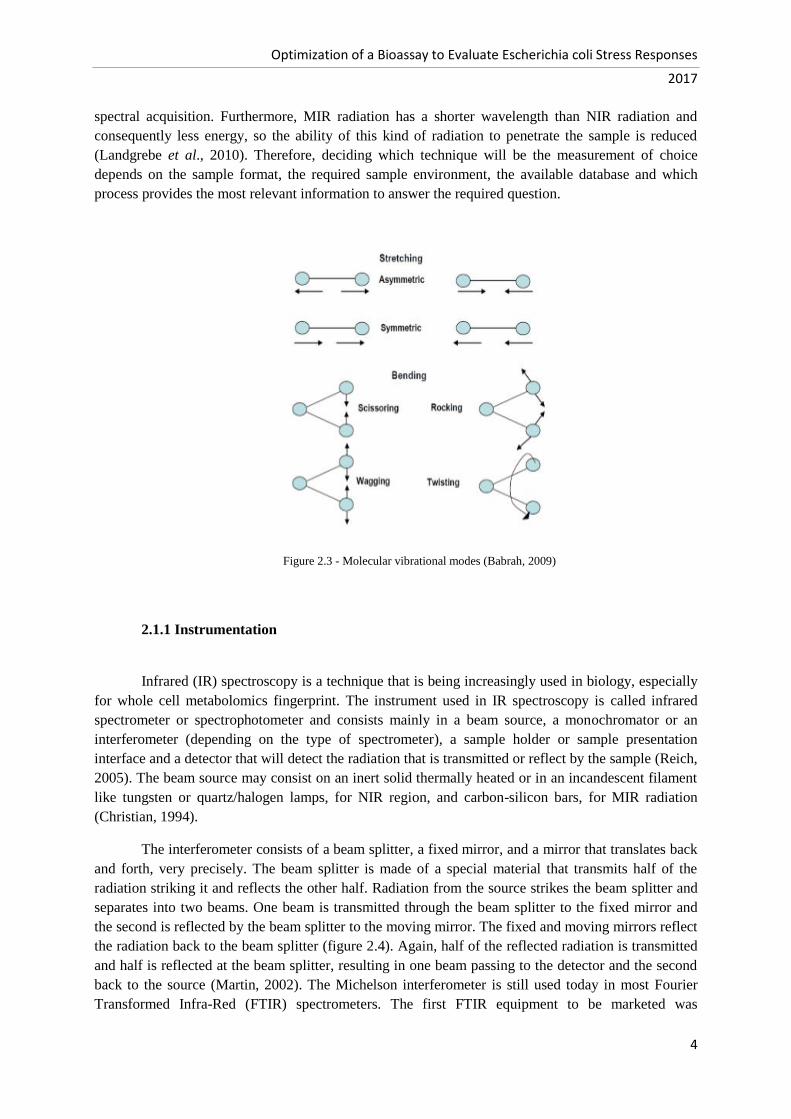
qualitative analysis by IR spectroscopy (Griffiths, 2002). Considering the changes in the vibrational
modes of the molecules, there are essentially two types of vibrations, which can be classified
depending on changes on the bond length or angle: stretching and bending vibrations (Figure 2.3). The
stretching is a symmetric or antisymmetric rhythmical movement along the bond length. The bending
vibration occurs when there is a change of the angle between two atoms or a group of atoms (Babrah,
2009).
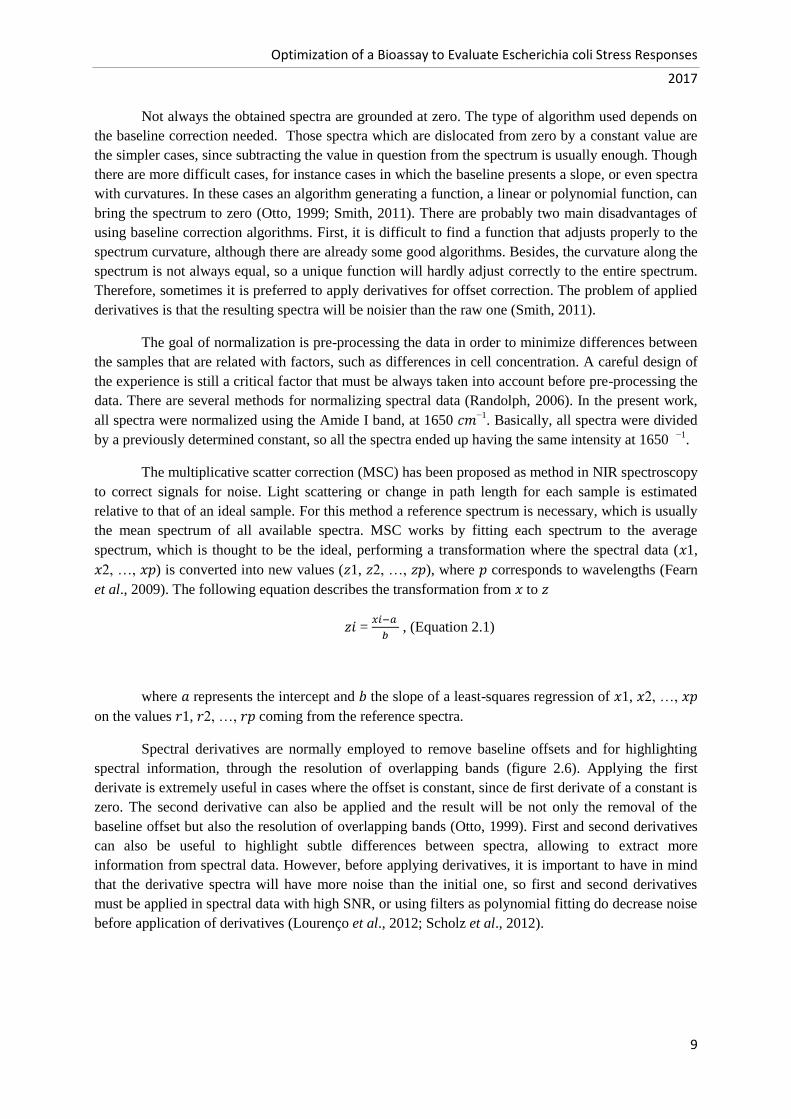
MIR spectroscopy is an extremely reliable and widely recognized fingerprinting technique. As
previously mentioned mid-infrared represents the region between 4000 and 400 𝑐𝑚−1. It includes
fundamental vibration signatures of major molecules that compose the tissues and biological fluids.
Therefore, the absorption spectrum in mid-infrared of a biologic element is representative of its
composition because it accurately reflects the structure of the molecules constituting the sample,
which makes this technique more sensitive and more complete in terms of spectra information,
comparing to NIR spectroscopy because most bands in NIR region are consequence of overtones and
combinations of vibrations from different chemical elements and functional group. Another advantage
is that the calibration data in the mid-infrared is much more generic than in the NIR and thus it is more
likely transferable from instrument to instrument (Smith, 2011). On the other hand, water absorbs
much more radiation in the MIR region than in NIR region, which can be a problem when we are
analysing aqueous samples, being usually necessary an extra step of sample dehydration before
Optimization of a Bioassay to Evaluate Escherichia coli Stress Responses
2017
4
spectral acquisition. Furthermore, MIR radiation has a shorter wavelength than NIR radiation and
consequently less energy, so the ability of this kind of radiation to penetrate the sample is reduced
(Landgrebe et al., 2010). Therefore, deciding which technique will be the measurement of choice
depends on the sample format, the required sample environment, the available database and which
process provides the most relevant information to answer the required question.
Figure 2.3 - Molecular vibrational modes (Babrah, 2009)
2.1.1 Instrumentation
Infrared (IR) spectroscopy is a technique that is being increasingly used in biology, especially
for whole cell metabolomics fingerprint. The instrument used in IR spectroscopy is called infrared
spectrometer or spectrophotometer and consists mainly in a beam source, a monochromator or an
interferometer (depending on the type of spectrometer), a sample holder or sample presentation
interface and a detector that will detect the radiation that is transmitted or reflect by the sample (Reich,
2005). The beam source may consist on an inert solid thermally heated or in an incandescent filament
like tungsten or quartz/halogen lamps, for NIR region, and carbon-silicon bars, for MIR radiation
(Christian, 1994).
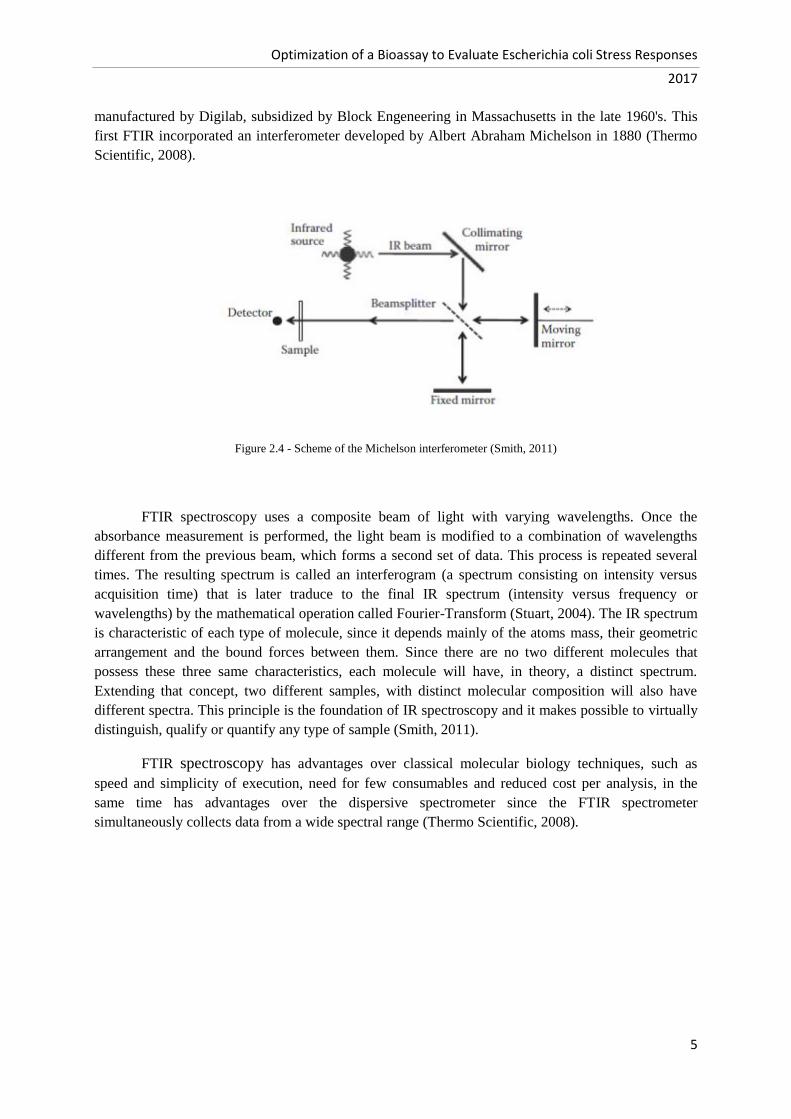
The interferometer consists of a beam splitter, a fixed mirror, and a mirror that translates back
and forth, very precisely. The beam splitter is made of a special material that transmits half of the
radiation striking it and reflects the other half. Radiation from the source strikes the beam splitter and
separates into two beams. One beam is transmitted through the beam splitter to the fixed mirror and
the second is reflected by the beam splitter to the moving mirror. The fixed and moving mirrors reflect
the radiation back to the beam splitter (figure 2.4). Again, half of the reflected radiation is transmitted
and half is reflected at the beam splitter, resulting in one beam passing to the detector and the second
back to the source (Martin, 2002). The Michelson interferometer is still used today in most Fourier
Transformed Infra-Red (FTIR) spectrometers. The first FTIR equipment to be marketed was
Optimization of a Bioassay to Evaluate Escherichia coli Stress Responses
2017
5
manufactured by Digilab, subsidized by Block Engeneering in Massachusetts in the late 1960's. This
first FTIR incorporated an interferometer developed by Albert Abraham Michelson in 1880 (Thermo
Scientific, 2008).
Figure 2.4 - Scheme of the Michelson interferometer (Smith, 2011)
FTIR spectroscopy uses a composite beam of light with varying wavelengths. Once the
absorbance measurement is performed, the light beam is modified to a combination of wavelengths
different from the previous beam, which forms a second set of data. This process is repeated several
times. The resulting spectrum is called an interferogram (a spectrum consisting on intensity versus
acquisition time) that is later traduce to the final IR spectrum (intensity versus frequency or
wavelengths) by the mathematical operation called Fourier-Transform (Stuart, 2004). The IR spectrum
is characteristic of each type of molecule, since it depends mainly of the atoms mass, their geometric
arrangement and the bound forces between them. Since there are no two different molecules that
possess these three same characteristics, each molecule will have, in theory, a distinct spectrum.
Extending that concept, two different samples, with distinct molecular composition will also have
different spectra. This principle is the foundation of IR spectroscopy and it makes possible to virtually
distinguish, qualify or quantify any type of sample (Smith, 2011).
FTIR spectroscopy has advantages over classical molecular biology techniques, such as
speed and simplicity of execution, need for few consumables and reduced cost per analysis, in the
same time has advantages over the dispersive spectrometer since the FTIR spectrometer
simultaneously collects data from a wide spectral range (Thermo Scientific, 2008).

Optimization of a Bioassay to Evaluate Escherichia coli Stress Responses
2017
6
2.1.2 Acquisition Modes
Depending on the sample properties, FTIR spectra can be acquired mainly in three different
experimental configurations: transmission, reflection-absorption (transflection) or attenuated total
reflection (ATR). The first one operates by transmitting IR radiation through sample-substrate,
whereas in transflection the radiation interacts with sample and is most reflected back but a part is also
absorbed by the substrate. Finally, on the ATR mode, the sample is placed on a crystal with a higher
refractive index than the sample, inducing total internal reflection of incident radiation, which is
attenuated and penetrates into the sample as an evanescent wave (Lima, 2015).
In transflection, the low-emissivity slides, commonly used as reflector substrates, contribute to
the formation of a standing wave perpendicular to sample surface that leads to spectral changes not
related with the sample biochemical properties (Greenler, 1966). In transmission mode, spectra
collected are submitted to a variety of physical effects occurring at the same time with absorption, and
requires corrections for phenomena, such as light scattering, refraction, dispersion and other optical
effects specifically related to measuring thin films, which may also induce spectral distortions (Chan,
2013). The ATR sampling mode presents usually a high SNR (signal-to-noise ratio) compared to those
obtained by transfection and transmission configurations (Lima, 2015), however for diluted samples
the SRN signal can also be low. In this work the transmission mode was used because it is the most
suitable for the type of samples used (liquid/aqueous samples), also due to its capacity to be measured
in high-throughput mode.
2.1.3 Applications to Microbiology
Stair and Coblentz in 1935 were perhaps the first to record the spectra of biological materials
such as onion skins, the membrane of fish bladder, bat's wings, egg albumin, egg membranes (Norris,
1959) and Randall et al. (1951) were the first to record the spectra of whole cells of bacteria. In 1959
was published an article stating that bacteria have a characteristic infrared spectrum, unique to each
strain. However, at that time it was considered a very time consuming process. Naumann and his
collaborators highly contributed for the descriptions of the FTIR spectroscopy applications to
microbiology as presented today. Through their studies they were able to elaborate a table where the
various functional groups that can be present in the microbial cells are described. The regions of MIR
spectrum corresponding to each group of biomolecules are nowadays well characterized, namely
regions associated with proteins, lipids, amino acids and even lactate, urea or glucose absorption
(Bellisola, 2012) (figure 2.5). Generally, the study of a particular strain characteristic uses one or more
spectral zones and not just a single functional group. An adaptation of the table described by Naumann
can be seen in the table 2.1.

Optimization of a Bioassay to Evaluate Escherichia coli Stress Responses
2017
7
Table 2.1 - Spectra bands and its associated absorbing chemical groups and corresponding biomolecules (Adapted from:
Naumann, 2001)
Wave number Designation
~3500 O-H stretching movements of hydroxyl groups
~3200 N-H stretches of proteins
~2955 Asymmetric C-H stretching movements of -CH3 in fatty acids
~2930 Asymmetric C-H distances of > CH2
~2918 Asymmetric C-H stretching movements of > CH2 in fatty acids
~2898 C-H stretching movements in methyl groups
~2870 Symmetrical C-H distending movements of -CH3
~2850 Symmetrical C-H distances of > CH2 in fatty acids
~1740 Stretching movements > C=O of the esters
~1715 Stretching movements > C=O of carbonic acids
~1680 Stretching movements > C=O of nucleic acids
~1695 Components of the amide I band
~1685 Resulting from beta-antiparallel sheets
~1675 Beta configuration of proteins
~1655 Alpha helical structures of amide I
~1637 Structures of the beta sheets of amide I
~1550 – 1520 Amide II
~1515 Tyrosine band
~1468 C-H deformation of > CH2
~1400 Symmetric distending movements C=O of COO-
~1310 - 1240 Protein amide III band
~1250 – 1220 Asymmetric distending movements P=O of > PO-2 of phosphodiesters
~1200 – 900 C-O and C-C distension movements and C-O-C deformation of
carbohydrates
~1090 – 1085 Symmetrical distending movements P=O of > PO2-
~720 Rotation of the C-H bond of > CH2
~900 - 600 Fingerprint region of the microorganism

Optimization of a Bioassay to Evaluate Escherichia coli Stress Responses
2017
8
Since then, spectroscopic methods have been applied for diverse biological applications, such
as monitoring microbial and mammalian cell cultures. This allows to estimate, from a single spectrum,
several variables such as cell growth, nutrients consumption (e.g., glucose and glycerol), metabolic by-
products (e.g., ethanol and acetate) production and consumption and plasmids and recombinant
proteins production (Arnold, et al., 2003; Sellick, et al., 2010). The high sensitivity of MIR
spectroscopy also enabled bacteria typing and subtyping (Amiali, et al., 2007; Davis , et al., 2012), the
detection of cell cycle events and mechanism discrimination of cell death between apoptosis and
necrosis (Jamin, et al., 2003; Hammiche, et al., 2005), monitoring of stem cells differentiation (Aksoy
and Severcan, 2012), cancer-related research and diagnosis (Bogomolny, et al., 2007), other diseases
diagnosis (e.g., renal failure (Khanmohammadi, et al., 2013), and metabolic fingerprinting of amniotic
fluid for early prenatal disorders (Graça, et al., 2013). In most of the works described, whole
microorganism cells were analysed and presented very complex spectra since the resulting spectrum
depends on the total chemical composition of cells (intracellular material, membrane and wall). Due to
the complexity of the resulting spectrum, an evaluation of the spectra through multivariate analysis is
indispensable (Chemometrics) (Lavine, 1998).
2.1.4 Chemometrics and Spectral pre-processing techniques
Chemometrics is the use of mathematical and statistical methods to improve the understanding
of chemical information and to correlate quality parameters or physical properties to analytical
instrument data (Roggo et al., 2007). Chemometrics was first introduced in the chemical field, being
nowadays a widely used tool in several other areas such as spectroscopy (Geladi, 2003). The science
of chemometrics gives spectroscopists many efficient ways to solve the calibration problem for
analysis of spectral data. Chemometrics can be used to enhance methods development and make
routine use of statistical models for data analysis (Bu, 2007). The application of pre-processing
techniques is a very important step in the analysis of spectral data, since it enables the elimination of
physical phenomena due to undesired variations, such as noise, differences along the sample thickness,
and differences in the number cells across the sample and scattering events. This procedure has the
goal of minimizing the irrelevant information present in the final spectra (Bu, 2007). In the present
work some pre-processing techniques are reviewed, namely those used along the work: baseline
correction, normalization, multiplicative scatter correction and spectral derivatives.
Figure 2.3 - MIR absorption spectrum with bands associated to molecular bounds
of biomolecules highlighted (Graça et al., 2013)
Optimization of a Bioassay to Evaluate Escherichia coli Stress Responses
2017
9
Not always the obtained spectra are grounded at zero. The type of algorithm used depends on
the baseline correction needed. Those spectra which are dislocated from zero by a constant value are
the simpler cases, since subtracting the value in question from the spectrum is usually enough. Though
there are more difficult cases, for instance cases in which the baseline presents a slope, or even spectra
with curvatures. In these cases an algorithm generating a function, a linear or polynomial function, can
bring the spectrum to zero (Otto, 1999; Smith, 2011). There are probably two main disadvantages of
using baseline correction algorithms. First, it is difficult to find a function that adjusts properly to the
spectrum curvature, although there are already some good algorithms. Besides, the curvature along the
spectrum is not always equal, so a unique function will hardly adjust correctly to the entire spectrum.
Therefore, sometimes it is preferred to apply derivatives for offset correction. The problem of applied
derivatives is that the resulting spectra will be noisier than the raw one (Smith, 2011).
The goal of normalization is pre-processing the data in order to minimize differences between
the samples that are related with factors, such as differences in cell concentration. A careful design of
the experience is still a critical factor that must be always taken into account before pre-processing the
data. There are several methods for normalizing spectral data (Randolph, 2006). In the present work,
all spectra were normalized using the Amide I band, at 1650 𝑐𝑚−1. Basically, all spectra were divided
by a previously determined constant, so all the spectra ended up having the same intensity at 1650 −1
.
The multiplicative scatter correction (MSC) has been proposed as method in NIR spectroscopy
to correct signals for noise. Light scattering or change in path length for each sample is estimated
relative to that of an ideal sample. For this method a reference spectrum is necessary, which is usually
the mean spectrum of all available spectra. MSC works by fitting each spectrum to the average
spectrum, which is thought to be the ideal, performing a transformation where the spectral data (𝑥1,
𝑥2, …, 𝑥𝑝) is converted into new values (𝑧1, 𝑧2, …, 𝑧𝑝), where 𝑝 corresponds to wavelengths (Fearn
et al., 2009). The following equation describes the transformation from 𝑥 to 𝑧
𝑧𝑖 = 𝑥𝑖−𝑎
𝑏 , (Equation 2.1)
where 𝑎 represents the intercept and 𝑏 the slope of a least-squares regression of 𝑥1, 𝑥2, …, 𝑥𝑝
on the values 𝑟1, 𝑟2, …, 𝑟𝑝 coming from the reference spectra.
Spectral derivatives are normally employed to remove baseline offsets and for highlighting
spectral information, through the resolution of overlapping bands (figure 2.6). Applying the first
derivate is extremely useful in cases where the offset is constant, since de first derivate of a constant is
zero. The second derivative can also be applied and the result will be not only the removal of the
baseline offset but also the resolution of overlapping bands (Otto, 1999). First and second derivatives
can also be useful to highlight subtle differences between spectra, allowing to extract more
information from spectral data. However, before applying derivatives, it is important to have in mind
that the derivative spectra will have more noise than the initial one, so first and second derivatives
must be applied in spectral data with high SNR, or using filters as polynomial fitting do decrease noise
before application of derivatives (Lourenço et al., 2012; Scholz et al., 2012).

Optimization of a Bioassay to Evaluate Escherichia coli Stress Responses
2017
10
Principal component analysis (PCA) is a probably the most used processing technique to
emphasize variation on data and bring out strong patterns in a dataset. It is often used to make data
easy to explore and visualize when we are dealing with high dimensional data as spectral data (Jollife,
2002). It is a mathematical procedure that uses an orthogonal transformation to convert a set of
observations of possibly correlated variables into a set of values of linearly uncorrelated variables
called principal components. The number of major components is less than or equal to the number of
original variables. PCs are ordered in terms of variance in the data set explained, with the first PCs
representing the major variance in the data (Jollife, 2002).
The initial data matrix is decomposed as following:
𝑋 = 𝑇𝑃𝑇 + 𝐸, (Equation 2.2)
where 𝑛 is the number of samples in 𝑋, 𝑝 is the number of variables in 𝑋, 𝑔 is the number of
chosen factors, 𝑋 (𝑛 × 𝑝) is the descriptor data matrix, 𝑇 (𝑛 × 𝑔) is the score matrix, 𝑃 (𝑝 × 𝑔)
represents the loading matrix and 𝐸 (𝑛 × 𝑝) is the error matrix for the 𝑋-data matrix. Thus, a PC is
described as a combination of loadings and scores, where loadings represent the contribution of each
wavenumber to the PC and scores results from linear combinations of the initial data in X. Therefore
each spectrum can be described as a combination of principle components (Naes et al., 2002).
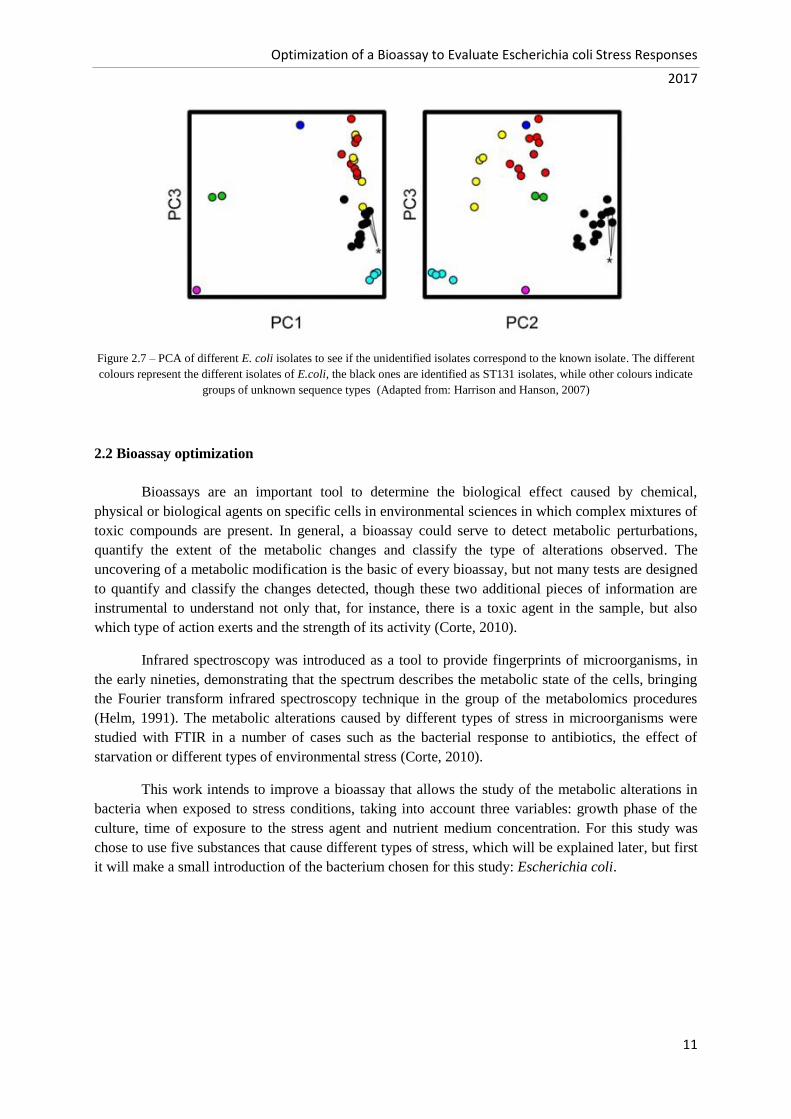
Since the variance fraction can be covered by one, two or three PCs, it is possible to visualize
almost the entire data by plotting these PCs against each other. In theory the samples with closer
scores will be more similar to each other (figure 2.7) (Otto, 1999).
Figure 2.6 - Spectral derivatives (Adapted from: ASDinc, 2017)
Optimization of a Bioassay to Evaluate Escherichia coli Stress Responses
2017
11
Figure 2.7 – PCA of different E. coli isolates to see if the unidentified isolates correspond to the known isolate. The different
colours represent the different isolates of E.coli, the black ones are identified as ST131 isolates, while other colours indicate
groups of unknown sequence types (Adapted from: Harrison and Hanson, 2007)
2.2 Bioassay optimization
Bioassays are an important tool to determine the biological effect caused by chemical,
physical or biological agents on specific cells in environmental sciences in which complex mixtures of
toxic compounds are present. In general, a bioassay could serve to detect metabolic perturbations,
quantify the extent of the metabolic changes and classify the type of alterations observed. The
uncovering of a metabolic modification is the basic of every bioassay, but not many tests are designed
to quantify and classify the changes detected, though these two additional pieces of information are
instrumental to understand not only that, for instance, there is a toxic agent in the sample, but also
which type of action exerts and the strength of its activity (Corte, 2010).
Infrared spectroscopy was introduced as a tool to provide fingerprints of microorganisms, in
the early nineties, demonstrating that the spectrum describes the metabolic state of the cells, bringing
the Fourier transform infrared spectroscopy technique in the group of the metabolomics procedures
(Helm, 1991). The metabolic alterations caused by different types of stress in microorganisms were
studied with FTIR in a number of cases such as the bacterial response to antibiotics, the effect of
starvation or different types of environmental stress (Corte, 2010).
This work intends to improve a bioassay that allows the study of the metabolic alterations in
bacteria when exposed to stress conditions, taking into account three variables: growth phase of the
culture, time of exposure to the stress agent and nutrient medium concentration. For this study was
chose to use five substances that cause different types of stress, which will be explained later, but first
it will make a small introduction of the bacterium chosen for this study: Escherichia coli.

Optimization of a Bioassay to Evaluate Escherichia coli Stress Responses
2017
12
2.2.1 Escherichia coli bacteria and stress responses
Escherichia coli is a widespread bacteria that can survive and adapt to growth under a wide
range of conditions (Moen et al., 2009). E. coli is in the family Enterobacteriaceae. The bacteria is
gram negative, rod shaped, non-spore forming and motile with peritrichous flagella or nonmotile.
They can grow under aerobic and anaerobic conditions and have an optimum temperature of growth
between 35 and 40°C (CDC, 2015). Together with Staphylococcus aureus it is the most common and
one of the oldest symbiotic bacteria in mankind. It was discovered by the German-Austrian Theodor
Escherich, in 1885 (Kyriakides, 1998). E. coli bacteria usually live in the intestines of people and
animals. Most of the strains are harmless and actually are an important part of a healthy human
intestinal tract. However, some E. coli are pathogenic being associated with intestinal and extra
intestinal infections in humans and many animals (CDC, 2015). It is the most thoroughly studied
bacterium, and is often a preferred model organism, as it uses mainstream metabolic pathways that are
similar to the corresponding metabolic functions in other bacteria (Liang et al., 2002).
Escherichia coli encounter numerous different stresses during their growth, survival, and
infection. Many bacterial species exhibit a general stress response that can be induced by different
stress conditions and, phenotypically, renders the cells broadly stress resistant (Chung et al., 2006). A
basic knowledge of how different adverse conditions affect E. coli is important when exploring the
response potential, understanding how bacteria adapt and minimize the risk of illness (Chung et al.,
2006).
Microorganisms have developed signal transduction systems to sense environmental stresses
and to control the coordinated expression of genes involved in cellular defence mechanisms. These
evolved protective or adaptive networks assist microorganisms to modify their environments and/or to
survive the stress condition. A common regulatory mechanism involves sigma factors. Sigma factors
are small proteins that bind to RNA polymerase (RNAP). The presence of the sigma factor allows the
RNAP enzyme to bind at specific promoter sequences on the chromosome, and initiate transcription of
particular genes, depending on the sigma factor. This way, genetic expression is controlled at the
transcription level. In E. coli, the housekeeping σ factor, σ70
, is responsible for transcription from
many of the gene promoters under normal nonstress conditions (Chung et al., 2006; Hengge-Aronis,
2002).
Table 2.2 - Sigma factors of E. coli (Adapted from: Chung et al., 2006)
Sigma factor Gene Function
σ70
rpoD Housekeeping functions
σ54
(σN) glnF, nrtA, rpoN Nitrogen-regulated genes
σ32
htpT, rpoH Heat-shock genes
σ24
(σE) rpoE Heat-shock genes
σ28
flbB+flaI, rpoF Flagella synthesis/chemotaxis
σ38
(σS) rpoS, katF Starvation/general stress response
Optimization of a Bioassay to Evaluate Escherichia coli Stress Responses
2017
13
Under stress conditions, alternative σ factors to σ70 with different promoter specificities are
induced, resulting in the expression of specialized regulons, in response to a variety of stresses. In this
manner, gene expression is modified by different sigma factors. In E. coli and other enteric bacteria,
σS (RpoS) is the master regulator of the general stress response. The sigma factors of E. coli are listed
in Table 2.2 (Hengge-Aronis, 2002).
Five well known stressing chemicals, at different concentrations, were used to the bioassay
optimization: ethanol (EtOH), sodium hypochlorite (commercially known as bleach), sodium chloride
(NaCl), hydrochloric acid (HCl) and sodium hydroxide (NaOH). These chemicals are characterized by
different cytotoxic mechanisms as briefly outlined below.
Ethanol damages cell wall and membrane integrity, causing increased stress, particularly
reactive oxygen species (ROS), which damages DNA and reduces the O2 level. Decreased cross-
membrane proton gradient from membrane damage, coupled with hypoxia, leads to reduced ATP
production by aerobic respiration, driving cells to rely more on fatty acid oxidation, anaerobic
respiration and fermentation for ATP production. The reduced ATP generation results in substantially
decreased synthesis of macromolecules (Cao, et al., 2017). Ethanol can directly bind to 213 proteins
including transcription factors, altering their function. All these changes together induce multiple
stress responses, reduced biosynthesis, cell viability and growth. The main target of ethanol activity
appears to be the cell membrane (Canetta, 2006). Ethanol-adapted E. coli cells restore the majority of
these reduced activities through selection of specific genomic mutations and alteration of stress
responses, ultimately restoring normal ATP production, macromolecule biosynthesis, and growth
(Cao, et al., 2017).
Bleach, mainly constituent by sodium hypochlorite, oxidizes the microorganisms and attacks
essential cell components including lipids, proteins and DNA (Ho-Hyuk et al., 2008).
The antimicrobial activity of sodium induces loss of the membrane integrity and cell
disruption at high concentrations, enzymatic inhibition and problems in the lipids and phospholipids
metabolism. The aminoacids undergo a chloramination reaction forming chloramines (Estrela, 2003).
Salt causes slow and poor growth and induces glycerol accumulation. The effect to which salt
concentration causes changes in bacterial growth depends on the osmotic balance required for such
growth. Some bacteria require a high salt concentration to initiate growth, whereas other bacteria
would not survive under these conditions. Although E. coli may have optimal growth in the absence of
salt, it is still growing in its presence but in a slower rate (Corte, 2010).
E. coli is a neutrophile bacterium, which means that the optimum pH of growth is close to pH
7. Stress induced by acids and bases, such as HCl and NaOH, causes changes in intracellular pH,
which impairs cell viability (Salmond et al., 1984). The antimicrobial activity of organic acids, such as
acetic acid, is thought to be due to the ability of the undissociated acid to freely cross the cell
membrane and release protons inside the cell. The lowering of pH is opposed in the cell by removal of
excess protons at the expense of ATP, which depletes ATP reserves, resulting in death (Hosein, et al.,
2011). An alternative explanation for the toxicity of organic acids is that acid anions become trapped
in the cell cytoplasm and accumulate inside the cell, raising ionic strength and potentially disrupting
metabolism. Decreasing intracellular pH results in a low transmembrane pH gradient and may reduce
anion levels inside the cell. This may result in reduced metabolic activity, because enzymes in the
cytoplasm may not function well below neutral pH (Hosein, et al., 2011).
Optimization of a Bioassay to Evaluate Escherichia coli Stress Responses
2017
14
Exposure of gram-negative bacteria to high pH destroys cell membranes and causes leakage of
the internal cell content. Cell membranes may be disrupted by saponification of lipids or solubilisation
of proteins. Gram negative cells are also susceptible to alkaline pH, in part because the thin
peptidoglycan layer loses structural integrity and ruptures (Sharma and Beuchat, 2004).
2.2.2 Application of the bioassay
The bioassay that is intended to be optimized in this work may be applied to different types of
studies such as monitoring the effect of various substances on the metabolism of microorganisms,
development of new drugs, evaluate the efficiency of treatments. In this case it was chosen to evaluate
the mechanism of action of six antibiotics. From 1940, the use of antibiotics was generalized, which
revolutionized the treatment of infectious diseases, contributing significantly to the reduction of
mortality. However, its excessive and often inappropriate use has promoted the emergence and
proliferation of resistant bacteria (INSA, 2010). This fact makes extremely important the development
of new techniques that allow the in-depth study of the effect of each antibiotic on the metabolism of
bacteria.
The selected antibiotics were: ampicillin, amoxicillin, neomycin, ciprofloxacin, metronidazole
and erythromycin. These antibiotics were chosen for having different mechanisms of action.
Ampicillin and amoxicillin act by inhibiting cell wall synthesis. On the other hand, neomycin and
erythromycin inhibits protein synthesis. Finally, ciprofloxacin and metronidazole act by interfering
with DNA synthesis.
Ampicillin is a semi-synthetic derivative of penicillin that functions as an orally active broad-
spectrum antibiotic. Is a penicillin beta-lactam antibiotic. Ampicillin has in vitro activity against gram-
positive and gram-negative aerobic and anaerobic bacteria (Williamson, et al., 1980).
Amoxicillin is a broad spectrum semisynthetic antibiotic similar to ampicillin, except that its
resistance to gastric acid allows higher serum levels with oral administration. It is a moderate-
spectrum antibiotic active against a wide range of gram-positive, and a limited range of gram-negative
organisms. The incidence of β-lactamase-producing resistant organisms, including E. coli, appears to
be increasing. Amoxicillin is sometimes combined with clavulanic acid, a β-lactamase inhibitor, to
increase the spectrum of action against gram-negative organisms, and to overcome bacterial antibiotic
resistance mediated through β-lactamase production (Okamoto, et al., 2002)
The mechanism of action of ampicillin and amoxicillin consists in binding to specific
penicillin binding proteins (PBPs) located within the bacterial cell wall. It inhibits the third and last
stage of bacterial cell wall synthesis. Cell lysis is then mediated by bacterial cell wall autolytic
enzymes such as autolysins. These two antibiotics are indicated for the treatment of ear, nose and
throat, genitourinary tract and skin infections, and lower respiratory tract structure due to susceptible
(b-lactamase-negative) strains of Streptococcus spp. (only a and b-hemolytic strains), S. pneumoniae,
Staphylococcus spp., H. influenzae, E. coli, P. mirabilis or E. faecalis (Okamoto, et al., 2002).
Neomycin is an aminoglycoside antibiotic. Aminoglycosides work by binding to the bacterial
30S ribosomal subunit, causing misreading of t-RNA, leaving the bacterium unable to synthesize
proteins vital to its growth. Aminoglycosides are useful primarily in infections involving aerobic,
Optimization of a Bioassay to Evaluate Escherichia coli Stress Responses
2017
15
gram-negative bacteria, such as Pseudomonas, Acinetobacter, and Enterobacter. In addition, some
mycobacteria, including the bacteria that cause tuberculosis, are susceptible to aminoglycosides.
Infections caused by gram-positive bacteria can also be treated with aminoglycosides, but other types
of antibiotics are more potent and less damaging to the host. In the past the aminoglycosides have been
used in conjunction with penicillin-related antibiotics in streptococcal infections for their synergistic
effects, particularly in endocarditis. Aminoglycosides are mostly ineffective against anaerobic
bacteria, fungi and viruses (Gill and Amyes, 2004).
Erythromycin is a macrolide antibiotic produced by Saccharopolyspora erythraea. It inhibits
bacterial protein synthesis by binding to the bacterial 50S ribosomal subunits. Binding inhibits
peptidyl transferase activity and interferes with translocation of amino acids during translation and
assembly of proteins. Erythromycin may be bacteriostatic or bactericidal depending on the organism
and drug concentration. Is indicated for treatment of infections caused by susceptible strains of
microorganisms in the following diseases: respiratory tract infections (upper and lower), in the
treatment of infections due to Corynebacterium minutissimum, intestinal amebiasis caused by
Entamoeba histolytica, skin and soft tissue infections caused by Streptococcus pyogenes and
Staphylococcus aureus, primary syphilis caused by Treponema pallidum, infections caused by
Chlamydia trachomatis, nongonococcal urethritis caused by Ureaplasma urealyticum, and
Legionnaires disease caused by Legionella pneumophila (Douthwaite and Aagaard, 1993).
Ciprofloxacin is a broad-spectrum anti-infective agent of the fluoroquinolone class and it has
in vitro activity against a wide range of gram-negative and gram-positive microorganisms. There is no
known cross-resistance between ciprofloxacin and other classes of antimicrobials. The bactericidal
action of ciprofloxacin results from the inhibition of enzymes topoisomerase II (DNA gyrase) and
topoisomerase IV, which are required for bacterial DNA replication, transcription, repair, strand
supercoiling repair, and recombination (Leavis, et al., 2006). Ciprofloxacin is indicated for the
treatment of the following infections caused by susceptible organisms: urinary tract infections, acute
uncomplicated cystitis, chronic bacterial prostatitis, lower respiratory tract infections, acute sinusitis,
skin and skin structure infections, bone and joint infections, complicated intra-abdominal infections,
infectious diarrhea, typhoid fever, uncomplicated cervical and urethral gonorrhoea (Leavis, et al.,
2006).
Metronidazole, a synthetic antibacterial and antiprotozoal agent of the nitroimidazole class, is
used against protozoa such as Trichomonas vaginalis, amebiasis, and giardiasis. It is extremely
effective against anaerobic bacterial infections and is also used to treat Crohn's disease, antibiotic-
associated diarrhea, and rosacea. Metronidazole is a prodrug. Unionized metronidazole is selective for
anaerobic bacteria due to their ability to intracellularly reduce metronidazole to its active form. The
reduced metronidazole covalently binds to DNA, disrupt its helical structure, inhibiting bacterial
nucleic acid synthesis and resulting in bacterial cell death (Li, et al., 2007).

Optimization of a Bioassay to Evaluate Escherichia coli Stress Responses
2017
16
3. Materials and methods
3.1 Culture growth conditions and Bioassay
The bacteria Escherichia coli strain JM 101 (ATCC 33876) was chosen as a model organism
for its ease of manipulation, non-pathogenic nature (biosafety class 1) as well as lack of resistance
mechanisms in its genome: supE thi- 1 Δ(lac-proAB) [F´ traD36 proAB lacIqZΔM15].
The bioassay consisted of a reaction mixture of 1000 μL with 100 μL of E.coli, with an
OD600nm of 50, 400 μL of nutrient medium 2.5x and 500 μL of water and/or stress agent. The
nutrient medium used in the bioassay was prepared by the following mode: 3.75 mL of the stock
solution (10% of Yeast extract + 20% Bacto tryptone + 5x phosphate buffer 0.2 M) and the volume
was complete with buffer to a final volume of 15 mL. The bioassay with a nutrient medium
concentration consisted, therefore, in a final concentration of E. coli with an OD600nm of 5, YE of
1%, BT of 2% and phosphate buffer of 0.02 M. The bioassay incubation mixture was incubated for 1
hr at 37oC. In the bioassay, were tested for stress agents, three different concentrations of it: zero
concentration (corresponding to control experiment) and two different concentrations as presented in
table 3.1. Each assay was conducted in quintuplicate.
The E. coli cells used in the bioassay were prepared from the following procedure: 1 mL of E.
coli cells (-80oC aliquots) were grown for 8, 16 or 24 hrs (corresponding to mid-exponential, early
stationary and stationary growth phase, respectively) on a 250 mL erlenmeyer with 60 mL of working
volume (containing 6 mL of YE (10%) and BT (20%) plus 12 mL of phosphate buffer of 0.2 M and
the volume was complete with water), in an orbital incubator (TH30 and SM30, Edmund Buhler
GmbH) (at 37oC, 250 rpm).
After E. coli growth, and due to small variabilities in the growth curve, the absorbance of the
inoculum biomass was measured and re-suspend till an OD600nm of 50. For that, the culture medium
was centrifuged for 15 min at 4000 rpm (Rotanta 460R, Hettich Zentrifugen).
An overall procedure was established to optimize the following bioassay conditions: nutrient
media concentration, E. coli growth phase and incubation time, as resumed in table 3.2. In summary,
in the first assay E. coli cells grown till stationary growth phase (i.e. 24 hrs) were used, and the
bioassay mixture was incubated for 1 hr, and the following medium concentrations were evaluated:
1.25, 2.5 and 5x. On the second study, and to evaluate the effect of the E. coli growth phase, it was
used an incubation time of 1 hr, and incubation mixture containing 2.5x medium, and E. coli cells
growth till the mid-exponential, early-stationary and stationary growth phase were used. In the final
assay, it was evaluated the effect of incubating the mixture for 1, 8 and 24 hrs, using a medium at 2.5x
and E. coli cells grown till stationary growth phase.

Optimization of a Bioassay to Evaluate Escherichia coli Stress Responses
2017
17
Table 3.1 - Stock solutions of the stress agents and quantities in the assays
Table 3.2 - Summary of assays conditions
Parameter to be
optimised Tested conditions Fixed conditions
Nutrient medium
concentration
Nutrient medium concentration: 1.25x, 2.5x
or 5x
Inoculum grown for 24 hrs and
bioassay mixture maintained by 1
hr
E. coli growth
phase Inoculum growth phase: 8, 16 or 24 hrs
Nutrient medium concentration
2.5x and bioassay mixture
maintained by 1 hr
Incubation time Incubation time: 1, 8 or 24 hrs
Inoculum grown for 24 hrs and
nutrient medium concentration
2.5x
3.2. Preparation of solutions of stress agents
The following concentrations of stress agents were used: 20% ethanol, 263 ppm bleach, 16%
(ρ/V) NaCl, 4 M HCl and 1 M NaOH. The preparation of these stock solutions aimed to obtain certain
final concentrations or pH of each stress agent in the assays, as summarized in the table 3.1.
For the preparation of 20% ethanol solution, 20 mL of ethanol 96% plus 80 mL of water was
used for a final volume of 100 mL. In the case of the 263 ppm bleach preparation, a 525 ppm solution
(100 μL bleach plus 10 mL water) was first prepared and then 5 mL of the above solution was
withdrawn where 5 mL of water was added to obtain the concentration of bleach 263 ppm. The 16%
NaCl solution was prepared by joining 16 g of NaCl with water to a final volume of 100 mL.
The 4 M HCl and1 M NaOH solutions were prepared using the following equation:
𝑀 = 𝑚
(𝑀𝑀 ×𝑉) , (equation 3.1)
where M represents molarity, m is the mass, V is the volume and MM is the molar mass.
Stress agent Stock
Solution
Concentration in
biological assay
Stock Solution
Volume (μL)
Water volume
(μL)
C0 C1 C2 C0 C1 C2 C0 C1 C2
Ethanol 20% 0% 2% 10% 0 100 500 500 400 0
Bleach 263 ppm 0 ppm 10 ppm 80 ppm 0 38 305 500 462 195
NaCl 16% (p/V) 0% 4% 8% 0 250 500 500 250 0
HCl 4 M 0 M 0,2 M 2 M 0 50 500 500 450 0
NaOH 1 M 0 M 0,05 M 0,5 M 0 50 500 500 450 0
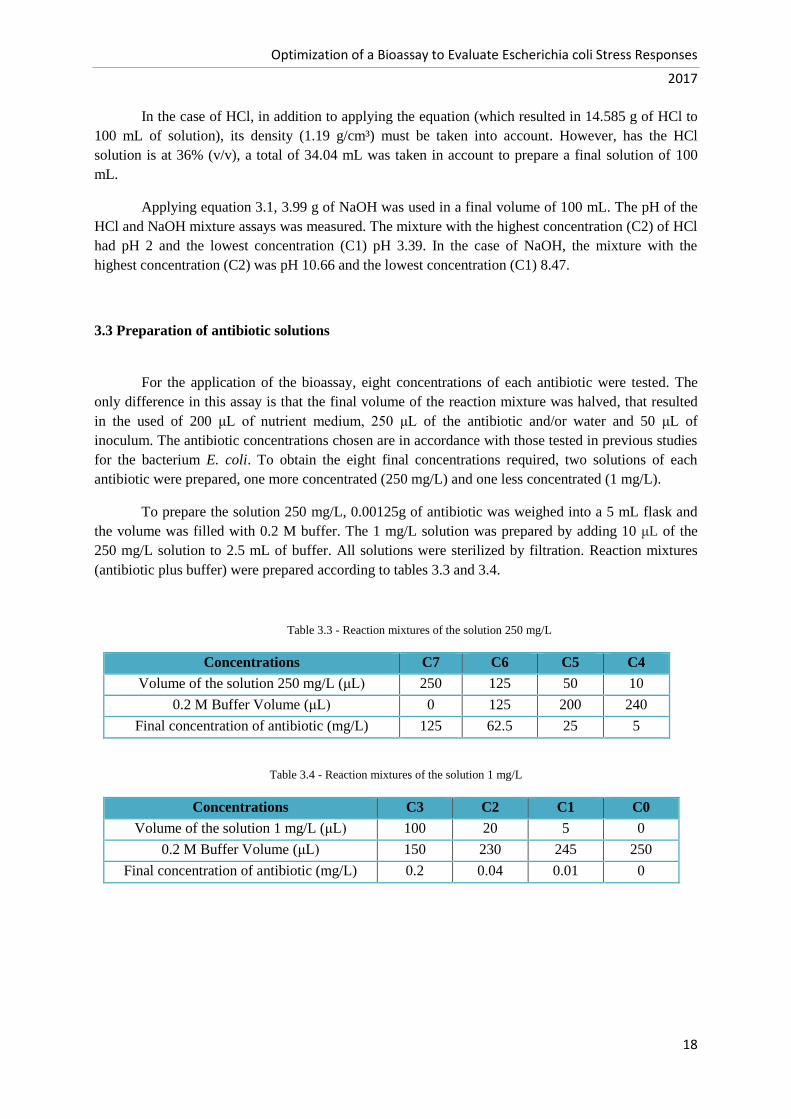
Optimization of a Bioassay to Evaluate Escherichia coli Stress Responses
2017
18
In the case of HCl, in addition to applying the equation (which resulted in 14.585 g of HCl to
100 mL of solution), its density (1.19 g/cm³) must be taken into account. However, has the HCl
solution is at 36% (v/v), a total of 34.04 mL was taken in account to prepare a final solution of 100
mL.
Applying equation 3.1, 3.99 g of NaOH was used in a final volume of 100 mL. The pH of the
HCl and NaOH mixture assays was measured. The mixture with the highest concentration (C2) of HCl
had pH 2 and the lowest concentration (C1) pH 3.39. In the case of NaOH, the mixture with the
highest concentration (C2) was pH 10.66 and the lowest concentration (C1) 8.47.
3.3 Preparation of antibiotic solutions
For the application of the bioassay, eight concentrations of each antibiotic were tested. The
only difference in this assay is that the final volume of the reaction mixture was halved, that resulted
in the used of 200 μL of nutrient medium, 250 μL of the antibiotic and/or water and 50 μL of
inoculum. The antibiotic concentrations chosen are in accordance with those tested in previous studies
for the bacterium E. coli. To obtain the eight final concentrations required, two solutions of each
antibiotic were prepared, one more concentrated (250 mg/L) and one less concentrated (1 mg/L).
To prepare the solution 250 mg/L, 0.00125g of antibiotic was weighed into a 5 mL flask and
the volume was filled with 0.2 M buffer. The 1 mg/L solution was prepared by adding 10 μL of the
250 mg/L solution to 2.5 mL of buffer. All solutions were sterilized by filtration. Reaction mixtures
(antibiotic plus buffer) were prepared according to tables 3.3 and 3.4.
Table 3.3 - Reaction mixtures of the solution 250 mg/L
Concentrations C7 C6 C5 C4
Volume of the solution 250 mg/L (μL) 250 125 50 10
0.2 M Buffer Volume (μL) 0 125 200 240
Final concentration of antibiotic (mg/L) 125 62.5 25 5
Table 3.4 - Reaction mixtures of the solution 1 mg/L
Concentrations C3 C2 C1 C0
Volume of the solution 1 mg/L (μL) 100 20 5 0
0.2 M Buffer Volume (μL) 150 230 245 250
Final concentration of antibiotic (mg/L) 0.2 0.04 0.01 0
Optimization of a Bioassay to Evaluate Escherichia coli Stress Responses
2017
19
3.4 FTIR spectra acquisition, preprocessing and analysis
At the end of all bioassays with E. coli, the 1 mL of incubation mixture was centrifuged for 3
min at 4000 rpm, then the supernatant was discarded and the remaining pellet was re-suspended in 200
μL of water to obtain an OD600nm of 5.
On a FTIR 96 wells plate, 20 μL of washed cells was placed in each well and 5 replicates were
performed. At the end, the ZnSe plates were dehydrated in a vacuum desiccator with silica gel inside,
for approximately two hrs. FTIR measurements were performed in transmission mode resourcing to a
HTS-XT module coupled to a Vertex-70 spectrometer (Bruker Optics®, Germany). All spectra were
recorded in the range between 4000 and 400 cm−1
. Spectral resolution was set at 4 cm−1
, sampling 64
scans per sample.
Using the spectrometer software OPUS® and OPUS LAB® spectra were exported to Data
point table (DPT) files and handled in Matlab R2012b (Matworks, Natick, MA, USA). Spectra
preprocessing combinations evaluated included offset correction, to reduce baseline and slope
distortions, Multiplicative scatter correction (MSC), to counteract scattering phenomena with additive
and multiplicative effects, and normalization at the Amide I band (1690-1620 cm-1
) to compensate
intensity variations by forcing spectra maximum to 1, highlighting patterns in the data. Additionally,
the Savitzky-Golay method was chosen to determine the first and second derivative of spectra, using a
15-point window and a 2nd degree.
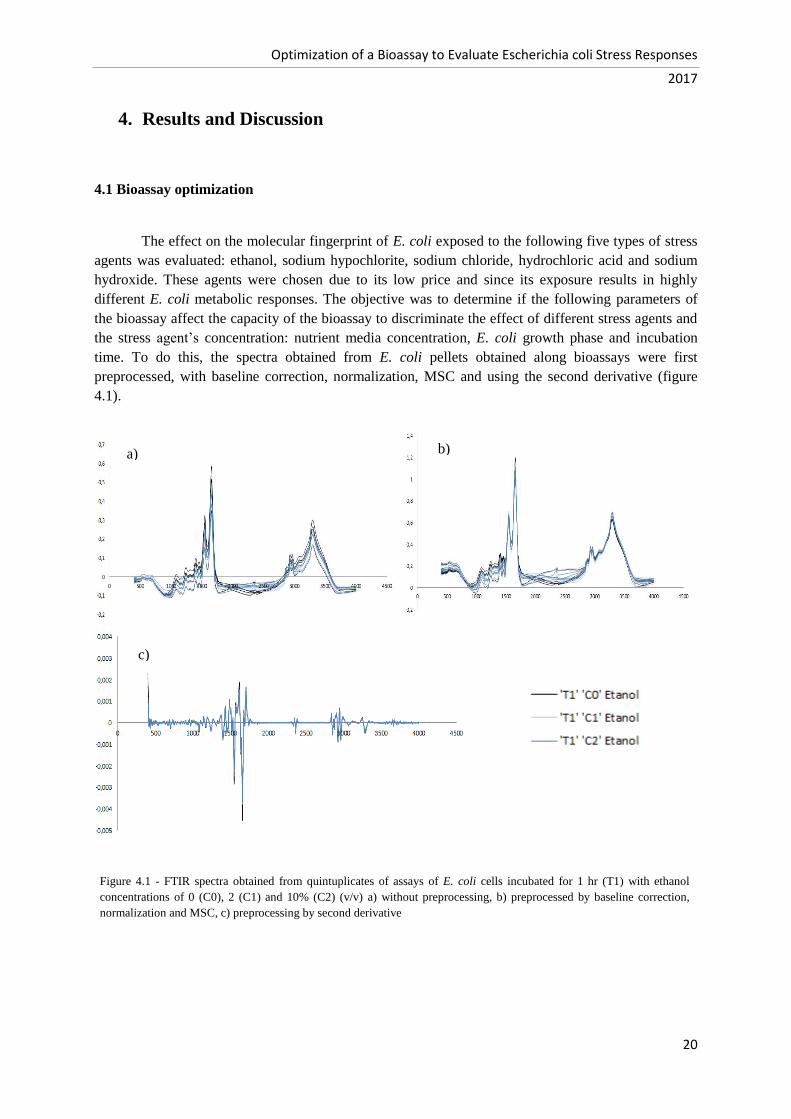
Optimization of a Bioassay to Evaluate Escherichia coli Stress Responses
2017
20
4. Results and Discussion
4.1 Bioassay optimization
The effect on the molecular fingerprint of E. coli exposed to the following five types of stress
agents was evaluated: ethanol, sodium hypochlorite, sodium chloride, hydrochloric acid and sodium
hydroxide. These agents were chosen due to its low price and since its exposure results in highly
different E. coli metabolic responses. The objective was to determine if the following parameters of
the bioassay affect the capacity of the bioassay to discriminate the effect of different stress agents and
the stress agent’s concentration: nutrient media concentration, E. coli growth phase and incubation
time. To do this, the spectra obtained from E. coli pellets obtained along bioassays were first
preprocessed, with baseline correction, normalization, MSC and using the second derivative (figure
4.1).
Figure 4.1 - FTIR spectra obtained from quintuplicates of assays of E. coli cells incubated for 1 hr (T1) with ethanol
concentrations of 0 (C0), 2 (C1) and 10% (C2) (v/v) a) without preprocessing, b) preprocessed by baseline correction,
normalization and MSC, c) preprocessing by second derivative
c)
a) b)

Optimization of a Bioassay to Evaluate Escherichia coli Stress Responses
2017
21
The PCA of spectra was also evaluated to better explore and visualize the high-dimensionality
spectral data. The bioassay condition that results in a score plot with replicas of the concentration of
stress agent grouped together and apart from other concentrations should be selected.
The different components of a FTIR spectrum can also be associated by univariate analysis to
individual components, e.g., to determine spectral biomarkers, as done, e.g., for identifying the
mechanism of cell death and stem cells differentiation (Jamin, et al., 2003), and even biochemical and
metabolic information, as conducted during diseases research and diagnosis (Bogomolny, et al., 2007;
Ahmed, et al., 2010). In the present study, the spectral ratios instead of a single peak were considered
to minimise the effect of different biomass concentrations. The wavelengths to study were chosen
according to the analysis of the second derivative peaks of the spectra while considering its
biomolecular significance. The following spectral ratios were evaluated: 2960/2920, 2960/2850,
1655/1550, 1080/1240, 1450/1470, 1550/1240, 1650/1240, 1170/1550, 1170/1650, 1655/1690 and
1655/1630. The differences in the bands’ ratios between groups of experiments were considered
statistically significant in a student’s t test when a p-value lower than 0.05 is achieved.
4.1.1 Effect of nutrient media concentration
The nutrient mediums at concentrations of 1.25x, 2x, and 5x on the incubation mixture were
evaluate.
In the case of the first agent tested (ethanol), it was observed in the PCA score plots (figure
4.2) that the lowest nutrient concentration (i.e. 1.25x) resulted in best separation of the control samples
(i.e. with zero concentration of ethanol) from the samples with ethanol.
The spectral ratios that presented more statistically significant p-values when comparing the
assay without ethanol and samples with ethanol were: A2960/2920 and A2960/2850 (table 4.1). These
wavelengths represent asymmetric C-H stretching movements of –CH3 and of –CH2 in fatty acids,
respectively, reflecting this way the cytoplasmic membrane status. Interestingly, when using a nutrient
concentration of 5x the spectral ratio A2960/2850 enable to discriminate the effect of all ethanol
concentrations. It was also observed significant statistically p-values with the spectral ratio
A1170/1550. The wavelength 1550 cm-1
represents the Amide II band that is due to C-N stretching
vibrations in combination with N-H bending and the wavelength 1170 cm-1
represents the C-O and C-
C distension movements and C-O-C deformation of carbohydrates.

Optimization of a Bioassay to Evaluate Escherichia coli Stress Responses
2017
22
a)
b)
Table 4.1 - p-values of the spectral ratios obtained from the quintuplicates of the assay with E. coli with different
concentrations of ethanol (C0 = 0; C1 = 2; C2 = 10% (V/V)) and incubated with different nutrient media concentration (M
1.25x, 2.5x and 5x). The statistically significant p-values (p<0.05) are highlighted in green
Spectral
ratio
Media
concentration
C0 versus
C1 C0 versus C2 C1 versus C2
C0 versus C1
and C2
A2960/2920
M2.5x 0.089 0.007 0.421 0.002
M5x 0.011 0.008 0.152 5.81E-04
M1.25x 0.109 1.31E-05 4.21E-04 0.233
A2960/2850
M2.5x 0.029 5.63E-04 0.081 2.8E-04
M5x 0.045 0.001 0.029 0.001
M1.25x 0.158 4.76E-04 4.76E-04 0.324
A1170/1550
M2.5x 0.012 0.855 0.035 0.239
M5x 0.831 0.021 0.029 0.253
M1.25x 0.038 0.526 0.016 0.055
Figure 4.2 - PCA score plot of FTIR spectra of E.coli submitted to different ethanol concentrations (C0 = 0; C1 = 2; C2
= 10% (V/V)) and incubated with different nutrient media concentration (M 1.25x, 2.5x and 5x). a) without
preprocessing b) preprocessed by base line correction and normalization Amide I. PC1, PC2 and PC3 represents 95%,
4% and 1% of data variance, respectively
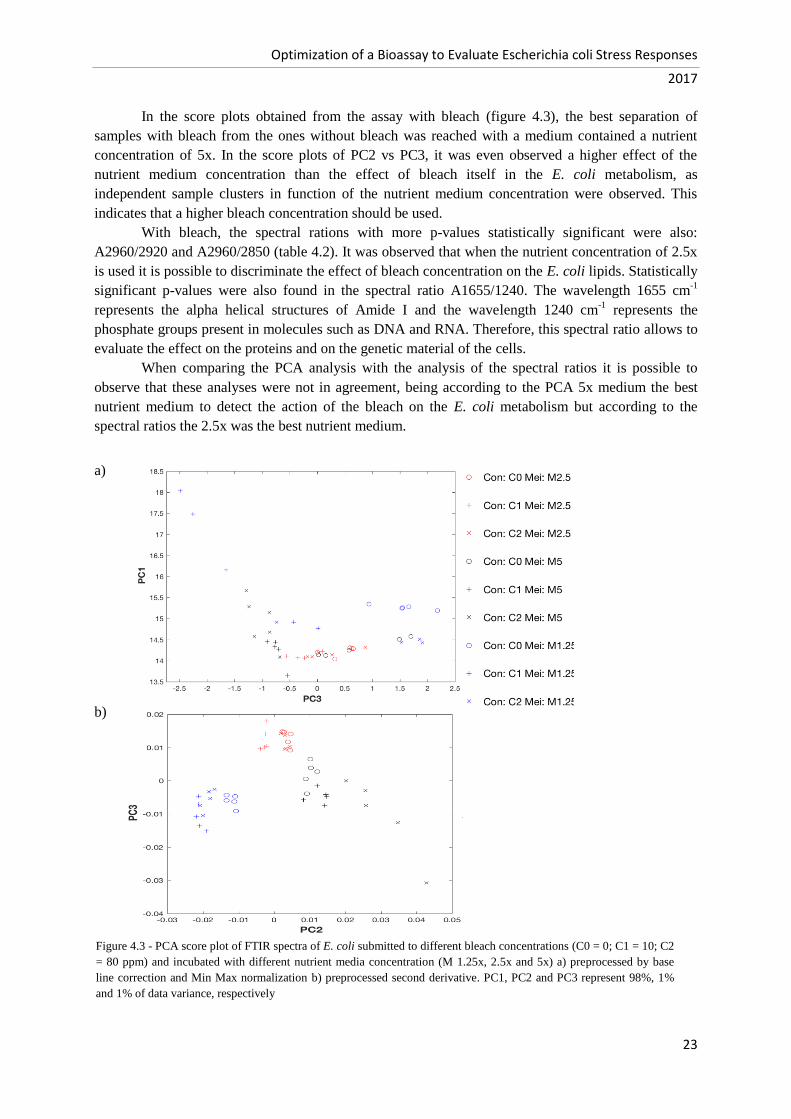
Optimization of a Bioassay to Evaluate Escherichia coli Stress Responses
2017
23
In the score plots obtained from the assay with bleach (figure 4.3), the best separation of
samples with bleach from the ones without bleach was reached with a medium contained a nutrient
concentration of 5x. In the score plots of PC2 vs PC3, it was even observed a higher effect of the
nutrient medium concentration than the effect of bleach itself in the E. coli metabolism, as
independent sample clusters in function of the nutrient medium concentration were observed. This
indicates that a higher bleach concentration should be used.
With bleach, the spectral rations with more p-values statistically significant were also:
A2960/2920 and A2960/2850 (table 4.2). It was observed that when the nutrient concentration of 2.5x
is used it is possible to discriminate the effect of bleach concentration on the E. coli lipids. Statistically
significant p-values were also found in the spectral ratio A1655/1240. The wavelength 1655 cm-1
represents the alpha helical structures of Amide I and the wavelength 1240 cm-1
represents the
phosphate groups present in molecules such as DNA and RNA. Therefore, this spectral ratio allows to
evaluate the effect on the proteins and on the genetic material of the cells.
When comparing the PCA analysis with the analysis of the spectral ratios it is possible to
observe that these analyses were not in agreement, being according to the PCA 5x medium the best
nutrient medium to detect the action of the bleach on the E. coli metabolism but according to the
spectral ratios the 2.5x was the best nutrient medium.
a)
b)
Figure 4.3 - PCA score plot of FTIR spectra of E. coli submitted to different bleach concentrations (C0 = 0; C1 = 10; C2
= 80 ppm) and incubated with different nutrient media concentration (M 1.25x, 2.5x and 5x) a) preprocessed by base
line correction and Min Max normalization b) preprocessed second derivative. PC1, PC2 and PC3 represent 98%, 1%
and 1% of data variance, respectively

Optimization of a Bioassay to Evaluate Escherichia coli Stress Responses
2017
24
Table 4.2 - p-values of the spectral ratios obtained from the quintuplicates of the assay with E. coli with different
concentrations of bleach (C0 = 0; C1 = 10; C2 = 80 ppm) and incubated with different nutrient media concentration (M
1.25x, 2.5x and 5x). The statistically significant p-values (p<0.05) are highlighted in green
Spectral
ratio
Media
concentration C0 versus C1 C0 versus C2 C1 versus C2
C0 versus C1
and C2
A2960/2920
M2.5x 0.012 0.011 0.018 0.003
M5x 0.179 0.247 0.057 0.893
M1.25x 8.63E-05 0.002 0.275 2.41E-05
A2960/2850
M2.5x 4.95E-04 0.001 0.035 3.58E-07
M5x 0.145 0.192 0.029 0.815
M1.25x 0.001 0.005 0.623 1.19E-04
A1655/1240
M2.5x 0.001 0.028 0.027 0.005
M5x 0.615 0.154 0.029 0.493
M1.25x 0.460 0.280 0.960 0.413
Unlike the PCA of the two previous agents, in the score plots of the assay with salt (figure 4.4)
it was possible to obtain all the controls (without salt) separated from the other sample (with salt),
independently of the nutrient concentration used, highlighting the strong effect of sault in the E. coli
metabolism in relation to the previous conditions evaluated. Interestingly, for a specific nutrient
concentration it was possible to discriminate the effect of the three sault concentrations on the cell
metabolism. This was observed for the three nutrient concentrations.
The more statistically significant p-values were found in the spectral ratios: A2960/2920,
A2960/2850 and A1550/1240 (table 4.3). The analyses of the PCA and the p-values of the spectral
ratios allows to conclude that the best medium to distinguish the controls from the samples that have
been exposed to the salt is the 1.25x medium, although it is possible to distinguish the effect of sault
independently of the content in nutrient concentration evaluated.

Optimization of a Bioassay to Evaluate Escherichia coli Stress Responses
2017
25
a)
b)
Figure 4.4 – PCA score plot of FTIR spectra of E. coli submitted to different sodium chloride concentrations (C0 = 0; C1
= 4; C2 = 8% (W/V)) and incubated with different nutrient media concentration (M 1.25x, 2.5x and 5x) a) preprocessed
by base line correction, Min Amide I normalization and MSC b) preprocessed by base line correction, MinMax
normalization and MSC. PC1, PC2 and PC3 represent 98%, 1% and 1% of data variance, respectively

Optimization of a Bioassay to Evaluate Escherichia coli Stress Responses
2017
26
Table 4.3 - p-values of the spectral ratios obtained from the quintuplicates of the assay with E. coli with different
concentrations of sodium chloride (C0 = 0; C1 = 4; C2 = 8% (W/V)) and incubated with different nutrient media
concentration (M 1.25x, 2.5x and 5x). The statistically significant p-values (p<0.05) are highlighted in green the statistically
significant p-values are highlighted in green
In the PCA score plots of the assay with hydrochloric acid (figure 4.5) the samples in acidic
medium were separated from those incubated in a neutral medium, independently of the nutrient
concentration of the medium. It was also observed that the samples exposed to different acidic media
were also in separated groups.
The p-values of the spectral ratios that enable to discriminate the HCl effect was according to
the results observed in the PCA, being in the medium 1.25x that lead to more statistically significant
results. The spectral ratios more statistically significant were: A1080/1240, A1550/1240 and
A1655/1240 (table 4.4). The wavelength 1080 cm-1
represents phosphates in the cell. Therefore, these
spectral ratios allow to observe the effect on cell proteins and at the global level of cell phosphates.
After this analyse, it was concluded that in the assays where the samples were exposed to
hydrochloric acid all mediums concentrations tested allowed to distinguish between the controls and
samples that were exposed to this agent, but only in the 1.25x medium was it possible to clearly
distinguish the acidic pH effect.
Spectral
ratio
Media
concentration C0 versus C1 C0 versus C2 C1 versus C2
C0 versus C1
and C2
A2960/2920
M2.5x 0.002 0.005 0.883 2.56E-05
M5x 0.423 0.042 0.066 0.081
M1.25 0.05 0.012 0.062 0.006
A2960/2850
M2.5x 0.016 0.006 0.681 5.68E-04
M5x 0.048 0.013 0.106 0.002
M1.25 0.079 6.27E-04 0.007 0.006
A1550/1240
M2.5x 0.027 0.092 0.024 0.638
M5x 5.55E-04 0.008 0.799 2.67E-06
M1.25 6.51E-04 8.57E-04 0.129 2.99E-06
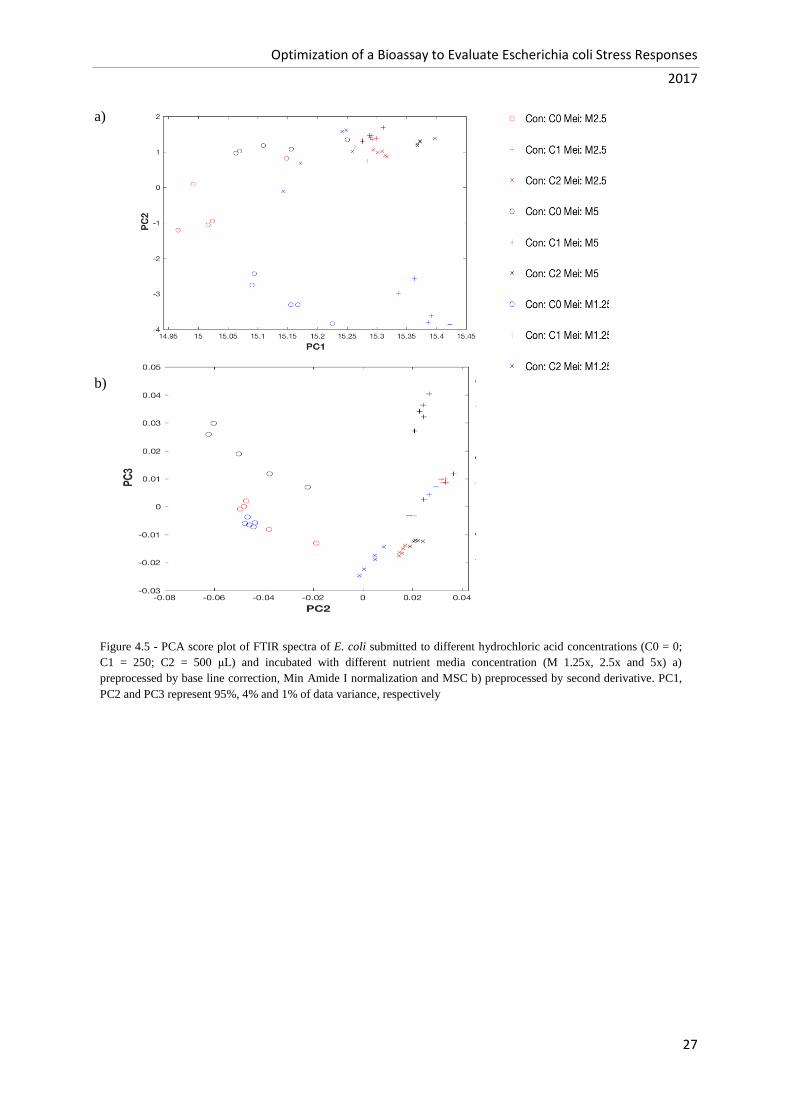
Optimization of a Bioassay to Evaluate Escherichia coli Stress Responses
2017
27
a)
b)
Figure 4.5 - PCA score plot of FTIR spectra of E. coli submitted to different hydrochloric acid concentrations (C0 = 0;
C1 = 250; C2 = 500 μL) and incubated with different nutrient media concentration (M 1.25x, 2.5x and 5x) a)
preprocessed by base line correction, Min Amide I normalization and MSC b) preprocessed by second derivative. PC1,
PC2 and PC3 represent 95%, 4% and 1% of data variance, respectively
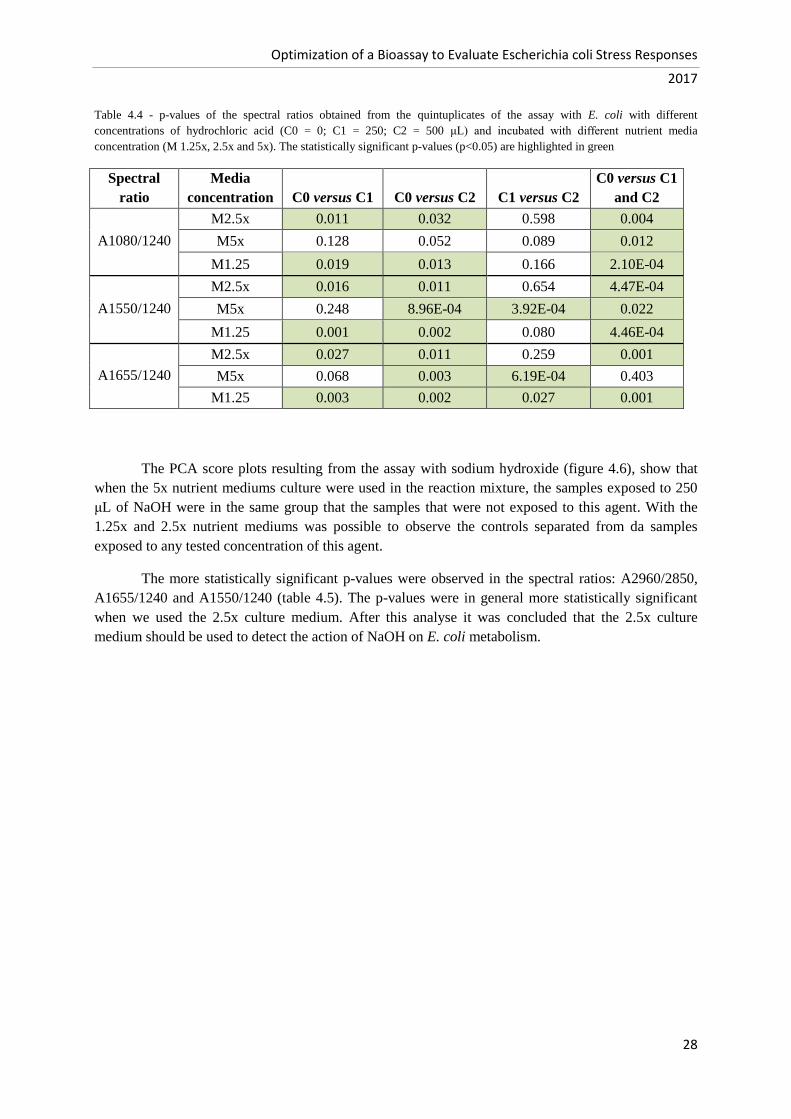
Optimization of a Bioassay to Evaluate Escherichia coli Stress Responses
2017
28
Table 4.4 - p-values of the spectral ratios obtained from the quintuplicates of the assay with E. coli with different
concentrations of hydrochloric acid (C0 = 0; C1 = 250; C2 = 500 μL) and incubated with different nutrient media
concentration (M 1.25x, 2.5x and 5x). The statistically significant p-values (p<0.05) are highlighted in green
Spectral
ratio
Media
concentration C0 versus C1 C0 versus C2 C1 versus C2
C0 versus C1
and C2
A1080/1240
M2.5x 0.011 0.032 0.598 0.004
M5x 0.128 0.052 0.089 0.012
M1.25 0.019 0.013 0.166 2.10E-04
A1550/1240
M2.5x 0.016 0.011 0.654 4.47E-04
M5x 0.248 8.96E-04 3.92E-04 0.022
M1.25 0.001 0.002 0.080 4.46E-04
A1655/1240
M2.5x 0.027 0.011 0.259 0.001
M5x 0.068 0.003 6.19E-04 0.403
M1.25 0.003 0.002 0.027 0.001
The PCA score plots resulting from the assay with sodium hydroxide (figure 4.6), show that
when the 5x nutrient mediums culture were used in the reaction mixture, the samples exposed to 250
μL of NaOH were in the same group that the samples that were not exposed to this agent. With the
1.25x and 2.5x nutrient mediums was possible to observe the controls separated from da samples
exposed to any tested concentration of this agent.
The more statistically significant p-values were observed in the spectral ratios: A2960/2850,
A1655/1240 and A1550/1240 (table 4.5). The p-values were in general more statistically significant
when we used the 2.5x culture medium. After this analyse it was concluded that the 2.5x culture
medium should be used to detect the action of NaOH on E. coli metabolism.
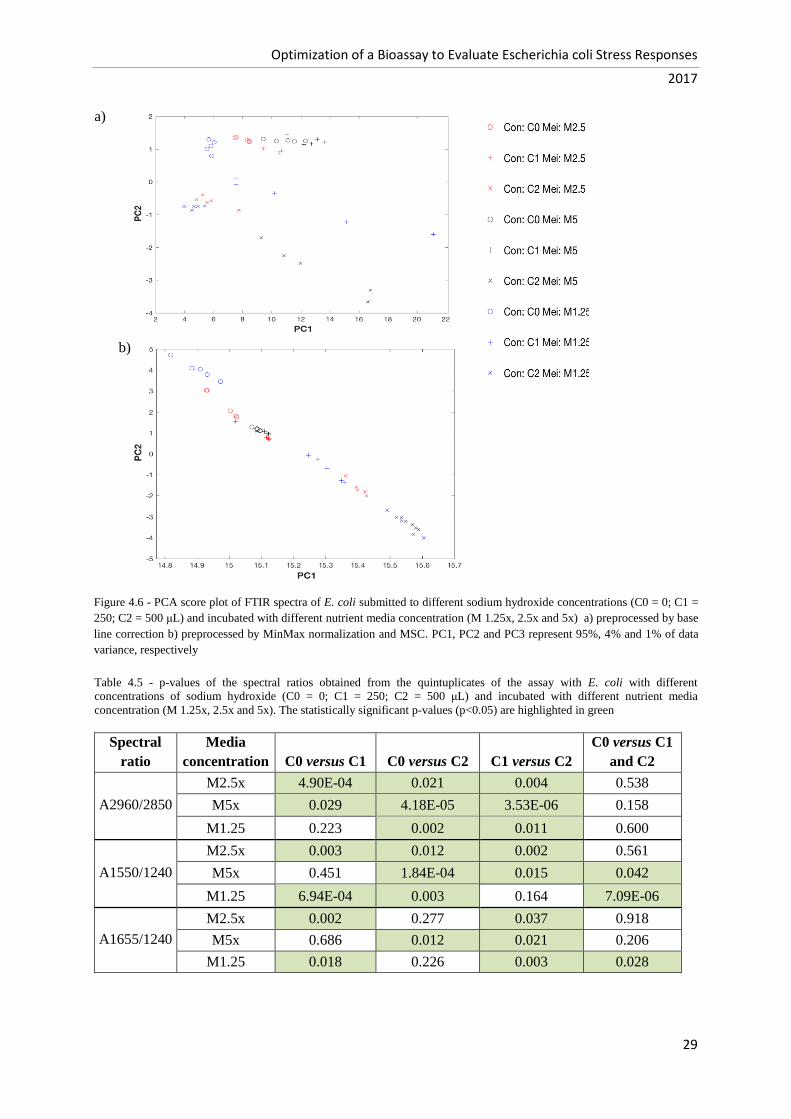
Optimization of a Bioassay to Evaluate Escherichia coli Stress Responses
2017
29
a)
Table 4.5 - p-values of the spectral ratios obtained from the quintuplicates of the assay with E. coli with different
concentrations of sodium hydroxide (C0 = 0; C1 = 250; C2 = 500 μL) and incubated with different nutrient media
concentration (M 1.25x, 2.5x and 5x). The statistically significant p-values (p<0.05) are highlighted in green
Spectral
ratio
Media
concentration C0 versus C1 C0 versus C2 C1 versus C2
C0 versus C1
and C2
A2960/2850
M2.5x 4.90E-04 0.021 0.004 0.538
M5x 0.029 4.18E-05 3.53E-06 0.158
M1.25 0.223 0.002 0.011 0.600
A1550/1240
M2.5x 0.003 0.012 0.002 0.561
M5x 0.451 1.84E-04 0.015 0.042
M1.25 6.94E-04 0.003 0.164 7.09E-06
A1655/1240
M2.5x 0.002 0.277 0.037 0.918
M5x 0.686 0.012 0.021 0.206
M1.25 0.018 0.226 0.003 0.028
Figure 4.6 - PCA score plot of FTIR spectra of E. coli submitted to different sodium hydroxide concentrations (C0 = 0; C1 =
250; C2 = 500 μL) and incubated with different nutrient media concentration (M 1.25x, 2.5x and 5x) a) preprocessed by base
line correction b) preprocessed by MinMax normalization and MSC. PC1, PC2 and PC3 represent 95%, 4% and 1% of data
variance, respectively
b)

Optimization of a Bioassay to Evaluate Escherichia coli Stress Responses
2017
30
Figure 4.7 - PCA score plot of FTIR spectra of E. coli submitted to different concentrations (C) of the stress agents
ethanol (A1), bleach (A2), sodium chloride (A3), hydrochloric acid (A4) and sodium hydroxide (A5) and different
nutrient media concentration (M 1.25x, 2.5x and 5x) a) medium 1.25x, with spectra preprocessed by second derivative, b)
medium 2.5x, with spectra preprocessed by base line correction, MinMax normalization and MSC c) medium 5x, with
spectra preprocessed by Min Amide I normalization and MSC. PC1, PC2 and PC3 represent 96%, 3% and 1% of data
variance, respectively
c)
After the analyses per agent, were evaluated the PCA with the stress agents all together (figure
4.7). It is worth to mention that figure 4.7 represents the optimum preprocessing and the combination
of PC1, PC2 and PC3 that resulted in the best separation among experiments that can be different from
the PCA score plots presented before. In the analysis of all agents together, the control experiments,
with zero concentration of stress agent, and conducted with the same nutrient medium concentration,
should give similar FTIR spectra. In the present analysis, it was observed that as the nutrient medium
concentration decreases, it becomes easier to discriminate the action of the stress agents separate the
action of each stress agent. A higher nutrient concentration resulted in an apparent protection of E. coli
from stress conditions. For example, at the highest nutrient concentration (i.e. of 5x) it was not
possible to discriminate the effect of bleach or alcohol from the controls. It was also observed that
from the conditions evaluated, the ones that most affected the E. coli metabolism were when using
acidic or basic conditions and high salt concentrations.
a) b)
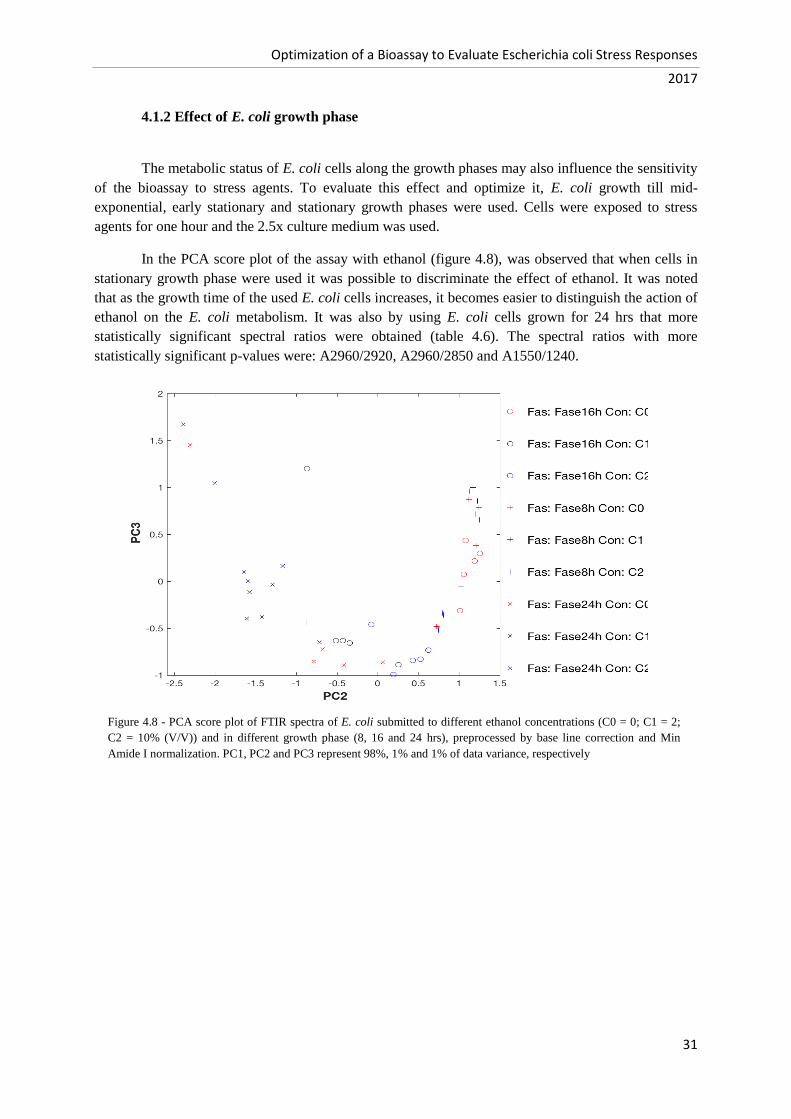
Optimization of a Bioassay to Evaluate Escherichia coli Stress Responses
2017
31
4.1.2 Effect of E. coli growth phase
The metabolic status of E. coli cells along the growth phases may also influence the sensitivity
of the bioassay to stress agents. To evaluate this effect and optimize it, E. coli growth till mid-
exponential, early stationary and stationary growth phases were used. Cells were exposed to stress
agents for one hour and the 2.5x culture medium was used.
In the PCA score plot of the assay with ethanol (figure 4.8), was observed that when cells in
stationary growth phase were used it was possible to discriminate the effect of ethanol. It was noted
that as the growth time of the used E. coli cells increases, it becomes easier to distinguish the action of
ethanol on the E. coli metabolism. It was also by using E. coli cells grown for 24 hrs that more
statistically significant spectral ratios were obtained (table 4.6). The spectral ratios with more
statistically significant p-values were: A2960/2920, A2960/2850 and A1550/1240.
Figure 4.8 - PCA score plot of FTIR spectra of E. coli submitted to different ethanol concentrations (C0 = 0; C1 = 2;
C2 = 10% (V/V)) and in different growth phase (8, 16 and 24 hrs), preprocessed by base line correction and Min
Amide I normalization. PC1, PC2 and PC3 represent 98%, 1% and 1% of data variance, respectively

Optimization of a Bioassay to Evaluate Escherichia coli Stress Responses
2017
32
Table 4.6 - p-values of the spectral ratios obtained from the quintuplicates of the assay with E. coli with different ethanol
concentrations (C0 = 0; C1 = 2; C2 = 10% (V/V)) and in different growth phase (8, 16 and 24 hrs). The statistically
significant p-values (p<0.05) are highlighted in green
The analysis of the PCA score plots of the E. coli cells in several stages of growth exposed to
the bleach does not allow to draw conclusions about which is the best growth phase to distinguish the
action of this stress agent because all the samples were packed together (figure 4.9). The analysis of
the spectral ratios points that a stationary growth phase leads to a best discrimination of bleach effect.
The spectral ratios more significant statistically were: A2960/2920, A2960/2850 and A1550/1240
(table 4.7).
Figure 4.9 - PCA score plot of FTIR spectra of E. coli submitted to different bleach concentrations (C0 = 0; C1 = 10; C2 = 80
ppm) and in different growth phase (8, 16 and 24 hrs), preprocessed by base line correction, MinMax normalization and
MSC. PC1, PC2 and PC3 represent 98%, 1% and 1% of data variance, respectively
Spectral
ratio
Growth
phase C0 versus C1 C0 versus C2 C1 versus C2
C0 versus C1 and
C2
A2960/2920
16 hrs 0.073 0.002 7.86E-04 0.024
8 hrs 0.182 0.344 0.017 0.769
24 hrs 9.49E-04 7.52E-04 0.173 2.56E-06
A2960/2850
16 hrs 0.027 9.21E-04 0.004 0.012
8 hrs 0.376 0.461 0.025 0.925
24 hrs 5.84E-04 1.76E-04 0.045 1.63E-05
A1550/1240
16 hrs 0.005 0.005 0.509 5.61E-07
8 hrs 1.46E-04 0.472 0.005 0.035
24 hrs 0.002 0.035 0.011 2.26E-04
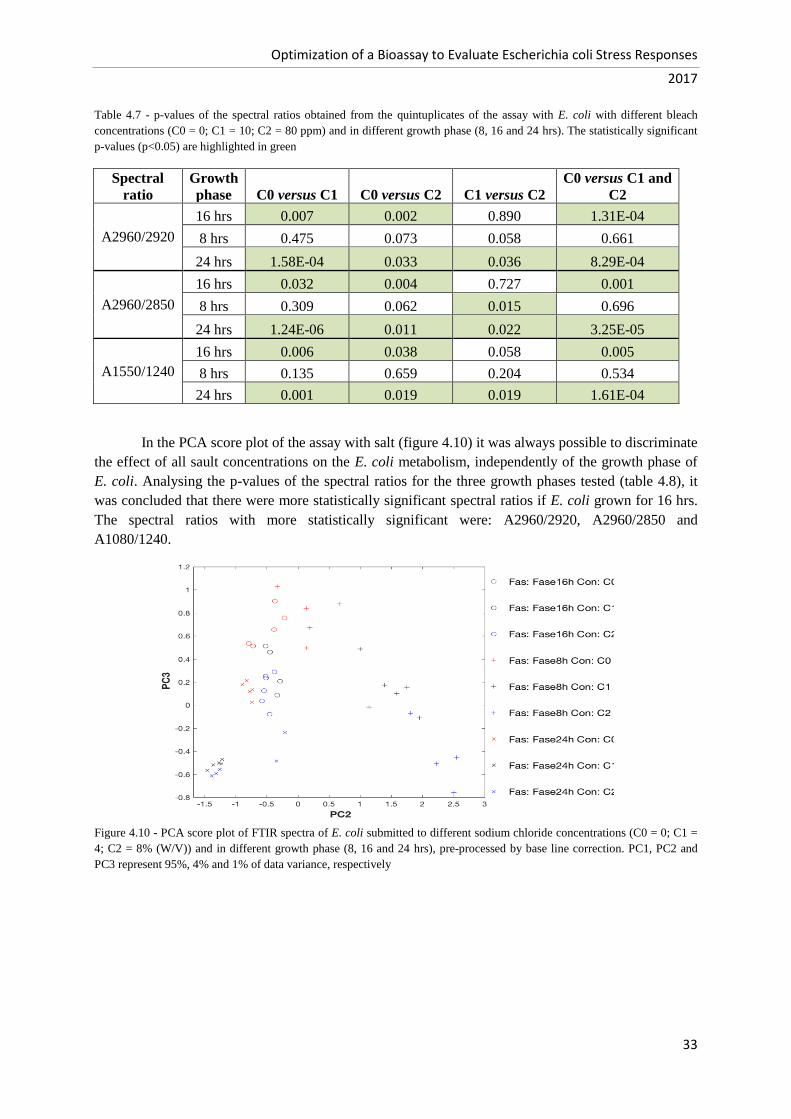
Optimization of a Bioassay to Evaluate Escherichia coli Stress Responses
2017
33
Table 4.7 - p-values of the spectral ratios obtained from the quintuplicates of the assay with E. coli with different bleach
concentrations (C0 = 0; C1 = 10; C2 = 80 ppm) and in different growth phase (8, 16 and 24 hrs). The statistically significant
p-values (p<0.05) are highlighted in green
Spectral
ratio
Growth
phase C0 versus C1 C0 versus C2 C1 versus C2
C0 versus C1 and
C2
A2960/2920
16 hrs 0.007 0.002 0.890 1.31E-04
8 hrs 0.475 0.073 0.058 0.661
24 hrs 1.58E-04 0.033 0.036 8.29E-04
A2960/2850
16 hrs 0.032 0.004 0.727 0.001
8 hrs 0.309 0.062 0.015 0.696
24 hrs 1.24E-06 0.011 0.022 3.25E-05
A1550/1240
16 hrs 0.006 0.038 0.058 0.005
8 hrs 0.135 0.659 0.204 0.534
24 hrs 0.001 0.019 0.019 1.61E-04
In the PCA score plot of the assay with salt (figure 4.10) it was always possible to discriminate
the effect of all sault concentrations on the E. coli metabolism, independently of the growth phase of
E. coli. Analysing the p-values of the spectral ratios for the three growth phases tested (table 4.8), it
was concluded that there were more statistically significant spectral ratios if E. coli grown for 16 hrs.
The spectral ratios with more statistically significant were: A2960/2920, A2960/2850 and
A1080/1240.
Figure 4.10 - PCA score plot of FTIR spectra of E. coli submitted to different sodium chloride concentrations (C0 = 0; C1 =
4; C2 = 8% (W/V)) and in different growth phase (8, 16 and 24 hrs), pre-processed by base line correction. PC1, PC2 and
PC3 represent 95%, 4% and 1% of data variance, respectively
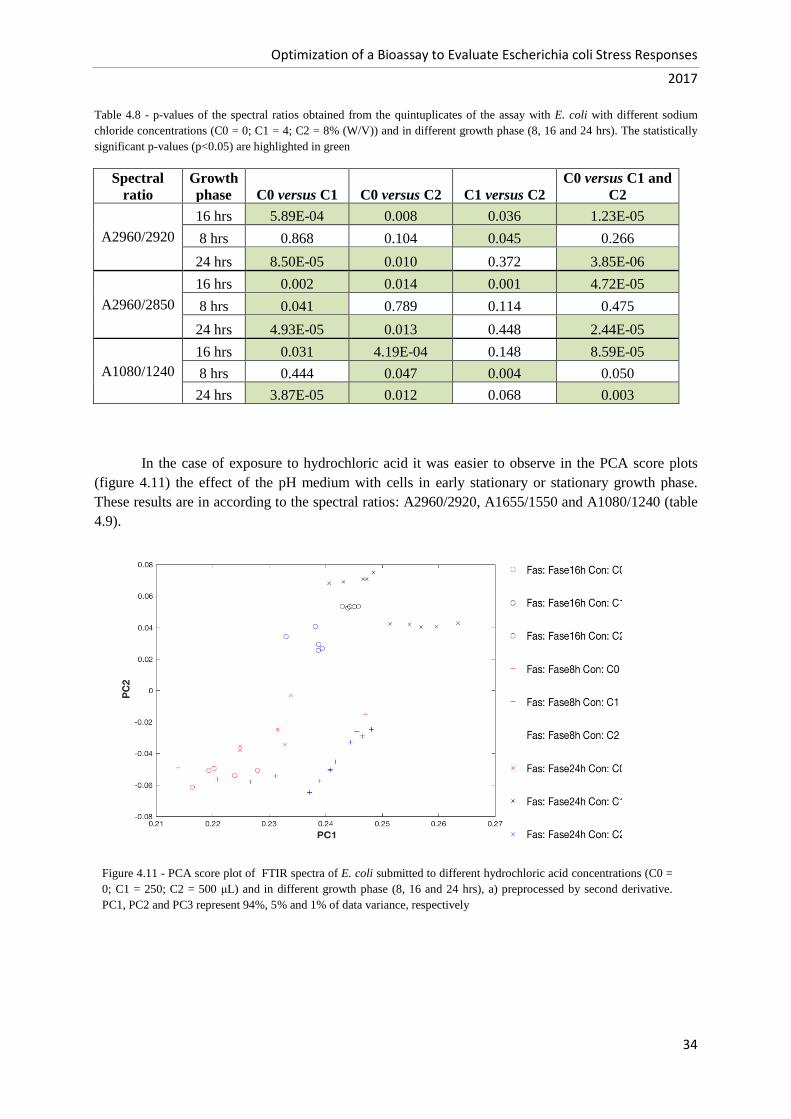
Optimization of a Bioassay to Evaluate Escherichia coli Stress Responses
2017
34
Table 4.8 - p-values of the spectral ratios obtained from the quintuplicates of the assay with E. coli with different sodium
chloride concentrations (C0 = 0; C1 = 4; C2 = 8% (W/V)) and in different growth phase (8, 16 and 24 hrs). The statistically
significant p-values (p<0.05) are highlighted in green
Spectral
ratio
Growth
phase C0 versus C1 C0 versus C2 C1 versus C2
C0 versus C1 and
C2
A2960/2920
16 hrs 5.89E-04 0.008 0.036 1.23E-05
8 hrs 0.868 0.104 0.045 0.266
24 hrs 8.50E-05 0.010 0.372 3.85E-06
A2960/2850
16 hrs 0.002 0.014 0.001 4.72E-05
8 hrs 0.041 0.789 0.114 0.475
24 hrs 4.93E-05 0.013 0.448 2.44E-05
A1080/1240
16 hrs 0.031 4.19E-04 0.148 8.59E-05
8 hrs 0.444 0.047 0.004 0.050
24 hrs 3.87E-05 0.012 0.068 0.003
In the case of exposure to hydrochloric acid it was easier to observe in the PCA score plots
(figure 4.11) the effect of the pH medium with cells in early stationary or stationary growth phase.
These results are in according to the spectral ratios: A2960/2920, A1655/1550 and A1080/1240 (table
4.9).
Figure 4.11 - PCA score plot of FTIR spectra of E. coli submitted to different hydrochloric acid concentrations (C0 =
0; C1 = 250; C2 = 500 μL) and in different growth phase (8, 16 and 24 hrs), a) preprocessed by second derivative.
PC1, PC2 and PC3 represent 94%, 5% and 1% of data variance, respectively
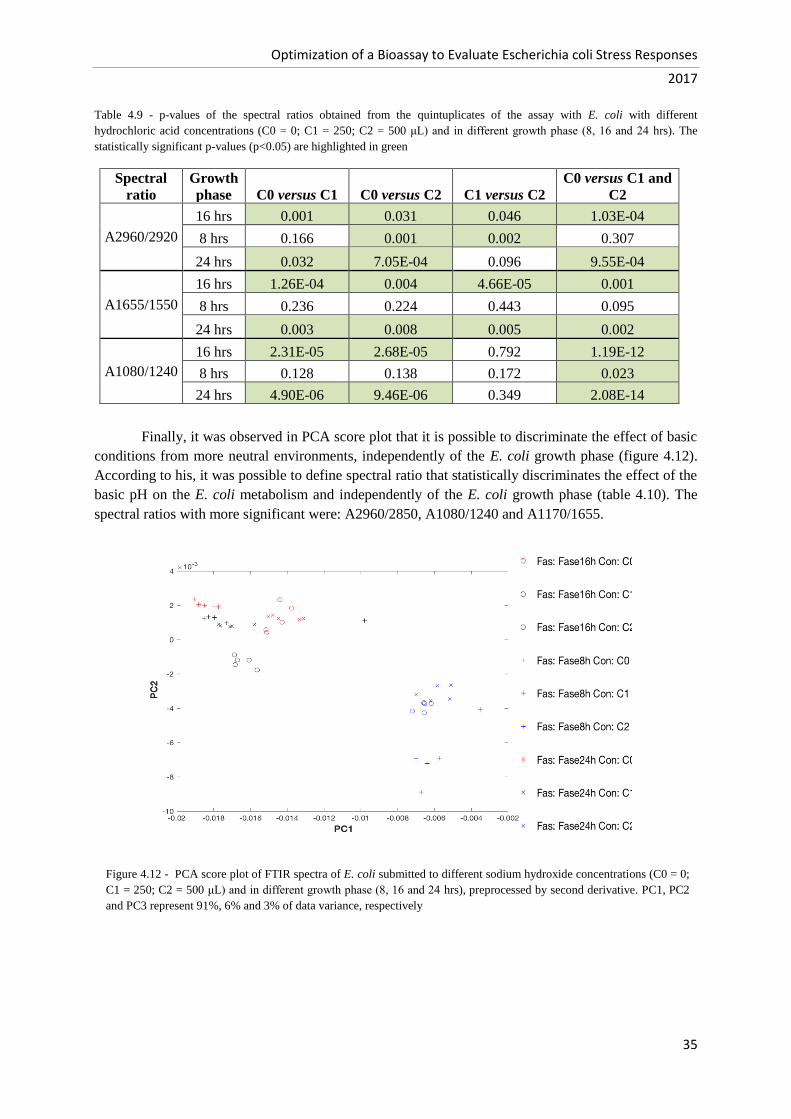
Optimization of a Bioassay to Evaluate Escherichia coli Stress Responses
2017
35
Table 4.9 - p-values of the spectral ratios obtained from the quintuplicates of the assay with E. coli with different
hydrochloric acid concentrations (C0 = 0; C1 = 250; C2 = 500 μL) and in different growth phase (8, 16 and 24 hrs). The
statistically significant p-values (p<0.05) are highlighted in green
Spectral
ratio
Growth
phase C0 versus C1 C0 versus C2 C1 versus C2
C0 versus C1 and
C2
A2960/2920
16 hrs 0.001 0.031 0.046 1.03E-04
8 hrs 0.166 0.001 0.002 0.307
24 hrs 0.032 7.05E-04 0.096 9.55E-04
A1655/1550
16 hrs 1.26E-04 0.004 4.66E-05 0.001
8 hrs 0.236 0.224 0.443 0.095
24 hrs 0.003 0.008 0.005 0.002
A1080/1240
16 hrs 2.31E-05 2.68E-05 0.792 1.19E-12
8 hrs 0.128 0.138 0.172 0.023
24 hrs 4.90E-06 9.46E-06 0.349 2.08E-14
Finally, it was observed in PCA score plot that it is possible to discriminate the effect of basic
conditions from more neutral environments, independently of the E. coli growth phase (figure 4.12).
According to his, it was possible to define spectral ratio that statistically discriminates the effect of the
basic pH on the E. coli metabolism and independently of the E. coli growth phase (table 4.10). The
spectral ratios with more significant were: A2960/2850, A1080/1240 and A1170/1655.
Figure 4.12 - PCA score plot of FTIR spectra of E. coli submitted to different sodium hydroxide concentrations (C0 = 0;
C1 = 250; C2 = 500 μL) and in different growth phase (8, 16 and 24 hrs), preprocessed by second derivative. PC1, PC2
and PC3 represent 91%, 6% and 3% of data variance, respectively
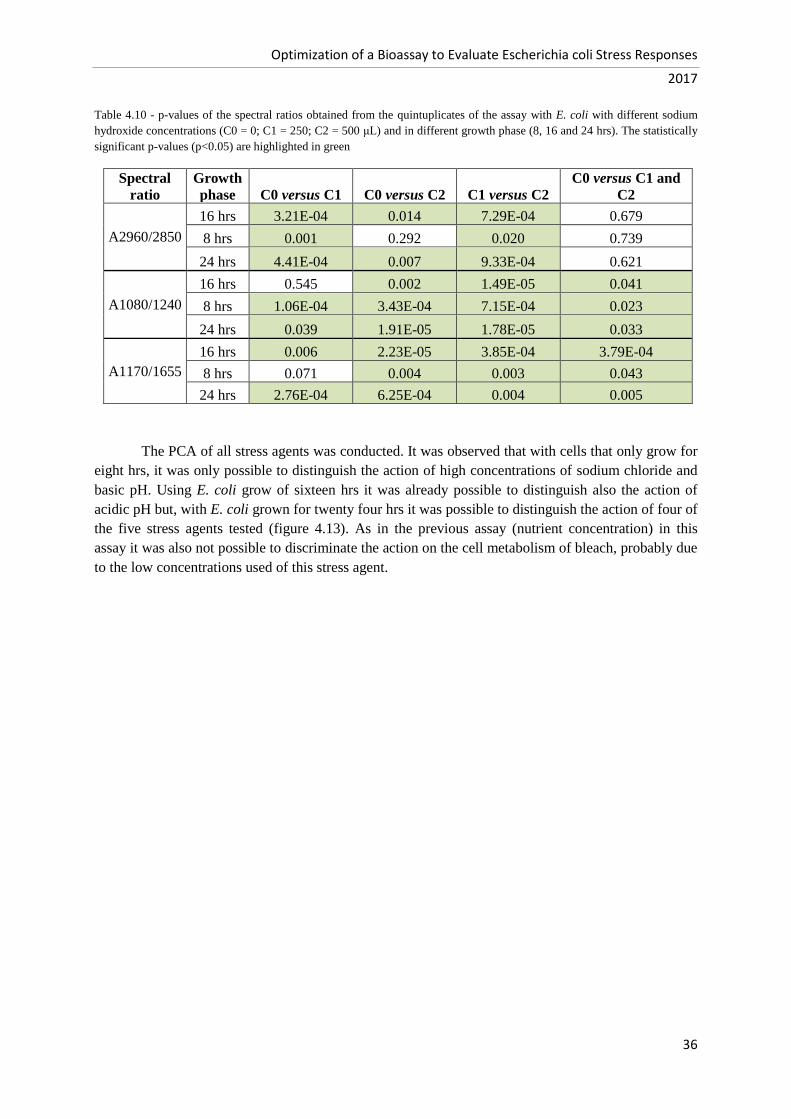
Optimization of a Bioassay to Evaluate Escherichia coli Stress Responses
2017
36
Table 4.10 - p-values of the spectral ratios obtained from the quintuplicates of the assay with E. coli with different sodium
hydroxide concentrations (C0 = 0; C1 = 250; C2 = 500 μL) and in different growth phase (8, 16 and 24 hrs). The statistically
significant p-values (p<0.05) are highlighted in green
Spectral
ratio
Growth
phase C0 versus C1 C0 versus C2 C1 versus C2
C0 versus C1 and
C2
A2960/2850
16 hrs 3.21E-04 0.014 7.29E-04 0.679
8 hrs 0.001 0.292 0.020 0.739
24 hrs 4.41E-04 0.007 9.33E-04 0.621
A1080/1240
16 hrs 0.545 0.002 1.49E-05 0.041
8 hrs 1.06E-04 3.43E-04 7.15E-04 0.023
24 hrs 0.039 1.91E-05 1.78E-05 0.033
A1170/1655
16 hrs 0.006 2.23E-05 3.85E-04 3.79E-04
8 hrs 0.071 0.004 0.003 0.043
24 hrs 2.76E-04 6.25E-04 0.004 0.005
The PCA of all stress agents was conducted. It was observed that with cells that only grow for
eight hrs, it was only possible to distinguish the action of high concentrations of sodium chloride and
basic pH. Using E. coli grow of sixteen hrs it was already possible to distinguish also the action of
acidic pH but, with E. coli grown for twenty four hrs it was possible to distinguish the action of four of
the five stress agents tested (figure 4.13). As in the previous assay (nutrient concentration) in this
assay it was also not possible to discriminate the action on the cell metabolism of bleach, probably due
to the low concentrations used of this stress agent.

Optimization of a Bioassay to Evaluate Escherichia coli Stress Responses
2017
37
Figure 4.13 - PCA score plot of FTIR spectra of E. coli submitted to different concentrations (C) of the stress agents
ethanol (A1), bleach (A2), sodium chloride (A3), hydrochloric acid (A4) and sodium hydroxide (A5) and in different
growth phase (8, 16 and 24 hrs) a) after eight hrs of growth, pre-processed by second derivative b) after sixteen hrs of
growth, preprocessed by base line correction, Min Amide I normalization and MSC c) after twenty-four hrs of growth,
preprocessed by second derivative. PC1, PC2 and PC3 represent 98%, 1% and 1% of data variance, respectively
a)
b) c)

Optimization of a Bioassay to Evaluate Escherichia coli Stress Responses
2017
38
4.1.3 Incubation time
It is expected that the exposure time to the stress agent will affect the E. coli metabolism, and
therefore the bioassay’s sensitivity and reproducibility. To test this, E. coli was exposed to stress
agents for one, eight and twenty-four hrs. An exposition time of 1 hr, would theoretically result in a
more rapid assay, relevant e.g. when screening for potential antimicrobial agents, while an increase
exposure time would increase the method reproducibility and/or sensitivity as theoretically the
environment impact on the cell metabolism will be higher.
In the PCA score plots of the assay with ethanol (figure 4.14), it was possible to discriminate
the effect of ethanol concentration by using any incubation time. This result was in agreement with the
diverse spectral ratios that enable to discriminate this stress agent effect along the three incubation
periods: A2960/2920, A2960/2850 and A1550/1240. There are spectral ratios that enable to
discriminate all the experiments with ethanol using 1 or 24 hrs incubation period.
a)
b)
Figure 4.14 - PCA score plot of FTIR spectra of E. coli submitted to different ethanol concentrations (C0 = 0; C1 = 2; C2 =
10%) and with different incubation times (1, 8 and 24 hrs) a) preprocessed by base line correction and MinMax
normalization b) preprocessed by second derivative. PC1, PC2 and PC3 represent 98%, 1% and 1% of data variance,
respectively

Optimization of a Bioassay to Evaluate Escherichia coli Stress Responses
2017
39
Table 4.11 - p-values of the spectral ratios obtained from the quintuplicates of the assay with E. coli with different ethanol
concentrations (C0 = 0; C1 = 2; C2 = 10%) and with different incubation times (1, 8 and 24 hrs). The statistically significant
p-values (p<0.05) are highlighted in green
Spectral
ratio
Incubation
time C0 versus C1 C0 versus C2 C1 versus C2
C0 versus C1
and C2
A2960/2920
8 hrs 0.061 2.50E-04 0.001 0.033
24 hrs 0.001 2.58E-05 8.30E-05 1.95E-04
1 hr 9.49E-04 7.52E-04 0.173 2.538E-06
A2960/2850
8 hrs 0.098 7.47E-04 0.002 0.043
24 hrs 0.002 0.010 0.059 0.001
1 hr 5.84E-04 1.76E-04 0.045 1.63E-05
A1550/1240
8 hrs 0.031 8.89E-04 0.014 0.005
24 hrs 0.007 0.023 1.88E-04 0.662
1 hr 0.002 0.035 0.011 2.26E-04
In the assay with bleach the PCA score plots (figure 4.15), highlight that it is only possible to
discriminate the effect of bleach when using an incubation period equal or higher than 8 hrs. The score
plots of cells exposed to the stress agent for 24 hrs were more separated from the controls in relation to
an incubation period of 8 hrs. The spectral ratios (table 4.12) more significant to discriminate the
effect of this stress agent were: A2960/2920, A2960/2850 and A1655/1240. These entire spectral
ratios enable to discriminate all experiments conducted with this stress agent when using an incubation
period of 1 hr.
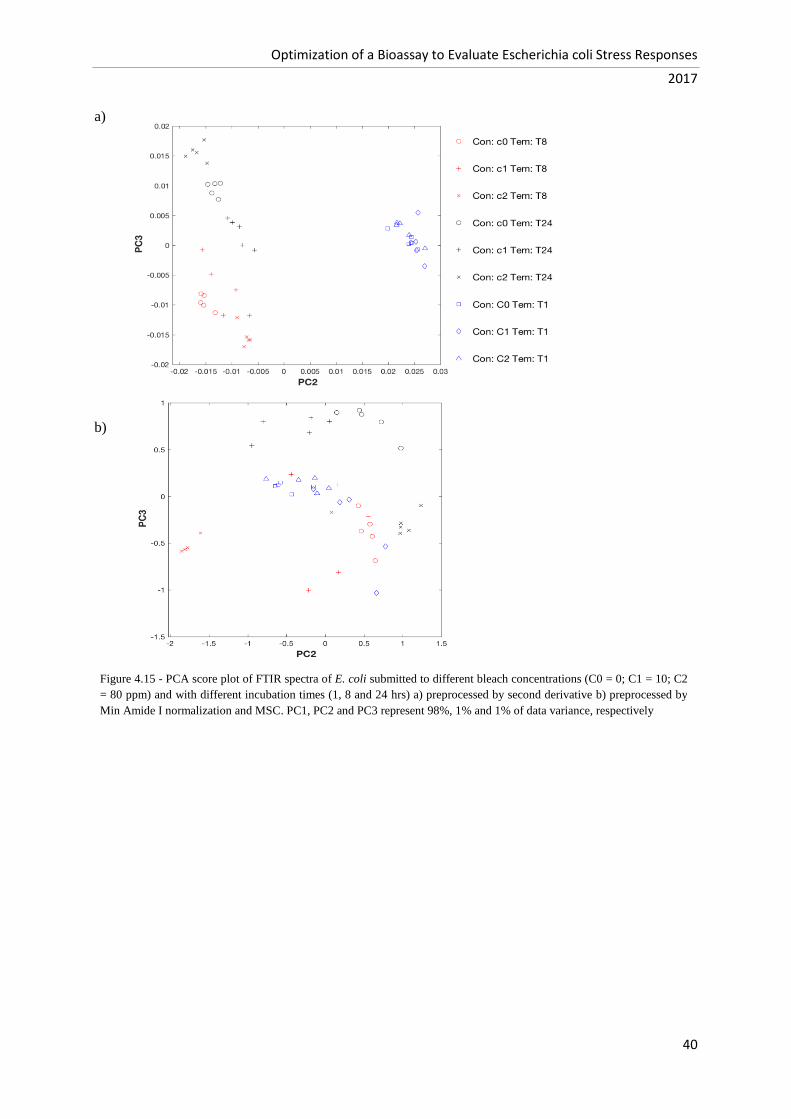
Optimization of a Bioassay to Evaluate Escherichia coli Stress Responses
2017
40
a)
b)
Figure 4.15 - PCA score plot of FTIR spectra of E. coli submitted to different bleach concentrations (C0 = 0; C1 = 10; C2
= 80 ppm) and with different incubation times (1, 8 and 24 hrs) a) preprocessed by second derivative b) preprocessed by
Min Amide I normalization and MSC. PC1, PC2 and PC3 represent 98%, 1% and 1% of data variance, respectively

Optimization of a Bioassay to Evaluate Escherichia coli Stress Responses
2017
41
Table 4.12 - p-values of the spectral ratios obtained from the quintuplicates of the assay with E. coli with different bleach
concentrations (C0 = 0; C1 = 10; C2 = 80 ppm) and with different incubation times (1, 8 and 24 hrs). The statistically
significant p-values (p<0.05) are highlighted in green the statistically significant p-values are highlighted in green
Spectral
ratio
Incubation
time C0 versus C1 C0 versus C2 C1 versus C2
C0 versus C1
and C2
A2960/2920
8 hrs 0.006 3.50E-05 0.584 6.04E-05
24 hrs 0.025 0.024 0.008 0.765
1 hr 1.58E-04 0.037 0.036 8.29E-04
A2960/2850
8 hrs 0.004 3.36E-06 0.983 5.14E-06
24 hrs 0.011 0.019 0.005 0.674
1 hr 1.24E-06 0.011 0.022 3.25E-05
A1655/1240
8 hrs 0.621 0.031 0.044 0.285
24 hrs 0.007 0.008 0.419 0.002
1 hr 0.001 0.019 0.019 1.61E-04
In the PCA score plots of the assay with sodium chloride (4.16 figure) the controls were all
separate of the samples that were exposed to this stress agent, independently of the incubation period.
The spectral ratios (table 4.13) that enable to discriminate the effect of salt were: A2960/2920,
A1550/1240 and A1655/1630.
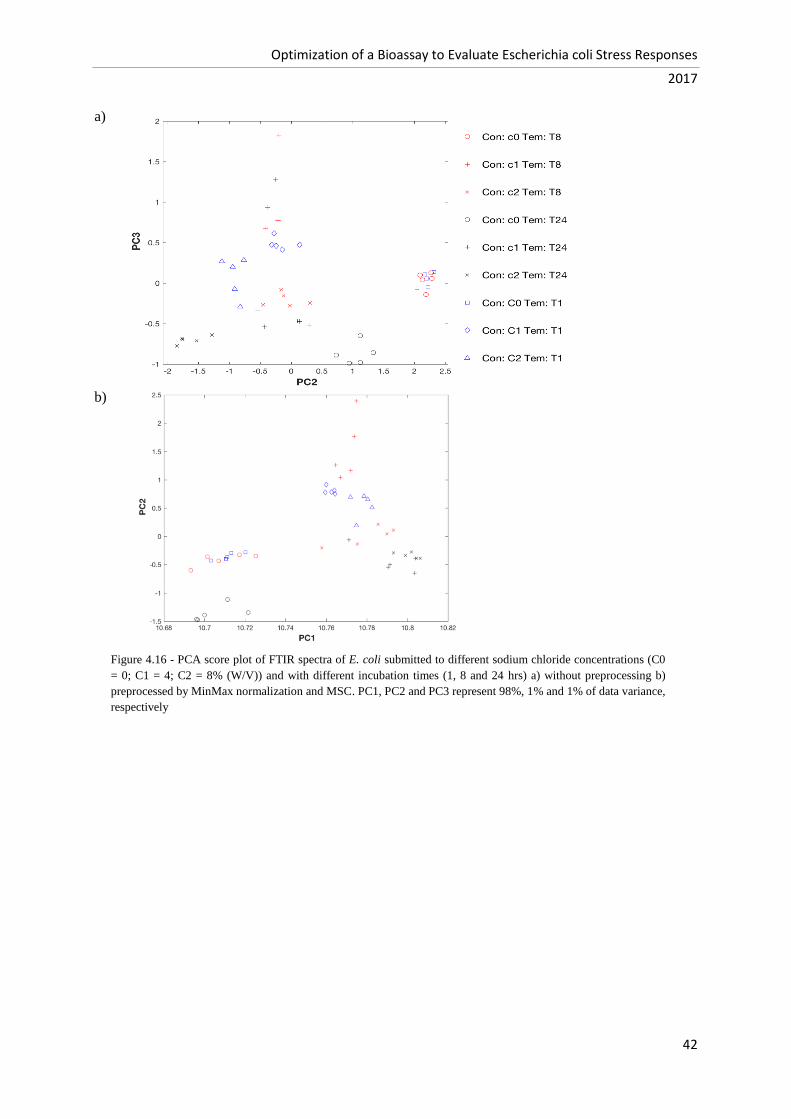
Optimization of a Bioassay to Evaluate Escherichia coli Stress Responses
2017
42
a)
b)
Figure 4.16 - PCA score plot of FTIR spectra of E. coli submitted to different sodium chloride concentrations (C0
= 0; C1 = 4; C2 = 8% (W/V)) and with different incubation times (1, 8 and 24 hrs) a) without preprocessing b)
preprocessed by MinMax normalization and MSC. PC1, PC2 and PC3 represent 98%, 1% and 1% of data variance,
respectively
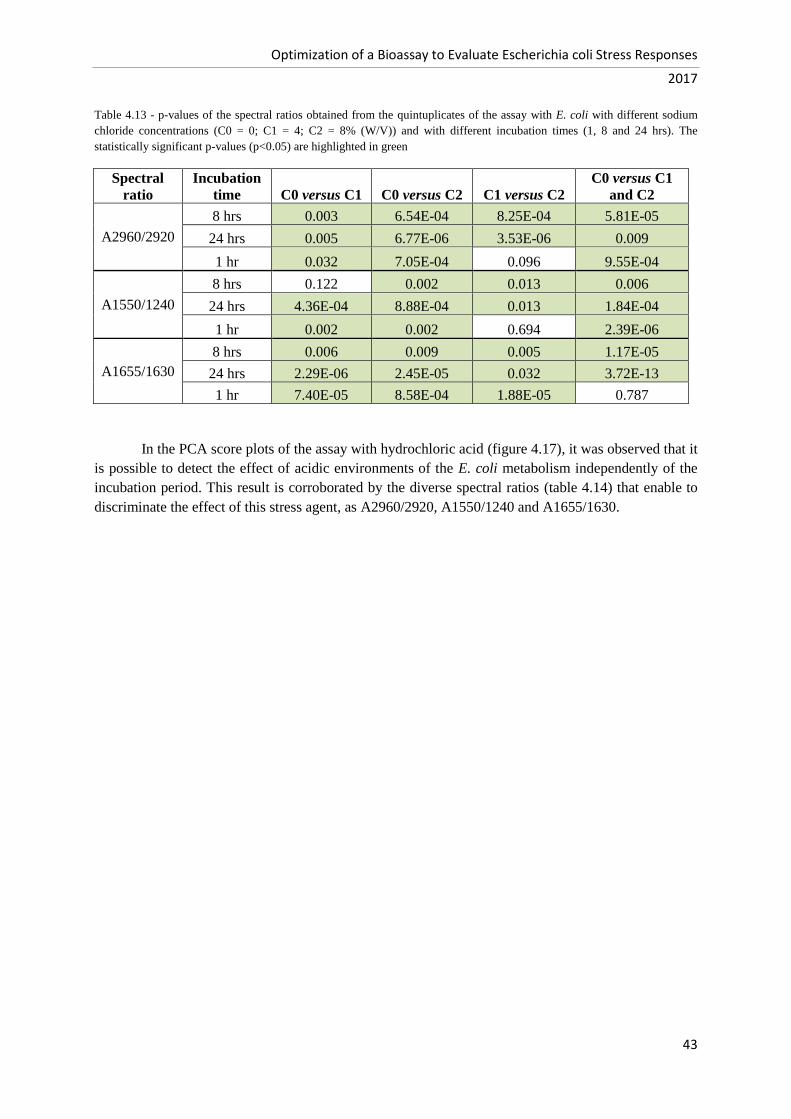
Optimization of a Bioassay to Evaluate Escherichia coli Stress Responses
2017
43
Table 4.13 - p-values of the spectral ratios obtained from the quintuplicates of the assay with E. coli with different sodium
chloride concentrations (C0 = 0; C1 = 4; C2 = 8% (W/V)) and with different incubation times (1, 8 and 24 hrs). The
statistically significant p-values (p<0.05) are highlighted in green
Spectral
ratio
Incubation
time C0 versus C1 C0 versus C2 C1 versus C2
C0 versus C1
and C2
A2960/2920
8 hrs 0.003 6.54E-04 8.25E-04 5.81E-05
24 hrs 0.005 6.77E-06 3.53E-06 0.009
1 hr 0.032 7.05E-04 0.096 9.55E-04
A1550/1240
8 hrs 0.122 0.002 0.013 0.006
24 hrs 4.36E-04 8.88E-04 0.013 1.84E-04
1 hr 0.002 0.002 0.694 2.39E-06
A1655/1630
8 hrs 0.006 0.009 0.005 1.17E-05
24 hrs 2.29E-06 2.45E-05 0.032 3.72E-13
1 hr 7.40E-05 8.58E-04 1.88E-05 0.787
In the PCA score plots of the assay with hydrochloric acid (figure 4.17), it was observed that it
is possible to detect the effect of acidic environments of the E. coli metabolism independently of the
incubation period. This result is corroborated by the diverse spectral ratios (table 4.14) that enable to
discriminate the effect of this stress agent, as A2960/2920, A1550/1240 and A1655/1630.
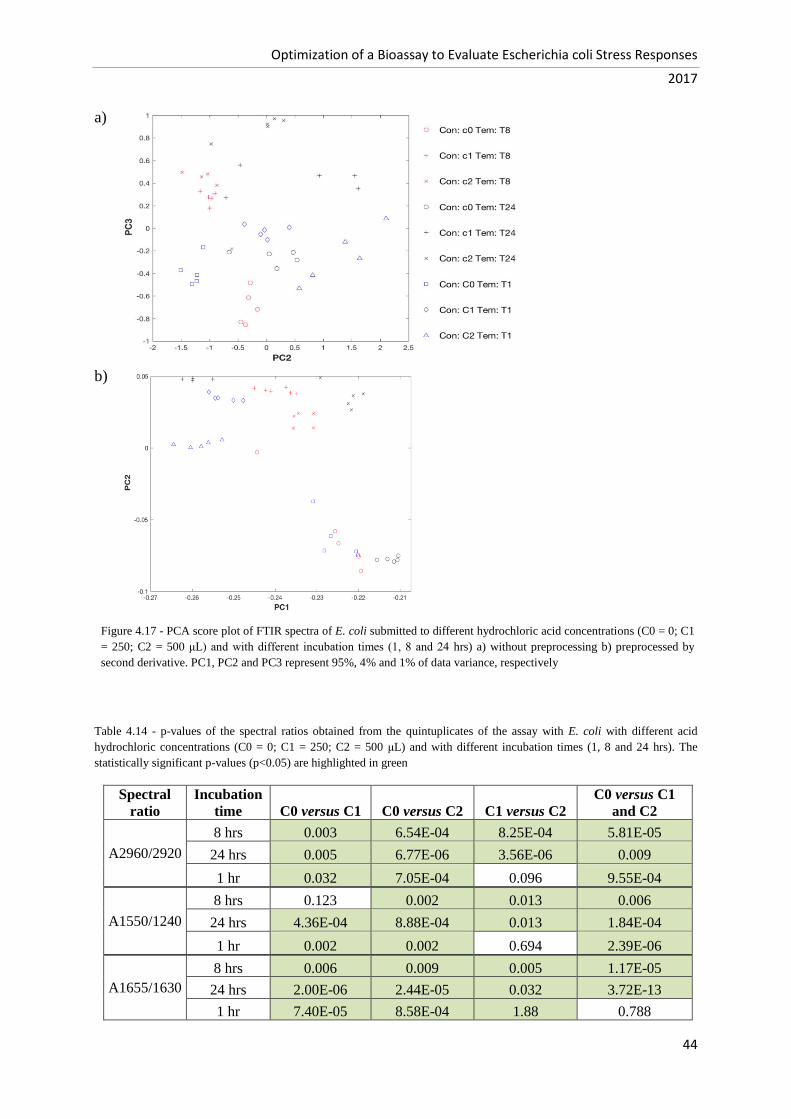
Optimization of a Bioassay to Evaluate Escherichia coli Stress Responses
2017
44
a)
b)
Table 4.14 - p-values of the spectral ratios obtained from the quintuplicates of the assay with E. coli with different acid
hydrochloric concentrations (C0 = 0; C1 = 250; C2 = 500 μL) and with different incubation times (1, 8 and 24 hrs). The
statistically significant p-values (p<0.05) are highlighted in green
Spectral
ratio
Incubation
time C0 versus C1 C0 versus C2 C1 versus C2
C0 versus C1
and C2
A2960/2920
8 hrs 0.003 6.54E-04 8.25E-04 5.81E-05
24 hrs 0.005 6.77E-06 3.56E-06 0.009
1 hr 0.032 7.05E-04 0.096 9.55E-04
A1550/1240
8 hrs 0.123 0.002 0.013 0.006
24 hrs 4.36E-04 8.88E-04 0.013 1.84E-04
1 hr 0.002 0.002 0.694 2.39E-06
A1655/1630
8 hrs 0.006 0.009 0.005 1.17E-05
24 hrs 2.00E-06 2.44E-05 0.032 3.72E-13
1 hr 7.40E-05 8.58E-04 1.88 0.788
Figure 4.17 - PCA score plot of FTIR spectra of E. coli submitted to different hydrochloric acid concentrations (C0 = 0; C1
= 250; C2 = 500 μL) and with different incubation times (1, 8 and 24 hrs) a) without preprocessing b) preprocessed by
second derivative. PC1, PC2 and PC3 represent 95%, 4% and 1% of data variance, respectively
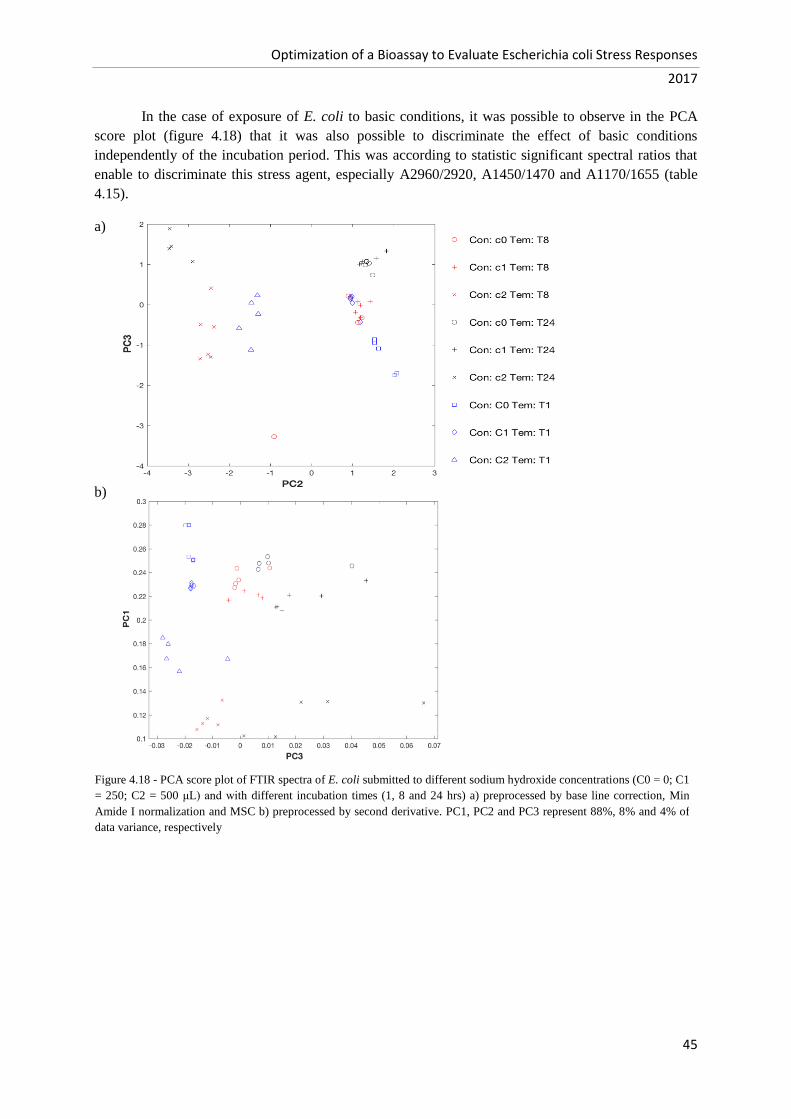
Optimization of a Bioassay to Evaluate Escherichia coli Stress Responses
2017
45
In the case of exposure of E. coli to basic conditions, it was possible to observe in the PCA
score plot (figure 4.18) that it was also possible to discriminate the effect of basic conditions
independently of the incubation period. This was according to statistic significant spectral ratios that
enable to discriminate this stress agent, especially A2960/2920, A1450/1470 and A1170/1655 (table
4.15).
a)
b)
Figure 4.18 - PCA score plot of FTIR spectra of E. coli submitted to different sodium hydroxide concentrations (C0 = 0; C1
= 250; C2 = 500 μL) and with different incubation times (1, 8 and 24 hrs) a) preprocessed by base line correction, Min
Amide I normalization and MSC b) preprocessed by second derivative. PC1, PC2 and PC3 represent 88%, 8% and 4% of
data variance, respectively
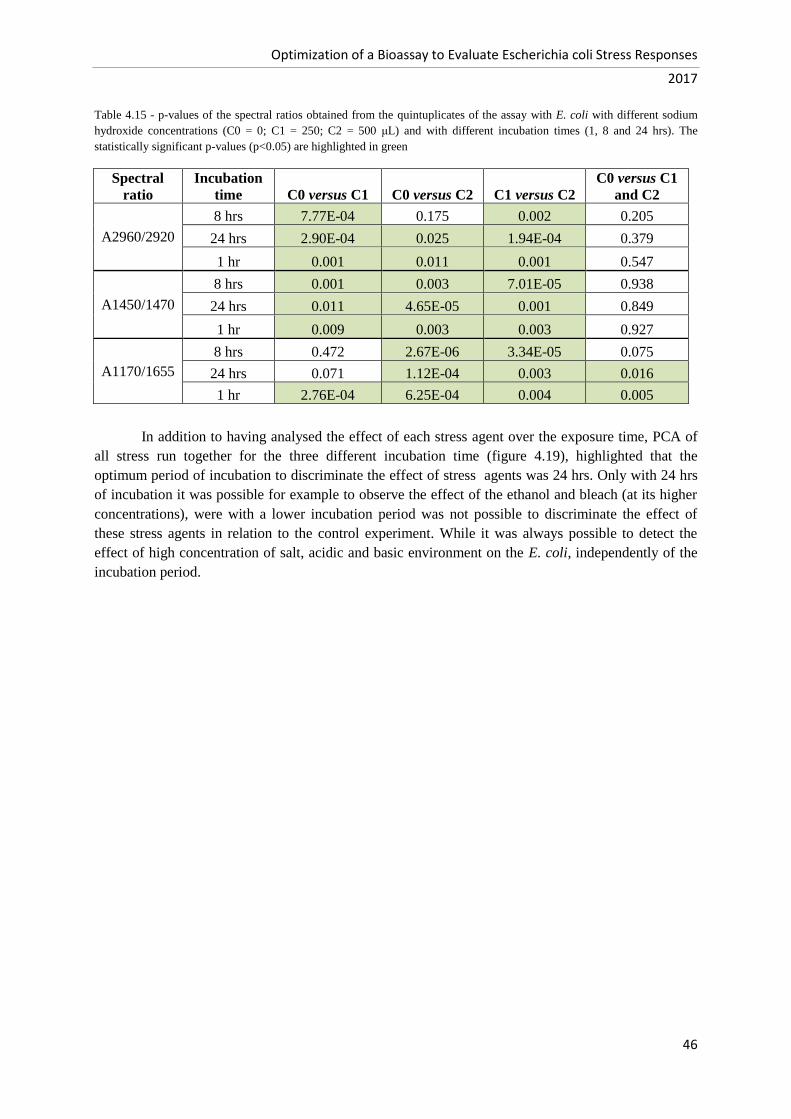
Optimization of a Bioassay to Evaluate Escherichia coli Stress Responses
2017
46
Table 4.15 - p-values of the spectral ratios obtained from the quintuplicates of the assay with E. coli with different sodium
hydroxide concentrations (C0 = 0; C1 = 250; C2 = 500 μL) and with different incubation times (1, 8 and 24 hrs). The
statistically significant p-values (p<0.05) are highlighted in green
Spectral
ratio
Incubation
time C0 versus C1 C0 versus C2 C1 versus C2
C0 versus C1
and C2
A2960/2920
8 hrs 7.77E-04 0.175 0.002 0.205
24 hrs 2.90E-04 0.025 1.94E-04 0.379
1 hr 0.001 0.011 0.001 0.547
A1450/1470
8 hrs 0.001 0.003 7.01E-05 0.938
24 hrs 0.011 4.65E-05 0.001 0.849
1 hr 0.009 0.003 0.003 0.927
A1170/1655
8 hrs 0.472 2.67E-06 3.34E-05 0.075
24 hrs 0.071 1.12E-04 0.003 0.016
1 hr 2.76E-04 6.25E-04 0.004 0.005
In addition to having analysed the effect of each stress agent over the exposure time, PCA of
all stress run together for the three different incubation time (figure 4.19), highlighted that the
optimum period of incubation to discriminate the effect of stress agents was 24 hrs. Only with 24 hrs
of incubation it was possible for example to observe the effect of the ethanol and bleach (at its higher
concentrations), were with a lower incubation period was not possible to discriminate the effect of
these stress agents in relation to the control experiment. While it was always possible to detect the
effect of high concentration of salt, acidic and basic environment on the E. coli, independently of the
incubation period.
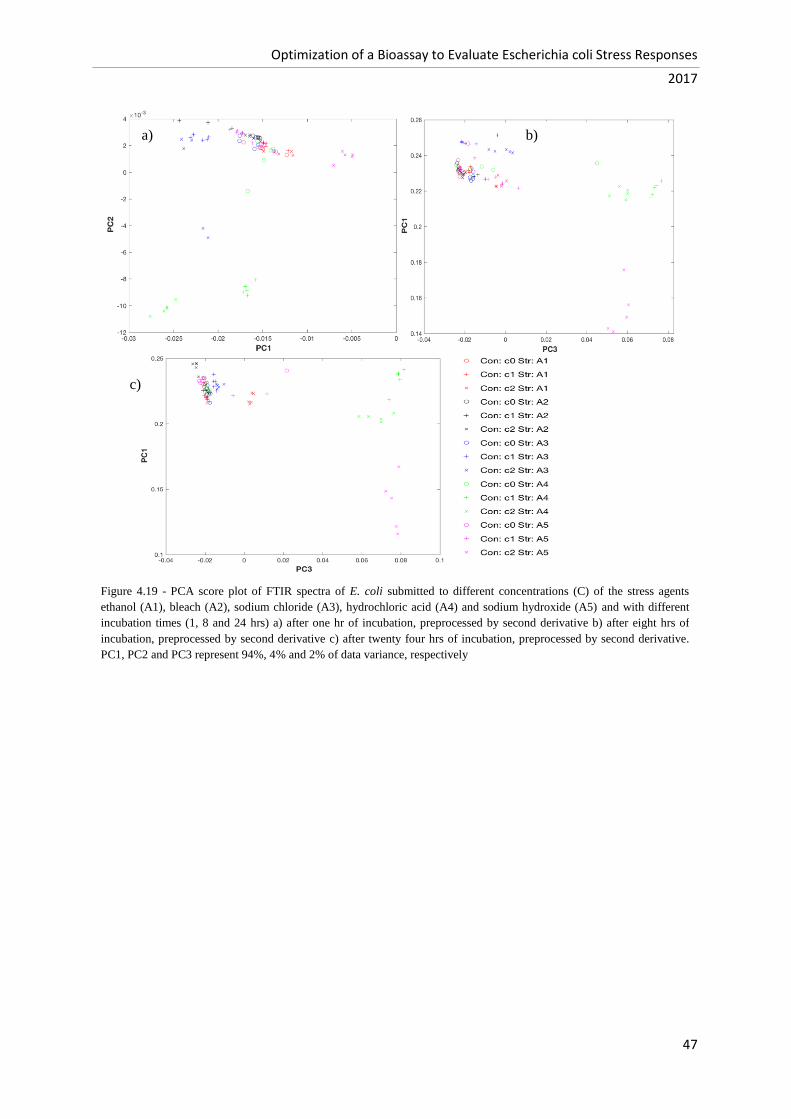
Optimization of a Bioassay to Evaluate Escherichia coli Stress Responses
2017
47
Figure 4.19 - PCA score plot of FTIR spectra of E. coli submitted to different concentrations (C) of the stress agents
ethanol (A1), bleach (A2), sodium chloride (A3), hydrochloric acid (A4) and sodium hydroxide (A5) and with different
incubation times (1, 8 and 24 hrs) a) after one hr of incubation, preprocessed by second derivative b) after eight hrs of
incubation, preprocessed by second derivative c) after twenty four hrs of incubation, preprocessed by second derivative.
PC1, PC2 and PC3 represent 94%, 4% and 2% of data variance, respectively
a) b)
c)

Optimization of a Bioassay to Evaluate Escherichia coli Stress Responses
2017
48
4.1.4 Global analysis of the bioassay
The optimization of this bioassay had as main goals to determine the best conditions to
distinguish the controls from the samples exposed to the stress agents and in addition to distinguish the
agents tested. As expected the conditions tested (nutrient concentrations, growth phase and incubation
time) affects the cell metabolism and consequently the cell sensitivity towards the stress agents. Due to
the fact that each stress agent has different modes of action on the metabolism of E. coli, slight
differences were observed in the optimal conditions (table 4.16).
In the assay to optimize the nutrient medium concentration, the reproducibility of the assays
with sodium chloride and hydrochloric acid was independent of the nutrient concentration. The
nutrient concentration of the medium seems to only interfere with the stress agents alcohol, bleach and
sodium hydroxide. In the assay with ethanol the medium with double nutrient concentration (M5x)
presents the highest reproducibility and sensitivity. In the case of bleach, a consensus was not reached
between the nutrient medium 2.5x and 5x. With sodium hydroxide the 2.5x nutrient concentration
presents the highest reproducibility.
Cells that have grown for 24 hrs were best suited for detecting the action of ethanol, bleach
and hydrochloric acid. In case of the assay with hydrochloric acid the cells that have grown for 16 hrs
makes all possible to obtain a high reproducibility of the assay. The reproducibility of the assays with
sodium chloride and sodium hydroxide showed to be independent from the growth phase of the cells
used.
In the case of the assay incubation time, it was observed that for all stress agents tested the
reproducibility of the assay was independent of the exposure time.
Table 4.16 - Optimal conditions for the bioassay for each stress agent taking into account nutrient concentration, E. coli
growth phase and incubation time
Nutrient medium
concentration Growth phase Incubation time
Ethanol M5x 24 hrs
Any incubation time
tested
Bleach M2.5x or M5x 24 hrs
Any incubation time
tested
Sodium chloride Any nutrient medium tested
Any growth phase
tested
Any incubation time
tested
Hydrochloric acid Any nutrient medium tested 16 or 24 hrs
Any incubation time
tested
Sodium hydroxide M2.5x
Anygrowth phase
tested
Any incubation time
tested

Optimization of a Bioassay to Evaluate Escherichia coli Stress Responses
2017
49
With the analysis per stress agent, it was not possible to conclude the optimal conditions to
evaluate alterations in the metabolism of E. coli cells when exposed to different types of stress. Only
after the analysis of the PCA of the assays with all the agents together it was possible to conclude that
for stress conditions with a high impact on cellular metabolism the use of an optimized bioassay is not
as relevant. On the contrary, for conditions with a reduced impact on cell metabolism, optimization of
the assay proved to be critical. For example, the effect of high concentrations of salt and acidic or
basic media can be observed even in sub-optimized assays. However, for stress conditions evaluated
with ethanol and beach, it was only possible to evidence the effect of these conditions on cell
metabolism after optimization of the assay, that is, only if using reduced nutrient concentrations, E.
coli in the stationary growth phase and an incubation time with the stress agent of 24 hrs.
Another goal of this work was to find spectral biomarkers to detect the action of stress agents
on the metabolism of bacteria. For this purpose, the t-student test was used to analyse if the spectral
ratios were statistically significant (p-values less than 0.05). All spectral ratios, chosen according to
the peaks of the second derivative, were tested for all stress agents but different results were observed
(table 4.17). Since each wavelength represents different molecules, this observation can be explained
by the fact that each stress agent has different effects on E. coli cells, as was seen in the introduction.
In case of the ethanol, the spectral ratios more significant were in general: A2960/2920,
A2960/2850, and A1550/1240. As previously mentioned the spectral ratios A2960/2920 and
A2960/2850 allow to evaluate the state of cellular membranes of cells, which means that ethanol alters
the cell membranes of E. coli cells, as was seen in the literature. We also saw that ROS produced due
to stress caused by ethanol damages cell’s DNA and ethanol can altering the function of proteins,
A1550/1240 spectral ratio allows us to see these effects of ethanol on the cells.
Bleach attacks essential cell components including lipids, proteins and DNA. The component
of the cell richest in lipids is the cellular membrane. The spectral ratios A2960/2920, A2960/2850 and
A1655/1240 (evaluates the effect on DNA and proteins) proves that this stressing agent interferes with
the cellular components mentioned.
The stress agents sodium chloride, hydrochloric acid and sodium hydroxide interfere with the
osmotic balance of the cells which can destroy cell membranes and causes leakage of the internal cell
content. Therefore, it was not surprising that in the assays with these agents the following spectral
ratios were found to be significant statistically: A2960/2920 and A2960/2850 (evaluate the effect on
cellular membranes), A1550/1240, A1080/1240, A1655/1550 and A1170/1655 (evaluate the effect on
proteins and genetic material of cells).
Spectral ratio A2960/2920 and/or A2960/2850 showed to be significant statistically in all the
stress agents tested. This leads to the conclusion that all stress agents have some effect on the
cytoplasmic membrane of E. coli cells, being good spectral biomarkers to evaluate the effect of stress
agents on the E. coli metabolism.
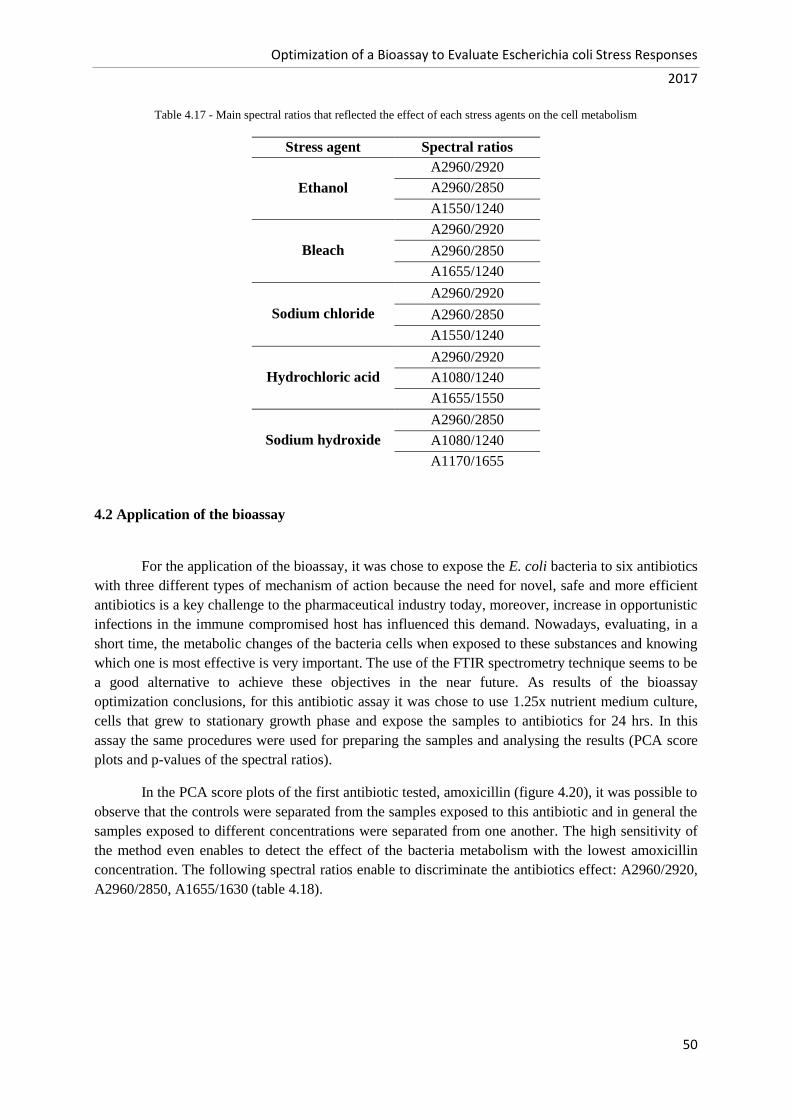
Optimization of a Bioassay to Evaluate Escherichia coli Stress Responses
2017
50
Table 4.17 - Main spectral ratios that reflected the effect of each stress agents on the cell metabolism
Stress agent Spectral ratios
Ethanol
A2960/2920
A2960/2850
A1550/1240
Bleach
A2960/2920
A2960/2850
A1655/1240
Sodium chloride
A2960/2920
A2960/2850
A1550/1240
Hydrochloric acid
A2960/2920
A1080/1240
A1655/1550
Sodium hydroxide
A2960/2850
A1080/1240
A1170/1655
4.2 Application of the bioassay
For the application of the bioassay, it was chose to expose the E. coli bacteria to six antibiotics
with three different types of mechanism of action because the need for novel, safe and more efficient
antibiotics is a key challenge to the pharmaceutical industry today, moreover, increase in opportunistic
infections in the immune compromised host has influenced this demand. Nowadays, evaluating, in a
short time, the metabolic changes of the bacteria cells when exposed to these substances and knowing
which one is most effective is very important. The use of the FTIR spectrometry technique seems to be
a good alternative to achieve these objectives in the near future. As results of the bioassay
optimization conclusions, for this antibiotic assay it was chose to use 1.25x nutrient medium culture,
cells that grew to stationary growth phase and expose the samples to antibiotics for 24 hrs. In this
assay the same procedures were used for preparing the samples and analysing the results (PCA score
plots and p-values of the spectral ratios).
In the PCA score plots of the first antibiotic tested, amoxicillin (figure 4.20), it was possible to
observe that the controls were separated from the samples exposed to this antibiotic and in general the
samples exposed to different concentrations were separated from one another. The high sensitivity of
the method even enables to detect the effect of the bacteria metabolism with the lowest amoxicillin
concentration. The following spectral ratios enable to discriminate the antibiotics effect: A2960/2920,
A2960/2850, A1655/1630 (table 4.18).
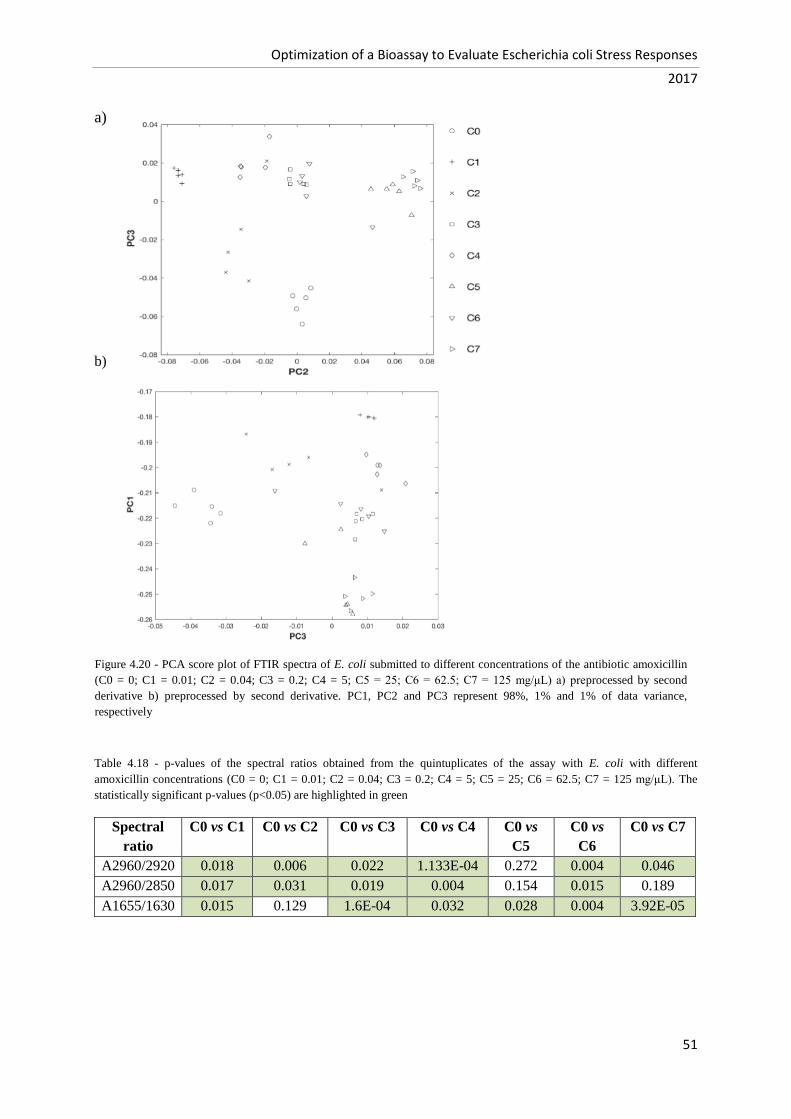
Optimization of a Bioassay to Evaluate Escherichia coli Stress Responses
2017
51
a)
b)
Table 4.18 - p-values of the spectral ratios obtained from the quintuplicates of the assay with E. coli with different
amoxicillin concentrations (C0 = 0; C1 = 0.01; C2 = 0.04; C3 = 0.2; C4 = 5; C5 = 25; C6 = 62.5; C7 = 125 mg/μL). The
statistically significant p-values (p<0.05) are highlighted in green
Spectral
ratio
C0 vs C1 C0 vs C2 C0 vs C3 C0 vs C4 C0 vs
C5
C0 vs
C6
C0 vs C7
A2960/2920 0.018 0.006 0.022 1.133E-04 0.272 0.004 0.046
A2960/2850 0.017 0.031 0.019 0.004 0.154 0.015 0.189
A1655/1630 0.015 0.129 1.6E-04 0.032 0.028 0.004 3.92E-05
Figure 4.20 - PCA score plot of FTIR spectra of E. coli submitted to different concentrations of the antibiotic amoxicillin
(C0 = 0; C1 = 0.01; C2 = 0.04; C3 = 0.2; C4 = 5; C5 = 25; C6 = 62.5; C7 = 125 mg/μL) a) preprocessed by second
derivative b) preprocessed by second derivative. PC1, PC2 and PC3 represent 98%, 1% and 1% of data variance,
respectively
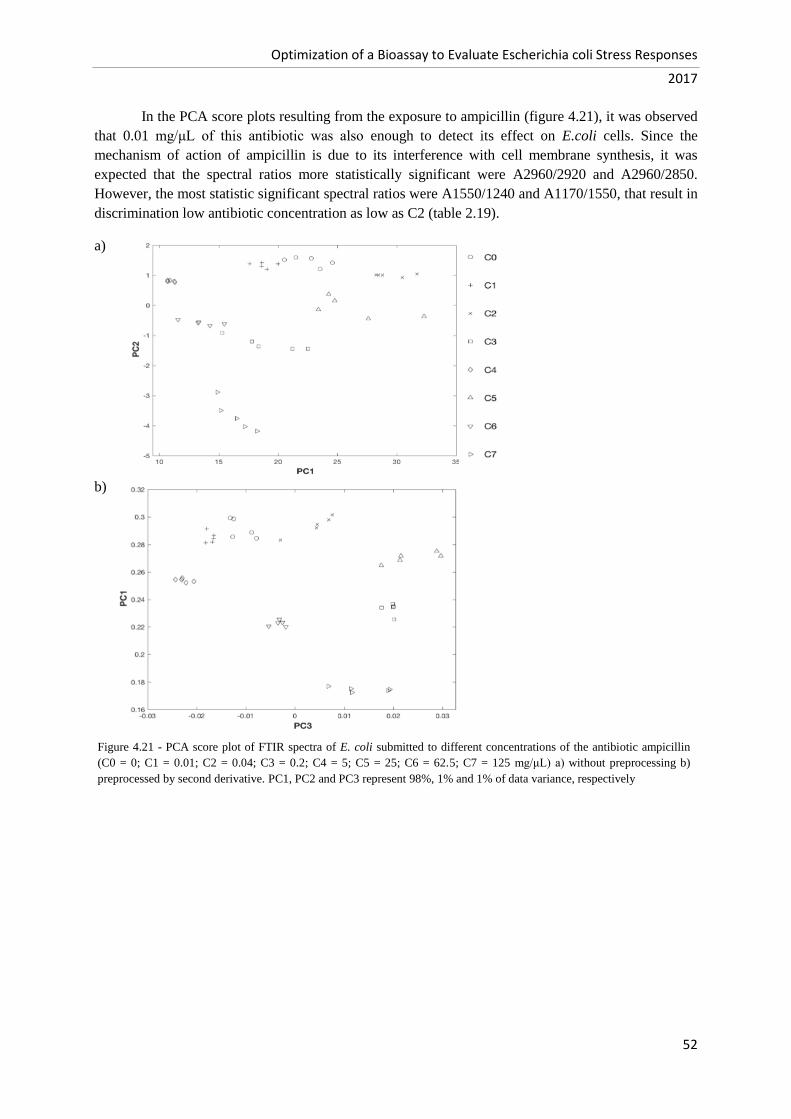
Optimization of a Bioassay to Evaluate Escherichia coli Stress Responses
2017
52
In the PCA score plots resulting from the exposure to ampicillin (figure 4.21), it was observed
that 0.01 mg/μL of this antibiotic was also enough to detect its effect on E.coli cells. Since the
mechanism of action of ampicillin is due to its interference with cell membrane synthesis, it was
expected that the spectral ratios more statistically significant were A2960/2920 and A2960/2850.
However, the most statistic significant spectral ratios were A1550/1240 and A1170/1550, that result in
discrimination low antibiotic concentration as low as C2 (table 2.19).
a)
b)
Figure 4.21 - PCA score plot of FTIR spectra of E. coli submitted to different concentrations of the antibiotic ampicillin
(C0 = 0; C1 = 0.01; C2 = 0.04; C3 = 0.2; C4 = 5; C5 = 25; C6 = 62.5; C7 = 125 mg/μL) a) without preprocessing b)
preprocessed by second derivative. PC1, PC2 and PC3 represent 98%, 1% and 1% of data variance, respectively

Optimization of a Bioassay to Evaluate Escherichia coli Stress Responses
2017
53
Figure 4.22 - PCA sore plot of FTIR spectra of E. coli submitted to different concentrations of the antibiotic
ciprofloxacin (C0 = 0; C1 = 0.01; C2 = 0.04; C3 = 0.2; C4 = 5; C5 = 25; C6 = 62.5; C7 = 125 mg/μL) a) preprocessed by
base line correction and Min Amide I normalization b) preprocessed by Min Amide I normalization. PC1, PC2 and PC3
represent 98%, 1% and 1% of data variance, respectively
Table 4.19 - p-values of the spectral ratios obtained from the quintuplicates of the assay with E. coli with different ampicillin
concentrations (C0 = 0; C1 = 0.01; C2 = 0.04; C3 = 0.2; C4 = 5; C5 = 25; C6 = 62.5; C7 = 125 mg/μL). The statistically
significant p-values (p<0.05) are highlighted in green
Like previous antibiotics, the score plots of the assay with ciprofloxacin (figure 4.22), enable
to discriminate this antibiotic concentration. The spectral ratios more statistically significant were:
2960/2920, 1655/1690 and 1655/1550 (table 4.20). It was possible to discriminate the effect of
ciprofloxacin on cell lipids from C6 concentration (62.5 mg/μL) and at proteins levels already at the
lowest antibiotic concentration (0.01 mg/μL).
a)
b)
Spectral
ratio
C0 vs
C1
C0 vs C2 C0 vs C3 C0 vs
C4
C0 vs C5 C0 vs C6 C0 vs C7
A2960/2920 0.053 0.499 0.960 0.001 0.032 0.043 0.307
A1550/1240 0.619 9.44E-04 5.48E-04 0.049 7.26E-04 0.025 3.07E-05
A1170/1550 0.196 2.91E-04 3.69E-05 0.017 3.27E-04 6.21E-04 1.69E-04
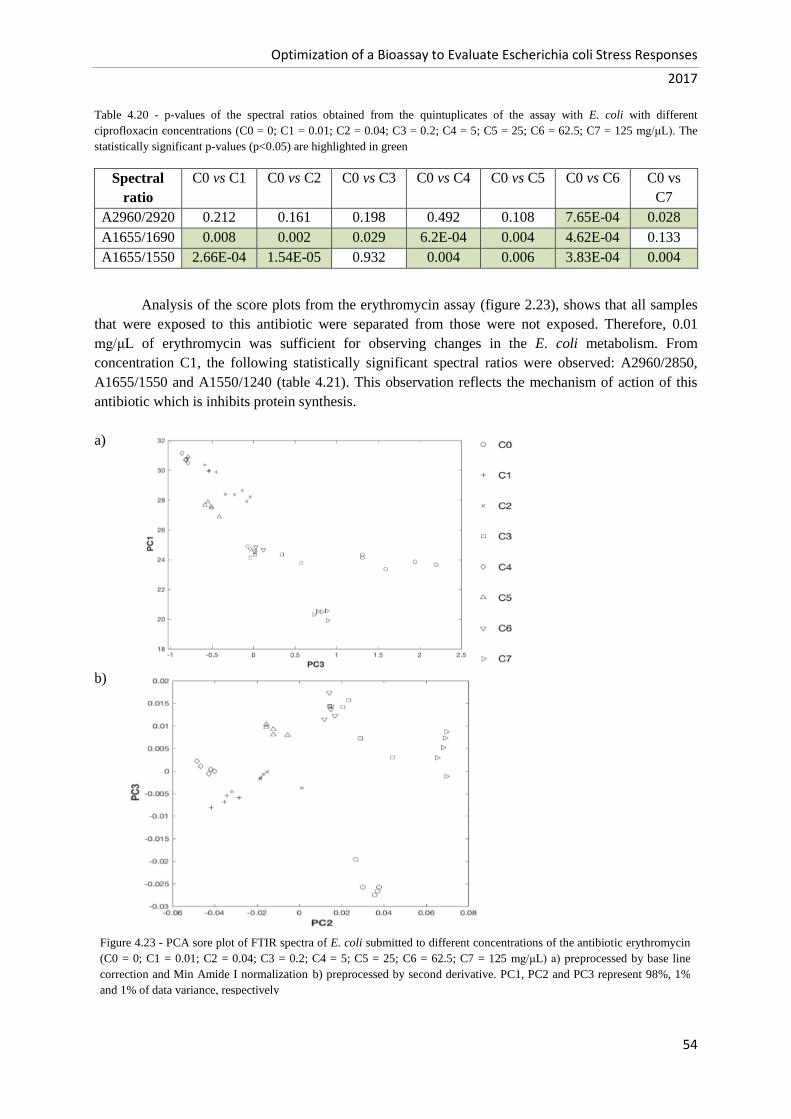
Optimization of a Bioassay to Evaluate Escherichia coli Stress Responses
2017
54
Table 4.20 - p-values of the spectral ratios obtained from the quintuplicates of the assay with E. coli with different
ciprofloxacin concentrations (C0 = 0; C1 = 0.01; C2 = 0.04; C3 = 0.2; C4 = 5; C5 = 25; C6 = 62.5; C7 = 125 mg/μL). The
statistically significant p-values (p<0.05) are highlighted in green
Spectral
ratio
C0 vs C1 C0 vs C2 C0 vs C3 C0 vs C4 C0 vs C5 C0 vs C6 C0 vs
C7
A2960/2920 0.212 0.161 0.198 0.492 0.108 7.65E-04 0.028
A1655/1690 0.008 0.002 0.029 6.2E-04 0.004 4.62E-04 0.133
A1655/1550 2.66E-04 1.54E-05 0.932 0.004 0.006 3.83E-04 0.004
Analysis of the score plots from the erythromycin assay (figure 2.23), shows that all samples
that were exposed to this antibiotic were separated from those were not exposed. Therefore, 0.01
mg/μL of erythromycin was sufficient for observing changes in the E. coli metabolism. From
concentration C1, the following statistically significant spectral ratios were observed: A2960/2850,
A1655/1550 and A1550/1240 (table 4.21). This observation reflects the mechanism of action of this
antibiotic which is inhibits protein synthesis.
a)
b)
Figure 4.23 - PCA sore plot of FTIR spectra of E. coli submitted to different concentrations of the antibiotic erythromycin
(C0 = 0; C1 = 0.01; C2 = 0.04; C3 = 0.2; C4 = 5; C5 = 25; C6 = 62.5; C7 = 125 mg/μL) a) preprocessed by base line
correction and Min Amide I normalization b) preprocessed by second derivative. PC1, PC2 and PC3 represent 98%, 1%
and 1% of data variance, respectively

Optimization of a Bioassay to Evaluate Escherichia coli Stress Responses
2017
55
Figure 4.24 - PCA sore plot FTIR spectra of E. coli submitted to different concentrations of the antibiotic metronidazole
(C0 = 0; C1 = 0.01; C2 = 0.04; C3 = 0.2; C4 = 5; C5 = 25; C6 = 62.5; C7 = 125 mg/μL) a) preprocessed by base line
correction, Min Amide I normalization and MSC b) preprocessed by Min Max normalization. PC1, PC2 and PC3
represent 98%, 1% and 1% of data variance, respectively
Table 4.21 - p-values of the spectral ratios obtained from the quintuplicates of the assay with E. coli with different
erythromycin concentrations (C0 = 0; C1 = 0.01; C2 = 0.04; C3 = 0.2; C4 = 5; C5 = 25; C6 = 62.5; C7 = 125 mg/μL). The
statistically significant p-values (p<0.05) are highlighted in green
Spectral
ratio
C0 vs C1 C0 vs C2 C0 vs C3 C0 vs
C4
C0 vs C5 C0 vs C6 C0 vs
C7
A2960/2850 0.007 0.016 0.242 0.002 0.004 0.011 9.81E-
05
A1655/1550 9.45E-04 0.002 0.041 7.9E-05 0.002 0.007 0.001
A1550/1240 1.42E-04 3.65E-06 6.48E-07 3.18E-
07
1.04E-04 4.54E-05 3.9E-05
In the case of the score plots of the metronidazole assay (figure 4.24), all the samples exposed
to this antibiotic were separate from the controls. From the first concentration tested, the statistically
significant spectral ratios were observed: A2960/2920 and A2960/2850. The A1655/1550 was statistic
significant only for some antibiotic concentrations (table 4.22).
a)
b)

Optimization of a Bioassay to Evaluate Escherichia coli Stress Responses
2017
56
Table 4.22 - p-values of the spectral ratios obtained from the quintuplicates of the assay with E. coli with different
metronidazole concentrations (C0 = 0; C1 = 0.01; C2 = 0.04; C3 = 0.2; C4 = 5; C5 = 25; C6 = 62.5; C7 = 125 mg/μL). The
statistically significant p-values (p<0.05) are highlighted in green
Spectral
ratio
C0 vs C1 C0 vs C2 C0 vs
C3
C0 vs C4 C0 vs
C5
C0 vs C6 C0 vs C7
A2960/2920 0.013 2.48E-04 0.004 0.008 0.882 0.018 0.195
A2960/2850 2.85E-05 2.84E-04 1.1E-04 5.18E-04 0.001 5.91E-05 2.23E-05
A1655/1550 0.052 4.77E-04 0.156 3.48E-04 0.089 0.034 0.002
Finally, in the score plots of the neomycin assay (figure 4.25), it was observed that it was
possible to discriminate all the antibiotic concentrations tested. The following statistically significant
spectral ratios were observed: A2960/2920, A1550/1240 and A1170/1550 (table 4.23). This
observation agrees with the fact that this antibiotic is an inhibitor of protein synthesis.
a)
b)
Figure 4.25 - PCA sore plot FTIR spectra of E. coli submitted to different concentrations of the antibiotic neomycin (C0 =
0; C1 = 0.01; C2 = 0.04; C3 = 0.2; C4 = 5; C5 = 25; C6 = 62.5; C7 = 125 mg/μL) a) pre-processed by base line correction,
Min Amide I normalization and MSC b) pre-processed by Min Max normalization. PC1, PC2 and PC3 represent 98%, 1%
and 1% of data variance, respectively
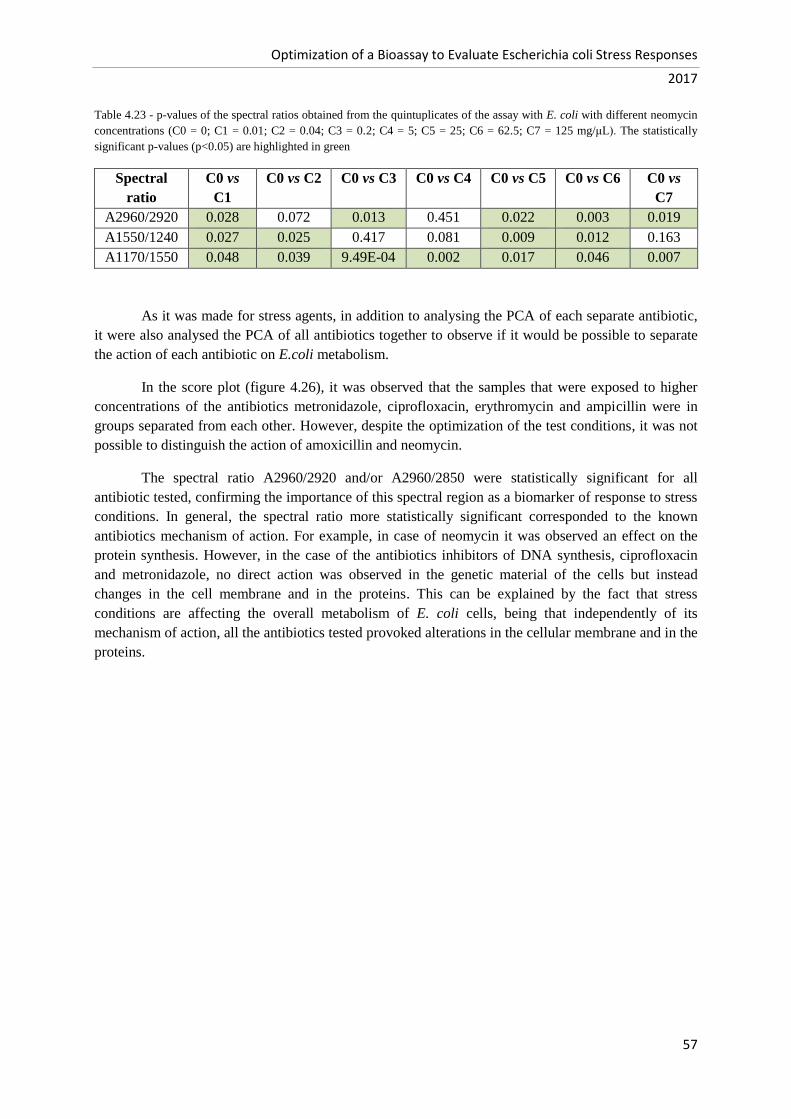
Optimization of a Bioassay to Evaluate Escherichia coli Stress Responses
2017
57
Table 4.23 - p-values of the spectral ratios obtained from the quintuplicates of the assay with E. coli with different neomycin
concentrations (C0 = 0; C1 = 0.01; C2 = 0.04; C3 = 0.2; C4 = 5; C5 = 25; C6 = 62.5; C7 = 125 mg/μL). The statistically
significant p-values (p<0.05) are highlighted in green
Spectral
ratio
C0 vs
C1
C0 vs C2 C0 vs C3 C0 vs C4 C0 vs C5 C0 vs C6 C0 vs
C7
A2960/2920 0.028 0.072 0.013 0.451 0.022 0.003 0.019
A1550/1240 0.027 0.025 0.417 0.081 0.009 0.012 0.163
A1170/1550 0.048 0.039 9.49E-04 0.002 0.017 0.046 0.007
As it was made for stress agents, in addition to analysing the PCA of each separate antibiotic,
it were also analysed the PCA of all antibiotics together to observe if it would be possible to separate
the action of each antibiotic on E.coli metabolism.
In the score plot (figure 4.26), it was observed that the samples that were exposed to higher
concentrations of the antibiotics metronidazole, ciprofloxacin, erythromycin and ampicillin were in
groups separated from each other. However, despite the optimization of the test conditions, it was not
possible to distinguish the action of amoxicillin and neomycin.
The spectral ratio A2960/2920 and/or A2960/2850 were statistically significant for all
antibiotic tested, confirming the importance of this spectral region as a biomarker of response to stress
conditions. In general, the spectral ratio more statistically significant corresponded to the known
antibiotics mechanism of action. For example, in case of neomycin it was observed an effect on the
protein synthesis. However, in the case of the antibiotics inhibitors of DNA synthesis, ciprofloxacin
and metronidazole, no direct action was observed in the genetic material of the cells but instead
changes in the cell membrane and in the proteins. This can be explained by the fact that stress
conditions are affecting the overall metabolism of E. coli cells, being that independently of its
mechanism of action, all the antibiotics tested provoked alterations in the cellular membrane and in the
proteins.

Optimization of a Bioassay to Evaluate Escherichia coli Stress Responses
2017
58
a)
b)
Figure 4.26 - PCA sore plot FTIR spectra of E. coli submitted to different concentrations of the all antibiotics tested
(amoxicillin, ampicillin, ciprofloxacin, erythromycin, metronidazole and neomycin) a) preprocessed by base line correction
and Min Amide I normalization b) preprocessed by base line correction and Min Amide I normalization. PC1, PC2 and
PC3 represent 98%, 1% and 1% of data variance, respectively
Optimization of a Bioassay to Evaluate Escherichia coli Stress Responses
2017
59
5. Conclusions and prospects
Along the present work, it was possible to observe that the bioassay enables to discriminate in
a simple, economic and high-throughput mode the metabolic impact of different stress agents on E.
coli metabolism. To optimise the bioassay, in order to increase the discrimination capacity of the
assay, not only to discriminate the effect of different agents but also the impact of the concentration of
each agent on the E. coli metabolism the following parameters were optimised: the nutrient content of
the incubation mixture, the growth phase of the E. coli cells used and the stress agent exposure time.
Ultimately it was possible to determine the optimal conditions that ensure the bioassay has enough
sensitivity to distinguish between the different metabolic impacts of the stress agents used, while being
sufficiently reproducible to ensure a coherent bioassay. Interestingly the results indicate that different
parameters are better suited for different stressing agents, however a good compromise was achieved
with the described optimization, since the bioassays’ ability to distinguish the impact of different
stress agents was generally suitable.
The optimization of the bioassay was proved to be more important for stress agents with
reduced impact on cellular metabolism than for stress agents with a high impact on cellular
metabolism, where the use of a bioassay is not as essential.
This work highlights the applicability of FTIR spectroscopy to categorize microbial stress
responses, and therefore reinforces FTIR spectroscopy has a powerful tool for metabolic fingerprinting
with the advantage of being a rapid and economic technology capable of high-throughput.
In a future work, it will be interesting to continue the optimization of the bioassay taking into
account other parameters as well to test other stress agents and different concentrations. In sum, FTIR
spectroscopy was presented as a highly promising tool to evaluate the metabolic stress response of
microorganism.
Optimization of a Bioassay to Evaluate Escherichia coli Stress Responses
2017
60
6. References
Ahmed, S.S.S.J., Santosh, W., Kumar, S., Christlet, T.H.T. (2010). Neural network algorithm for the
early detection of Parkinsons disease from blood plasma by FTIR micro-spectroscopy.
Vibrational Spectroscopy 53: 181–188
Aksoy, C., Severcan, F. (2012). Role of vibrational spectroscopy in stem cell research. Spectroscopy:
An International Journal 27:167–184
Amiali, N.M., Mulvey, M.R., Sedman, J., Simor, A.E., Ismail, A.A. (2007). Epidemiological typing of
methicillin-resistant Staphylococcus aureus strains by Fourier transform infrared spectroscopy.
Journal of Microbiological Methods 69:146–153
Arnold, S.A., Crowley, J., Woods, N., Harvey L.M., McNeil, B. (2003). In situ near infrared
spectroscopy to monitor key analytes in mammalian cell cultivation. Biotechnology and
Bioengineering 84:13–19
Babrah, J. (2009). A study of FT-IR spectroscopy for the identification and classification of
hematological malignancies. PhD Thesis, Cranfield University, United Kingdom
Bellisola, G. and Sorio, C. (2012). Infrared spectroscopy and microscopy in cancer research and
diagnosis. American Journal of Cancer Research 2(1): 1-21
Bogomolny, E., Huleihel, M., Suproun, Y., Sahu, R.K., Mordechai, S. (2007). Early spectral changes
of cellular malignant transformation using Fourier transform infrared microspectroscopy.
Journal of Biomedical Optics 12:024003
Canetta, E., Adya, A.K., Walker, G.M. (2006). Atomic force microscopic study of the effects of
ethanol on yeast cell surface morphology. FEMS Microbiology Letters 255 (2): 308-315
Cao, H. , Wei, D., Yang Y., Shang, Y., Li G., Zhou Y., Ma, Q., Xu, Y. (2017). Systems-level
understanding of ethanol-induced stresses and adaptation in E. coli. Scientific Reports 7:
44150
Chan, K.L.A. and Kazarian, S.G. (2013). Correcting the effect of refraction and dispersion of light in
FT-IR spectroscopic imaging in transmission through thick infrared windows. Analytical
chemistry 85: 1029–1036
Christian, G.D. (1994). Analytical Chemistry. WILEY: United States
Chung, H.J., Bang, W., Drake, M.A. (2006). Stress Response of Escherichia coli. Comprehensive
Reviews in Food Science and Food Safety
Corte, L., Rellini, P., Roscini, L., Fatichenti, F., Cardinali, G. (2010). Development of a novel, FTIR
(Fourier transform infrared spectroscopy) based, yeast bioassay for toxicity testing and stress
response study. Analytica Chimica Acta 659: 258–265
Optimization of a Bioassay to Evaluate Escherichia coli Stress Responses
2017
61
Corte, L., Antonielli, L., Roscini, L., Fatichenti, F., Cardinali, G. (2011). Influence of cell parameters
in Fourier transform infrared spectroscopy analysis of whole yeast cells. Analyst 136: 2339–
2349
Davis, R. and Mauer, L.J. (2010). Fourier tansform infrared (FT-IR) spectroscopy: A rapid tool for
detection and analysis of foodborne pathogenic bacteria. Formatex 1582-1594
Davis, R., Paoli, G., Mauer, L.J. (2012). Evaluation of Fourier transform infrared (FT-IR)
spectroscopy and chemometrics as a rapid approach for sub-typing Escherichia coli O157:H7
isolates. Food Microbiology 31:181–190
Douthwaite, S., Aagaard, C. (1993). Erythromycin binding is reduced in ribosomes with
conformational alterations in the 23 S rRNA peptidyl transferase loop. Journal of molecular
biology 232(3):725-31
Duygu, D., Baykal, T., Açikgӧz, I., Yildiz, K. (2009). Fourier Transform Infrared (FT-IR)
Spectroscopy for Biological Studies. Journal of Science 22:117-121
Estrela, C., Ribeiro, R.G., Estrela, C.R.A., Pécora, J.D., Sousa-Neto, M.D. (2003). Antimicrobial
effect of 2% sodium hypochlorite and 2% chlorhexidine tested by different methods. Brazilian
Dental Journal 14 (1): 58-62
Fearn, T., Riccioli, C., Garrido-Varo, A., Guerrero-Ginel, J.E. (2009). On the geometry of SNV and
MSC. Chemometrics and Intelligent Laboratory Systems 96:22-26
Gill, A.E., Amyes, S.G. (2004). The contribution of a novel ribosomal S12 mutation to
aminoglycoside resistance of Escherichia coli mutants. Journal of chemotherapy 16(4):347-9
Graça, G., Moreira, A.S., Correia, A.J.V., Goodfellow, B.J., Barros, A.S., Duarte, I.F., Carreira, I.M.,
Galhano, E., Pita, C., Almeida, M.C., Gil, A.M. (2013). Mid-infrared (MIR) metabolic
fingerprinting of amniotic fluid: a possible avenue for early diagnosis of prenatal disorders?
Analytica Chimica Acta 764:24–31
Greenler, R. (1966). Infrared study of adsorbed molecules on metal surfaces by reflection techniques.
The Journal of Chemical Physics 44: 310–315.
Griffiths, P.R. (2002). Introduction to Vibrational Spectroscopy, in Chalmers J.M. and Griffiths P.
(Eds.). Handbook of Vibrational Spectroscopy. Wiley: United States
Hammiche, A., German, M.J., Hewitt, R., Pollock, H.M., Martin, F.L. (2005). Monitoring cell cycle
distributions in MCF-7 cells using near-field photothermal microspectroscopy. Biophysical
Journal 88:3699–3706
Helm, D., Labischinski, H., Schallehn, G., Naumann, D. (1991). Classification and identification of
bacteria by Fourier-transform infrared spectroscopy. Journal of General Microbiology 137(1):
69-79
Hengge-Aronis, R. (2002). Recent Insights into the General Stress Response Regulatory Network in
Escherichia coli. Journal of Molecular Microbiology and Biotechnology 4(3): 341–346

Optimization of a Bioassay to Evaluate Escherichia coli Stress Responses
2017
62
Ho-Hyuk, J., Sung-Ho, A., Myung-Deok, K., Chan-Wha, K. (2008). Use of hydrogen peroxide as an
effective disinfectant to Actinobacillus ureae. Process Biochemistry 43: 225-228
Hosein, A., Breidt, F., Smith, C. (2011). Modeling the Effects of Sodium Chloride, Acetic Acid, and
Intracellular pH on Survival of Escherichia coli O157:H7. American Society for Microbiology
77: 889–895
Jamin, N., Miller, L., Moncuit, J., Fridman, W.H., Dumas, P., Teillaud, J.L. (2003). Chemical
heterogeneity in cell death: combined synchrotron IR and fluorescence microscopy studies of
single apoptotic and necrotic cells. Biopolymers 72:366–373
Jolliffe, I.T. (2002). Principal Component Analysis. Springer: New York, USA
Khanmohammadi, M., Garmarudi, A.B., Ramin, M., Keyvan, G. K. (2013). Diagnosis of renal failure
by infrared spectrometric analysis of human serum samples and soft independent modeling of
class analogy. Microchemical Journal 106:67–72
Kyriakides, B. C. (1998). E. coli – A practical approach to the organism and its control in foods.
Pratical Food Microbiology Series. London: Blackie Academic & Professional.
Landgrebe, D., Haake, C., Hӧpfner, T., Beutel, S., Hitzmann, B., Beutel, S., Hitzmann, B., Scheper,
T., Rhiel, M., Reardon, K.F. (2010). On-line infrared spectroscopy for bioprocess monitoring.
Applied Microbiology and Biotechnology 88:11-22
Lavine, B. K. 1998. Chemometrics. Analytical Chemistry 70:209R-228R.
Leavis, H.L., Willems, R.J., Top, J., Bonten, M.J. (2006). High-level ciprofloxacin resistance from
point mutations in gyrA and parC confined to global hospital-adapted clonal lineage CC17 of
Enterococcus faecium. Journal of clinical microbiology 44(3):1059-64
Li, A.Q., Dai, N., Yan, J., Zhu, Y.L. (2007). Screening for metronidazole-resistance associated gene
fragments of Helicobacter pylori by suppression subtractive hybridization. Journal of Zhejiang
University. Medical Science 36(5):465-9
Liang, P., Labedan, B., Riley, M. (2002). Physiological genomics of Escherichia coli protein families.
Physiologycal Genomics 9: 15–26
Lima, C., Goulart, V., Côrrea, L., Pereira, T., Zezell, D. (2015). ATR-FTIR Spectroscopy for the
Assessment of Biochemical Changes in Skin Due to Cutaneous Squamous Cell Carcinoma.
International Journal of Molecular Sciences 16: 6621-6630
Lourenço, N.D., Lopes, J.A., Alemida, C.F., Sarraguça, M.C., Pinheiro, H.M. (2012). Bioreactor
monitoring with spectroscopy and chemometrics: a review. Analytical and Bioanalytical
Chemistry 404:1211-1237
Maquelin, K., L.-P. Choo-Smith, C. Kirschner, N. A. Ngo-Thi, D. Naumann, G. J. Puppels. (2002).
Vibrational spectroscopic studies of microorganisms, p. 3308-3334. In J. M. e. P. R. G.
Chalmers (ed.), Handbook of Vibrational Spectroscopy, 1ª ed, vol. 5. John Wiley & Sons,
Chichester.
Optimization of a Bioassay to Evaluate Escherichia coli Stress Responses
2017
63
Martin, D.H. and Puplett, E. (2002). Polarised interferometric spectrometry for the millimetre and
submillimetre spectrum. Infrared Physics 10:105-109
Moen, B., Janbu, A. O., Langsrud, S., Langsrud, O., Hobman, J. L., Constantinidou, C., Kohler, A.,
Rudi, K. (2009). Global responses of Escherichia coli to adverse conditions determined by
microarrays and FT-IR spectroscopy. Canadian Journal of Microbiology 55: 714–728
Naes, T., Isaksson, T., Fearn, T., Davies, T. (2002). Multivariate Calibration and Classification. NIR
Publications: Chichester, United Kingdom
Naumann, D. (2001). FT-Infrared and FT-Raman spectroscopy in biomedical research. Applied
Spectroscopy Reviews 36:239-298.
Norris, K. P. (1959). Infra-red spectroscopy and its application to microbiology. Microbiological
Research Establishment, Ministry of Supply, Porton, Wilts
Okamoto, T., Yoshiyama, H., Nakazawa, T., Park, I.D., Chang, M.W., Yanai, H., Okita, K., Shirai, M.
(2002). A change in PBP1 is involved in amoxicillin resistance of clinical isolates of
Helicobacter pylori. The Journal of antimicrobial chemotherapy 50(6):849-56
Oliveira, R. and Silva, A. (2014). William Herschel, the invisible rays and the first ideas about infrared
radiation. Revista Brasileira de Ensino de Física 36: 2-6
Otto, M. (1999). Chemometrics: Statistics and Computer Application in Analytical Chemistry.
WILEY-VCH: Freiberg, Germany
Randolph, T.W. (2006). Scaled-based normalization of spectral data. Cancer Biomarkers 2:135-144
Reich, G. (2005). Near-Infrared spectroscopy and imaging: Basic principles and pharmaceutical
applications. Advanced Drug Delivery Reviews 57:1109-1143
Salmond, C. V., Kroll, R. G., Booth, I. R. (1984). The Effect of Food Preservatives on pH
Homeostasis in Escherichia coIi. Journal of General Microbiology 130: 2845-2850
Scholz, T., Lopes, V.V., Calado, C.R.C. (2012). High-throughput analysis of the plasmid
bioproduction process in Escherichia coli by FTIR spectroscopy. Biotechnology and
Bioengineering 109:2279-2285
Sellick, C.A., Hansen, R., Jarvis, R.M., Maqsood, A.R., Stephens, G.M., Dickson, A.J., Goodacre, R.
(2010). Rapid monitoring of recombinant antibody production by mammalian cell cultures
using Fourier Transform infrared spectroscopy and chemometrics. Biotechnology and
Bioengineering 106:432–442
Sharma, M. and Beuchat, L. (2004). Sensitivity of Escherichia coli O157:H7 to Commercially
Available Alkaline Cleaners and Subsequent Resistance to Heat and Sanitizers. American
Society for Microbiology 70: 1795 – 1803
Smith, B.C. (2011). Fourier Transform Infrared Spectroscopy. New York: CRC Press
Stuart, B. (2004). Infrared Spectroscopy: Fundamentals and Applications. WILEY: United States
Thomas, N. (1991). The early history of spectroscopy. Journal of Chemical Education 68 (8): 631

Optimization of a Bioassay to Evaluate Escherichia coli Stress Responses
2017
64
Williamson, R., Hakenbeck, R., Tomasz, A. (1980). In vivo interaction of beta-lactam antibiotics with
the penicillin-binding proteins of Streptococcus pneumoniae. Antimicrobial Agents and
Chemotherapy 18(4):629-37
References on the web
ASDinc. What is a Derivative Spectrum? Retrieved on August 22, 2017 on the website:
https://www.asdi.com/learn/faqs/what-is-a-derivative-spectrum
CAMO Software Inc. Bridging the Gap between the State and Measurement of a Chemical System.
Retrieved on August 27, 2017 on the website:
http://www.camo.com/downloads/resources/application_notes/Chemometric%20Analysis%20
for%20Spectroscopy.pdf
Centers for Disease Control and Prevention. E. coli (Escherichia coli) - General Information.
Retrieved on August 5, 2017 on the website: https://www.cdc.gov/ecoli/index.html
Edmund Scientific. The Correct Material for Infrared (IR) Applications. Retrieved on August 10, 2017
on the website: https://www.edmundoptics.com/resources/application-notes/optics/the-correct-
material-for-infrared-applications/
KHANACADEMY. Light: Electromagnetic waves, the electromagnetic spectrum and photons.
Retrieved on August 9, 2017 on the website:
https://www.khanacademy.org/science/physics/light-waves/introduction-to-light-
waves/a/light-and-the-electromagnetic-spectrum
Thermo Scientific. Advantages of a Fourier Transform Infrared Spectrometer. Retrieved on August
15, 2017 on the website: https://tools.thermofisher.com/content/sfs/brochures/TN50674-E-
0215M-FT-IR-Advantages.pdf
Instituto nacional de saúde Dr. Ricardo Jorge. Resistência aos Antimicrobianos. Retrieved on August
26, 2017 on the website:
http://www2.insa.pt/sites/INSA/Portugues/Paginas/AntibioticosResi.aspx