optimism is universal: exploring the - download…download.xuebalib.com/xuebalib.com.53166.pdf ·...
TRANSCRIPT
Optimism Is Universal: Exploring thePresence and Benefits of Optimism ina Representative Sample of the World
Matthew W. Gallagher,1 Shane J. Lopez,2,3 andSarah D. Pressman4
1Center for Anxiety and Related Disorders, Boston University2Gallup/Clifton Strengths Institute3University of Kansas4University of California, Irvine
Abstract
Current theories of optimism suggest that the tendency to maintain positive expectations for the future is an adaptivepsychological resource associated with improved well-being and physical health, but the majority of previous optimism researchhas been conducted in industrialized nations. The present study examined (a) whether optimism is universal, (b) whatdemographic factors predict optimism, and (c) whether optimism is consistently associated with improved subjective well-beingand perceived health worldwide.The present study used representative samples of 142 countries that together represent 95%of the world’s population.The total sample of 150,048 individuals had a mean age of 38.28 (SD = 16.85) and approximately equalsex distribution (51.2% female). The relationships between optimism, subjective well-being, and perceived health wereexamined using hierarchical linear modeling. Results indicated that most individuals and most countries worldwide areoptimistic and that higher levels of optimism are associated with improved subjective well-being and perceived healthworldwide.The present study provides compelling evidence that optimism is a universal phenomenon and that the associationsbetween optimism and improved psychological functioning are not limited to industrialized nations.
The capacity to maintain an optimistic orientation toward thefuture has been proposed to be one of the defining features ofthe human species (Tiger, 1979). The potential benefits ofoptimism have been a popular research topic in psychology,and there is now extensive research examining whether anoptimistic orientation toward the future is adaptive (Carver,Scheier, Miller, & Fulford, 2009; Carver, Scheier, &Segerstrom, 2010). However, the majority of previous opti-mism research has been conducted in industrialized nations.The present study extends this previous work by examining theorigins and benefits of optimism using representative samplesfrom 142 countries that together represent 95% of the world’spopulation. In addition to examining worldwide variations inindividual levels of optimism, we examine whether the asso-ciations between optimism and improved psychological func-tioning are consistent worldwide.
Is Optimism Adaptive?Whether positive thoughts about the future are adaptive is anissue that has been debated for centuries (Peterson, 2000).From classic characters of fiction such as Voltaire’s (1759)Pangloss, to psychiatrists and psychologists such as Freud(1928), who argued that optimism is widespread but illusory,
many have proposed that positive expectations for the futureare damaging delusions. On the contrary, historical figuressuch as Martin Luther, who said that “everything that is donein the world is done by hope,” or 20th-century self-help authorNorman Vincent Peale (1952), who advocated for “the powerof positive thinking,” have argued positive expectations andthoughts about the future are, in fact, adaptive.
Recent theories of optimism within psychology have gen-erally sided with the latter perspective, that positive thoughtsabout the future provide benefits (Taylor & Brown, 1988). Oneof the most widely studied models within psychology fordescribing how and why positive expectancies for the futuremay confer benefits is Scheier and Carver’s (1985) theory ofoptimism. This theory defines optimism as a stable individualdifference that reflects the general perception that future posi-tive outcomes will be common and future negative outcomeswill be rare. This theory differs from related theories such asself-efficacy (Bandura, 1997) and hope (Snyder, 2002) in thatoptimism, as conceptualized by Scheier and Carver (1985),emphasizes globalized positive and negative expectations and
Correspondence concerning this article should be addressed to MatthewW. Gallagher, Center for Anxiety and Related Disorders, Boston University,648 Beacon Street, 6th Floor, Boston, MA 02215. Email: [email protected].
Journal of Personality 81:5, October 2013© 2012 Wiley Periodicals, Inc.DOI: 10.1111/jopy.12026

does not focus on personal agency as the primary determinantof positive outcomes as self-efficacy and hope theory do.However, current theories of optimism are similar to self-efficacy and hope in emphasizing beliefs about future out-comes more so than current or past outcomes.
The dispositional tendency to maintain optimistic expecta-tions for the future is proposed to be associated with awide variety of adaptive outcomes (Carver et al., 2010). Forexample, decades of research and meta-analyses have demon-strated that higher levels of optimism are linked to improvedpsychological health (Andersson, 1996; Carver et al., 2010;Scheier & Carver, 1992). One psychological outcome that hascommonly been examined in relation to optimism is subjectivewell-being, defined as the presence of high levels of positiveemotions and life satisfaction and low levels of negative emo-tions (Diener, Suh, Lucas, & Smith, 1999). Previous researchhas demonstrated that optimism predicts higher levels of sub-jective well-being in college students (Aspinwall & Taylor,1992; Gallagher & Lopez, 2009), as well as middle-aged andolder adults (Isaacowitz, 2005). Multiple prospective studiesalso have been conducted in which optimism predictedimproved subjective well-being across time (Scheier & Carver,1992). The consistent finding throughout the majority of pre-vious research is that individuals who are more optimisticreport improved subjective well-being.
Physical health is another important outcome that is com-monly examined in relation to optimism, as higher levels ofoptimism are believed to promote improved physical health byincreasing the use of more adaptive coping techniques (Carveret al., 2009). Research has shown that optimistic individualsgenerally report higher levels of physical health, and multipleprospective longitudinal studies have demonstrated that opti-mism predicts subsequent health outcomes (Giltay, Geleijnse,Zitman, Hoekstra, & Schouten, 2004; Matthews, Räikkönnen,Sutton-Tyrrell, & Kuller, 2004; Scheier & Carver, 1992;Segerstrom, Taylor, Kemeny, & Fahey, 1998). A recent meta-analytic review of the optimism and physical health literatureindicated that higher levels of optimism are associated with awide range of health outcomes, although the effects werelarger for subjective measures of health than for objectivemeasures of health (Rasmussen, Scheier, & Greenhouse,2009). It therefore appears that higher levels of optimism arealso an important predictor of improved physical health.
Nevertheless, despite the majority of research on optimismsuggesting that optimistic expectations for the future are gen-erally adaptive (Carver et al., 2009; Taylor & Brown, 1988),there remains considerable debate about whether optimism isalways adaptive. Popular publications such as Bright-Sided:How the Relentless Promotion of Positive Thinking HasUndermined America (Ehrenreich, 2009) have argued thatthere may be a considerable downside to overemphasizing thebenefits of optimistic thinking, and there is limited researchdemonstrating both that defensive pessimism may be adaptivein certain circumstances (Norem & Chang, 2002) and thatoptimism may be maladaptive in certain circumstances (Chang
& Sanna, 2003; Segerstrom, 2006). Although studies demon-strating maladaptive consequences appear to be the exception(Carver et al., 2009), they nevertheless indicate that there arelikely some circumstances where optimism may not be adap-tive and that additional research is needed to better understandthe settings in which optimistic expectations for the future areassociated with improved psychological functioning. Giventhat the vast majority of previous research examining the ben-efits of optimism for psychological and physical health hasbeen conducted in wealthy, industrialized nations, it remainsunclear whether optimism is also adaptive in countries wherefuture economic opportunities are severely limited or wherelife expectancies are significantly lower than in Westerncountries.
Is Optimism Universal?Another important, yet unresolved issue is whether optimismis a universal human resource that is present worldwide or thatmerely reflects Western ideals, or the benefit of living in adeveloped, wealthy country. One of the first attempts toexamine the universality of optimism compared trends in opti-mism from 1976 to 1987 in 31 countries using a single ques-tion in which participants were asked whether they expectedthe next year to be better or worse than the current year(Michalos, 1988). In this study, individuals who expected thenext year to be better than the current one were classified asoptimistic, and the results indicated that most individuals andmost countries were not optimistic about the future. In con-trast, a cross-cultural examination of character strengths in 54nations revealed that the rank order of optimistic expectationsamong the 24 character strengths examined was generallyconsistent across the countries examined (Park, Peterson, &Seligman, 2006). More recently, a meta-analysis of levels ofoptimism in more than 89,000 individuals in 22 countriesclassified individuals as optimistic or not based on whetherindividuals scored above the midpoint when using the percentof the maximum score on the Life Orientation Test (Scheier &Carver, 1985) or the Revised Life Orientation Test (Scheier,Carver, & Bridges, 1994). The conclusions from this meta-analysis were that “individuals are on average quite optimistic”(Fischer & Chalmers, 2008, p. 380) and that the populations ofmost countries are optimistic. These conflicting findings makeit difficult to determine whether optimism is, in fact, universal.Additionally, these studies often use convenience samples(e.g., student populations), draw participants from wealthiercountries in North America or Europe, and use varyingmethods of assessing optimism (Fischer & Chalmers, 2008),limiting the generalizability and representativeness of pastfindings.
The effect of cultural and demographic variables on opti-mism levels also remains uncertain due to conflicting findingsin previous research, as well as an overreliance on collegestudent and college-educated samples. For example, a com-parison of levels of optimism between Caucasian and Asian
Gallagher, Lopez, & Pressman430
American students found cultural differences such that AsianAmerican students were more pessimistic than Caucasian stu-dents (Chang, 1996), but other studies have found no effects ofculture on optimism when comparing Indian and Canadianstudents (Sinha, Wilson, & Watson, 2000). Previous studiesexamining the influence of demographic variables on opti-mism have also been limited by a lack of diversity in terms ofrarely sampling individuals from countries with lower grossdomestic product (GDP) per capita or populations with lowerrates of education. These previous studies have generally notused representative samples of countries and cultures, whichprevents us from determining whether these findings can begeneralized.
Thus, the current state of research remains inconclusiveregarding whether optimism is a universal human resource orrather reflects a benefit of living in wealthy, industrializedcountries. The extent to which the benefits of optimism (e.g.,improved subjective well-being and physical health) are uni-versal also remains unclear due to the preponderance of studiesof the benefits of optimism having been conducted in wealthyNorth American or European countries. There is evidence thatGDP per capita of countries may moderate the influence ofpositive and negative emotions on individuals’ physical health(Pressman, Gallagher, & Lopez, in press), but the role ofcountry characteristics in moderating the effects of optimismon physical health or subjective well-being has not beenadequately examined in previous research.
The Present StudyThe goal of the present study was to improve our understand-ing of optimism and its benefits by going beyond past conve-nience sampling techniques, broadening the scope to theentire planet, and using a consistent method of assessingoptimism worldwide. We were specifically interested in (a)examining whether levels of optimism would be consistentworldwide across a diverse range of countries that includesboth wealthy countries and poorer countries in which opti-mism has not previously been studied, (b) considering theeffects that demographic variables (age, gender, education,and household income) have on optimism, (c) determiningwhether optimism is associated with improved subjectivewell-being and perceived physical health in a large and rep-resentative sample of the world, and (d) determining whethercountry characteristics (GDP per capita and life expectancy)moderated the relationships between optimism, physicalhealth, and subjective well-being. Our hypotheses were thatoptimism is a universal human characteristic such that highlevels of optimism would be found consistently across a rangeof extremely diverse countries, that demographic variableswould have minimal effects on levels of optimism, and thatoptimism would be associated with more positive levels ofperceived physical health and each of the three components ofsubjective well-being.
METHOD
Participants and ProcedureParticipants were 150,048 individuals who participated in thefirst wave of the Gallup World Poll. The Gallup World Pollwas initiated in 2005 and annually surveys representativesamples of approximately 1,000 individuals from 142 coun-tries around the world, providing a representative sampleof more than 95% of the world’s population.1 Participantsranged from 15 to 99, with a mean age of 38.28 (SD = 16.85);sex distribution was approximately equal (51.2% female). Thevast majority of participants (89.3%) had a high school edu-cation or less. The median household income was 7,500 inter-national dollars.2
MeasuresCantril’s Self-Anchoring Striving Scale. Expectations forthe future and current evaluations of life satisfaction weremeasured using Cantril’s (1965) Self-Anchoring StrivingScale. This scale asks participants to “Please imagine a ladderwith steps numbered from zero at the bottom to 10 at the top.The top of the ladder represents the best possible life for youand the bottom of the ladder represents the worst possible lifefor you. On which step of the ladder would you say youpersonally feel you stand at this time? On which step do youthink you will stand about five years from now?” For thepresent study, responses to the current ladder item were con-sidered to be an indicator of life satisfaction.
Positive Affect (PA). PA was measured with a series of threeitems that asked whether individuals had experienced specificpositive emotions (laughter, enjoyment, and love) during theprevious day. Participants’ responses were coded as either 0(no) or 1 (yes), and an overall PA score was computed byaveraging the responses to the three items.
Negative Affect (NA). NA was measured with a series of fiveitems that asked whether individuals had experienced specificnegative emotions (worry, sadness, boredom, depression, andanger) during the previous day. Participants’ responses werecoded as either 0 (no) or 1 (yes), and an overall NA score wascomputed by averaging the responses to the five items.
Perceived Physical Health. Perceived physical health wasmeasured with a series of three items that asked participantswhether they were satisfied or dissatisfied with their personalhealth, whether they have any health problems that preventthem from doing any of the things people their age can nor-mally do, and whether they experienced physical pain yester-day. An overall physical health problems score was computedby averaging the responses to the three items. Participants’responses were coded so that higher scores indicated morepositive perceptions of physical health.
Optimism Is Universal 431

Quantifying OptimismFor the present study, we defined optimism in terms of indi-viduals’ expectations for the future, an approach that is con-sistent with current theories of optimism (Carver et al., 2009)that emphasize the expectation of positive future outcomes asthe core aspect of optimism. Responses to the future ladderquestion were therefore used as our primary measure of opti-mism both in terms of examining worldwide variations inoptimism and in analyses examining the relationships betweenoptimism, subjective well-being, and perceived physicalhealth. We primarily used the future ladder question as a con-tinuous indicator of optimism, but also classified individualsbased on whether they were at the midpoint of the scale (5) orabove in order to also present results using a similar method asthe recent meta-analysis of worldwide levels of optimism(Fischer & Chalmers, 2008). Although there are limitations ininterpreting outcomes based on a single item, the future ladderitem provides a face-valid measure of the extent to whichindividuals had positive (i.e., optimistic) or negative (i.e., pes-simistic) expectations for the future.
As a secondary measure of optimism, we also examinedwhether individuals’ expectations for the future were higher,lower, or equal to their current evaluations of life satisfaction.Due to the sequence in which the two ladder items were admin-istered, it is possible that an anchoring bias was introducedsuch that some individuals provided responses to the futureladder question based on an implicit relative comparison totheir response to the current ladder question.3 The differencescore between the future and current ladder items was there-fore included as a secondary measure of optimism to provideadditional information about how individuals’ expectations forthe future indicate that they expect their life to improve relativeto their current life satisfaction. These difference scores werealso used to determine the proportion of individuals withineach country for whom the future ladder rating was higher,lower, or equal to their current ladder rating.
Analytic PlanThe universality of optimism and the relationships betweenoptimism, well-being, and perceived physical health wereexamined using hierarchical linear modeling (HLM;Raudenbush & Bryk, 2002), which is ideally suited for theanalysis of nested data structures such as the Gallup WorldPoll. We began by examining a series of null models in order todetermine the extent to which optimism, the components ofsubjective well-being (PA, NA, and life satisfaction), and per-ceived physical health varied within and between countries.We then used buildup procedures to examine the extentto which demographic variables influenced optimism andwhether optimism had a fixed effect on positive affect, negativeaffect, life satisfaction, and perceived physical health. Finally,we examined whether the relationship between optimism andthe four outcomes varied between countries. HLM analyses
were conducted using the PRELIS program within theLISREL software package (Jöreskog & Sörbom, 2006). Sam-pling weights were used in all models to ensure that thesamples reflected representative populations of each countryexamined. Preliminary HLM analysis indicated that 87.7% ofthe variability in individual levels of optimism was due todifferences between individuals and that 12.3% of the vari-ability in levels of optimism was due to differences betweencountries.
RESULTS
Optimism Around the WorldWe began by examining the extent to which optimistic expec-tations for the future varied around the world. The meanresponse for the future ladder item across all countries was6.70 (median = 7, mode = 8, SD = 2.32). The vast majority(84.0%) of individuals indicated that they expected their futurelife to be at the midpoint of the scale (5) or above. Country-level means for the future ladder and current ladder ratings canbe seen in Table 1. The countries with the five highest meanexpectations for the future were Ireland (M = 8.44), Brazil(M = 8.34), Denmark (M = 8.32), New Zealand (M = 8.31),and the United States (M = 8.18). The countries with the fivelowest mean expectations for the future were Zimbabwe(M = 4.59), Egypt (M = 5.10), Haiti (M = 5.11), Bulgaria(M = 5.13), and Lebanon (M = 5.30). A map of the world con-taining the country-level means of the future ladder responses(sorted into quintiles) of the 142 countries surveyed can beseen in Figure 1. All but one (Zimbabwe) of the 142 countriessurveyed had a mean level above the midpoint on the futureladder scale. These results indicate that the populations of mostcountries have optimistic expectations for the future.
Demographics and OptimismWe next examined the effects of the demographic variables onoptimism. Results indicated that age (B = -.0295, SE = .0014,Z = 20.73, p < .001), gender (B = .1348, SE = .0209, Z = 6.46,p < .001), education (B = .1232, SE = .0336, Z = 3.66,p < .001), and household income (B = .1211, SE = .0070,Z = 17.21, p < .001) all had significant effects on optimism. Acomparison of the Wald Z statistics indicates that age was thestrongest demographic predictor of optimism, with youngerindividuals reporting greater optimism. These results indicatethat young, female, highly educated, and affluent individualsare on average the most optimistic individuals worldwide.Given that this profile mirrors the student and online conve-nience samples often used to study the causes or effects ofoptimism, our results raise concerns about whether suchstudent samples that tend to have high levels of optimism arerepresentative, and consequently, whether results from suchsamples are generalizable. It should be noted, however, that the
Gallagher, Lopez, & Pressman432
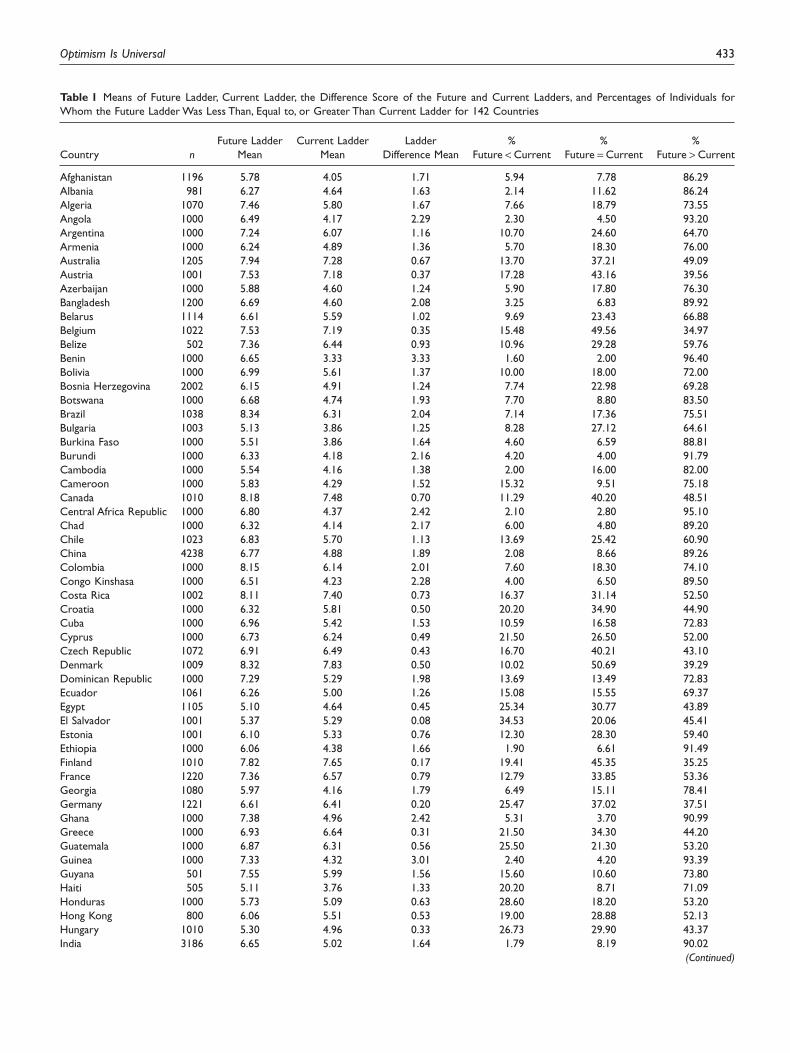
Table 1 Means of Future Ladder, Current Ladder, the Difference Score of the Future and Current Ladders, and Percentages of Individuals forWhom the Future Ladder Was Less Than, Equal to, or Greater Than Current Ladder for 142 Countries
Country nFuture Ladder
MeanCurrent Ladder
MeanLadder
Difference Mean%
Future < Current%
Future = Current%
Future > Current
Afghanistan 1196 5.78 4.05 1.71 5.94 7.78 86.29Albania 981 6.27 4.64 1.63 2.14 11.62 86.24Algeria 1070 7.46 5.80 1.67 7.66 18.79 73.55Angola 1000 6.49 4.17 2.29 2.30 4.50 93.20Argentina 1000 7.24 6.07 1.16 10.70 24.60 64.70Armenia 1000 6.24 4.89 1.36 5.70 18.30 76.00Australia 1205 7.94 7.28 0.67 13.70 37.21 49.09Austria 1001 7.53 7.18 0.37 17.28 43.16 39.56Azerbaijan 1000 5.88 4.60 1.24 5.90 17.80 76.30Bangladesh 1200 6.69 4.60 2.08 3.25 6.83 89.92Belarus 1114 6.61 5.59 1.02 9.69 23.43 66.88Belgium 1022 7.53 7.19 0.35 15.48 49.56 34.97Belize 502 7.36 6.44 0.93 10.96 29.28 59.76Benin 1000 6.65 3.33 3.33 1.60 2.00 96.40Bolivia 1000 6.99 5.61 1.37 10.00 18.00 72.00Bosnia Herzegovina 2002 6.15 4.91 1.24 7.74 22.98 69.28Botswana 1000 6.68 4.74 1.93 7.70 8.80 83.50Brazil 1038 8.34 6.31 2.04 7.14 17.36 75.51Bulgaria 1003 5.13 3.86 1.25 8.28 27.12 64.61Burkina Faso 1000 5.51 3.86 1.64 4.60 6.59 88.81Burundi 1000 6.33 4.18 2.16 4.20 4.00 91.79Cambodia 1000 5.54 4.16 1.38 2.00 16.00 82.00Cameroon 1000 5.83 4.29 1.52 15.32 9.51 75.18Canada 1010 8.18 7.48 0.70 11.29 40.20 48.51Central Africa Republic 1000 6.80 4.37 2.42 2.10 2.80 95.10Chad 1000 6.32 4.14 2.17 6.00 4.80 89.20Chile 1023 6.83 5.70 1.13 13.69 25.42 60.90China 4238 6.77 4.88 1.89 2.08 8.66 89.26Colombia 1000 8.15 6.14 2.01 7.60 18.30 74.10Congo Kinshasa 1000 6.51 4.23 2.28 4.00 6.50 89.50Costa Rica 1002 8.11 7.40 0.73 16.37 31.14 52.50Croatia 1000 6.32 5.81 0.50 20.20 34.90 44.90Cuba 1000 6.96 5.42 1.53 10.59 16.58 72.83Cyprus 1000 6.73 6.24 0.49 21.50 26.50 52.00Czech Republic 1072 6.91 6.49 0.43 16.70 40.21 43.10Denmark 1009 8.32 7.83 0.50 10.02 50.69 39.29Dominican Republic 1000 7.29 5.29 1.98 13.69 13.49 72.83Ecuador 1061 6.26 5.00 1.26 15.08 15.55 69.37Egypt 1105 5.10 4.64 0.45 25.34 30.77 43.89El Salvador 1001 5.37 5.29 0.08 34.53 20.06 45.41Estonia 1001 6.10 5.33 0.76 12.30 28.30 59.40Ethiopia 1000 6.06 4.38 1.66 1.90 6.61 91.49Finland 1010 7.82 7.65 0.17 19.41 45.35 35.25France 1220 7.36 6.57 0.79 12.79 33.85 53.36Georgia 1080 5.97 4.16 1.79 6.49 15.11 78.41Germany 1221 6.61 6.41 0.20 25.47 37.02 37.51Ghana 1000 7.38 4.96 2.42 5.31 3.70 90.99Greece 1000 6.93 6.64 0.31 21.50 34.30 44.20Guatemala 1000 6.87 6.31 0.56 25.50 21.30 53.20Guinea 1000 7.33 4.32 3.01 2.40 4.20 93.39Guyana 501 7.55 5.99 1.56 15.60 10.60 73.80Haiti 505 5.11 3.76 1.33 20.20 8.71 71.09Honduras 1000 5.73 5.09 0.63 28.60 18.20 53.20Hong Kong 800 6.06 5.51 0.53 19.00 28.88 52.13Hungary 1010 5.30 4.96 0.33 26.73 29.90 43.37India 3186 6.65 5.02 1.64 1.79 8.19 90.02
(Continued)
Optimism Is Universal 433
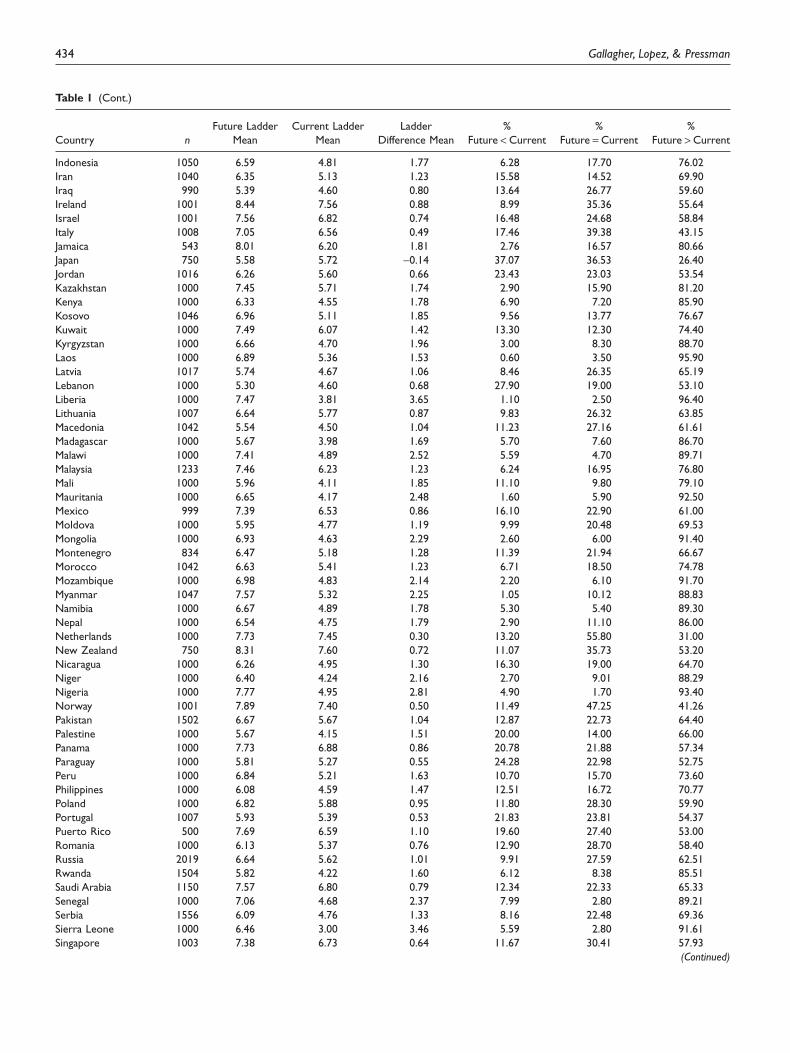
Table 1 (Cont.)
Country nFuture Ladder
MeanCurrent Ladder
MeanLadder
Difference Mean%
Future < Current%
Future = Current%
Future > Current
Indonesia 1050 6.59 4.81 1.77 6.28 17.70 76.02Iran 1040 6.35 5.13 1.23 15.58 14.52 69.90Iraq 990 5.39 4.60 0.80 13.64 26.77 59.60Ireland 1001 8.44 7.56 0.88 8.99 35.36 55.64Israel 1001 7.56 6.82 0.74 16.48 24.68 58.84Italy 1008 7.05 6.56 0.49 17.46 39.38 43.15Jamaica 543 8.01 6.20 1.81 2.76 16.57 80.66Japan 750 5.58 5.72 -0.14 37.07 36.53 26.40Jordan 1016 6.26 5.60 0.66 23.43 23.03 53.54Kazakhstan 1000 7.45 5.71 1.74 2.90 15.90 81.20Kenya 1000 6.33 4.55 1.78 6.90 7.20 85.90Kosovo 1046 6.96 5.11 1.85 9.56 13.77 76.67Kuwait 1000 7.49 6.07 1.42 13.30 12.30 74.40Kyrgyzstan 1000 6.66 4.70 1.96 3.00 8.30 88.70Laos 1000 6.89 5.36 1.53 0.60 3.50 95.90Latvia 1017 5.74 4.67 1.06 8.46 26.35 65.19Lebanon 1000 5.30 4.60 0.68 27.90 19.00 53.10Liberia 1000 7.47 3.81 3.65 1.10 2.50 96.40Lithuania 1007 6.64 5.77 0.87 9.83 26.32 63.85Macedonia 1042 5.54 4.50 1.04 11.23 27.16 61.61Madagascar 1000 5.67 3.98 1.69 5.70 7.60 86.70Malawi 1000 7.41 4.89 2.52 5.59 4.70 89.71Malaysia 1233 7.46 6.23 1.23 6.24 16.95 76.80Mali 1000 5.96 4.11 1.85 11.10 9.80 79.10Mauritania 1000 6.65 4.17 2.48 1.60 5.90 92.50Mexico 999 7.39 6.53 0.86 16.10 22.90 61.00Moldova 1000 5.95 4.77 1.19 9.99 20.48 69.53Mongolia 1000 6.93 4.63 2.29 2.60 6.00 91.40Montenegro 834 6.47 5.18 1.28 11.39 21.94 66.67Morocco 1042 6.63 5.41 1.23 6.71 18.50 74.78Mozambique 1000 6.98 4.83 2.14 2.20 6.10 91.70Myanmar 1047 7.57 5.32 2.25 1.05 10.12 88.83Namibia 1000 6.67 4.89 1.78 5.30 5.40 89.30Nepal 1000 6.54 4.75 1.79 2.90 11.10 86.00Netherlands 1000 7.73 7.45 0.30 13.20 55.80 31.00New Zealand 750 8.31 7.60 0.72 11.07 35.73 53.20Nicaragua 1000 6.26 4.95 1.30 16.30 19.00 64.70Niger 1000 6.40 4.24 2.16 2.70 9.01 88.29Nigeria 1000 7.77 4.95 2.81 4.90 1.70 93.40Norway 1001 7.89 7.40 0.50 11.49 47.25 41.26Pakistan 1502 6.67 5.67 1.04 12.87 22.73 64.40Palestine 1000 5.67 4.15 1.51 20.00 14.00 66.00Panama 1000 7.73 6.88 0.86 20.78 21.88 57.34Paraguay 1000 5.81 5.27 0.55 24.28 22.98 52.75Peru 1000 6.84 5.21 1.63 10.70 15.70 73.60Philippines 1000 6.08 4.59 1.47 12.51 16.72 70.77Poland 1000 6.82 5.88 0.95 11.80 28.30 59.90Portugal 1007 5.93 5.39 0.53 21.83 23.81 54.37Puerto Rico 500 7.69 6.59 1.10 19.60 27.40 53.00Romania 1000 6.13 5.37 0.76 12.90 28.70 58.40Russia 2019 6.64 5.62 1.01 9.91 27.59 62.51Rwanda 1504 5.82 4.22 1.60 6.12 8.38 85.51Saudi Arabia 1150 7.57 6.80 0.79 12.34 22.33 65.33Senegal 1000 7.06 4.68 2.37 7.99 2.80 89.21Serbia 1556 6.09 4.76 1.33 8.16 22.48 69.36Sierra Leone 1000 6.46 3.00 3.46 5.59 2.80 91.61Singapore 1003 7.38 6.73 0.64 11.67 30.41 57.93
(Continued)
Gallagher, Lopez, & Pressman434

effects of these demographic variables are modest. Together,the demographic variables accounted for 11.47% of the vari-ance in individual levels of optimism.
Optimism and Subjective Well-BeingThe associations between optimism, PA, NA, and life satisfac-tion (i.e., current ladder) were examined next. We began byexamining the associations between optimism as measuredby the future ladder and the three components of subjectivewell-being at the individual (n = 150,048) and country level(n = 142). At the country level, there were moderate to largeassociations between optimism and positive affect (r = .49),negative affect (r = -.36), and life satisfaction (r = .74). At theindividual level, the associations between optimism and posi-tive affect (r = .23), negative affect (r = -.18), and life satis-faction (r = .64) were smaller in magnitude.
We then examined the associations between optimism andthe components of subjective well-being using HLM. Ninemodels were specified, three for each outcome. One modelexamined the fixed effect of optimism on the outcome. Asecond model examined the fixed effect of optimism while
including the demographic characteristics as covariates. Thethird model for each outcome examined whether the effect ofoptimism on the outcome varied between countries while con-trolling for the individual-level demographic covariates. Theresults of each of these three models for the three outcomes canbe seen in Table 2. Effect sizes (ESr) are presented for therandom effect of optimism on each of the outcomes.4
The results indicated that optimism had a statistically sig-nificant association with PA, NA, and life satisfaction. Anexamination of the residual Level 1 variances indicated thatoptimism had the strongest relationship with life satisfactionand a more robust association with PA than with NA. Ourfindings suggest that optimism may have a greater influence onthe positive aspects of subjective well-being. However, themagnitude of the association between optimism and life satis-faction is likely inflated by the similarities in the two ladderquestions used to measure these constructs.
The associations between optimism and the components ofsubjective well-being declined but remained statistically sig-nificant after including all of the demographic covariates.These results suggest that although demographic variablesare important predictors of levels of optimism as previously
Table 1 (Cont.)
Country nFuture Ladder
MeanCurrent Ladder
MeanLadder
Difference Mean%
Future < Current%
Future = Current%
Future > Current
Slovakia 1018 5.86 5.26 0.59 17.47 29.24 53.29Slovenia 1009 6.20 5.81 0.38 24.48 30.53 45.00South Africa 1000 6.84 5.21 1.63 3.00 9.20 87.80South Korea 1000 6.69 5.77 0.92 15.60 25.30 59.10Spain 1009 7.60 7.25 0.40 16.55 37.76 45.69Sri Lanka 1000 6.36 4.43 1.92 4.30 11.00 84.70Sudan 1000 6.94 4.65 2.29 1.60 6.90 91.50Sweden 1000 7.95 7.51 0.45 14.00 42.90 43.10Switzerland 1000 7.78 7.47 0.31 17.40 47.30 35.30Taiwan 1002 6.40 6.17 0.21 24.95 33.63 41.42Tajikistan 1000 6.22 4.43 1.78 2.20 6.90 90.90Tanzania 1000 5.76 4.32 1.43 7.40 14.80 77.80Thailand 1006 7.02 5.78 1.24 10.83 21.87 67.30Togo 1000 6.37 3.20 3.17 2.10 3.10 94.80Trinidad and Tobago 508 7.40 5.83 1.56 14.57 16.93 68.50Tunisia 912 6.82 5.36 1.46 4.28 17.54 78.18Turkey 1001 6.33 5.62 0.71 16.08 29.77 54.15Uganda 1000 6.07 4.46 1.61 5.40 8.60 86.00Ukraine 1074 5.86 5.17 0.69 18.25 27.19 54.56United Arab Emirates 1013 7.91 6.73 1.19 14.02 15.30 70.68United Kingdom 1204 7.69 6.80 0.89 10.38 35.80 53.82United States 1225 8.18 7.51 0.67 12.73 36.41 50.86Uruguay 1004 6.68 5.69 1.00 11.85 26.49 61.65Uzbekistan 1000 7.17 5.23 1.93 3.80 13.70 82.50Venezuela 1000 8.17 6.52 1.64 11.20 16.60 72.20Vietnam 1016 6.66 5.46 1.21 1.87 18.60 79.53Yemen 1000 5.76 4.48 1.26 19.68 10.99 69.33Zambia 1000 5.76 4.00 1.76 12.00 8.70 79.30Zimbabwe 1000 4.59 3.17 1.42 31.60 8.50 59.90
Worldwide 150048 6.70 5.37 1.34 10.91 19.64 69.45
Optimism Is Universal 435

demonstrated, the associations between optimism and thecomponents of subjective well-being reflect more than justdemographic influences. Finally, the test of random effectsexamined whether the relationships between optimism andthe components of well-being varied between countries. Theresults indicated that there was a random effect of optimism onNA and life satisfaction but not on PA. This indicates that therelationship between optimism and PA is consistent across theworld such that more individuals with higher levels of opti-mism also report experiencing greater PA. The finding ofrandom effects in the NA and life satisfaction models indicatesthat the relationship between optimism and these componentsof well-being varies between countries. Worldwide, higher
levels of optimism were associated with lower levels of NAand greater life satisfaction, but the strength of these associa-tions varied between countries.
Optimism and Perceived Physical HealthWe next examined whether optimism is associated withimproved perceptions of physical health worldwide. As withthe examination of the associations between optimism and thecomponents of subjective well-being, we used buildup modelprocedures to examine the fixed effect of optimism on physicalhealth, the fixed effect of optimism while including demo-graphic covariates, and the random effect of optimism. The
Least Optimistic
Less Optimistic
Average
More Optimistic
Most Optimistic
Not Surveyed
Figure 1 Mean levels of future expectations in 142 countries organized into quintiles.
Table 2 Effects of Optimistic Future Expectancies on Subjective Well-Being and Perceived Physical Health in HLM Analyses
Outcome
Fixed EffectFixed Effect Random Effect
With Covariates With Covariates
B SE B SE B SE t SE ESr
Positive affect .0304 .0012 .0231 .0011 .0231 .0011 .0000 .0002 .132Negative affect -.0211 .0008 -.0179 .0008 -.0170 .0008 .0007 .0001 -.123Life satisfaction .5393 .0101 .5024 .0105 .5219 .0106 .1252 .0061 .553Perceived health .0317 .0013 .0188 .0009 .0181 .0009 .0002 .0001 .124
Note. HLM = hierarchical linear modeling. p < .0001 for all effects greater than .0001.
Gallagher, Lopez, & Pressman436

results of these analyses can be seen in Table 2. Results indi-cated a statistically significant association between optimismand perceived physical health, and that this association variedbetween countries. The magnitude and direction of the asso-ciation between optimism and physical health are consistentwith previous meta-analyses (Rasmussen et al., 2009), whichsuggests that there is a small but positive association betweenhigher levels of optimism and improved perceptions of physi-cal health.
Examining Country Characteristics asPotential ModeratorsAfter determining that the effect of optimism on negativeaffect, life satisfaction, and perceived health varied betweencountries, we conducted a series of additional analyses todetermine whether certain country-level characteristics mighthelp to explain the extent to which the effects of optimism onNA and life satisfaction varied between countries. Specifically,the wealth of countries (as measured by GDP per capita) andlife expectancy rates were considered as two potential factorsthat may influence the effects of optimism on the perceivedhealth and well-being outcomes. Estimates of GDP per capitaand life expectancy rates for each country were obtained fromthe United Nations Human Development Indices. The moder-ating effects of GDP and life expectancy were tested usingHLM analyses in which cross-level interactions were specifiedto determine whether the effects of optimism on NA, lifesatisfaction, and perceived health varied as a function of acountry’s wealth or life expectancy. There was no evidencethat GDP or life expectancy moderated the effects of optimismon NA, life satisfaction, or perceived health. It thereforeappears that a country’s wealth and average life expectancy arenot the key factors in explaining the degree to which an opti-mistic orientation is associated with the experience of negativeemotions, reported life satisfaction, or perceived physicalhealth.
Contrasting Future Expectations with CurrentLife EvaluationsWe next examined worldwide variations in optimism by com-paring expectations for the future with current ratings of life
satisfaction. The difference score between the future andcurrent ladder items was calculated for each individual as asecondary measure of optimism that reflects the extent towhich individuals expected their future life satisfaction to begreater than, equal to, or less than their current life satisfactionas measured by the current ladder item. These differencescores could therefore range from -10 to 10, with 0 indicatingthat individuals expect their future life to be of a similar qualityto their present life. Country-level means for the differencescore and the proportions of individuals for whom futureexpectations were higher than, lower than, or equal to theircurrent ratings within each country are also presented inTable 1. Individually, the average difference score betweenthe future and current ladder ratings was 1.34 (SD = 1.90;median = 1.0; mode = 1.0). Worldwide, 10.91% of individualsexpected their life in 5 years to be worse than their current life,19.64% expected their life in 5 years to be as good as theircurrent life, and 69.45% expected their life in 5 years to bebetter than their current life. In 120 of the 142 countries sur-veyed, over 50% of the population expected their life in 5 yearsto be greater than their current life. All but one (Japan) of the142 countries reported a higher average expectation for thefuture than current rating of life satisfaction. Together, theseresults demonstrate that most individuals and most countriesworldwide are optimistic when considering relative differencesbetween expectations for the future and current ratings of lifesatisfaction.
Our final analyses were a series of HLM in which thedifference score measure of optimism was examined as a pre-dictor of PA, NA, and perceived health. These analyses wereconducted using the same buildup procedures as the HLManalyses, focusing on the future ladder as the predictor ofoutcomes. The results of these HLM analyses are presented inTable 3. Results in the random effects models that includedemographic covariates indicated that optimism as defined bythe difference between future expectations and current lifesatisfaction was a significant predictor of positive affect(B = .0057, SE = .0011, p < .0001) and perceived health(B = .0043, SE = .0009, p < .0001), but not of negative affect.These results are consistent with the HLM analyses focusingon the future ladder as the indicator of optimism in indicatingthat optimism, as defined by the difference between futureexpectations and current life satisfaction, is more associated
Table 3 Effects of Optimism as Measured by the Difference Score of the Future and Current Ladders on Positive Affect, Negative Affect, andPerceived Physical Health in HLM Analyses
Outcome
Fixed EffectFixed Effect Random Effect
With Covariates With Covariates
B SE B SE B SE t SE ESr
Positive affect .0070 .0011 .0062 .0011 .0057 .0011 .0004 .0001 .029Negative affect -.0001 .0010 -.0008 .0010 -.0004 .0010 .0011 .0001 .002Perceived health .0120 .0012 .0058 .0010 .0043 .0009 .0011 .0001 .024
Note. HLM = hierarchical linear modeling. p < .0001 for all effects greater than .001.
Optimism Is Universal 437

with perceived health and positive aspects of subjective well-being than negative aspects of subjective well-being.
DISCUSSIONPrevious studies have examined the universality of optimism(e.g., Fischer & Chalmers, 2008; Michalos, 1988; Park et al.,2006), but the present study is the first to use representativesamples of people in 142 countries representing 95% of theworld’s population, which allows for more definitive conclu-sions. Our results indicate that individuals of all ages, races,education levels, and socioeconomic strata across the worldare generally optimistic and that the populations of most coun-tries are optimistic. The findings that most individuals andcountries are optimistic are maintained both when looking atexpectations for the future and when comparing expectationsfor the future with current evaluations of life satisfaction.
As predicted, the effects of country of origin and demo-graphic variables on optimism are relatively small (with age asthe strongest predictor). Taken together, our results suggestthat the most optimistic people in the world may be young,economically secure, educated women in Ireland, Brazil,Denmark, New Zealand, and the United States. Conversely, themost pessimistic people in the world may be old, poor, unedu-cated men in Zimbabwe.
Results were generally consistent both when consideringthe future ladder as an indicator of optimism and when con-sidering the difference between the future and current ladderitems. Across both methods, the majority of both individualsand countries appeared to be optimistic. All but one of the 142countries surveyed had a higher average future ladder ratingthan their current ladder rating. These results suggest that mostindividuals and countries worldwide not only have positiveexpectations for the future, but they also expect their life toimprove in the future.
The relationship between well-being and optimism is clear,with the strongest links between optimism and PA and lifesatisfaction (with the optimism-NA link being weakest). Thispattern of results was consistent both when using the futureladder as an indicator of optimism and when using the differ-ence score between the future and current ladder items as anindicator of optimism. The association between optimism andPA is consistent around the world, whereas the magnitude ofthe associations between optimism and NA and life satisfac-tion vary globally. Our findings also provide evidence that theassociation between higher levels of optimism and improvedperceived health may be universal as well. Consistent with pastresearch (Rasmussen et al., 2009), we found a small, positiveassociation between higher levels of optimism and perceivedhealth. Together, these findings suggest that optimistic expec-tations for the future are generally associated with improvedfunctioning worldwide. Although our findings suggest that therelationship between optimism, NA, life satisfaction, and per-ceived health varied worldwide, we did not find any evidence
that GDP or life expectancy was a significant moderator ofthe associations between optimism and the outcomes weexamined.
LIMITATIONS AND FUTUREDIRECTIONSThe representativeness of our data and the rigor of analyses arestrengths of our study. The primary limit to generalizabilitystems from the measures used in our study. Conceptually, thefuture ladder is closely aligned with theoretical models ofoptimism and the most popular measure of optimism (LifeOrientation Test-Revised; Scheier et al., 1994), which wasused in the most recent analysis of worldwide optimism(Fischer & Chalmers, 2008), yet it does rely on responses toonly one item, which has numerous psychometric implica-tions. The sequence in which individuals completed the currentand future ladder items also raises the possibility of an anchor-ing bias such that some individuals may have been referencingtheir response to the current ladder question when respondingto the future ladder question. We included additional analysesfocusing on the difference score between the current and futureladder ratings as well as the categorical classification of indi-viduals based on these difference scores, but both approachesare still limited by the nature of the measurement. The magni-tude of the association between optimism and life satisfactionis also likely inflated due to the methodological similarities ofthe two ladder questions. It is also possible that the differentsurvey methods (e.g., telephone vs. face-to-face) used indifferent countries and the different cultural tendencies foracquiescence may have influenced responses due to demandcharacteristics or otherwise biased the results. An additionallimitation is the cross-sectional nature of the data, which limitsour ability to demonstrate that optimism causes higher levelsof well-being and does not merely reflect improved well-being.
One of the most interesting aspects of our findings was that,although the association between optimism and PA was con-sistent worldwide, the association between optimism and NA,life satisfaction, and perceived health all significantly variedbetween countries. We examined two country characteristicsthat could potentially explain why these associations are mod-erated by country, but we did not find any evidence that GDPor life expectancy was a significant moderator of the associa-tions between optimism and the outcomes we examined. Ourability to identify the country characteristics that moderate therelationship between optimism and the outcomes we examinedwas likely limited by measurement issues. Previous researchhas demonstrated that the influence of certain individual pre-dictors of subjective well-being is moderated by cultural char-acteristics (Diener & Diener, 2009), so it will be important forfuture research to continue to explore the cultural and countrycharacteristics that may influence the degree to which opti-mism relates to improved psychological functioning, includ-ing whether the associations between individual levels of
Gallagher, Lopez, & Pressman438

optimism and well-being may be moderated by country levelsof optimism or well-being.
CONCLUSIONSThe present study provides compelling evidence that optimismis a universal phenomenon, that optimism is associated withimproved perceptions of physical health worldwide, and thatoptimism is associated with improved subjective well-beingworldwide. Our results therefore suggest that optimism is notmerely a benefit of living in industrialized nations, but reflectsa universal characteristic that is associated with and potentiallymay serve to promote improved psychological functioningworldwide. The extent to which public policy affects indi-vidual and country optimism and, in turn, promotes well-being, is a necessary topic for future study.
Notes
1. The Gallup World Poll has been expanded in subsequent years andnow assesses individuals in more than 150 countries that togetherrepresent 98% of the world’s population. More information aboutthe survey and sampling procedures used for the World Poll canbe obtained at http://www.gallup.com/consulting/worldpoll/24046/About.aspx.2. International dollars are a theoretical currency commonly used ineconomic studies. International dollars are calculated based on anindividual country’s purchasing power parity exchange rates such thatone international dollar has the equivalent purchasing power of oneU.S. dollar at the time of calculation.3. We thank an anonymous reviewer for highlighting this importantpoint.4. The effect sizes reported in Table 2 for the HLM analyses are
calculated using the following formula: ESt
df tr =
+
2
2, where the t
values are obtained using the Z-values from the HLM results.
References
Andersson, G. (1996). The benefits of optimism: A meta-analyticreview of the Life Orientation Test. Personality and IndividualDifferences, 21, 719–725.
Aspinwall, L. G., & Taylor, S. E. (1992). Modeling cognitive adap-tation: A longitudinal investigation of the impact of individualdifferences and coping on college adjustment and performance.Journal of Personality and Social Psychology, 63, 989–1003.
Bandura, A. (1997). Self-efficacy: The exercise of control. New York:Freeman.
Cantril, H. (1965). The pattern of human concern. New Brunswick,NJ: Rutgers University Press.
Carver, C. S., Scheier, M. F., Miller, C., & Fulford, D. (2009). Opti-mism. In S. J. Lopez & C. R. Snyder (Eds.), Handbook of positivepsychology (2nd ed, pp. 303–311). New York: Oxford UniversityPress.
Carver, C. S., Scheier, M. F., & Segerstrom, S. C. (2010). Optimism.Clinical Psychology Review, 30, 879–889.
Chang, E. C. (1996). Cultural differences in optimism, pessimism,and coping: Predictors of subsequent adjustment in Asian Ameri-can and Caucasian American college students. Journal of Coun-seling Psychology, 43, 113–123.
Chang, E. C., & Sanna, L. J. (2003). Optimism, accumulated lifestress, and psychological and physical adjustment: Is it alwaysadaptive to expect the best? Journal of Social and Clinical Psy-chology, 22, 97–116.
Diener, E., & Diener, M. (2009). Cross-cultural correlates of lifesatisfaction and self-esteem. Social Indicators Research Series,38, 71–91.
Diener, E., Suh, M., Lucas, E., & Smith, H. (1999). Subjective well-being: Three decades of progress. Psychological Bulletin, 125,276–302.
Ehrenreich, B. (2009). Bright-sided: How the relentless promotion ofpositive thinking has undermined America. New York: Metropoli-tan Books.
Fischer, R., & Chalmers, A. (2008). Is optimism universal? A meta-analytic investigation of optimism levels across 22 nations.Personality and Individual Differences, 45, 378–382.
Freud, S. (1928). The future of an illusion. London: Hogarth.Gallagher, M. W., & Lopez, S. J. (2009). Positive expectancies and
mental health: Identifying the unique effects of hope and opti-mism. Journal of Positive Psychology, 4, 548–556.
Giltay, E. J., Geleijnse, J. M., Zitman, F. G., Hoekstra, T., & Schouten,E. G. (2004). Dispositional optimism and all-cause and cardiovas-cular mortality in a prospective cohort of elderly Dutch men andwomen. Archives of General Psychiatry, 61, 1126–1135.
Isaacowitz, D. M. (2005). Correlates of well-being in adulthood andold age: A tale of two optimisms. Journal of Research in Person-ality, 39, 224–244.
Jöreskog, K. G., & Sörbom, D. (2006). LISREL 8.80 for Windows[Computer software]. Lincolnwood, IL: Scientific SoftwareInternational.
Matthews, K. A., Räikkönnen, K., Sutton-Tyrrell, K., & Kuller, L. H.(2004). Optimistic attitudes protect against progression of carotidatherosclerosis in healthy middle-aged women. PsychosomaticMedicine, 66, 640–644.
Michalos, A. (1988). Optimism in thirty countries over a decade.Social Indicators Research, 20, 177–180.
Norem, J. K., & Chang, E. C. (2002). The positive psychology ofnegative thinking. Journal of Clinical Psychology, 58, 993–1001.
Park, N., Peterson, C., & Seligman, M. E. P. (2006). Characterstrengths in fifty-four nations and the fifty US states. Journal ofPositive Psychology, 1, 118–129.
Peale, N. V. (1952). The power of positive thinking. New York:Prentice-Hall.
Peterson, C. (2000). The future of optimism. American Psychologist,55, 44–55.
Pressman, S. D., Gallagher, M. W., & Lopez, S. J. (in press). Consid-ering the role of emotions for global health. PsychologicalScience.
Optimism Is Universal 439

Rasmussen, H. N., Scheier, M. F., & Greenhouse, J. B. (2009). Opti-mism and physical health: A meta-analytic review. Annals ofBehavioral Medicine, 37, 239–256.
Raudenbush, S. W., & Bryk, A. S. (2002). Hierarchical linear models(2nd ed.). Thousand Oaks: Sage.
Scheier, M. F., & Carver, C. S. (1985). Optimism, coping, and health:Assessment and implications of generalized outcome expectan-cies. Health Psychology, 4, 219–247.
Scheier, M. F., & Carver, C. S. (1992). Effects of optimism onpsychological and physical well-being: Theoretical overview andempirical update. Cognitive Therapy and Research, 16, 201–228.
Scheier, M. F., Carver, C. S., & Bridges, M. W. (1994). Distinguishingoptimism from neuroticism (and trait anxiety, self-mastery, andself-esteem): A re-evaluation of the Life Orientation Test. Journalof Personality and Social Psychology, 67, 1063–1078.
Segerstrom, S. C. (2006). How does optimism suppress immunity?Evaluation of three affective pathways. Health Psychology, 25,653–657.
Segerstrom, S. C., Taylor, S. E., Kemeny, M. E., & Fahey, J. L.(1998). Optimism is associated with mood, coping, and immunechange in response to stress. Journal of Personality and SocialPsychology, 74, 1646–1655.
Sinha, B., Wilson, L., & Watson, D. (2000). Stress and coping amongstudents in India and Canada. Canadian Journal of BehaviouralScience, 32, 218–225.
Snyder, C. R. (2002). Hope theory: Rainbows in the mind. Psycho-logical Inquiry, 13, 249–275.
Taylor, S. E., & Brown, J. D. (1988). Illusion and well-being: A socialpsychological perspective on mental health. Psychological Bulle-tin, 103, 193–210.
Tiger, L. (1979). Optimism: The biology of hope. New York: Simon &Schuster.
Voltaire, F. (1759). Candide, ou l’optimisme. Geneva, Switzerland:Cramer.
Gallagher, Lopez, & Pressman440

本文献由“学霸图书馆-文献云下载”收集自网络,仅供学习交流使用。
学霸图书馆(www.xuebalib.com)是一个“整合众多图书馆数据库资源,
提供一站式文献检索和下载服务”的24 小时在线不限IP
图书馆。
图书馆致力于便利、促进学习与科研,提供最强文献下载服务。
图书馆导航:
图书馆首页 文献云下载 图书馆入口 外文数据库大全 疑难文献辅助工具