optimisation of maintenance strategies for offshore wind farms · optimisation of maintenance...
TRANSCRIPT
Optimisation of maintenance strategies for offshore wind farms
A case study performed with the OMCE-Calculator
R.P. van de Pieterman
H. Braam
T.S. Obdam
L.W.M.M. Rademakers
T.J.J. van der Zee
Presented at: The Offshore 2011 conference, 29 November – 1 December 2011, Amsterdam, The Netherlands
December 2011 ECN-M--11-103

3/12
Optimisation of maintenance strategies for offshore wind farms A case study performed with the OMCE-Calculator
R.P. van de Pieterman, H. Braam, T.S. Obdam, L.W.M.M. Rademakers, T.J.J. van der Zee
Energy Research Centre of the Netherlands (ECN) Wind Energy, P.O. Box 1, 1755 ZG Petten
Tel. (+31) 224 56 4616, Fax. (+31) 224 56 8214 [email protected]
Summary
The operation and maintenance (O&M) costs of offshore wind farms contribute significantly to the energy generation costs. ECN is developing the Operation and Maintenance Cost Estimator (OMCE) by which owners and operators of offshore wind farms are able to better estimate and control the future O&M costs for the next coming 1 to 5 years. The OMCE Building Blocks and the OMCE-Calculator are the two major modules in this approach. The OMCE-Calculator is the tool to calculate the O&M aspects in terms of downtime, costs, revenue losses etc. It is a time-domain simulation program which has been developed in MATLAB.
A case study is defined with the goal to investigate the tool‟s potential for optimisation of the maintenance strategy for an entire wind farm. For this purpose, a baseline O&M scenario is set up for a hypothetical wind farm with 130 4MW direct-drive wind turbines located 120 km off the coast of the Netherlands. The baseline O&M scenario includes using a mother vessel from which workboats with technicians are launched to perform maintenance. Simulations performed with the baseline O&M scenario result that equipment costs and revenue losses form a large part of the average total O&M costs. Optimisation with the objective to reduce the total O&M costs is performed for two cases. The study shows that having 4 workboats available can lead to a reduction of 1.4% in total O&M costs. The study also shows that significant O&M cost savings can be obtained by applying condition based maintenance.
Keywords: Operation and Maintenance, Offshore Wind Energy, Cost Estimation, OMCE
1 Introduction to OMCE and study goal
1.1 Research Background
Several European countries have defined targets to install and to operate offshore wind energy. According to these targets more than 40 GW offshore wind power is expected for the year 2020. With an average turbine size of about 5 - 10 MW, four to eight thousand wind turbines should be transported, installed, operated and maintained. When not only the European plans are considered, but all international developments as well, these numbers are much higher. So worldwide the required effort for operation and maintenance (O&M) of offshore wind farms will be enormous, and control and optimisation of O&M during the lifetime of these offshore wind turbines is essential for an economical exploitation. At the moment O&M costs of offshore wind farms contribute substantially (2 to 4 €ct/kWh) to the life cycle costs, so it may be profitable to check whether the O&M costs can be reduced so that the total life cycle costs can be reduced [1], [2].
1.2 Operation and Maintenance Cost Estimator (OMCE)

4/12
With respect to O&M during operation of a wind farm it is important (1) to monitor the actual O&M effort, and (2) to control and to optimise future O&M costs. To support the process ECN started the development of the Operation and Maintenance Cost Estimator [3], [4]. The OMCE is designed to determine the O&M effort and associated costs for the coming period (say the next 1, 2 or 5 years) taking into account the operational experience available at that moment. That‟s why two major modules can be distinguished in the overall structure of the OMCE as depicted in Figure 1-1:
1. The OMCE Building Blocks
To process operational data, four so called OMCE Building Blocks (BB) have been specified. The main objective of these building blocks is to process available data in such a way that information is obtained, which on the one hand can be used for monitoring purposes and which on the other hand can be used to specify input for the OMCE-Calculator.
2. The OMCE-Calculator
The main objective is to determine the expected O&M effort and associated costs for the coming period, where amongst others relevant information provided by the OMCE Building Blocks is taken into account.
Figure 1-1: OMCE concept with two major modules: Building Blocks and OMCE-Calculator
1.3 OMCE-Calculator
The OMCE-Calculator is the tool to calculate the O&M aspects (amongst others in terms of downtime, costs, and revenue losses) as indicated at the right-hand side in Figure 1-1. The tool has been designed to model the following types of maintenance:
Unplanned corrective maintenance
Condition based maintenance
Calendar based (preventive) maintenance
The specifications for the OMCE-Calculator have to a large extent been based on the experiences with the ECN O&M Tool. This tool is at present being used by more than 20 leading project developers and turbine manufacturers and is considered as the industry standard for analysing O&M aspects of offshore wind farms in the early planning phase [5].
The OMCE-Calculator is a time-domain simulation program which has been developed in MATLAB and is designed to assist operators of wind farms to determine the optimal O&M strategy during the
5/12
operational phase of a wind farm [6]. The tool is able to estimate the future O&M costs for a period that is typically 1 to 5 years. The estimates of the future O&M costs also include the quantification of uncertainties in costs and downtime. Once the O&M aspects have been analysed for the “as-is” or baseline situation, the operator may analyse different O&M scenarios (by changing the input parameters) and select the most cost effective one.
The tool is best used with operational data from the wind farm to be analysed as indicated by the connection through the Building Blocks in Figure 1-1. Yet, it can also be used with generic data as input in order to use the tool‟s advanced futures for optimisation of the maintenance strategy. Data required as input for the tool includes: failure rates, expected time-to-failures, preventive maintenance, repair strategies, wind and wave statistics, costs, lead time of vessels and spare parts etc. The main OMCE-Calculator specifications include:
The tool is designed for the operational phase of a wind farm.
The model considers limitations in vessels available, weather limits, spare parts etc.
A user-friendly input to define the three types of maintenance and their repair strategies.
Failures are modelled according to the Poisson process.
All repairs are analysed by time-domain simulations where historically recorded meteo data is used to calculate equipment accessibility and production (losses).
The Monte Carlo method is applied to determine uncertainty in the results.
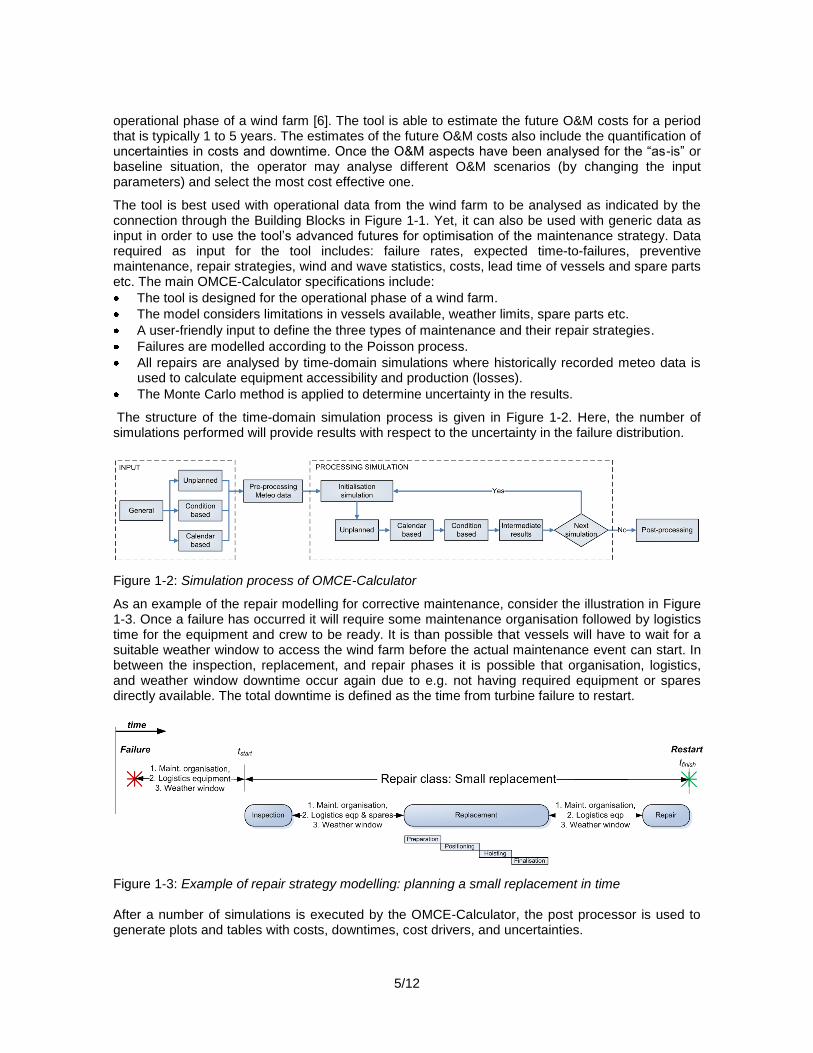
The structure of the time-domain simulation process is given in Figure 1-2. Here, the number of simulations performed will provide results with respect to the uncertainty in the failure distribution.
Figure 1-2: Simulation process of OMCE-Calculator
As an example of the repair modelling for corrective maintenance, consider the illustration in Figure 1-3. Once a failure has occurred it will require some maintenance organisation followed by logistics time for the equipment and crew to be ready. It is than possible that vessels will have to wait for a suitable weather window to access the wind farm before the actual maintenance event can start. In between the inspection, replacement, and repair phases it is possible that organisation, logistics, and weather window downtime occur again due to e.g. not having required equipment or spares directly available. The total downtime is defined as the time from turbine failure to restart.
Figure 1-3: Example of repair strategy modelling: planning a small replacement in time After a number of simulations is executed by the OMCE-Calculator, the post processor is used to generate plots and tables with costs, downtimes, cost drivers, and uncertainties.
6/12
1.4 Case study goal
The capabilities of the OMCE-Calculator software tool have been briefly demonstrated with the demo version of the tool in previous publications [3], [4]. However, these examples were limited in complexity by e.g. performing analyses with only 1 system and 1 fault type class (i.e. 1 type of failure for 1 system) per turbine. To investigate the potential of the tool for optimisation of the maintenance strategy for an entire wind farm a case study is now being performed. A baseline O&M scenario is set up for a hypothetical far offshore wind farm which represents planned and current offshore wind farm developments in North-West Europe. Since at present the OMCE Building Blocks have not been implemented in an actual wind farm and ECN has no data from an operational far offshore wind farm, generic data is used to set up the baseline scenario and perform maintenance strategy optimisation studies. For the case study an offshore wind farm of 520 MW installed capacity located some 120 km off the coast of the Netherlands in the North Sea is defined. Based on ECN‟s experience in O&M modelling, an initial maintenance strategy is set-up where both preventive (calendar and condition based) and corrective maintenance are considered. Because balance of plant failures may significantly affect costs and downtime, both wind turbine failures and balance of plant failures are taken into account. After setting up of the baseline O&M scenario, a sensitivity study for several cases is being performed with the objective to minimise the total O&M costs for the far offshore wind farm. This paper will focus on two of those cases: 1) the optimum number of access vessels to be applied, and 2) cost-advantages of proactive maintenance (condition based maintenance).
2 Baseline O&M scenario for case study
To assess the effect of improvements on the maintenance strategy in this case study, a baseline O&M scenario is set-up for a hypothetical wind farm off the coast of the Netherlands. The baseline scenario is modelled in the OMCE-Calculator. It goes beyond the scope of the present paper to give detailed descriptions on all modelling input parameters. The following sections will focus on a general description of the baseline O&M scenario in terms of wind farm location and turbine type, types of equipment defined, a description of the maintenance strategy, and results of the baseline scenario.
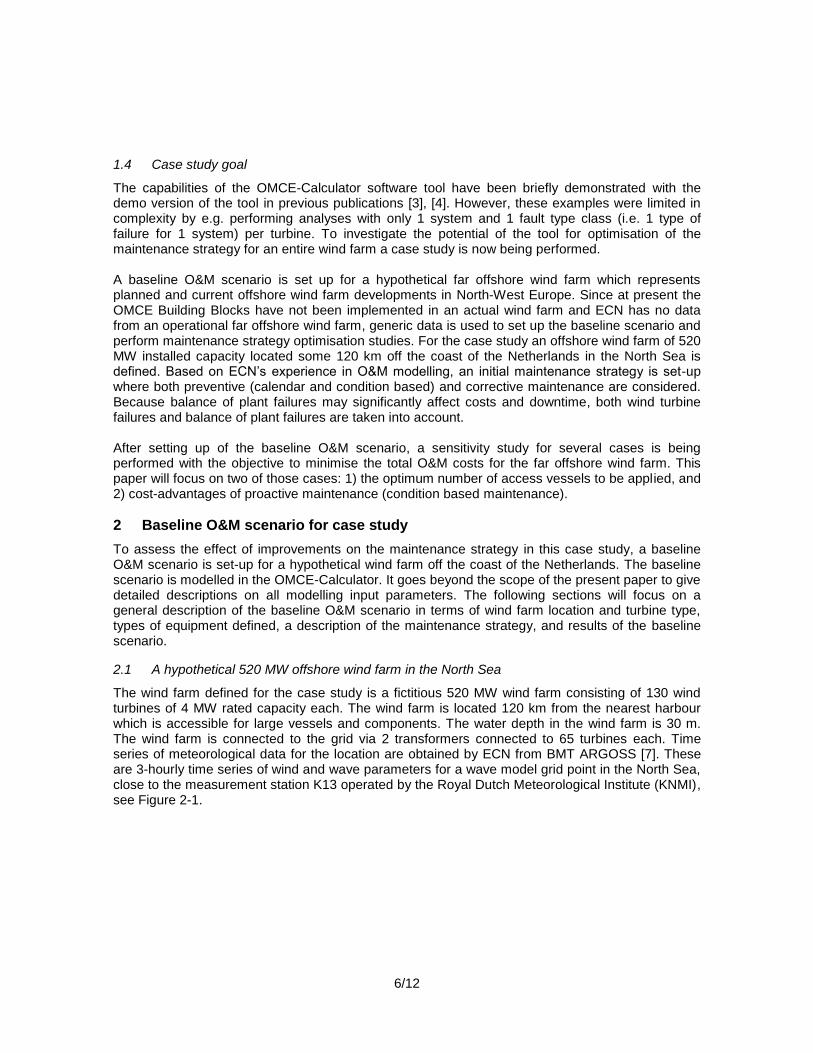
2.1 A hypothetical 520 MW offshore wind farm in the North Sea
The wind farm defined for the case study is a fictitious 520 MW wind farm consisting of 130 wind turbines of 4 MW rated capacity each. The wind farm is located 120 km from the nearest harbour which is accessible for large vessels and components. The water depth in the wind farm is 30 m. The wind farm is connected to the grid via 2 transformers connected to 65 turbines each. Time series of meteorological data for the location are obtained by ECN from BMT ARGOSS [7]. These are 3-hourly time series of wind and wave parameters for a wave model grid point in the North Sea, close to the measurement station K13 operated by the Royal Dutch Meteorological Institute (KNMI), see Figure 2-1.

7/12
Figure 2-1: Location of fictitious offshore wind farm near K13 (red pin) A generic 4 MW direct-drive wind turbine is defined for this wind farm. This turbine is equipped with a nacelle crane that is able to hoist small components like pitch motors and yaw drives along the tower (weight < 2000 kg). Hoisting larger components (generator, blades, etc.) requires a large external crane like those on a crane ship or jack-up vessel. The main turbine specifications used are listed in Table 2-1 below. Table 2-1: Turbine specifications 4 MW Direct Drive turbine
Parameter Value
Rotor diameter 90 m
Hub height 85 m
Rated power 4.0 MW
Power regulation Pitch control
Pitch regulation Electrical
Generator Direct-Drive Permanent Magnet
A suitable breakdown of the turbine has been defined in terms of main systems. The two transformers and cables located at the offshore wind farm are modelled as systems of a Balance of Plant (BoP) structure. These breakdowns on system level are required to assign failure rates to the individual systems. An average failure rate per turbine of is distributed over the wind turbine systems
by using input from the Reliawind project [8]. Possible faults for each system are distributed by definition of number of manageable failure categories, which are defined as fault type classes. On top of that it is assumed that each turbine has 5 remote resets per year in response to electronic warnings causing turbine shutdowns. Since very little information is available in literature with respect to failures of transformer stations, foundations and scour protection, engineering judgement has led to an assumed failure rate of for all BoP systems.
5 10 15 20 25
500
1000
1500
2000
2500
3000
3500
4000
Wind speed [m/s]
Pow
er
[kW
]
P-V datapoints Interpolated curve Cut-in velocity Cut-out velocity

8/12
2.2 Equipment defined for maintenance
Since the proposed offshore wind farm is located far offshore at 120 km distance from the nearest harbour, it is assumed that technicians remain in the wind farm on a hotel type of vessel while not working (i.e. mother vessel). Such a scenario is typically also applied for offshore operations in the oil industry. For the baseline configuration it has been decided that the following equipment are used for the transfer of personnel and spare parts, and for hoisting components:
3 Workboat access vessels (transferring technicians and transporting small components)
1 Jack-up vessel (transporting and hoisting large components)
1 Mother vessel (accommodation of technicians and storage of small components)
1 Cable laying vessel (replacing power cables)
1 Diving support vessel (for underwater inspections and repairs)
1 Helicopter (transporting technicians for specific types of maintenance) An example of a workboat access vessel used for installation and operation & maintenance is depicted in Figure 1-3.
Figure 2-2: Example of workboat access vessel; the WindCat MKIII [9] For the equipment defined above specifications are obtained as input for modelling in the OMCE-Calculator by performing a literature study and best estimates for values not found in literature. These specifications include the vessel‟s travelling limits in terms of maximum significant wave height and wind speed, etc. It was found that mainly vessel cost data is hard to obtain since these will usually be covered by contracts between the wind farm operators and the vessel suppliers.
2.3 Assumptions and set-up of initial maintenance strategy for the baseline project
With respect to setting-up an initial maintenance strategy for the wind farm defined above, the following main modelling assumptions are made:
For the baseline scenario it is assumed that workboat vessels with technicians are launched from the mother vessel to perform corrective and preventive maintenance.
The mother vessel is the base for the workboats and stays in the wind farm continuously
It is estimated that the travel time to a turbine in the farm is on average 1 hour, including the transfer of personnel to the workboat and to the turbine.
Personnel are considered to work only in a single shift during daylight periods for all possible maintenance to ensure a safe working environment (11 hours yearly average).
The workboat is able to transport small parts kept in stock on the mother vessel to the wind turbines (< 2000 kg).
For the replacement of larger components (weights in excess of 2000 kg) a jack-up vessel is required. This vessel will also transport the spare part to the wind farm.
9/12
It is assumed that for a large transformer repair, technicians with sufficient expertise are not available on the mother vessel and need to be flown in by helicopter to the mother vessel.
To repair power cables inside the wind farm, a cable laying vessel is required.
For preventive maintenance of the cables and foundations, a diving support ship with a crew of divers is used.
Condition based maintenance (observed degradation) is expected to be performed on the yaw and blade adjustment systems (30 and 25 wind turbine replacements within 2 years)
Calendar based maintenance is performed on a wind turbine level and takes 24 hours per turbine per year with 3 technicians
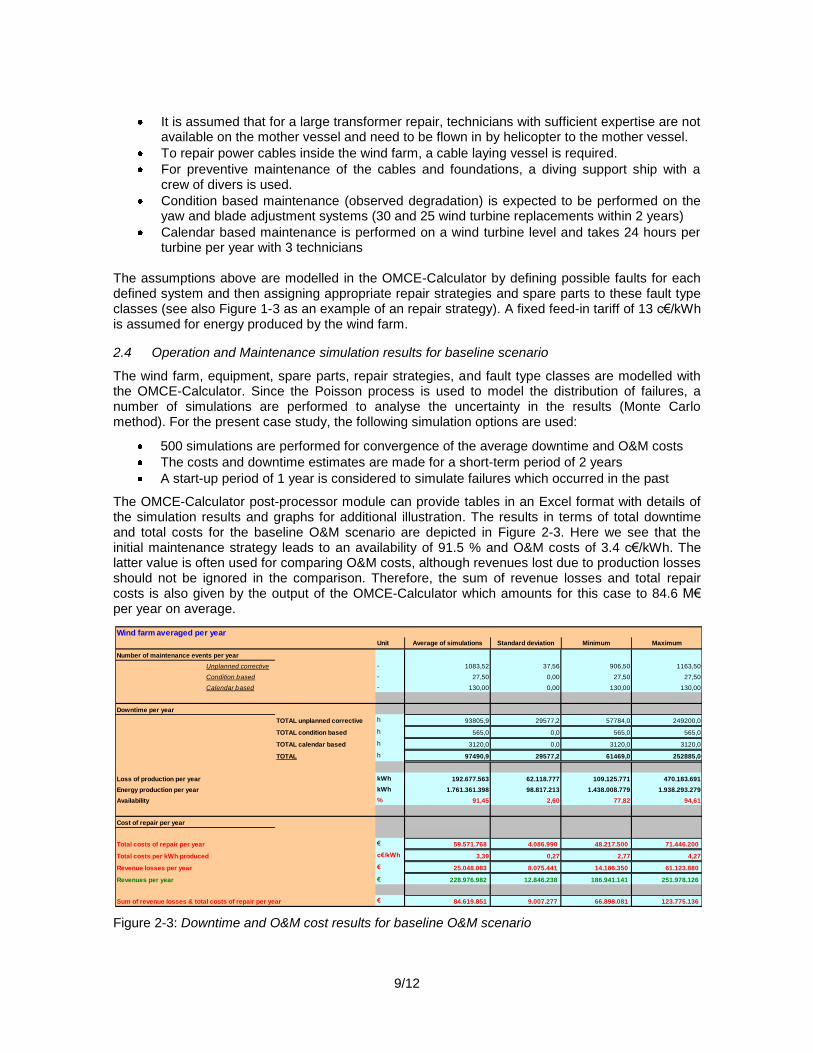
The assumptions above are modelled in the OMCE-Calculator by defining possible faults for each defined system and then assigning appropriate repair strategies and spare parts to these fault type classes (see also Figure 1-3 as an example of an repair strategy). A fixed feed-in tariff of 13 c€/kWh is assumed for energy produced by the wind farm.
2.4 Operation and Maintenance simulation results for baseline scenario
The wind farm, equipment, spare parts, repair strategies, and fault type classes are modelled with the OMCE-Calculator. Since the Poisson process is used to model the distribution of failures, a number of simulations are performed to analyse the uncertainty in the results (Monte Carlo method). For the present case study, the following simulation options are used:
500 simulations are performed for convergence of the average downtime and O&M costs
The costs and downtime estimates are made for a short-term period of 2 years
A start-up period of 1 year is considered to simulate failures which occurred in the past
The OMCE-Calculator post-processor module can provide tables in an Excel format with details of the simulation results and graphs for additional illustration. The results in terms of total downtime and total costs for the baseline O&M scenario are depicted in Figure 2-3. Here we see that the initial maintenance strategy leads to an availability of 91.5 % and O&M costs of 3.4 c€/kWh. The latter value is often used for comparing O&M costs, although revenues lost due to production losses should not be ignored in the comparison. Therefore, the sum of revenue losses and total repair costs is also given by the output of the OMCE-Calculator which amounts for this case to 84.6 M€ per year on average.
Figure 2-3: Downtime and O&M cost results for baseline O&M scenario
Summary of downtime & costs
Project OMCE Case Study K13 EWEA
Simulation sim 2y
Installed wind farm capacity 520,0 MW
Number of wind turbines in farm 130
Simulation period 2 yr
Start-up period 1 yr
Number of simulations 500
Wind farm averaged per year
Unit Average of simulations Standard deviation Minimum Maximum
Number of maintenance events per year
Unplanned corrective - 1083,52 37,56 906,50 1163,50
Condition based - 27,50 0,00 27,50 27,50
Calendar based - 130,00 0,00 130,00 130,00
Downtime per year
TOTAL unplanned corrective h 93805,9 29577,2 57784,0 249200,0
TOTAL condition based h 565,0 0,0 565,0 565,0
TOTAL calendar based h 3120,0 0,0 3120,0 3120,0
TOTAL h 97490,9 29577,2 61469,0 252885,0
Loss of production per year kWh 192.677.563 62.118.777 109.125.771 470.183.691
Energy production per year kWh 1.761.361.398 98.817.213 1.438.008.779 1.938.293.279
Availability % 91,45 2,60 77,82 94,61
Cost of repair per year
Total costs of repair per year € 59.571.768 4.086.990 48.217.500 71.446.200
Total costs per kWh produced c€/kWh 3,39 0,27 2,77 4,27
Revenue losses per year € 25.048.083 8.075.441 14.186.350 61.123.880
Revenues per year € 228.976.982 12.846.238 186.941.141 251.978.126
Sum of revenue losses & total costs of repair per year € 84.619.851 9.007.277 66.898.081 123.775.136

10/12
Two pie charts showing a breakdown of the total downtime and of the O&M costs are given in Figure 2-4. With respect to downtime, the baseline scenario clearly shows that downtime due to corrective maintenance is a major contributor to the total downtime (and thus revenue losses). In Figure 2-4, we also see that the waiting time for a suitable weather window consumes almost half of the total downtime. In the breakdown of the total O&M costs we see equipment costs and revenue losses dominating the total O&M costs of the wind farm.
Figure 2-4: Breakdown of wind farm downtime (L) and total O&M costs (R)
3 Optimisation of maintenance strategy to minimise O&M costs
Optimisations may be run to optimise various parameters. The first parameter to be thought of might be repair costs, however optimisations may also be performed with respect to e.g. the availability of the wind farm. Here, the objective is to minimise the total costs due to O&M, which is defined as the sum of the direct O&M costs (repair costs made) and indirect O&M costs (revenues lost due to downtime):
To see whether the initial maintenance strategy is optimal, a sensitivity study is conducted by studying the following two cases:
1. Number of available access vessels: the initial maintenance strategy utilizes 3 workboat access vessels to service the wind turbines and balance of plant structure in the wind farm. More or less access vessels may result in lower total O&M costs.
2. Advantages of proactive maintenance: by using condition monitoring of the wind turbines, the time to failure of one of the components may be better understood leading to a reduced failure rate and an (additional) number of condition based maintenance repairs to be made.
3.1 Optimisation of number of access vessels available for transfer from mother vessel
The sensitivity of the baseline scenario to a change in the number of workboats is studied by varying the number of available vessels for corrective maintenance from 1 to 6. The OMCE-Calculator is used to define the variations to the baseline project. For each of these variations, 500 simulations are performed for a simulation period of 2 years with a start-up period of 1 year. A graph is depicted in Figure 3-1 which shows the average total O&M costs and the two cost components as defined in equation (1). We see that the trend of revenue losses versus the number of available workboats is decreasing, since less waiting time for resources is required. The direct maintenance costs increase since the workboats are assumed to be operator owned and each vessel will lead to additional fixed and variable costs. The total O&M costs are at minimum when 4 workboats are available in the wind farm. This is a reduction of 1.4% in total O&M costs compared to the baseline scenario assumption

11/12
of having 3 available workboats. What is clearly visible is that having only one workboat available for maintenance leads to high revenue losses caused by long downtimes of the wind farm. In this case direct costs are also lower, since less maintenance can be performed due to long waiting times for available resources.
Figure 3-1: Sensitivity of baseline scenario to a change in number of available access vessels
3.2 Advantages of condition based maintenance
In general there have been a lot of developments in the condition monitoring of wind turbine components in order to predict if and when components are going to fail. This information can be used as input for condition based maintenance. It is expected that condition based maintenance will lead to significant O&M cost savings. In order to demonstrate the significance of condition based maintenance, the sensitivity of the model with respect to a reduced failure rate and an increased number of condition based maintenance events is studied. Hence, we assume the same reliability of the system. We will now assume that by advanced monitoring techniques the failure rate of the
blade adjustment system reduces from to leading to
approximately additional condition based repairs per year. The baseline O&M scenario is adjusted to include these assumptions and rerun to determine the resulting O&M costs. The results are compared to the baseline O&M scenario in Table 3-1. From the results we see that the number of corrective maintenance events have decreased as expected by the reduced failure rate. The reduced number of corrective maintenance events leads to a large reduction in total downtime and thereby to much less revenue losses. For this example a reduction of 4.2 M€ or 4.9% in total O&M costs is achieved compared to the baseline scenario. However, the additional investment required for such a system should be subtracted from this result. Table 3-1: Additional condition based maintenance scenario compared to baseline O&M scenario
0102030405060708090
100110
0 1 2 3 4 5 6 7
Co
sts
(ave
rage
) [€
]M
illio
ns
No. of vessels [-]
Sensitivity of total O&M costs for baseline scenerario to number of access vessels available Total O&M costs
Direct costs (repairs)Indirect costs (revenue losses)
Wind farm averaged per year
Baseline O&M
scenario
Scenario with
additional condition
based maintenance
Difference [%]
Unit Average of simulations Average of simulations
Number of maintenance events per year
Unplanned corrective - 1083,52 1044,83 -3,57
Condition based - 27,50 77,50 181,82
Calendar based - 130,00 130,00 0,00
Downtime per year
TOTAL h 97490,9 89477,9 -8,22
Availability % 91,45 92,15 0,77
Total costs of repair per year € 59.571.768 57.623.939 -3,27
Total costs per kWh produced c€/kWh 3,39 3,25 -4,17
Revenue losses per year € 25.048.083 22.861.130 -8,73
Sum of revenue losses & total costs of repair per year € 84.619.851 80.485.069 -4,89
12/12
4 Conclusions and further research
One of the most important aspects on setting-up a suitable maintenance strategy for an offshore wind farm is the definition of the baseline O&M scenario which is specific to the wind farm under consideration. This case study considers a far offshore wind farm with a maintenance strategy adopted to its location (e.g. mother vessel and workboats remain on-site). This strategy is modelled successfully with the OMCE-Calculator. The tool results that long waiting times for suitable weather windows are a major contributor to the wind farm downtime leading to high revenue losses. Additionally it was seen that both equipment cost and revenue losses have a large contribution in the total O&M costs for an offshore wind farm.
The sensitivity study shows that having 4 workboats available can lead to a reduction of 1.4% in total O&M costs. This demonstrates that the OMCE-Calculator is suitable to perform such a study and confirms conclusions drawn by simpler studies performed with this tool [3], [4]. The study also shows that significant cost savings can be obtained by applying condition based maintenance. However, it should be noted that neither the feasibility nor the investment costs for a condition monitoring system are taken into account. Future research with the case study will focus on cost optimisation by varying other parameters and further development of the OMCE-Calculator tool.
5 Acknowledgements
The development of the specifications for the OMCE was carried out and co-financed by the Bsik programme „Large-scale Wind Power Generation Offshore‟ of the consortium We@Sea (www.we-at-sea.org). The development of the event list and the programming of the OMCE-Calculator is carried out within the D OWES (Dutch Offshore Wind Energy Services) project which is financially supported by the European Fund for Regional Developments (EFRO) of the EU (www.dowes.nl).
References
[1] Rademakers LWMM, Braam H, Obdam TS, Frohböse P, Kruse N. Tools For Estimating Operation and Maintenance Costs of Offshore Wind Farms: State of the Art, ECN-M--08-026, September 2008; Presented at the EWEC 2008, Brussels, Belgium
[2] Sørensen JD, Sørensen JN. Wind energy systems: Optimising design and construction for safe and reliable operation; Woodhead Publishing Series in Energy: Number 10, December 2010; ISBN-13: 978-1-84569-580 4
[3] Pieterman RP van de, Braam H, Rademakers LWMM, Obdam TS. Operation and Maintenance Cost Estimator (OMCE) – Estimate future O&M cost for offshore wind farms; ECN-M--10-089; Presented at the DEWEK Conference 2010; Bremen
[4] Braam H, Obdam TS, Pieterman RP van de , Rademakers LWMM. Properties of the O&M Cost Estimator (OMCE), ECN-M-11-045, July 2011
[5] ECN O&M Tool, http://www.ewis.nl/software/
[6] MATLAB version 7.9, The MathWorks Inc., Natick, Massachusetts, 2009
[7] Weather data by BMT ARGOSS, http://www.bmtargoss.com/
[8] Wilkinson M, Hendriks B. Report on Wind Turbine Reliability Profiles, Reliawind deliverable D.1.3, March 2011.
[9] Picture used with permission of WindCat Workboats BV., http://www.windcatworkboats.nl/
Europe invests in your future by means of the European fund for
regional development.