optimisation of loss prevention measures for chemical ... and loss... · optimisation of loss...
TRANSCRIPT

I.CHEM.E. SYMPOSIUM SERIES NO. 110
OPTIMISATION OF LOSS PREVENTION MEASURES FOR CHEMICAL PROCESS PLANT
Brian J Berenblut* and Simon M Whitehouse*
This paper discusses a risk assessment methodology used in the insurance industry for optimising expenditure on loss prevention measures. A description is given of a software tool, HPSET which provides sufficient information, in terms of expectation of property loss due to fire and explosion, to carry out cost/benefit studies on the effects of alternative loss prevention measures. Protection measures considered include both physical and management systems and the tool makes use of detailed information of process equipment at item level. For ease of data entry a functional unit description of the plant is used, enabling highly detailed descriptions to be generated from a minimum of starting information. An assessment of a refinery expansion is used to exemplify the methodology described.
Further developments of the method to include business interruption risks and offsite risks, including toxic damage are described.
INTRODUCTION
Loss prevention measures for chemical and petrochemical plant are often implemented without a thorough and systematic cost/benefit analysis. The principle reason for this situation arises from the lack of a methodology which is fast to apply yet provides realistic and quantitative output on which decisions can be based. This paper describes a technique which provides detailed information that can be used to quantify the effectiveness of different protection strategies.
The analysis involves the use of two computer programs, IFAL and HPSET. IFAL calculates the losses that can be expected from the operation of a process, due to fire and explosion incidents. IFAL takes account of all logical probabilistic and deterministic interactions that determine the long-term risk posed by hazardous plants. HPSET is used to study the mitigating effects of protection measures, both physical and managerial.
This combined approach provides management with information that can support decision making. It can, for example, be used to highlight areas of plant which are the major contributors to risk, and thereby select the sections most likely to yield dividends. The utility of the technique is illustrated by application to a petroleum refinery. In particular, the effects of plant layout, flammable gas detectors and an emergency shut down system, are explored.
* CWA Information and Research Ltd, 18 Grosvenor Place, London SW1X 7HS
51

I.CHEM.E. SYMPOSIUM SERIES NO. 110
METHODS OF STUDY
Risk Assessment using IFAL
The IFAL (Instantaneous Fractional Annual Loss) method t l . 2 > was developed for large scale petrochemical plants handling flammable materials. The computer code contains all the basic failure frequency and material properties data needed to analyse plants and uses built-in engineering and fire/explosion hazard evaluation models to assess risk. The IFAL program contains simple models of process equipment and uses user-supplied process data to calculate the role of each item both as a source of hazard and as a target for damage. Rather than study processes at individual item level, IFAL allows averaging by considering groups of plant items in convenient blocks. In this way sources of hazard and the way in which the hazard is composed, can be discussed at a block level.
The IFAL program calculates the damage from all source/target interactions by performing the following steps for each source on the site:
* Calculation of the failure frequency, emission size and vapour fraction of the emission. (This is based on historical failure data modified by process conditions, throughputs and equipment type.)
* Calculation of the spread/dispersion of the release.
* Estimation of the chance of the released material igniting as one of four perils: liquid pool fire, vapour fire, unconfined vapour cloud explosion, confined vapour cloud explosion.
* Calculation of the damage caused by each event.
* Logical combination of probability and damage aspects, to give the expected risk.
The contributions from all sources are then summed to give the plant risk.
If the study is aimed at determining potential plant physical damage, the risk is obtained in monetary terms; this can be simplified by expressing the loss as a percentage of the plant value. In this paper physical damage chance is considered.
Assessment of Protection: HPSET
HPSET3 (Hazards Protection System Evaluation Tool) used to assess the mitigating effects of protection measures. It was developed for use by insurance brokers and is compatible with IFAL - so plant data files are interchangeable.
The program allows study of the effects of all the perils in IFAL for selected sources. The results are presented both numerically and graphically. The graphic displays show the hazard contour for a given event (eg, 40% damage circle for a vapour cloud explosion).
A total of thirteen protection measures have been implemented to date, 10 physical and 3 managerial, viz:
82

I.CHEM.E. SYMPOSIUM SERIES NO. 110
Physical Systems Management Systems
Emergency Shut-Down Drains Maintenance/Modifications Motor Operated Valves Spacing Work Permits Pump Seals Fire Proofing Fire Brigade Pump Deluge Systems Water Curtains Tank Deluge Systems Gas Detectors
These measures may be applied individually or in any combination.
The application of one or more of these protection measures may reduce the expected loss from fire and explosion. The protection measure under consideration may be applied for the following cases:
* single source, single peril * single source, all perils * all sources, all perils.
If the losses are expressed as a percentage of plant value, an estimated financial saving, and hence a measure of cost-effectiveness, for a given protection system can be calculated.
FIRE AND EXPLOSION ANALYSIS OF A REFINERY UNIT
Analysis Procedure
A recent application(4) of the HPSET program serves to illustrate some of its features.
The study addresses the decision of a client to implement some additional protection measures to a crude distillation unit (CDU) of a refinery, aimed specifically at reducing the potential for fire and explosion damage.
The analysis was performed in three stages:
* an IFAL study of the base case plant ie, the plant with its original design and protection features, to determine the major contributors to hazard
* analysis of the base case results to aid selection of appropriate protection features
* implementation of the protection features to determine the reduction in hazard (using HPSET).
Plant Description
Figure 1 shows a simplified block diagram of the plant. Crude oil is fed to a crude distillation unit (CDU) where it is desalted and split into four streams: distillate, light gas oil, heavy gas oil, and fuel oil (some of which is burnt).
Light and heavy gas oils and fuel oil are product streams which undergo no further processing after leaving the CDU.
53

I.CHEM.E.SYMPOSIUM SERIES NO. 110
The distillate stream is passed to the hydrofiner where it is reacted and split into five streams: hydrogen sulphide and fuel gas, LPG, light naphtha, heavy naphtha and jet fuel. The jet fuel and light naphtha are product streams. The hydrogen sulphide and fuel gas are sent to the sulphur unit via a DEA absorption tower. The LPG is passed through a de-ethaniser prior to storage. The heavy naphtha is passed to the reformer.
Figure 2 shows the plot plan of the refinery.
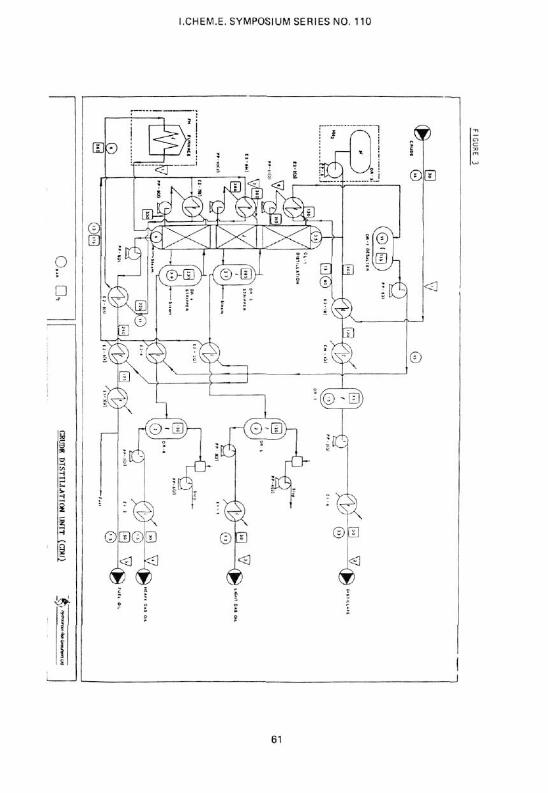
Special interest had been expressed in the CDU and a flow diagram is shown in Figure 3. After desalting, the crude is preheated by heat exchange with hot residue, sidestreams and pumparounds. The crude is then heated, in a furnace, to 380°C and the partially vapourised product is fed to a 30-tray column operating at about atmospheric pressure. Residue is obtained from the tower bottom and heavy and light oils are drawn off as sidestreams, each stream is steam stripped and vacuum dried. The remainder is taken off as the overhead distillate.
ANALYSIS OF RESULTS
Base-Case Results
Process data for the refinery was entered into IFAL to obtain the losses for the base-case plant. This produced a loss equivalent to 0.80% of the refinery, per year, that is, the material damage due to fire and explosion incidents will average out to this figure over a long period of operation. Table 1 shows some expected annual loss values for other plants for comparison.
These results assume a standard of good practice - ie, without the application of special protection measures.
The components of the base-case loss, by peril are shown in Table 2. This shows that the risk is not dominated by any particular hazard although vapour cloud explosions contribute more than fires. However, the distribution according to plant section, see Table 3, shows that the Reformer contributes nearly half the total loss. Thus one might consider the Reformer to be a suitable candidate for further attention, although the CDU was selected for further analysis on client's instructions.
Detailed Assessment of Risk Reduction Features
In order to formulate an effective risk reduction strategy, it is necessary to study how the losses occur. This was carried out by sub-dividing the CDU block into four smaller blocks, each one performing a separate function: atmospheric distillation, steam stripping, vacuum drying and heating (furnaces). The program was re-run to calculate the contribution from each of these units as shown in Table 4.
It is clear, that both the Distillation Column and the Vacuum Driers provide the majority of the risk, so protection applied to these units is likely to produce the greatest benefit. The losses from these two blocks is listed by hazard type in Table 5.
It is possible to look in greater detail at the contributors to these losses: frequency of emission, emission size, ignition probability, etc. Table 6 shows a sample of such results, for flammable emissions in the range 1-20 tonnes. The trend indicated by these figures is also representative of other emission sizes.
54

I.CHEM.E.SYMPOSIUM SERIES NO. 110
The following following conclusions can be drawn from the intermediate results in Tables 5 and 6 for the CDU section:
* the major contributor to loss is from fires rather than explosions, in particular liquid pool fires (see Table 5)
* incidents from vapour releases (both vapour fires and vapour cloud explosions) contribute about 60% of the losses, compared with only 40% from liquid fires
* the total chance of ignition (per release) is quite high, over 0.5 for the emissions quoted in Table 6. This is even higher (about 0.9) for larger source emissions
* the chance of fires is much higher than the chance of explosions (as indicated by the relative ignition chance for these hazards in Table 6).
Effect of Protection Measures
The analysis of the risk make-up suggests that effective protection measure for these units should address the following aspects:
* reduction of ignition chance
* reduction of the size of releases, which will both reduce the chance of ignition (since the spread will be less) and the associated damage.
Emergency shown-down (ESD) systems can effect both of these parameters. In the event of a detected release they will shut-down pumps, rotating machinery, etc, thereby reducing the probability of ignition from within the source block and isolate items of equipment (using motorised or fail closed valves) to reduce the size of a leak. ESDs, therefore, were the first protection measure applied to the column and driers. In the standard IFAL and HPSET programs a leak is assumed to continue for 10 minutes before isolation. In this case the ESD was assumed to isolate the leak and shut-down pumps and rotating machinery in 2 minutes.
The effect of the application of an ESD is shown in Table 7, with the initial values is included for comparison.
This shows a change in the losses from 0.25% to 0.08% of the plant value, almost a 70% reduction.
The economics of such a change can be determined by converting these improvements to actual cost and comparing them with the cost of the plant changes. Assuming a plant lifetime of 15 years, investment of $100,000,000, an interest rate of 10%, and an ESD reliability of 0.9, the net present value of this saving is $0.98m. For an ESD reliability of 0.99, this saving rises to $l.lm.
It is now possible to balance the cost of installing and maintaining the ESD systems with the level of savings achieved. It should be noted that the figures quoted are for direct, on-site material damage only and do not account for loss of profits, off-site damage or costs of injury.
55

I.CHEM.E. SYMPOSIUM SERIES NO. 110
The chance of ignition is also a strong function of plant spacing and layout. Study of the plot plan revealed that the distillation column and the drier units were situated close to blocks containing naked flame sources. This aspect was not considered as a possible means of reducing ignition chance since the plant is already built. However, the use of automatic flammable detectors was considered to be a feature that could enhance the effect of the emergency shutdown system. Gas detectors were modelled on the boundaries of these blocks nearest the distillation column and driers. Combining gas detection with a 2-minute ESD system dramatically reduces the expected average annual loss, as shown in Table 8 where the original results are shown in brackets.
This represents a benefit of about a 90% reduction in the fire and explosion losses, assuming a 100% reliability in both the ESD and gas detectors. However, even allowing for a reasonable failure frequency, the benefit will be large.
CONCLUSIONS
In a recent document prepared for UNCTAD<5> note is made of an attitude, that exists in many countries, that insurance is a substitute for loss prevention activities. Loss is a waste of resources however complete the insurance cover and the report goes on to suggest that "in many countries, managers would ridicule suggestions that they spend more on loss prevention than on insurance. A sound cost-benefit analysis will often refute the logic of this practice." Through the use of techniques described in this paper one consulting engineering company, closely associated with a major London Insurance Broking House<A> was able to demonstrate the power of this argument to his client and to convince him of a material gain through implementation of a protection system. The example outlined in this paper confirms what may be considered to be an obvious point. In fact on many occasions application of the techniques outlined have revealed the opportunity of application of subtle changes that provide disproportionately large benefits.
REFERENCES
1 Instantaneous Fractional Annual Loss (IFAL) Process Factor Algorithm for Oil and Petrochemical Plants, CWA Information and Research Ltd, 1986.
2 IFAL Process Factor Workbook, CWA Information and Research Ltd, 1986.
3 HPSET Sponsors:
CWA Information and Research Ltd, 18 Grosvenor Place, London SW1
Bowring Marine and Energy Insurance Brokers, Tower Place, London EC3 Hydrocarbon Risk Consultants, 100 Leman Street, London El. IES Ltd, 52 Leadenhall Street, London EC3A 2BJ Sedgwick International Ltd, Sedgwick Centre, London El 8DX
4 Hydrocarbon Risk Consultants, 100 Leman Street, London El.
5 The Promotion of Risk Management in Developing Countries, Centre for Risk Management and Insurance Research, Georgia State University, Atlanta, Georgia, USA, January 1987.
56

I.CHEM.E. SYMPOSIUM SERIES NO. 110
TABLE 1
Some Examples of Loss Value Results
TABLE 2
Percentage Loss: Breakdown by Hazard for Base-Case
TABLE 3
Blocks with Major Contributions to the Expected Annual Loss
57

I.CHEM.E. SYMPOSIUM SERIES NO. 110
TABLE 4
Breakdown of Loss Cont r ibu t ions in the CDU for Base-Case
Functional Unit
Distillation Column Steam Strippers Furnace Vacuum Driers
Expected Annual Loss (% of plant value)
0.12 0.01 0.02 0.09
0.24
% Contribution
50 4.2 8.3 37.5
100
TABLE 5
Breakdown of Distillation and Furnace Unit Losses by Hazard
Peril
Pool Fire Vapour Fire Vapour Cloud
Explosion
Expected Annual Loss (% of plant value)
Distillation Column
0.06 0.04 0.03
Vacuum Driers
0.03 0.04 0.03
Total
0.09 0.08 0.06
0.23
% Contribution
39.1 34.8 26.1
100
TABLE 6
Intermediate Results for Emissions in the 1-20 te Range
58

I.CHEM.E. SYMPOSIUM SERIES NO. 110
TABLE 7
Reduction in Expected Annual Losses Due to Application of ESP Systems
TABLE 8
Reduction in Expected Annual Loss Pue to Installation of Gas Petectors plus ESP System
59

I.CHEM.E. SYMPOSIUM SERIES NO. 110
60
I.CHEM.E. SYMPOSIUM SERIES NO. 110
61

I.CHEM.E. SYMPOSIUM SERIES NO. 110
62