optimisation of hplc-based methods for the...
TRANSCRIPT

1
OPTIMISATION OF HPLC-BASED METHODS FOR THE SEPARATI ON AND
DETECTION OF HERBICIDE GLYPHOSATE AND ITS MAJOR MET ABOLITE IN
WATER
2010
LAWRENCE MZUKISI MADIKIZELA

2
PREFACE
The following report describes the work that was carried at the Durban University of
Technology, M L Sultan Campus, Department of Chemistry to investigate a suitable method
for the separation and determination of levels for selected herbicides: glyphosate and AMPA,
in dams and rivers around the Province of KwaZulu-Natal, South Africa.

3
DECLARATION
This dissertation is submitted in partial compliance with the requirements for the Masters
Degree in Technology: Chemistry, in the Faculty of Applied Sciences at the Durban
University of Technology
I, Lawrence Mzukisi Madikizela, do declare that this dissertation is representative of my own
work. It has not been submitted before for any degree or examination in any other institution.
........................................ …………………
Signature of the student Date of Signature
APPROVED FOR FINAL SUBMISSION
....................................... ……………………
Co-Supervisors: Prof. K. G. Moodley Mr. D. K. Chetty
………………………
HOD: Prof. G. G. Redhi

4
DEDICATION
This dissertation is dedicated to the following people:
• To my deceased father, Mongezi Morris Madikizela who did everything he could to
enable me to get a good education.
• My mother, Landiwe Nkwentsha, who brought me up under very difficult circumstances
and supported me all the way through out this research.
• My aunt, Ntombentsha Nkwentsha for her support, encouragement throughout this work
• My late grandmother, Nomsa Madikizela who wanted me to get a very good education.

5
ACKNOWLEDGEMENTS
I would like to thank the following persons and organizations for their assistance and helpful
support during the course of this research:-
Both my supervisors Prof. K. G. Moodley and Mr. D. K. Chetty for their help, guidance,
support throughout this research and preparation of this dissertation.
Eskom’s Tertiary Education Support Program (TESP) and Durban University of Technology
for funding.
Ms Prudence Majozi of Water Affairs Department in Province of KwaZulu-Natal for help in
collecting water samples from Hammersdale dam and sharing her knowledge with me.
Mrs D. (Avy) Pillay for her help with the understanding of instruments.
Mr S. R. Chetty for his support and help with the maintenance of the equipment.
Department of Chemistry staff at Durban University of Technology (DUT) for their
encouragement and assistance.
Everyone involved in Eskom group at DUT for their input, helping hands, kindness and
understanding.
Finally, my family and friends, for their patience, understanding, encouraging words and
support throughout this work.
Without all of you I think I might have given up a long time ago, thank you.

6
ABSTRACT
Water storage dams play an important part in the collection and purification of water destined
for human consumption. However, the nutrient rich silt in these dams promotes rapid growth
of aquatic plants which tend to block out light and air. Glyphosate is universally used as the
effective non-selective herbicide for the control of aquatic plants in rivers and dams.
Invariably there is residual glyphosate present in water after spraying of dams and rivers with
glyphosate herbicide. The amount of residual glyphosate is difficult to determine on account
of high solubility of glyphosate in water. Thus a method of sample preparation and a sensitive
HPLC method for the detection of trace amounts of glyphosate and its major metabolite
aminomethylphosphonic acid (AMPA) in water is required. A crucial step in sample
preparation is pre-column derivitization of glyphosate with 9-fluorenylmethyl chloroformate
(FMOC-Cl).
For sample pretreatment, water samples were derivatized with FMOC-Cl at pH 9, extracted
with ethyl acetate and sample clean-up was carried out by passing a sample through the SPE
cartridge. For SPE, recovery studies were done to choose a suitable cartridge for glyphosate
and AMPA analysis. The following cartridges were compared, namely, C18, Oasis HLB and
Oasis MAX SPE cartridges. Best recoveries (101% for glyphosate and 90% for AMPA) were
obtained using 500 mg of C18 solid-phase extraction cartridge. The eluent from SPE cartridge
was injected into HPLC column. Three types of separation columns (namely; C18 column,
silica based amino column and polymeric amino column) were compared for the separation
of glyphosate and AMPA. The best separation of glyphosate and AMPA in water samples
was achieved using a polymeric amino column and a mobile phase at pH 10 which contained
a mixture of acetonitrile and 0.05 M phosphate buffer (pH 10) 55:45, (v/v) respectively.
The method was validated by spiking tap water , deionized water and river water at a level of
100 µg/l. Recoveries were in the range of 77% -111% for both analytes. The method was also
used in determining the levels of glyphosate and AMPA in environmental samples. This
method gave detection limits of 3.2 µg/l and 0.23 µg/l for glyphosate and AMPA
respectively. The limits of quantification obtained for this method were 10.5 µg/l and 3.2 µg/l
for glyphosate and AMPA respectively.

7
TABLE OF CONTENTS
Preface I
Declaration ii
Dedication iii
Acknowledgements iv
Abstract v
Table of contents vii
List of figures xi
List of tables xiii
CHAPTER 1 1
INTRODUCTION 1
1.1General discussion of herbicides 1
1.1.1 Compounds selected for this study 1
1.1.2 Structures of selected compounds 2
1.2 Chemical properties of selected herbicides 2
1.3 Historical account of the production of selected herbicides 3
1.3.1 Glyphosate 3
1.3.2 Glufosinate 3
1.4 Uses of herbicides 4
1.5 Sources of herbicides in water 4
1.6 Glyphosate in action 6
1.6.1 Action of glyphosate in plants 6
1.6.2 Glyphosate in the environment 6
1.6.3 Toxicity of glyphosate 10
1.7 Glufosinate in action 10
1.7.1 Action of glufosinate in plants 10
1.7.2 Glufosinate in the environment 10
1.7.3 Toxicity of glufosinate 11
1.8 Levels of herbicides set by regulatory bodies 11

8
CHAPTER 2 13
LITERATURE REVIEW 13
2.1 High performance liquid chromatography (HPLC) methods 13
2.1.1 Pre-column derivatization methods 14
2.1.2 Post-column derivatization methods 22
2.2 Gas chromatography (GC) methods 23
2.3 Ion chromatography (IC) methods 25
2.4 Capillary electrophoresis (CE) methods 27
2.5 Aims and objectives of this project 29
CHAPTER 3 30
PRINCIPLES ON WHICH CHOSEN TECHNIQUES ARE BASED 30
3.1 High performance liquid chromatography 30
3.1.1 Introduction to HPLC 30
3.1.2 Basic components of HPLC 30
3.1.3 Fluorescence detector 33
3.1.4 Derivatization 34
3.2 Ion chromatography 35
3.2.1 Introduction to IC 35
3.2.2 Separation in IC 36
3.2.3 Mechanism of IC 36
3.2.4 Ion Chromatographic Detection 36
3.3 Sample preparation techniques 37
3.3.1 Solvent extraction 37
3.3.2 Solid-phase extraction (SPE) 38
CHAPTER 4 41
EXPERIMENTAL 41
4.1 Materials 41
4.2 Equipment 41
4.3 Preparation of solutions 42
4.4 Samples 44
4.5 Derivatization 45
4.5.1 Derivatization of standards 45

9
4.5.2 Derivatization of field samples 46
4.6 Sample clean-up 46
4.7 HPLC analysis 46
CHAPTER 5 47
RESULTS AND DISCUSSION 47
5.1 Ion chromatography for glyphosate and AMPA analysis 47
5.1.1 IC analysis 47
5.1.2 Results and discussion for IC analysis 47
5.2 HPLC-FD for glyphosate and AMPA analysis 50
5.2.1 Derivatization of glyphosate and AMPA 50
5.2.2 Optimization of derivatization 51
5.3 Calibration of HPLC with fluorescence detector 56
5.4 HPLC-FD reproducibility 58
5.5 Analytical column selection 58
5.5.1 C18 column 61
5.5.2 Silica-based amino column 65
5.5.3 Coupling of C18 and amino column 68
5.6 Polymer amino column for separation of glyphosate and AMPA 74
5.7 Investigation of efficacy of (SPE) in sample clean-up procedure 82
5.7.1 Strata C18-E and Strata C18-U cartridges 82
5.7.2 Sep-Pak Vac 3cc (500 mg) C18 cartridges 85
5.7.3 Oasis HLB 6cc (200 mg) SPE cartridges 86
5.7.4 Oasis MAX 6cc (150 mg) SPE cartridges 88
5.8 Analysis of environmental water samples 89
5.8.1 Levels of glyphosate and AMPA in water 92
5.9 Method validation 95
5.10 Presence of AMPA in water 96
5.11 Analytical methods employed for glyphosate and AMPA analysis 96
CHAPTER 6 99
CONCLUSIONS AND RECOMMENDATIONS 99
6.1 Removal of derivatization interferences 99
6.2 Conclusion for HPLC columns 99

10
6.3 Conclusion for IC analysis 100
6.4 Conclusion on solid phase extraction 101
6.5 Overall conclusion 101
REFERENCES 103
APPENDICES 107
Appendix A: Abbreviations 107
Appendix B: Explanation of equations used in text 109
Appendix C: Chromatograms for samples injected without being derivatized 110
Appendix D: Chromatograms for derivatized samples 113
Appendix E: Chromatograms for samples derivatized followed by SPE
Clean-up 116
Appendix F: Chromatograms for spiked samples 119
Appendix G: SPE apparatus 122
Appendix H: Manuscript to be submitted in Journal of Water South Africa 123

11
LIST OF FIGURES
Figure 1: Sources of herbicides in water 5
Figure 2: Degradation pathway of glyphosate in soil 7
Figure 3: Degradation of glyphosate in the presence of chlorine 9
Figure 4: Ionization of glyphosate 48
Figure 5:Ionization of AMPA 49
Figure 6: Derivatization reaction of both glyphosate and AMPA 51
Figure 7: A profile showing the effect of reaction time in the formation of glyphosate-
FMOC. 53
Figure 8: Calibration line of glyphosate-FMOC after optimisation of
derivatization reaction. 54
Figure 9: A profile showing the effect of FMOC-Cl concentration in the
formation of glyphosate-FMOC 55
Figure 10: Calibration line for glyphosate by HPLC-FD 57
Figure 11: Calibration line for AMPA by HPLC-FD 57
Figure 12: A chromatogram for 100 µg/l mixture of glyphosate and
AMPA after derivatizing with FMOC-Cl 60
Figure 13: Chromatogram showing separation of glyphosate on C18 column 62
Figure 14: Changes in retention time of glyphosate due to acetonitrile in
mobile phase 63
Figure 15: The response of glyphosate when using C18 column 64
Figure 16: Chromatogram showing separation of glyphosate on spherisorb
amino column 67
Figure 17: The response of glyphosate when using spherisorb (silica-based)
amino column 68
Figure 18: Schematic diagrams of column switching HPLC system 69
Figure 19: Chromatogram showing glyphosate in column switching
technique 72
Figure 20: The response of glyphosate when using column switching
technique 73
Figure 21: The separation of glyphosate and AMPA derivatives on a
polymeric amino column after the removal of FMOC-OH with ethyl acetate 76
Figure 22: The structures of amides formed at pH 10 77

12
Figure 23: Effect of acetonitrile in glyphosate elution 79
Figure 24: Effect of acetonitrile in AMPA elution 79
Figure 25: Polymer column, calibration line for glyphosate 81
Figure 26: Polymer column, calibration line for AMPA 81
Figure 27: Calibration line for glyphosate 83
Figure 28: Calibration line for AMPA 83
Figure 29: Interferences in field sample 90
Figure 30: Removal of interferences using SPE 91
Figure 31: Field samples; calibration line for glyphosate 93
Figure 32: Field samples; calibration line for AMPA 93

13
List of Tables
Table 1: Retention times vs peak areas of FMOC-glyphosate 53
Table 2: Peak areas of glyphsate-FMOC standards 54
Table 3: The effect of FMOC-Cl concentration on derivatization reaction 55
Table 4: Concentrations and areas of analytes for calibration lines 56
Table 5: Percent recoveries 58
Table 6: Effect of pH of the mobile phase on retention times 65
Table 7: Retention times of analytes using C18 column 65
Table 8: Variation of retention times with changes of % acetonitrile in
mobile phase 78
Table 9: Results for calibration lines of glyphosate and AMPA 80
Table 10: Concentrations and peak areas of analytes for calibration lines 82
Table 11: % recoveries for Strata C18 cartridges 84
Table 12: % recoveries for 500 mg C18 cartridges 86
Table 13: % recoveries obtained when spiking tap water 86
Table 14: Concentration and peak areas of analytes used for quantitative
analysis 92
Table 15: Performance of HPLC-FD for standard solutions 94
Table 16: Concentrations of analytes detected in water 94
Table 17: Concentrations of AMPA in samples not cleaned-up with SPE 95
Table 18: Results for spiked deionised water 95
Table 19: Results for spiked tap water 95
Table 20: Results for spiked Umdloti river water 95
Table 21: Summery of analytical methods used for glyphosate and AMPA
analysis 97

14
CHAPTER 1
INTRODUCTION
1.1 GENERAL DISCUSSION OF HERBICIDES
Herbicides are chemicals that are used to kill unwanted plants. They are classified into two
categories, namely, selective and non-selective herbicides [1].
• Selective herbicides are those herbicides that kill specific plants while leaving the desired
crop relatively unharmed. Some of these herbicides act by interfering with the growth of
the weed and are often based on plant hormones [1].
• Non-selective herbicides are herbicides that are used to kill all plants with which they
come into contact and these are used mostly to clear waste grounds [1].
Long-term use of herbicides (as well as pesticides and fertilizers) leads to the pollution of soil
and ground water.
1.1.1 Compounds selected for this study
The following compounds were considered for this study:
Common Name IUPAC Name
(i) Glufosinate Ammonium DL-homoalanin-4-(methyl) phosphinate
(ii) Glyphosate N-(phosphonomethyl) glycine and
(iii) Aminomethylphosphinic acid AMPA
Glyphosate and glufosinate are phosphorus containing amino acid-type herbicides. They are
broad spectrum, non-selective, post-emergence herbicides. They are extensively used in
various applications for weed control in aquatic systems and for vegetation control in non-
crop areas [2, 3].
Aminomethylphosphonic acid (AMPA) is the major degradation product of glyphosate found
in plants, water and soil; however AMPA can also originate from the degradation of
phosphonic acids in detergents [3].

15
1.1.2 Structures of selected compounds
Glyphosate
C
O
HO CH2 NH CH2 P
O
OH
OH
Glufosinate
C
O
P
O
OHHO CH
NH2 CH3
2CH CH
2
AMPA
O
HO NH22CHP
OH
1.2 Chemical properties of selected herbicides
Glyphosate and glufosinate are used in most countries. The regulatory bodies have set the
maximum contaminant levels for these herbicides in water. The levels of herbicides in water
have to be determined to ensure that water of appropriate quality is supplied for human
consumption. These herbicides are the most difficult herbicides to analyse in various matrices
such as water and soil compared to all the herbicides used in agriculture. It has been difficult

16
to obtain a simple method for the determination of these compounds at residue levels because
of their chemical properties listed below.
• They lack chemical groups that could facilitate their detection [2]
• They are very polar compounds [2]
• They have low mass [3]
• They have low Volatility [3]
• They have an ionic character [3]
• The compounds have a high solubility in water (12 g/l and 13.7 g/l being the solubility of
glyphosate and glufosinate, respectively at 250C) [4]
• They are insoluble in organic solvents [4]
• They show complexing behaviour [4] and
• They are amphoteric compounds [5]
Therefore a suitable method is needed for the analysis of these herbicides in water (dam and
river water) that can accommodate the above properties. In this project the simplest method
for the analysis of these herbicides is presented.
1.3 Historical account of the production of selected herbicides
1.3.1 Glyphosate
Glyphosate was first reported as a herbicide in 1971 and is now claimed to be the world’s
biggest selling herbicide by its manufacturer, Monsanto Company, situated in United States
of America (USA) [6]. Glyphosate is known to be highly effective in killing weeds, not
harmful to users and friendly to the members of the public and also to the environment. It is
commonly known by the trade name of Roundup in South Africa. Some other trade names
are used in different countries such as Spark in Sri Lanka and Thailand, Sunup in Indonesia,
and Glycine in Korea [7].
1.3.2 Glufosinate
It is produced by AgrEvo, a joint venture established by the German chemical corporations
Hoechst and Schering. The herbicide was first introduced into Japan in 1984. In the UK,
glufosinate was first considered as an herbicide in 1984. It was not approved then (for

17
toxicological reasons) but was given provisional approval in 1991. US registration was
achieved in 1993. The herbicide is now registered in more than forty countries and is
marketed under a number of trade names including Basta, Rely, Finale, Ignite and Challenge
[8]. The information about the usage of glufosinate in South Africa was not obtained.
1.4 Uses of Herbicides
Herbicides are used to control the growth of grasses, sedges, broadleaf weeds and woody
plants. Herbicides are also used on various crops, orchards, plantations, pastures, lawns,
gardens, forests, road verges, and water bodies. Other uses include pre-harvest desiccation of
cotton, cereals, peas, and beans [7].
1.5 Sources of Herbicides in Water
These herbicides can be directly introduced into surface water during the spraying of water
bodies such as dams and rivers to control aquatic weeds. Other sources are shown in the
following diagram (Fig. 1). The diagram shows the areas that are suspected to be the major
source of surface water contamination. The herbicides are manufactured in industries,
residues of these herbicides can be carried to the surface water during the rainy season or
residues can be carried to the waste water treatment plants, then water after treatment is sent
to the surface water possible with trace amounts of herbicides. The herbicides used in
agriculture and in road-sides can be carried to rivers due to water run-off.

18
Waste water treatment Agriculture
Surface water
Industry Roadsides
Figure 1: Sources of herbicides in water.

19
1.6 Glyphosate in Action
1.6.1 Action of Glyphosate in Plants
Glyphosate is effective in killing all plant types including grasses, perennials and woody
plants. It works by being absorbed into the plant mainly through its leaves but also through
stalk tissues. It is then transported to all other parts of the plant where it acts on various
enzyme systems. It acts in plants by interfering with the enzyme called 5-enol-pyruvyl-
shikimate-3-phosphate synthase that catalyses the sixth step in the shikimic acid pathway [6,
9, 10]. This shikimic acid pathway exists in higher plants and micro organisms but not in
animals. Plants treated with glyphosate slowly die over a period of days or weeks (generally
1-3 weeks), and because the chemical is distributed throughout the plant, no part survives [4,
6]. The action of glyphosate in plants affects both photosynthesis and respiration process [4].
1.6.2 Glyphosate in the Environment
Glyphosate is inactivated when it comes into contact with soil since it is adsorbed onto soil
particles. The mechanism of adsorption is not fully understood, but it is believed that
glyphosate binds to soil in the same way as inorganic phosphates. Un-bound glyphosate is
rapidly degraded (see Fig. 2) by microbial activity to carbon dioxide, phosphates and amino
acids whereas bound glyphosate is degraded more slowly. In some instances glyphosate is not
degraded but remains inactive in soil for several years [6]. Because of its adsorption to soil,
glyphosate is not easily leached and is unlikely to contaminate ground water. However, it is
used in water for the control of aquatic weeds, and it can be carried with eroded soil into
surface waters where natural breakdown processes are much slower. Glyphosate has been
detected in water but it is not continuously analysed due to the fact that it is difficult to isolate
it and is not considered to be a major concern as a water contaminant [6]. Glyphosate has
been found to inhibit anaerobic nitrogen fixation in soil [6].

20
C
O
H O C H 2 N H C H 2 P
O
O H
O HG ly p h o s a te( 1 )
( -O )2 P
O
C H 2N H 3+
A M P A
N H 2C H 3
( 2 ) (3 )
O C P O3H 2
M e th y la m in e F o rm y lp h o s p h o n a te
N H 4+
C
H
O
H
F o rm a ld e h y d e
( 4 )
E n z y m e (s )
T ra n s a m in a t io n
M e th y la m in e d e h y d ro g e n a s e
(1 ) (2 ) E n z y m e
(3 )(4 )
Figure 2: Degradation Pathway of glyphosate in soil [Schuette, 1998]

21
Glyphosate degrades more rapidly in soil than in water because of the large number of
microbial organisms in soil compared to water. The primary metabolite of glyphosate is
AMPA. The latter does also degrade to methyl amine and formylphosphonate (see Fig. 2),
but the degradation is generally slower than that of glyphosate. This observation may be
explained by postulating that AMPA is more strongly adsorbed by soil particles than
glyphosate and that AMPA has a lower tendency to permeate the cell walls or membranes of
micro organisms present in soil particles [11].
The rate for the degradation of glyphosate in water is slower compared to the rate of
degradation in soil [6]. Glyphosate can be reduced in the environmental water by the use of
chlorination reaction [12]. It is well known that water treatment plants are using disinfectants
to kill or inactivate pathogenic microorganisms that occur in drinking water supplies.
According to the study carried by Mehrsheikh et al [12], the chlorination of glyphosate
converts glyphosate into other compounds such as carbon dioxide and methanediol. It was
found that during the chlorination, the carboxylic acid carbon (C1) of glyphosate is
quantitavely converted into carbon dioxide. The methylene carbon (C2) is converted into
carbon dioxide and methanediol. In pH range of pH 6-9, carbon dioxide is the predominant
product; and when pH is less than 6, the predominant product is methanediol [12].
Phosphonomethylene carbon (C3) is converted into methanediol in all pH values, whereas,
the nitrogen atom is converted into nitrogen gas and nitrate; and phosphorus produces
phosphoric acid (the formation of these compounds is shown in Fig. 3) [12]. Chlorination
process can be used by manufacturers of glyphosate or waste water treatment plants to stop
glyphosate from polluting the environment, but glyphosate is widely used in rivers and dams
to kill weeds.

22
C
O
H O C H 2 N H C H 2 P
O
O H
O HG ly p h o sate
A q . C l2C
O
H O C H2 C H2 P
O
O H
O H
N
C l
C
O
C H2 N
C l
H
OP
OH O
H O
+
C O HH O
H
H
C
O
C H2 N
C l
H
OH+H 3PO 4
C O 2 + C H O O H
H
H
+ N 2 N a N O 3+
N -ch lo ro g ly p h o sa te
M e th a n e d io l A c y lp h o s p h a te in te rm e d ia te
P h o s p h o ric a c idN -c h lo ro g ly c in e
C a rb o n d io x id e
M e th a n e d io l
N itro g e n S o d iu m n itra te
Figure 3: Degradation of glyphosate in the presence of chlorine [Mehrsheikh et al, 2006]

23
1.6.3 Toxicity of Glyphosate
The toxicity of glyphosate to mammals and birds is known to be relatively low. However, its
broad spectrum of herbicidal activity has led to the destruction of habitats and food sources
[6] for some birds and amphibians leading to population reductions. Fish and aquatic
invertebrates are more sensitive to glyphosate and its formulations. Glyphosate’s toxicity
increases with higher water temperatures and higher pH values. Soil invertebrates as
springtails, mites and isopods are also affected by glyphosate. This herbicide is also toxic to a
range of bacteria, fungi, actinomycetes and yeasts. Although the toxicity of glyphosate is
relatively low, a mixture of glyphosate with the surfactant polyoxyethylene amine (POEA),
which is widely used, is more toxic [6].
1.7 Glufosinate in Action
1.7.1 Action of Glufosinate in Plants
Glufosinate is a naturally occurring compound which may be isolated from two species of
Streptomyces fungi. It inhibits the activity of an enzyme known as glutamine synthetase in
plants, which is necessary for the production of glutamine and for detoxification of ammonia
[8, 9]. The presence of glufosinate in plants leads to reduced glutamine and increased
ammonia levels in plant tissues. This causes photosynthesis to stop and the plant dies within
few days (7 to 21 days). Respiration is also affected by the use of this herbicide [4].
Glufosinate also inhibits the same enzyme in animals [8].
1.7.2 Glufosinate in the Environment
The US Environmental Protection Agency (US EPA) classifies glufosinate as being persistent
and mobile. Degradation is largely caused by microbial activity. The half life of glufosinate
has been determined in laboratory studies and varies from 3 to 42 days in some studies [8]
and up to 70 days in other studies [8]. The shortest half life tends to be in soils with a high
clay and organic matter content. In sandy soils which overlie many aquifers, glufosinate has
been found to be highly persistent due to the lack of biodegradation [8].

24
1.7.3 Toxicity of Glufosinate
Glufosinate is toxic to a number of aquatic animals including the larvae of clams and oysters,
daphnia and some freshwater fish species. The commercial formulations are more toxic that
the technical grade glufosinate [8].
There are other problems associated with the presence of organic chemicals in environmental
water, regardless of the toxicity of these organic chemicals. There is a possibility that, low
toxic compounds can contribute to the problems caused by organic compounds present in
water in some organisations such as Eskom. Eskom power stations use raw water from dams
to generate electricity. Eskom have ascertained that their raw water supplies contain high
concentration of organics (approximately 5 mg/l) [13]. Although Eskom purifies their raw
water, they do not have the guarantee that all the organics are removed during water
purification. A call for the methods of analysis of organics in water has been made. It is
necessary to be able to characterise qualitatively the total organic carbon and quantitatively
its constituent compounds present in raw water in order to understand the behaviour of
organic matter in the water treatment process. Therefore it was recognised that the presence
of organic matter contributes to the impurity of the power plant cycle chemistry [13].
1.8 Levels of herbicides set by regulatory bodies
The highest level of a contaminant that is allowed in drinking water (the maximum
contaminant level) of glyphosate for safe drinking water issued by the United States
Environmental Protection Agency (US-EPA) is 0.7 µg/ml, and currently glyphosate is on the
list of the US national primary drinking water contaminants [5, 14]. In Europe, the drinking
water standard for any pesticide has been set at a level of 0.1 µg/l [15].
The maximum contaminant levels for these herbicides have also been set for food stuffs.
These herbicides are also likely to be detected in food stuffs because genetically modified
plants such as soybeans have been recently introduced into the market [16]. These herbicides
are widely used to control weeds in areas where the genetically modified plants are planted.
The following maximum residue limits has been set by Dutch regulation for glyphosate in
food. For wheat and rye, barley and oats, mushrooms, linseed, rape seed and soybeans the
limits are 5, 20, 50, 10, 10 and 20 mg/kg respectively [16]. This is due to the fact that these

25
herbicides are non-selective and they have low toxicity to mammals compared to other
herbicides. In the European Union the maximum residue limits for the herbicide in food is
set at the level of 0.1 mg/l (ppm) [17].
South Africa has regulations governing the maximum limits for pesticide residues that may
be present in food stuffs. The maximum contaminant level for glyphosate in maize is set at
2.0 mg/kg. The maximum limit for both glyphosate and AMPA in sugar cane is 0.5 mg/kg
[18].
To the best of my knowledge, the maximum contaminant levels of glufosinate have not been
set, since this herbicide has not been used in South Africa.

26
CHAPTER 2
LITERATURE REVIEW
Glyphosate is widely used on a global scale. The low limits set by many countries for
glyphosate, AMPA and glufosinate in matrices such as water; soil and food require very
sensitive methods for the determination of these compounds residues in such matrices [3].
Several methods using a variety of analytical techniques for the separation and quantitation of
glyphosate, AMPA and glufosinate in complex matrices have been reported. Among these
methods employed by several researchers for the analysis of glyphosate, glufosinate and
AMPA, include high performance liquid chromatography [3, 15, 16, 17, 19, 20, 21, 22, 23,
24, 25], gas chromatography [9, 26, 27], ion chromatography [5, 14, 28, 29] and capillary
electrophoresis [4, 30, 31, 32, 33]. Some of these methods are reviewed in this chapter.
2.1 High Performance Liquid Chromatography (HPLC) Methods
HPLC is the method of choice for the analysis of glyphosate, AMPA and glufosinate because
of the chemical properties mentioned in chapter 1. However the detection of these
compounds with LC analysis is not very simple because they lack an inherent chromophore
or fluorophore for the detection using the common detectors such as UV and fluorescence [2,
3]. For these reasons both pre-column and post-column derivatization procedures have been
employed. The following procedures are generally used for the determination of glyphosate
with HPLC:
(i) Pre-column derivatization with 9-fluorenylmethyl chloroformate and detection using
fluorescence detector [16, 22, 24, 34, 35].
(ii) Post-column derivatization with o-phthalaldehyde and detection using fluorescence
detector [19, 20, 36].
(iii) Pre-column derivatization with p-toluenesulphonyl chloride and detection using UV
detector [17].
(iv) Pre-column derivatization with 9-fluorenylmethyl chloroformate using HPLC with UV
detection [15].
(v) Pre-column derivatization with 9-fluorenylmethyl chloroformate and detection using mass
spectrometry detector [3, 23, 25].

27
A brief review of the above HPLC procedures is presented in details below. These procedures
differ in sample preparation methods; they also differ in a way that they use different
amounts and different concentrations of derivatizing reagents. And as seen above three HPLC
detection methods have been used for glyphosate analysis. These detection methods are
fluorescence detection, UV detection and mass spectrometry detection.
2.1.1 Pre-column derivatization methods
For pre-column derivatization, 9-fluorenylmethylchloroformate (FMOC-Cl) is employed for
various reasons, namely,
(i) To form fluorescent derivatives
(ii) To improve detection of the analytes and
(iii) To reduce the polar character of the analytes thus improving the analytes
chromatographic retention [3].
The disadvantage of pre-column derivatization reaction is that FMOC-Cl reacts with the
analyte to form FMOC-analyte and FMOC-OH in the presence of water. FMOC-OH is a
highly fluorescing product, represented by a large peak in the chromatogram. The FMOC-OH
peak often masks with the analyte peak and creates difficulties in analyte detection [24].
Several methods have been reported to remove the FMOC-OH; namely, column coupling
technique and the use of organic solvents (solvent extraction) to extract FMOC-OH. The
details of these two techniques are given in the following section.
2.1.1.1 Fluorescence Detection Methods
Miles et al [35] have developed an analytical method for the determination of glyphosate and
AMPA in natural waters, namely, river water, rain water and lake water. The preparation of
samples was carried out by adding potassium hydrogen phosphate to the samples. The
samples were spiked and pre-concentrated by the use of rotary evaporation. Samples were
then derivatized with borate buffer (pH 9), acetone and FMOC-Cl for 20 minutes at room
temperature. Excess FMOC reagent and FMOC-OH were extracted using ethyl ether.
Samples were then injected into an HPLC system; the analytes were then separated in an
amino column using a mobile phase containing 75% (v/v) mixture of potassium hydrogen

28
phosphate (pH 6) in acetonitrile delivered at 1.0 ml/min. Recovery studies were performed
with samples spiked with 0.01 mg/l and 0.05 mg/l of both glyphosate and AMPA. Percent
recoveries were found to be in the range of 80 to 111%. The detection limits obtained when
using this method were 10 µg/l for glyphosate and 5 µg/l for AMPA.
An approach that uses solvent extraction for the removal of FMOC-OH was reported by
Nedelkoska et al [24]. They utilised ethyl acetate to remove FMOC-OH and used HPLC to
determine the amount of glyphosate in water and plant material after pre-column
derivatization with FMOC-Cl using single and coupled polymeric amino columns,
respectively. Derivatization of samples was done by adding FMOC-Cl solution and borate
buffer (pH 9) into the water sample. The derivatization reaction was maintained at room
temperature for 30 minutes. After derivatization of water samples the excess amount of
FMOC-Cl and FMOC-OH were removed by extracting the reaction mixture three times with
ethyl acetate before the injection of the aqueous layer into the HPLC column. The separation
of glyphosate and AMPA in water samples was achieved using a single polymeric amino
column and mobile phase (at pH 10) which contained 55% (v/v) acetonitrile and 50 mM
phosphate buffer. Rainwater samples spiked with glyphosate or AMPA at levels of 1 and 0.5
µg/l, respectively were used for validation of the method. The average recovery was 94%
with relative standard deviation of 5.4% and the method detection limit of 0.16 µg/l.
The HPLC analysis of glyphosate was also done in plant material by Nedelkoska et al [24].
Two polymeric amino columns were coupled via a switching valve to separate interfering
products from the analyte. The switching valve procedure with the coupled columns
eliminated the large interfering species from the vegetation sample extracts thus enabling the
detection of the glyphosate peak. This method was validated using grass samples spiked at
the level of 1 mg/kg and gave a detection limit of 0.3 mg/kg for glyphosate and a recovery of
82.4% with relative standard deviation of 10.3%.
Hogendoorn et al [16] reported the use of a column coupling technique for the determination
of glyphosate in cereal samples by means of pre-column derivatization with FMOC-Cl and
detection with a fluorescence detector. Their study involved the overnight extraction of
homogenized cereal sample with water, centrifugation of the sample, separation of the liquid
from the cereal powder, passage of the clear layer through a C18 solid-phase extraction
cartridge used for clean-up and collection of the eluent into a calibrated tube. Before sample

29
loading the solid phase extraction (SPE) cartridge was conditioned with acetonitrile, HPLC-
grade water and standard or sample. Then a volume of sample or standard was passed
through the SPE cartridge and collected. The collected eluent was derivatized with borate
buffer (pH 9) and FMOC-Cl solution. This reaction was carried at room temperature for 15
minutes. The solution was then diluted 16 times with borate buffer (pH 9) prior to HPLC
analysis. The latter involved a coupled column liquid chromatography with a fluorescence
detector. A mixture of acetonitrile-0.05 M phosphate buffer (35:65, v/v), pH 5.5, was used as
the mobile phase on a 30 x 4.6 mm I.D. column packed with 5 µm Hypersil ODS. This was
coupled with a 5 µm Adsorbosphere NH2 column. This method gave a limit of quantification
of 0.5 mg/kg. The method was validated by analysing spiked cereal samples. The overall
recovery of spiked samples was 86% (n = 10) with a repeatability of 6.5% and a
reproducibility of 9.5%. The method was found to be effective for grain flour samples with
aged residues stored for a period of 150 days. A throughput of at least 25 samples per day
was obtained.
Sancho et al [34] investigated the use of coupled-column liquid chromatography for rapid
determination of glufosinate in environmental water samples using 9-fluorenyl-
methoxycarbonyl pre-column derivatization and large volume injection of the samples. Their
method involved a five-fold pre-concentration of the sample where the water sample was
evaporated to dryness with a rotary evaporator using a water bath temperature of 400C.
Derivatization reaction was carried out by adding together an environmental water sample,
borate buffer (pH 9) and FMOC-Cl in acetonitrile. The mixture was swirled and the reaction
was allowed to take place at room temperature for 30 minutes. Thereafter, borate buffer (pH
9) was added with swirling to dilute the reaction mixture. A large volume injection (2 ml)
was performed into a Nucleosil C18 column. LC analysis was performed using a mobile phase
containing a mixture of acetonitrile-0.05 M phosphate buffer (pH 5.5) (35:65, v/v). The flow
rate was 1 ml/min. This mobile phase was used to rinse the Nucleosil C18 column. The
columns coupled were 30 x 4.6 mm I.D. separating column packed with 5 µm Nucleosil C18
and 250 x 4.6 mm I.D. column packed with 5 µm Adsorbosphere NH2. Adsorbosphere NH2
column was kept at 300C. The fraction of sample that has the analyte from Nucleosil C18
column was transferred to Adsorbosphere NH2 column by mobile phase. The mobile phase
containing a mixture of acetonitrile-0.1 M phosphate buffer (pH 5.5) (35:65, v/v) was used in
Adsorbosphere NH2 column. The flow rate was 1 ml/min. The method can be used for the
determination of glufosinate in environmental water samples down to a level of 0.25 µg/l. If

30
necessary the detection limit can be lowered to 0.1 µg/l by using a rotary evaporator to pre-
concentrate samples. The method has a sample throughput of about 50 samples per day. The
method was tested by spiking drinking, ground and surface water samples at levels between
0.5 and 5.0 µg/l. The average recoveries were reported to be between 90 and 105% (n = 5 for
each sample and spiked level) with relative standard deviations between 1 and 5%.
Sancho et al [22] have also investigated the use of coupled-column liquid chromatography for
the determination of glufosinate, glyphosate and AMPA in environmental water samples
using pre-column fluorogenic labelling. In their investigation the methodology had two
approaches: a multi-residue method allowing the simultaneous determination of the three
analytes in environmental water samples to a level of 1 µg/l and a single residue method that
focused on the analysis of a single analyte to the sub-µg/l level. The two approaches involved
a pre-column derivatization step with FMOC-Cl yielding highly fluorescent derivatives of the
analytes which were then determined by coupled-column LC with fluorescent detection.
• Sample preparation in multi-residue analysis method: A water sample was derivatized
with borate buffer (pH 9) and FMOC-Cl solution prepared in acetonitrile. The mixture
was allowed to stand for 30 minutes at room temperature. Thereafter it was diluted with
borate buffer (pH 9) and a large volume injection of the derivatized sample into a C18
column was performed.
• Sample preparation for a single-residue analysis method was the same: The only
difference was the concentration of FMOC-Cl used (0.1 mg/ml of FMOC-Cl in
acetonitrile was used instead of 1 mg/ml FMOC-Cl in acetonitrile).
In LC analysis, a mixture of acetonitrile and 0.05 M phosphate buffer (pH 5.5) (35:65, v/v)
was used as the mobile phase. Reversed-phase C18 column (C-1) was coupled to a weak ion-
exchange column (Adsorbosphere NH2) (C-2). The separation in the first column was used to
achieve sensitivity. By injecting large volume of samples, and using automated sample clean-
up, the less polar interferences were removed, including the excess of FMOC-OH. The
analytes were recovered from water samples at 0.50-10 µg/l fortification levels, with a
sample throughput of at least 40 samples per day. However at pH 5.5 the LC lacks the
stability of retention times for the analytes. Surface water samples spiked with 0.4 µg/l of
each analyte were used to test the single residue method. The recoveries and relative standard
deviations obtained for glyphosate, AMPA and glufosinate were 107% (RSD of 5%), 95%
(RSD of 11%) and 92% (RSD of 10%), respectively.

31
The use of coupled-column liquid chromatographic method with pre-concentration procedure
for the determination of glyphosate and AMPA residues in environmental waters was
investigated by Hidalgo et al [37]. Pre-concentration was done on an Amberlite IRA-900
resin. When water samples were passed through the resin, analytes were trapped in the resin,
which was then washed with HPLC-grade water. Analytes were then eluted with sodium
chloride. The eluted analytes were derivatized using the borate buffer (pH 9) and FMOC-Cl
reagent at room temperature for 30 minutes. The derivatized sample was then diluted with
borate buffer (pH 9) prior to large volume (2 ml) injection into LC-LC-FD. For column
coupling, a short (3 cm) C18 and Hypersil APS (amino column) columns were used. The
mobile phase in both columns was a mixture of acetonitrile and 0.05 M phosphate buffer (pH
5.5) (35:65, v/v). The LOQ for the method was 0.1 µg/l. This LOQ was improved by the
application of pre-concentration procedure on an Amberlite resin to 0.02 µg/l. The method
was validated by spiking drinking, surface and ground water samples with glyphosate and
AMPA, these samples were analysed without the pre-concentration step. Recoveries were 87-
106% with relative standard deviations being lower than 8%. Drinking and ground water
samples were spiked with glyphosate and analysed after pre-concentration on the resin.
Recoveries obtained were ranging between 94% and 105%.
2.1.1.2 UV Detection Method
This method of detection is not widely used in glyphosate analysis because of its poor
sensitivity compared to fluorescence detection method; hence little work has been done using
this detection method. To achieve a high sensitivity (when using a UV detection method), a
sample pre-concentration procedure is often required.
Khrolenko et al [17] investigated the use of HPLC with UV detector for the determination of
glyphosate and AMPA in fruit juices using supported-liquid membrane pre-concentration
method after derivatization with p-toluenesulphonyl chloride. In their work, supported-liquid
membrane technique was used for the extraction of glyphosate and AMPA from fruit juices
such as orange, grapefruit, apple and blackcurrant. As part of method development, water
samples were spiked with both glyphosate and AMPA. The pH was adjusted to pH 11 with
sodium hydroxide. A sample solution was pumped through the donor channel of the
supported-liquid membrane. The acceptor phase consisting of sodium chloride or

32
hydrochloric acid was circulated in the acceptor channel with the same flow-rate as the donor
phase during the extraction. After the extraction, the acceptor phase was neutralised to pH 7
with concentrated potassium hydroxide solution and then derivatized. Juice samples were
spiked with 1 mg/ml of glyphosate and AMPA and centrifuged to remove solid particles. The
samples were then filtered and treated using the same procedure as for water samples.
Derivatization reaction was carried out by adding together the acceptor phase, phosphate
buffer (pH 11) and p-toluenesulphonyl chloride solution (prepared in acetonitrile). This
solution was then heated in a water bath at a temperature of 500C. The resulting solution was
injected into an HPLC column. A C18 column was used for the separation of compounds. The
mobile phase was a mixture of 0.06 M KH2PO4 buffer (adjusted to pH 2.3 with H3PO4) and
acetonitrile (85:15, v/v). Elution was monitored at a wavelength of 240 nm. This method
allowed the detection of both analytes in fruit juices at concentrations as low as 0.025 mg/l.
The recoveries for glyphosate were 71.1, 72.1, 93.6 and 102.7% and for AMPA were 64.1,
64.6, 81.7, and 89.2% for orange, grapefruit, apple and blackcurrant juices, respectively.
Peruzzo et al [15] have investigated the use of UV detection with HPLC for the determination
of glyphosate in surface waters, sediments and soil after pre-column derivatization with
FMOC-Cl. For sample preparation, the extraction in soil and sediment samples was carried
out by adding potassium dihydrogen phosphate solution into the samples followed by
centrifugation. The extraction was repeated twice on solid residues, and then the extracts
were filtered. The derivatization procedure for all the samples (water, soil and sediments) was
the same. Derivatization was carried out by adding borate buffer (pH 9) and FMOC-Cl
solution prepared in chloroform into the sample. The reaction was carried out for 24 hours at
400C in the dark. After 24 hours the reaction was stopped by the addition of phosphoric acid
into reaction vessel and the derivatized glyphosate was injected into the HPLC. C18 column
was used for the separation, with a mobile phase containing a mixture of 0.05 M phosphate
buffer (pH 5.5): acetonitrile (65:35, v/v). The flow rate was set at 0.8 ml/min and the
detection was done at 206 nm. The levels of glyphosate in surface waters ranged from 0.1 to
0.7 mg/l, while in sediments and soil the levels were between 0.5 and 5.0 mg/kg. The method
gave a limit of quantitation (LOQ) of 0.1 mg/l and limit of detection (LOD) of 0.04 mg/l for
water samples, and LOQ of 0.25 mg/kg and LOD of 0.1 mg/kg for sediment and soil samples.
Recoveries of 86% were obtained for glyphosate in water.

33
2.1.1.3 MS Detection Methods
Ibanez et al [3] studied the use of liquid chromatography coupled to electrospray tandem
mass spectrometry (LC-ESI-MS/MS) for the selective determination of glyphosate,
glufosinate and AMPA residues in water and soil samples.
• Water samples were collected in plastic bottles and stored in a freezer before the analysis.
Derivatization was carried out by adding to a water sample, an isotope labelled
glyphosate (internal standard), borate buffer (pH 9) and FMOC-Cl reagent. The reaction
was carried out overnight at room temperature. The samples were acidified with
hydrochloric acid to pH 1.5. The acidified derivatized samples were injected directly into
an on-line solid phase extraction (SPE)-LC-ESI-MS/MS system using an Oasis HLB
cartridge column for SPE and a Discovery chromatographic column (C18), for separation
of analytes.
• Soil samples were extracted with potassium hydroxide. The extracts were 10-fold diluted
with water and derivatized as water samples. The derivatized samples were injected into
the LC-MS/MS system without pre-concentration via an a SPE cartridge.
The Oasis HLB SPE cartridges were conditioned with LC-grade water at pH 2.5. The method
was validated through spiking and recovery studies. Water samples were spiked at 50 and
500 ng/l, and the soil samples were spiked at 0.05 and 0.5 mg/kg. In water samples, the mean
recoveries were ranging from 89 to 106% for glyphosate (RSD < 9%), from 97 to 116% for
AMPA (RSD < 10%), and from 72 to 88% for glufosinate (RSD < 12%). In soil samples, the
mean recoveries were ranging from 90 to 92% for glyphosate (RSD < 7%), from 88 to 89%
for AMPA (RSD < 5%), and from 83 to 86% for glufosinate (RSD < 6%). The detection
limits for this method were as low as 5 ng/l in water and 5 µg/kg in soil.
Vreeken et al [25] developed a fully automated on-line solid-phase extraction-high
performance liquid chromatography-electrospray ionization mass spectrometry (SPE-HPLC-
ESI-MS-MS) method for the determination of glyphosate and AMPA in water. In their
investigation, water samples were collected in polypropylene bottles and stored in a freezer at
-200C before the analysis. Derivatization was carried out by adding FMOC-Cl solution to the
sample together with borate buffer and the reaction was allowed to take place overnight at
370C. The reaction was stopped by adding phosphoric acid. The derivatized sample was
passed over PLRP-s pre-concentration column then to the HPLC column and finally to an MS

34
for analysis. For HPLC, aqueous ammonium acetate (5 mM)-acetonitrile mobile phase and a
250 x 4.6 mm Inertsil column were used. Gradient elution was used in this investigation. The
detection limits for both analytes were as low as 0.03 µg/l. Recoveries of 96% and relative
standard deviations for repeatability of less than 8.4% were obtained. The method was
developed for the drinking and surface waters but it can also be used for the determination of
glyphosate and AMPA in waste water.
Ghanem et al [23] have developed an LC-MS method for the determination of glyphosate and
AMPA in sewage sludge. For sample preparation, analytes were extracted with sodium
hydroxide from a sludge sample and purified on a strong anion-exchange resin (AG-1 x 8
SAX). AG-1 x 8 SAX resin was packed in a 300 mm x 10 mm column using ultra pure water
(pH 9). Sewage sludge sample was percolated through the resin and water was used for
rinsing the resin. For derivatization, the resin was conditioned with a mixture containing 25
mM borate buffer (pH 9.2) / acetonitrile (30:70, v/v). Then the same mixture plus 20 mg of
FMOC-Cl was added to the resin. Trapped analytes and FMOC-Cl were allowed to react for
10 minutes. The resin was reconditioned with a mixture containing borate buffer (pH 9.2 /
acetonitrile (50:50, v/v). Then another FMOC-Cl in mixture was loaded to complete
derivatization. The analytes were then eluted with a mixture containing sodium chloride /
acetonitrile (70:30, v/v) at pH 5 and recovered into water at pH 3. The pH of the sample was
then adjusted to pH 3 using hydrochloric acid. The sample was then pre-concentrated using
an Oasis HLB SPE cartridge. Prior to the pre-concentration step, the Oasis HLB cartridge
was conditioned with methanol followed by water and phosphate buffer (pH 3). The sample
was then loaded, followed by rinsing of the cartridge with water which was dried under
nitrogen. The analytes were eluted from the cartridge with methanol and concentrated under
nitrogen prior LC analysis. For LC-MS/MS determination, the compounds were separated on
a Discovery HS C18 column with a mobile phase consisting of 5 mM ammonium acetate
buffer and acetonitrile at a flow rate of 0.15 ml/min at 240C. A gradient from 20% to 100% of
acetonitrile was used within 12 minutes, and the final composition was maintained for 4
minutes. This method [23] was applied in the monitoring of sewage sludge contamination for
a period of 1 year in France. The method gave the LODs of 20 and 30 µg/l, for glyphosate
and AMPA respectively.
35
2.1.2 Post-column derivatization methods
In post-column derivatization, the analyte is normally derivatized with o-phthalaldehyde
(OPA) and mercaptoethanol [3, 24] or with OPA and N,N-dimethyl-2-mercaptoethylamine
[3]. Literature indicates that post-column derivatization procedure has been used for the
determination of glyphosate in water. It has been approved by the US EPA [24]. This method
has also been recommended for the determination of glyphosate in foodstuffs and the method
is currently used in USA as an EPA method for the determination of glyphosate in drinking
water [24]. A disadvantage of using this derivatization procedure is that OPA reagent can
only react with a primary amine. Glyphosate being a secondary amine requires a hydrolysis
step prior to the post-column OPA reaction [24]. As a consequence of this, more
instrumentation is required to effect the determination of glyphosate and AMPA in water.
Three studies using OPA as a post-column derivatization reagent are summarised below.
Abdullah et al [19] has determined glyphosate and AMPA in water using HPLC with post-
column derivatization and a fluorescence detector. Water samples (after filtration) were
extracted with dichloromethane to remove organic compounds. The aqueous phase which
contained analytes was concentrated by rotary evaporation and the pH was adjusted to 10
with sodium hydroxide. The sample was passed through a Supelclean cartridge with an
additional of Bio-Rad SAX resin in the hydroxide form packed on top of the Supelclean
packing. The cartridge was then washed with deionised water to remove interferences and the
analytes were eluted with sodium citrate buffer at pH 5.0. The analytes were determined by
HPLC using a cation-exchange column. During the HPLC analysis, glyphosate was oxidized
with calcium hypochlorite in the post-column reactor coil at 480C to form glycine. Glycine
was reacted with OPA in the presence of mercaptoethanol (MERC) in the second coil to form
a fluorophore at ambient temperature and was detected with a fluorescence detector. A
switching valve was used to cause AMPA to by-pass the calcium hypochlorite and undergo
reaction with the OPA-MERC reagent. When a switching valve was not used, it was observed
that the calcium hypochlorite solution resulted in a decrease of the AMPA signal. The
method detection limits were less than 2 µg/l and the average recoveries were >85% for both
compounds.
An investigation based on analysis and degradation study of glyphosate and AMPA in natural
waters by means of polymeric and anion-exchange solid-phase extraction columns followed

36
by ion-chromatography-post-column derivatization with fluorescence detection was
conducted by Mallat et al [20]. In their study, the water sample was pre-concentrated by a
two step procedure: In the first step, sample was percolated through a polymeric cartridge
then through an anion-exchange column mechanism. For the first step, a Lichrolut EN SPE
cartridge was used; it was conditioned with methanol followed by HPLC-grade water. The
sample was percolated through the cartridge and collected. For the second step, a strong
anion-exchange column was packed with Amberlite IRA 410, in the hydroxide form. Anion
exchange column was conditioned with water followed by the percolation of water sample
through the cartridge and elution with sodium citrate solution. The analytes were analysed by
ion-exchange chromatography using a cation-exchange column and a mobile phase of
potassium dihydrogen phosphate followed by post-column reaction with OPA followed by
fluorimetric detection. This method gave them detection limits of 2 µg/l for glyphosate and 4
µg/l for AMPA. In a degradation study, Mallat et al [20] found that the degradation is
affected by the microbial activity, temperature and photolysis.
The investigation carried out by Wigfield et al [36] was based on liquid chromatographic
determination of glyphosate and AMPA residues in environmental water using post-column
fluorogenic labelling. Environmental water samples were filtered and washed with methylene
chloride. The organic layer was discarded and the aqueous layer was transferred to the anion-
exchange column. The analytes were eluted from the column by gravity with potassium
citrate solution (pH 5) and injected into the LC column. Ion-exchange column
chromatography was coupled with post-column ninhydrin derivatization and absorbance
detection at 570 nm. The validation of the method was carried out by spiking environmental
water samples with glyphosate and AMPA at the levels of 6-60 µg/l (glyphosate) and 1-10
µg/l (AMPA). The average recoveries were ranging from 84% to 89%. The detection limits
were 1.04 µg/l and 0.39 µg/l for glyphosate and AMPA, respectively.
2.2 Gas Chromatography (GC) Methods
Because of the properties of glyphosate, glufosinate and AMPA, GC is not widely used for
the analysis of these compounds. When GC is used, it is performed after an extensive
derivatization procedure that converts the analytes into sufficiently volatile and thermally
stable derivatives [17]. The polar nature and high water solubility of both glyphosate and
glufosinate limit the possibility of using the standard derivatization techniques generally

37
employed in GC analysis [26]. Therefore the derivatization involves the use of trifluoroacetic
anhydride (TFAA) and trifluoroethanol, TFAA and diazomethane or heptafluorobutyric
anhydride (HFBA) and 2-chloroethanol. The use of mixtures of fluorinated anhydrides and
perfluorinated alcohols, such as TFAA and heptafluorobutanol, give derivatives of glyphosate
that can be detected by GC-MS with high sensitivity and selectivity [26].
Kataoka et al [9] have developed a method that is based on the determination of glyphosate,
glufosinate and AMPA in river water, soil and carrot samples by gas chromatography with
flame photometric detection. 4-aminobutylphosphonic acid (ABP) was used as an internal
standard, during the gas chromatographic analysis. Samples were prepared as follows:
• Water Samples: The samples were filtered and derivatized for GC analysis.
• Soil Samples: The internal standard was added to the soil sample and the analytes were
extracted three times with sodium hydroxide followed by centrifugation. The supernatants
were combined and made up to volume with distilled water before the derivatization prior
to GC analysis.
• Carrots Samples: The internal standard was added to the carrot sample. The sample was
homogenized in water, centrifuged and the precipitate was re-extracted two times with
distilled water. The supernatants were combined and made up to volume with distilled
water before the derivatization prior to GC analysis.
After the analytes have been extracted from water, soil, and carrot samples, they were
derivatized into their N-isopropoxycarbonyl methyl esters using isopropyl chloroformate and
diazomethane at room temperature. The derivatives were sufficiently volatile and stable
within 20 minutes. The solvents were evaporated to dryness and the residue was dissolved in
ethyl acetate and injected into the GC column. The column used in GC was a fused silica
capillary column. The detection limits were 8, 12, 20 µg/l for AMPA, glyphosate and
glufosinate respectively. The recoveries of the compounds in all samples were in the range of
91-106%.
Borjesson et al [27] have developed a method for the determination of glyphosate and AMPA
in ground water and soil using a GC-MS.
• Treatment of ground water samples: pH of Ground water samples was adjusted to pH 2.
The acidified ground water sample was applied on the Chelex column. The column was
washed with water followed by diluted hydrochloric acid. The analytes were eluted from

38
the Chelex column with concentrated hydrochloric acid (HCl). The analytes were then
passed through an AG 1-X8 column. AG 1-X8 column was prepared by adding an AG 1-
X8 gel, chlorine form, into a polypropylene tube. After the gel has settled inside the tube,
portions of both dilute and concentrated HCl were added and passed through the column
by gravity. The analytes were eluted from the AG 1-X8 column with HCl. The sample
was then evaporated to dryness; the residue was dissolved in a mixture of water-
methanol-HCl and derivatized.
• Treatment of soil samples: Soil samples were extracted with sodium hydroxide and
centrifuged before filtration. The pH of the sample was adjusted to 2.0 and treated
identically to the water samples.
Samples were derivatized with trifluoroacetic anhydride and trifluoroethanol at 1000C for one
hour. Samples were acclimatised to room temperature, evaporated and re-dissolved in ethyl
acetate prior to GC-MS analysis. The analytes were separated on a fused silica capillary
column and MS was used for the detection. The limit of detection was 0.05 µg/l in ground
water and 0.003 µg/g in soil for both glyphosate and AMPA. The limit of quantification was
0.1 µg/l for ground water and 0.006 µg/g for soil.
2.3 Ion Chromatography (IC) Methods
This is a technique introduced in the mid-1970’s and it has been a useful tool for detecting
ionic substances, and the hydrophilic substances (e.g. glyphosate) [28]. Very few detection
methods for glyphosate and AMPA without derivatization have been reported.
You et al [5] have reported the use of ion chromatography with condensation nucleation light
scattering detection (IC-CNLSD) method for the direct analysis of glyphosate and AMPA in
water samples without the need for sample pre-treatment and derivatization. The
environmental water samples were collected, filtered through 0.45 µm filters and injected
directly into the cation-exchange column. Glyphosate and AMPA were separated using two
100 x 4.6 mm I.D. cation-exchange columns packed with polybutadiene-maleic acid-coated
silica (µm) connected in series. The separation was performed at room temperature with
nitric acid as the eluent at the flow rate of 0.5 ml/min. This method (IC-CNLSD) gave a limit
of detection of 41 µg/l for glyphosate and 53 µg/l for AMPA. An application of the method
was conducted on tap water and lake water, but both analytes were not detected.

39
Zhu et al [28] have developed a suppressed conductivity ion chromatography method for the
analysis of glyphosate in water. The water samples were filtered and extracted with
dichloromethane to remove organic interferences. The aqueous phase which contained the
analyte was concentrated to a small volume by rotary evaporation and injected to the IC. The
ion chromatography system was equipped with AS4SC separation column and a conductivity
detector. The eluent contained a mixture of 9 mmol/l sodium carbonate (Na2CO3) and 4
mmol/l sodium hydroxide (NaOH) was used at a flow rate of 1.5 ml/min. The relative
standard deviation for 9 injections was 0.49% and the recovery was in the range of 96.36 to
103.18% when the sample was spiked at the level of 1-50 µg/ml-1. The method was linear in
the range of 0.042 – 100 µg/ml. The limit of detection was 0.042 µg/ml when using the signal
to noise ratio of 3. The method was used for the determination of glyphosate in lake water
with no glyphosate detected.
In terms of sensitivity, the above IC methods are not good enough for the quantitative
analysis of these herbicides at low levels.
Guo et al [14] have investigated the use of ion chromatography coupled with inductively
coupled plasma - mass spectrometry detection for the determination of glyphosate and
phosphate in water. In their study, water samples were filtered and injected into the LC
module without any further treatment. A polymer anion-exchange column (Dionex IonPac
AS16, 4.0 mm x 250 mm) was used for the separation of the analytes and the eluent used was
citric acid. After the analytes were eluted from the column, they were directly detected by
ICP-MS at m/z = 31. The detection limits were 0.7 µg/l for both analytes. The recoveries
were in the range of 97.1 to 107.0% and relative standard deviations of ≤7.4% (n=30) were
obtained. The sensitivity of glyphosate obtained in Guo et al [14] study was much higher than
the sensitivity obtained when using ion chromatography with suppressed conductivity
detector, study done by Zhu et al [28].
Bauer et al [29] have studied the method of analysis for glyphosate, AMPA and two other
polar organic micro-pollutants namely ethylenediamine tetraacetate (EDTA) and
diacetonketogulonic acid (DAG) in water using ion chromatography with electrospray mass
spectrometry detection. In their investigation, the water sample was directly injected into an
anion exchange column without any further sample preparation step except filtration. Two
eluents were prepared; eluent A was a mixture of 1.3 mmol/l of disodium carbonate and 2.0

40
mmol/l of sodium hydrogen carbonate (pH 10.30), and eluent B was a mixture of 13 mmol/l
of disodium carbonate and 20 mmol/l of sodium dihydrogen carbonate (pH 10.08). The
gradient program was started with 95% of eluent A and 5% of eluent B, held for 10 minutes.
For the following 20 minutes, eluent A was reduced to 50% and after 5 minutes the eluent A
was adapted again to the starting conditions and the stationary phase was equilibrated for 5
minutes before the next injection. The analysis of these polar organic micro pollutants in
ground and surface water has been achieved in this investigation without additional sample
preparation at a concentration level of 1 µg/l.
2.4 Capillary Electrophoresis (CE) Methods
Some researchers have published some work that is based on the determination of glyphosate
and AMPA in water using capillary electrophoresis [4, 30, 31, 33].
Cikalo et al [30] have developed a method for the analysis of glyphosate and AMPA in water
using CE with indirect UV detection because the analytes had no significant UV absorbance.
The method was based on the separation of glyphosate and AMPA. Glyphosate and AMPA
were separated within 4 minutes using pH 7.5 with phthalate as supporting electrolyte and
containing tetradecyltrimethyammonium bromide (TTAB) as an electro-osmotic flow
modifier. The limit of detection for glyphosate was found to be 0.8 µg/ml and a linear
response was found in the calibration range of 1.7 – 170 µg/ml for glyphosate and 1.1 – 110
µg/ml for AMPA.
Chang et al [4] have investigated a CE method for the analysis of glyphosate, AMPA and
glufosinate using indirect fluorescence detection. Since there are no fluorophores in the
analytes, fluorescein was employed as the buffer fluorophore and an argon-ion laser was used
to induce the fluorescence background. The analytes were separated within 5 minutes with a
fluorescein solution at pH 9.5. Detection limits for all three analytes were reported to be in
the µM range. After the method has been developed it was applied in the commercial
herbicide analysis. It has been reported [4] that the developed method can be applied to the
direct analysis of glufosinate and AMPA in ground water but the application for the direct
analysis of glyphosate in ground water was found to be problematic. Chang et al [4] have also
reported that their method can be applied for the quality control of herbicide products.

41
Corbera et al [31] have reported a sample pre-concentration method for CE analysis of
glyphosate and AMPA in natural water. The method was investigated to improve the
sensitivity in the analysis of both glyphosate and AMPA using a slightly modified method
published by Cikalo et al [30]. The analytes were pre-concentrated using a strong anion-
exchange resin (Amberlite IRA-900). After the resin was rinsed with water, a water sample
spiked with both glyphosate and AMPA was loaded onto the resin. Interfering matrix
components were removed from the resin with ultrapure water and analytes were eluted with
sodium chloride. Eluted analytes were analysed using CE method developed by Cikalo et al
[30]. Recoveries ranging from 84% to 87% for glyphosate and from 85% to 98% for AMPA
were obtained with RSD of <6% for glyphosate and RSD <5% for AMPA. The method
allowed the determination of 85 ng/ml of glyphosate and 60 ng/ml of AMPA. The effect of
salt content in samples on extraction efficiency was investigated and a linear relationship was
established for AMPA with R2 = 0.996. A comparison of the investigated method and an
HPLC method with UV-vis detection and pre-column derivatization with p-toluensulphonyl
chloride was carried out. No differences in results were found (using t- and f- statistical tests).
Jiang et al [33] have investigated the use of solid phase extraction (SPE) technique for the
pre-concentration of the herbicide glyphosate for analysis by CE. The work involved the
clean-up of the sample using an SPE cartridge containing 300 mg of a mixture of strong base
anion exchange resin (chloride form) and strong acid cation exchange resin (hydrogen form)
at a mass ratio of 60:40. The spiked river water sample was then pre-concentrated using a 200
µl micro-pipette tip packed with 50 mg of Bio-Rad AG-X8 anion exchanger beads.
Glyphosate was eluted with hydrochloric acid at a flow rate of 0.1 ml/min. The effluent was
collected in a borosilicate glass vial for derivatization. Glyphosate was converted into glycine
with sodium borate buffer (pH 10.4) and calcium hypochlorite solution. The mixture was
placed in a 600C water bath for 5 minutes, then sodium cyanide and naphthalene-2,3-
dicarboxaldehyde were added. The mixture was allowed to react in the dark at room
temperature for 3 minutes, before the CE analysis. The separation was performed at 12 kV
across a 37 cm long fused capillary using 50 mM SDS and 20 mM sodium borate pH 9.3
running buffer. The limit of detection for glyphosate was 0.04 nM.
A method for the analysis of glyphosate and AMPA in soya beans has been reported by Chiu
et al [32]. The method is based in a capillary electrophoresis coupled with
electrochemiluminescence (ECL) detection. Soya bean samples were milled to powder form

42
and extracted with water. Acetonitrile was added to precipitate the proteins followed by
centrifugation. The supernatant obtained after centrifugation was filtered and injected into
CE-ECL. The method was tested by analyzing glyphosate in both transgenic and non
transgenic soybeans. Glyphosate was not detected in both transgenic and non transgenic
soybeans. The samples were then spiked with 12 µg/g of glyphosate. The recovery was 92.7
± 3.5% (n =3) and the limit of detection for glyphosate in soybean was 0.6 µg/g.
2.5 Aims and Objectives of this project
In the light of the very brief survey above, this research was undertaken to:-
• Develop a rapid method for sample preparation.
• To overcome the problems encountered in the analysis of glyphosate and AMPA using
HPLC and fluorescence detection.
• Determine a sensitive and rapid method for the analysis of both glyphosate and AMPA in
water.
• Use the above method for the determination of concentrations of glyphosate and AMPA
found in water samples from dams and rivers.
The work was also motivated by the need to have a method that is within the ambit of the
expertise and affordability of laboratories charged with monitoring residual glyphosate in
drinking water supplies. At early stages of this research glufosinate was considered as target
analyte. However, the analysis of glufosinate was not pursued further due to the difficulty of
separating it from the other two analytes.

43
CHAPTER 3
PRINCIPLES ON WHICH THE CHOSEN TECHNIQUES ARE BASED
This chapter will discuss all the techniques and instruments used when carrying out this
investigation, theory of each technique and instrument. The details about the experimental
procedures and the use of techniques will be explained in this section.
3.1 High Performance Liquid Chromatography
3.1.1 Introduction to HPLC
Liquid Chromatography (LC) is a separation technique based on a different distribution rate
of sample components between a stationary phase and a liquid mobile phase. HPLC is the LC
technique with the ability to separate sample compounds in a given time with a given
resolution [38]. The selectivity of HPLC technique is based on the different types of
stationary phases and on the mobile phase. The basic liquid chromatograph consists of six
basic units, namely, the mobile phase supply system, the pump and programmer, the sample
valve, the column, the detector and finally a means of presenting and processing the results.
3.1.2 Basic components of HPLC
3.1.2.1 The mobile phase supply system
The mobile phase is the liquid that plays an important part in the chromatographic system by
carrying the sample solutes (glyphosate and AMPA derivatives) through the stationary phase.
The liquid mobile phases are used to adjust the chromatographic separation and retention in
liquid chromatography. The mobile phases are usually stored in solvent reservoirs depending
on properties of the eluent to be used. Special solvent reservoirs are available such as, brown
laboratory bottles for light-sensitive eluents and for inorganic ions, polyethylene containers
are used because additional inorganic ions may be dissolved from the glass material [38].

44
3.1.2.2 The pump and programmer
The pump is responsible for the constant flow of the mobile phase, which is necessary for the
quantification and reproducibility of an analysis. Pumps are used to pump the mobile phase
from solvent reservoirs to the various parts of the instrument. Good pumps should be able to
deliver a solvent at a flow rate of up to 10 ml/min. They should be equipped with high and
low pressure limits. To avoid damage, the pump or column should be chemically inert. The
pump heads should not warm up to avoid the evaporation of the solvents and bubbles [38].
3.1.2.3 The sample valve
This is the valve that operates in the loop filling mode. The sample is usually injected into the
column while the system is at high pressure. The sample is injected into a sample loop (20
µl). While the sample is injected, the mobile phase at high pressure moves through the
sample valve directly to the column. Then the valve is rotated (so that the mobile phase
passes through sample loop), sweeping the sample into the column. 0.02 ml to 5 ml sample
loops are available commercially [38, 39].
3.1.2.4 The column
The column is part of the instrument where the separation of the sample components injected
into the HPLC takes place. Usually for complex matrices, a special separation technique
called column switching or column coupling is used.
Column Switching Technique
This is the coupling of two columns usually with different selectivities by means of manual
or automatically driven high pressure valve. Column switching is widely used in the analysis
of very complex samples (example, drug analysis in blood). In column switching technique,
analytes are selectively removed from the sample matrix. This technique is applied in on-line
sample cleanup, backflush technique, and multidimensional chromatography [38]. In column
coupling technique the switching valve is very important. It must work reliable under high
pressures and must be chemically inert to the sample and the mobile phase.

45
This technique is very suitable for sample cleanup. For example, for this research it is used
for the determination of glyphosate and AMPA in water after precolumn derivatization with
FMOC-Cl. During the derivatization process, it was observed that the derivatizing reagent
(FMOC-Cl) is very reactive, in aqueous solution it rapidly gets converted into FMOC-OH
and the derivatization procedure always provides a large excess of flourogenic FMOC
interferences and FMOC-glyphosate (analyte) [16]. These FMOC interferences are easily
removed when using the column coupling technique, coupling of C18 column with amino
column was previously reported [16]. The analyte, glyphosate derivative, has a little retention
on C18 column and adequate retention on amino column. The clean-up is obtained by
transferring unretained analyte to amino column. All interferences with more C18 retention
(example, FMOC-OH) are retained on C18 column and sent to waste by the rinsing mobile
phase during the separation of the analyte on the amino column [16].
3.1.2.5 The detector
The detector works by detecting every component of the sample eluted from the separation
column. A good detector in the HPLC should have the following characteristics:
• High sensitivity
• Good selectivity
• Fast response
• Wide range of linearity
• No contribution to column band broadening
Depending on the properties of the analytes, the following detectors are used in HPLC [38,
39]:
• Refractive index
• UV-Vis absorption
• Diode-array
• Mass spectrophotometer (MS)
• Fluorescence
• Evaporative light scattering detection (ELSD)

46
Glyphosate, AMPA and glufosinate are the examples of the compounds in which UV-Vis
absorption, mass spectrophotometer and fluorescence detector can be used for their analysis
after derivatization of analytes. These compounds have to be derivatized before being
detected by UV, MS and fluorescence detectors. In this research the main detector used is
fluorescence detector, therefore the principle of operation of fluorescence detector is
explained below.
3.1.3 Fluorescence detector
3.1.3.1 Introduction to fluorescence detection
When light is emmited by molecules that are excited by electromagnetic radiation, the
phenomenon is called photoluminescence. If the release of electro-magnetic energy is
immediate, or stops on the removal of the excitation radiation, the substance is said to be
fluorescent. Fluorescence detector is used to monitor the fluorescing substances and is widely
used in trace analysis because it provides high selectivity and sensitivity. Due to the fact that
only few compounds are able to fluoresce, resulting in a high selectivity [38].
3.1.3.2 Principles of operation of fluorescence detectors
Fluorescence involves the emission of radiation from a molecule which has attained an
excited electronic state after the absorption of radiation. Fluorescence process involves
excitation and emission step, and this process in explained below.
In excitation step, absorption of a photon causes the solute molecule to move to an excited
electronic state and this absorption results in the transition of the solute molecule from its
ground singlet to its first excited singlet state. In most cases the absorbed energy will become
dissipated through a series of vibrational transitions which will result in the production of
heat. This process occurs when the energy levels for the excited and ground states overlap.
When there is no overlap between energy levels the most convenient method by which the
excited molecule can lose energy is through the emission of a photon [40].
In the fluorescence detector, the sample that passes the detector cell is irradiated by a beam of
light with a certain intensity I0 and excitation wavelength. Flourescing solutes are able to emit

47
radiation with a characteristic wavelength which converted into an electric signal and
recorded. The emitted radiation is not monochromatic, therefore a monochromator needs to
be inserted into the beam in order to enhance selectivity [38]. The fluorescence radiation is
emitted in all directions and the detectors are usually operated in a right angle configuration.
A lamp (xenon or deuterium source) passed radiation through a monochromator (excitation
monochromator) into the flow cell through which the column effluent passes. Fluorescence
radiation is collected at right angles to the excitation beam, where it is passed through a
second monochromator (emission monochromator), and then to a photomultiplier [40].
To produce more fluorescing analytes, pre- or post column derivatization is needed [38].
3.1.4 Derivatization
3.1.4.1 Introduction to derivatization process
Although there is a wide range of separation and detection systems available in HPLC, there
is still arise the cases where either the selectivity or sensitivity of a particular analysis may be
considered in adequate and in such cases derivatization is necessary [40]. The aims for the
derivatization of analytes are stated below:
• Improvement in the detectability of the analyte(s)
• Improvement of the resolution of the analyte(s)
• Establishment of solute identity
• Improvement of the selectivity of the analyte in a complex matrix
• Improvement of the chromatographic behaviour such as peak shape of the analyte
• Improvement of the stability of the analyte during chromatography
• Achievement of more desirable physical properties of the analyte.
The derivatization of the analyte can be performed in two ways; before (pre-column
derivatization) the chromatographic separation column or after the chromatographic
separation column (post-column derivatization) [40].

48
3.1.4.2 General Introduction to Pre-column Derivatization
There are no restrictions on reaction kinetics provided that a complete reaction can be
achieved in a reasonable time. There is a choice of changing reaction conditions to optimize
reaction time and yield. The solvent that is incompatible with the chromatographic mobile
phase may be used provided that this solvent is removed before the injection. This reaction
also forms excess reagents and byproducts; these can be separated from the analyte either on
the chromatographic system or by using a pre-chromatographic clean-up step. Each sample is
handled individually. An internal standard should be used in cases where the derivatization
reaction is incomplete [40].
3.1.4.3 General Introduction to Post-column Derivatization
The derivatization reaction should be reproducible without the necessity of being
quantitative. Sample preparation is limited. Accuracy and precision of the derivatization can
be enhanced through automation of the derivatization procedure. The choice of reaction
conditions is limited because the derivatization must be carried out in the chromatographic
mobile phase. Band broadening usually occurs, leading to loss of chromatographic resolution.
Additional equipment is required to perform this reaction such as post-column reactor [40].
3.2 Ion Chromatography (IC)
3.2.1 Introduction to IC
Separation of ionic solutes is an important and rapidly growing field in analytical chemistry
nowadays. Ion chromatography is a chromatographic technique that is used to determine all
ions which carry one or two charges. The technique can be used for the analysis of anions,
cations, organic acids and amines plus analytes such as carbohydrates. This technique has
been used in many important fields such as the following:
• The routine investigation of aqueous systems such as drinking water, rivers, effluents and
rain water.
• For the analysis of ions in chemical products, foods, cosmetics, pharmaceuticals etc.
• Ultra-trace analysis such as in the semi-conductor and power industry [41].

49
The ion-exchange is divided into two main groups namely non-suppressed ion
chromatography and suppressed ion chromatography.
• Non-suppressed IC comprises those methods in which an ion-exchange column is used to
separate a mixture of ions, with the separated solutes being passed directly to the detector.
• Suppressed ion chromatography contains an additional device called suppressor. This
device is inserted between the ion-exchange separator column and the detector. The
function of the suppressor is to modify both the eluent and the solute in order to improve
the detectability of the solutes with a conductivity detector. The suppressor requires a
regenerate (or scavenger) solution to enable it to operate for extended periods [40].
3.2.2 Separation in IC
The separation of the solutes is performed as ions using an ion exchange resin or bonded
silica, or it is possible to convert the ions to polar molecules and separate them on a reverse
phase system [41].
3.2.3 Mechanism of suppression in IC
In the case of anion-exchange separations, cations from the eluent are replaced by hydrogen
ions from the suppressor which, in turn, react with the eluent anion to form an undissociated
weak acid. In the case of cation-exchange separations, anions from the eluent are replaced by
hydroxide ions from the suppressor, which in turn react with the eluent cation to form an
undissociated weak base. Solute ions which are the conjugate of strong acids or bases do not
react under these conditions, but the exchanged hydrogen ion or hydroxide ion is eluted with
the sample band and thereby increases its conductance. The suppressor reduces the
background conductance of the eluent and simultaneously enhances the detectability of the
solute ions [40].
3.2.4 Ion Chromatographic Detection
The detection is commonly performed by using conductivity, UV absorption, refractive index
or electrochemical detection [41]. Conductivity is a good general purpose method; the others

50
usually exhibit high sensitivity for a reduced number of ions and so tend to be used as
selective detection systems.
In conductivity detection, the detector gives the conductance reading that is due to various
components in the sample. There is a baseline conductance reading that is due to the various
ions in the mobile phase buffer. When a band of solute ions elutes from analytical column
(the conductance increases) the solute ions displace the mobile phase ions in this region [40].
In UV absorption detection, there is a direct and indirect UV detection. In direct UV
detection there is a UV transparent mobile phase and the solute ions absorb UV. Indirect UV
detection uses a UV absorbing mobile phase with solute ions that do not absorb, thus
producing a decrease in absorbance as the solute band passes through the detector.
Electrochemical detection is used for low level or selective analysis of the three important
anions I-, SO32- and CN-.
Refractive index detection is used mainly for borate and polyphosphonates [40].
3.3 Sample Preparation Techniques
Solvent and solid-phase extraction are the two techniques used for separating mixtures of
substances, either by selective transfer between two immiscible liquid phases or between a
liquid and a solid phase.
3.3.1 Solvent Extraction
Solvent extraction is based on the extraction of nonpolar, uncharged species from an aqueous
solution into an immiscible organic solvent, or the extraction of polar or ionized species into
an aqueous solution from an organic solvent. The purpose of extraction is to separate
components of a mixture by exploiting differences in their solubilities in two immiscible
liquids. Substances reach an equilibrium distribution through intimate contact between the
two phases, which are then physically separated to enable the species in either phase to be
recovered for completion of the analysis. This is actually done by dissolving the sample in a

51
suitable solvent then shaking the solution with a second immiscible solvent. When the
equilibrium distribution of the two solutes differs, a separation takes place [37].
Solvent extraction is widely used for sample pre-treatment or clean-up to separate analytes
from matrix components that would interfere with their detection or quantitation. It is also
used to pre-concentrate analytes present in samples at very low levels and which might
otherwise be difficult or imposible to detect or quantify [37]. When this research was carried
out, ethyl acetate was used to perform a separation between glyphosate derivative and
FMOC-OH. Glyphosate derivative is insoluble in organic solvents; therefore the extraction
was easy to perform.
3.3.2 Solid-phase Extraction (SPE)
3.3.2.1 Introduction to SPE
This is a relatively new technique and it has been widely used for the sample pre-treatment or
the clean-up of dirty samples [37]. This is non-equilibrium, exhaustive technique used for the
removal of chemical constituents from a flowing liquid sample via retention on a contained
solid-phase sorbent and subsequent recovery of selected constituents by elution with a
suitable solvent from the sorbent [42]. The technique has been applied for the analysis of
environmental, clinical, biological and pharmaceutical samples [37].
3.3.2.2 Advantages of SPE
The advantages of SPE include the following [21]:
• Reduced analysis time compared to liquid-liquid extraction.
• Reduced labor (because SPE is faster and requires less manipulation).
• Reduced organic solvent consumption and disposal, which results in reduced analyst
exposure to organic solvents.
• Reduced potential for formation of emulsions.

52
3.3.2.3 Solid-phase sorbents
Solid-phase sorbents are generally either silica or chemically-modified silica similar to the
bonded phases used in HPLC but of larger particle size (40-60 µm in diameter) [40]. Solutes
interact with the surface of the sorbent through van der Waals forces, dipolar interactions, H-
bonding, ion-exchange and exclusion. Hydrocarbon-modified silicas (like C18) are non polar,
and therefore hydrophobic, but are capable of extracting a very wide range of organic
compounds from aqueous solutions. However, they do not extract very polar compounds well
and these are best extracted by unmodified silica, alumina or florisil, all of which have a polar
surface. Ionic and ionizable solutes are readily retained by an ion-exchange mechanism using
cationic or anionic sorbents. Weak acids can be extracted from aqueous solutions of high pH
when they are ionized and weak bases from aqueous solutions of low pH when they are
protonated [37].
Sorbents are either packed into disposable cartridges, fabricated into disks or incorporated
into plastic pipette tips or well plates.
Most cartridges are made from a polypropylene syringe barrel and are usually packed with
25-500 mg of sorbent. The sorbent generally occupies only the lower half of the cartridge and
the upper half is for the sample solution or solvents [37].
SPE sorbents should be porous with large surface areas, be free of leachable impurities,
exhibit stability toward the sample matrix and the elution solvents, and have good surface
contact with the sample solution [42].
3.3.2.4 Requirements for successful SPE
A high, reproducible percentage of the analytical solutes must be taken up by the solid
extractant.
The solutes must be completely eluted from the solid particles. The sorption process must be
reversible [42].

53
3.3.3 General methodology of SPE
The methodology when the sorbent is packed in a cartridge generally consists of four steps
namely sorbent conditioning, sample loading or retention, rinsing and elution [37, 42]. These
four steps are explained below.
Step 1: Sorbent conditioning:
In this step, the cartridge is flushed through with the sample solvent to wet the surface of the
sorbent and to create the same pH and solvent composition as those of the sample, thus
avoiding undesirable chemical changes when the sample is applied.
Step 2: Sample loading or retention:
The sample solution (liquid sample) is passed through the cartridge. Two things may happen
when the sample is passed through the cartridge, the anlytes of interest can be retained in the
cartridge whilst the matrix components pass through or the matrix components can be
retained while the analytes of interest pass through.
Step 3: Rinsing:
This step is for the removal of all those components that are not retained by sorbent during
the retention step or is for rinsing of cartridge to remove undesired components.
Step 4: Elution:
This is the final step and is used for the recovery of the analytes retained in cartridges;
otherwise the matrix free solution and rinsings from the second and third steps are combined
for quantitative recovery of the analytes before completion of the analysis [37].

54
CHAPTER 4
EXPERIMENTAL
This chapter will present the list of all chemicals used, it will also describe the preparation of
these chemicals and mention the techniques used for the analysis of glyphosate and AMPA in
water. All the samples collected and storage of these samples prior to HPLC analysis will be
discussed. The chapter will also discuss the analysis methods for the determination of
concentrations of glyphosate and AMPA in water.
4.1 Materials
The following materials were purchased and used in this research. Standards of Glyphosate
(99.9%), glufosinate (94.7%) and AMPA (≥ 99%) were purchased from Sigma (Missouri,
USA). HPLC grade acetonitrile was obtained from Merck (Darmstadt, Germany). Analytical
reagent (AR) grade of sodium dihydrogen phosphate, disodium hydrogen phosphate,
disodium tetraborate decahydrate, hydrochloric acid (HCl) (32%), potassium hydroxide
(KOH), succinic acid, formic acid, acetic acid, ammonium acetate and FMOC-Cl were
purchased from Merck (Darmstadt, Germany). HPLC grade ethyl acetate was purchased from
Sigma (Steinheim, Germany). Buffer solutions (phosphate) of pH 4 and pH 7 were purchase
from BDH Laboratory (Poole, UK). Double de-ionised water was obtained from a Milli-
RO15 purification water system from Waters (Massachusetts, USA) and all the preparations
of solutions in water were prepared using this double de-ionised water.
4.2 Equipment
4.2.1 High performance liquid chromatography instrument
HPLC is the main instrument used in this research. The HPLC instrument consisted of a TSP
model AS 100 auotosampler (San Jose, USA), TSP model P100 LC pump (pump 1) (San
Jose, USA) and a model RF-10AXL fluorescence detector (Shimadzu, Tokyo, Japan).
EZChrom chromatography data system (version 6.6) was obtained from Scientific software
(San Ramon, California, USA) and used for recording of chromatograms. Samples and
standards were injected using a Rheodyne 7010 injector equipped with a 20 micro litre (µl)

55
sample loop (California, USA). Columns used were Polymeric amino column of 250 x 4.6
mm I.D purchased from Advanced Separation Technologies (New Jersey, USA), pH 2-13;
Spherisorb amino column of 250 x 4.6 mm I.D purchased from Waters (Massachusetts, USA)
and 125 x 4 mm I.D Lichrospher C18 column purchased from Merck (Darmstadt, Germany).
The temperature of columns during HPLC and IC analysis was maintained at 250C by using a
column block heater purchased from Jones Chromatography LTD (Llanbradach, Wales).
For column switching technique, the second LC pump (pump 2) was used, this was a Waters
501 HPLC pump purchased from Waters (Massachusettes, USA).
4.2.2 Ion chromatography
Another instrument used was ion chromatography (IC), it consisted of Waters 510 HPLC
pump (Milford, USA), Hamilton PRP- X100 of 100 x 4.1 mm I.D separation column
(Nevada, USA). Waters 430 conductivity detector (Milford, USA) and the chromatograms
were recorded using a Varian star chromatography workstation version 3 (California, USA).
Standards were injected using a Rheodyne 7010 injector equipped with a 20 µl sample loop
(California, USA).
4.2.3 Solid phase extraction
The SPE vacuum manifold used was purchased from Supelco (Bellefonte, PA, USA). The
use of the following SPE cartridges was investigated for the sample clean-up before the
injection of samples into the HPLC instrument. Sep-Pak Vac 3cc (500 mg) C18, Oasis MAX
6cc (150 mg) and Oasis HLB 6cc (200 mg) cartridges all purchased from Waters
(Massachusetts, USA). Strata C18-U 100 mg, Strata C18-E 100 mg cartridges were obtained
from Separations (New Jersey, USA).
4.2.4 pH meter
A model 691 pH meter was used (Metrohm, Herisau, Switzerland).

56
4.3 Preparation of solutions
4.3.1 Preparation of solutions for HPLC Analysis
100 mg/l stock solutions of glyphosate, glufosinate and AMPA were prepared in double
deionised water. A 100 mg/l mixture of all these three standards was prepared in double
deionised water. 100 mg/l mixture was used to prepare other solutions in water ranging from
0.005 mg/l to 50 mg/l using the method of serial dilution.
0.125 M borate buffer (pH 9) was prepared in water and 0.05 M of FMOC-Cl was prepared
in acetonitrile. 0.05 M phosphate buffers (pH 5.5 and pH 10) were prepared in water from
solutions of disodium hydrogen phosphate and sodium dihydrogen phosphate in water and
used in HPLC. 40 mM of succinic acid (pH 2.72) was prepared in double deionised water and
used as the mobile phase in ion chromatographic analysis.
A mixture of acetonitrile-0.05 M phosphate buffer (pH 10) (55:45, v/v) was used as the
mobile phase for the work that uses a polymer amino column. A mixture of acetonitrile-0.05
M phosphate buffer (pH 5.5) (35:65, v/v) was used as the mobile phase for the work that uses
a C18, silica based amino column and a column coupling technique.
A Metrohm 691 pH meter was used to measure the pH of borate buffer, phosphate buffer,
succinic acid and the mobile phases used in HPLC. The pH values of all these solutions were
adjusted with 4 M KOH solution and 32% (v/v) HCl solution. 4 M potassium hydroxide
solution was prepared in water. The pH meter was optimized and calibrated using BDH
Laboratory buffer solutions (phosphate) of pH 4 and pH 7.
4.3.2 Preparation of solutions for IC analysis
100 mg/l stock solutions of glyphosate, glufosinate and AMPA were prepared in double
deionised water. A 100 mg/l mixture of all these three standards was prepared in double
deionised water. 100 mg/l mixture was used to prepare 10 mg/l and 1 mg/l in water using the
method of serial dilution. The solutions were filtered through 0.45 µm membrane filter paper,
and injected into IC without further treatment.

57
4.4 Samples
A full description of water samples used in this research is presented in this section. Some of
the samples were collected to test the effectiveness of the method of analysis and sample
preparation method; and some were collected in areas that were suspected to be contaminated
by glyphosate. All the samples were collected in areas of Kwa-Zulu Natal Province (South
Africa). All water samples were collected in plastic containers to avoid the possible
adsorption of analytes onto glass surfaces; and kept in a refrigerator at 40C until they were
analyzed, to avoid the decomposition of the analytes and to prevent any possible chemical
reactions that might take place.
4.4.1 Effluent water sample
An effluent water sample was collected from a chemical company situated in south of the
port city of Durban. One of the products this chemical company is making is glyphosate.
Therefore an effluent water sample was collected to test the effectiveness of the sample
preparation method developed in this research, and to test the presence of both glyphosate
and AMPA in this sample and their levels if they are present. Another objective of collecting
the sample from this company was to check if this company was contaminating the
environment with the herbicide glyphosate.
4.4.2 Umdloti River
This river is situated in north of the City of Durban. This river was once suspected of being
contaminated by herbicides. The Mercury Newspaper published an article (Weed control
could delay) on 15 February 2006; the article was about the fish that were found dead after
the river was sprayed with herbicides to remove aquatic plants. After this article was
published in the Newspaper there was a lot of debate about the testing of herbicides in water.
The samples were collected in this river because at once the glyphosate herbicide was used in
this river.

58
4.4.3 Amanzimtoti river
Amanzimtoti river is situated in south of Durban. There was no information obtained
regarding the use of herbicides in this river. The sample was collected from the river mouth.
4.4.4 Hammersdale dam
The dam in situated on the Sterkspruit tributary in a small town called Hammersdale.
Hammersdale dam is a major breeding ground for the water hyacinth weeds. This dam stores
water and the water stored in this dam is purified for human consumption. The nutrient rich
silt in this dam promotes rapid growth of aquatic plants which tend to block out light and air.
The herbicide, glyphosate, is widely used in this dam to control hyacinth weeds. The growth
of these weeds has a significant impact on water health and reduces the benefits that people
could derive from a more healthy water (river) ecosystem.
4.4.5 Stream water sample
This water sample was collected from the first stream found south of Durban international
airport.
4.5 Derivatization
Derivatization was done in both the standards and field samples.
4.5.1 Derivatization of standards
Derivatization reaction was carried out by adding 1.80 ml of 0.125 M borate buffer (pH 9)
followed by the addition of 12.00 ml of 0.05 M FMOC-Cl into a 10.20 ml of the standard.
Derivatization reaction was carried out at room temperature for 30 minutes. After 30 minutes
reaction time, the solution obtained was extracted three times with 6.0 ml of ethyl acetate to
remove the excess amount of FMOC-Cl and FMOC-OH. Then the standards were filtered
through a 0.45 µm membrane filter paper prior to HPLC analysis.

59
4.5.2 Derivatization of field samples
Prior to the derivatization, field samples were homogenised and sub-samples were obtained.
These sub-samples were filtered through a 0.45 µm membrane filter paper. Then the sub-
samples were then derivatized in the same way as the standards. After derivatization, the
solution obtained was extracted with ethyl acetate to remove FMOC-Cl, FMOC-OH and the
interfering organic compounds that may be present in the field samples. Other interferences
are then removed by using solid phase extraction technique. The solid phase extraction
technique was only used in field samples for sample clean-up to remove non-polar
interferences.
4.6 Sample Clean-up
For sample clean-up, a suitable SPE cartridge was investigated and used. The interferences
were removed by passing the sample through a 500 mg C18 SPE cartridge. The cartridge was
first conditioned by passing 3.0 ml of acetonitrile followed by passing 3.0 ml of deionised
water and finally 2.0 ml of standard or sample obtained after derivatization with FMOC-Cl
through the C18 SPE cartridge. All these fractions were sent to waste using a flow rate of 1
ml/min. Then the derivatized sample was transferred through the cartridge using a flow rate
of 1 ml/min and collected in a vial. The collected sample was then filtered through a 0.45 µm
nylon filter paper before the injection onto the HPLC column.
4.7 HPLC Analysis
The flow rate of the mobile phase was 1 ml/min and the column was maintained at a
temperature of 250C. A volume of 20 µl of the solution obtained after sample clean-up (SPE)
was injected onto polymeric amino column, which was connected directly to the fluorescence
detector. The analytes were separated in the polymeric amino column and thereafter were
etected with the fluorescence detector. The emission wavelength used in fluorescence
detector was 315 nm and the excitation wavelength was set at 266 nm. Quantitation of both
analytes was done by using external calibration method with standard solutions of both
analytes in water obtained after derivatization.

60
CHAPTER 5
RESULTS AND DISCUSSION
High performance liquid chromatography comprises ion chromatography and partition
chromatography. In view of the fact that the analytes to be determined were extremely polar
or tending towards ionic species, it was decided to use IC as a technique and compare it with
partition chromatography.
5.1 Ion chromatography for glyphosate and AMPA analysis
IC is a chromatographic technique that is used for the separation and detection of ionic
substances. Glyphosate is an amino acid that has a strongly ionized phosphate group having
the pka values of 0.78, 2.29, 5.96 and 10.98, and it is a hydrophilic substance [23 and 28].
According to Zhu et al [28], IC can determine this hydrophilic substance quickly and
conveniently.
The details of IC equipment used in this research are described in the experimental section
(chapter 4, section 4.2).
5.1.1 IC analysis
The standards or a mixture of standards were directly injected into the Hamilton PRP-X100
column without any further preparation except filtration. The mobile phase used in IC
analysis was a 40 mM succinic acid (pH 2.72) and the flow rate was set at 1.7 ml/min. The
column was directly connected into a non-suppressed conductivity detector.
5.1.2 Results and discussion for IC analysis
5.1.2.1 Detection of the compounds
In order for the glyphosate, glufosinate and AMPA to be detected in IC, they have to be
ionized. These compounds are ionized by adjusting the pH in the mobile phase. In this study
it was discovered that the pH of the mobile phase affects the migration of glyphosate,

61
glufosinate and AMPA. This is in general agreement with the results obtained by You et al
[5]. Figures 4 and 5 show the different structures of glyphosate and AMPA ions that are
formed at various pH values [5]. The structure of glufosinate is almost the same as the
structure of glyphosate. Thus glyphosate and glufosinate behave in similar ways. Glyphosate,
glufosinate and AMPA are zwitterionic compounds [5], and as shown in Figs. 9 and 10, the
change in pH values changes the distributions of the analytes. The pH of the mobile phase
used in this work is 2.7. At this pH, glyphosate and glufosinate form an ion of charge -1 and
AMPA forms a species with zero net charge.
C
O
HO CH2 NH CH2 P
O
OH
OH
Glyphosate
2 0.78
C
O
HO CH2 NH CH2 P
O
OH
2 O-
2.09
O
CH2 CH2 P O
OH
NH2
O
C
O
5.96O P
O
CH2
O
NH2CH2C
O
O
10.98
P
O
O
O
CH2NHCH2C
O
O
Figure 4: Ionization of glyphosate [5].

62
AM PA
NH3 CH2 P
O
OH
OH
2.4 NH3 CH2 P
O
O
OH
5.9
P
O
O
O
CH2NH3
10.8OPCH2
O
O
NH2
Figure 5: Ionization of AMPA [5].
Glyphosate and glufosinate were detected but AMPA was not detected. This means that the
non-suppressed conductivity detector, used in this project, detects only the ions of charge -1.
AMPA can be detected if the pH of the mobile phase is changed to greater than 5.9.
However, at pH above 5.9, glyphosate does not form the ion of charge -1; instead it forms the
ion of charge -2. Therefore the simultaneous analysis of these three compounds is impossible
at the selected pH. AMPA cannot be determined simultaneously with glyphosate using this
method.
When using the experimental conditions described in chapter four for IC analysis, glyphosate
and glufosinate are well separated. The retention times obtained for the separation of
glyphosate and glufosinate are 8 and 4 minutes respectively.

63
5.2 HPLC-FD for glyphosate and AMPA analysis
The use of partition chromatography, to overcome the problems encountered when using IC,
was investigated. In partition chromatography, prior to the sample/standard injection to the
analytical column, the sample or standard has to be derivatized to form fluorescence
detectable compounds. Factors affecting the derivatization process were investigated and are
described in sections 5.2.2 and 5.2.3.
5.2.1 Derivatization of glyphosate and AMPA
Due to the lack of fluorophores in both glyphosate and AMPA, these compounds were
derivatized with FMOC-Cl, prior to their separation on an analytical column, to form the
fluorescing compounds that can be detected using a fluorescence detector. The measured
amount of water sample was added prior to the addition of FMOC-Cl reagent. When the
volume of water sample or standard was added to the reaction mixture after the addition of
FMOC-Cl reagent, a precipitation reaction took place. The derivatization reactions of both
glyphosate and AMPA with FMOC-Cl are shown in Fig. 6 below. During this research, non-
fluorescing compounds namely; glyphosate and AMPA were analysed as the fluorescing
compounds, FMOC-glyphosate (same as glyphosate-FMOC) and AMPA-FMOC (same as
FMOC-AMPA), respectively after derivatization.

64
O
O
ClO
O
Glyphosate
N
CH2COOH
CH2
POHO
OH
+ HCl
Glyphosate FMOCFMOC-Cl
AMPA
O
O
Cl
FMOC-Cl
O
O
N
PO
CH2
OHOH
H
+ HCl
AMPA FMOC
C
O
CH2 NH CH2 P
O
OH
OH
O
HO NH22CHP
OH
HO
Figure 6: Derivatization reaction of both glyphosate and AMPA
5.2.2 Optimization of derivatization
Two factors can affect the quantity of the derivative, namely duration of the derivatization
process (reaction time) and the concentration of the derivatizing reagent (FMOC-Cl). Both of
these factors were optimised in this work.
5.2.2.1 The effect of reaction time on derivatization reaction
The effect of time on the derivatization process was investigated in order to determine the
optimal time for the derivatization of both glyphosate and AMPA to form fluorescing
products. This was necessary to use the minimum reaction time to ensure that the analytes
were converted completely into detectable forms or into fluorescing compounds. Initially, the
derivatization was started by derivatizing only 100 µg/L of glyphosate with 4 mM of FMOC-
Cl at pH 9 for 15 minutes. The pH of the reaction mixture was controlled by the addition of

65
0.125 M borate buffer (pH 9). Borate buffer also enhances the ionisation of both analytes.
The structures of the derivatization products are shown in Fig. 6. This derivatization method
gave a low yield of glyphosate-FMOC product. To improve the quantity of glyphosate-
FMOC product, the following reaction times were investigated; 15 minutes, 30 minutes, 45
minutes and 60 minutes. A high amount of the glyphosate-FMOC was obtained in a 30
minutes reaction time. Both 45 minutes and 60 minutes reaction gave the same amount of
glyphosate-FMOC as for the 30 minutes reaction. Therefore, 30 minutes reaction time was
chosen and this reaction time was used throughout this project. While investigating the effect
of reaction time on derivatization reaction, the concentration of derivatizing reagent and the
pH were kept constant at 4 mM FMOC-Cl and at pH 9, respectively. The data for this is
summarised in Table 1 below and presented graphically (Fig. 7).
After the time for derivatization reaction was optimised, a series of standards in the range
between 5 ppb and 100 ppb of glyphosate were prepared, derivatized and injected into the
HPLC-FD system. The peak areas for these standards are shown in Table 2. A calibration line
was drawn (shown in Fig. 8) and the results are depicted in Fig. 7.

66
Table 1: Reaction times vs peak areas of FMOC-glyphosate
Reaction time vs peak area
0.00E+00
5.00E+05
1.00E+06
1.50E+06
2.00E+06
2.50E+06
0 10 20 30 40 50 60 70
Reaction time (minutes)
Pea
k ar
ea
Figure 7: A profile showing the effect of reaction time in the formation of glyphosate-FMOC.
This profile demonstrates the change of retention of glyphosate-FMOC with respect to the increase
of derivatization reaction time.
Reaction time Peak area
15 1475939
30 2027176
45 2025600
60 2026342

67
Table 2: Peak areas of glyphosate-FMOC standards
Glyphosate
y = 21557x
R2 = 0.9982
0.00E+00
5.00E+05
1.00E+06
1.50E+06
2.00E+06
2.50E+06
0 20 40 60 80 100 120
Concentration (ppb)
Pea
k ar
ea
Figure 8: Calibration line of glyphosate-FMOC after optimisation of derivatization reaction.
Concentration (ppb) Peak area
5 100116
10 118078
50 1132104
100 2132726

68
5.2.2.2 The effect of the concentration of FMOC-Cl on derivatization reaction
After optimising the reaction time, the effect of concentration for FMOC-Cl reagent was
investigated. The concentrations investigated were in the range between 0.1 mM and 3.0 mM.
The following concentrations were compared, based on peak areas obtained in HPLC for
glyphosate-FMOC formed: 0.10 mM, 0.25 mM, 0.50 mM, 1.0 and 3.0 mM. The highest peak
area was obtained when using 0.5 mM of FMOC-Cl reagent. Since FMOC-Cl is relatively
insoluble in water and it has a low stability in water, FMOC-Cl was prepared in acetonitrile.
The results are summarised in Table 3 and shown graphically in Fig. 9.
Table 3: The effect of FMOC-Cl concentration on derivatization reaction
FMOC-Cl Concentration /mM Peak Areas
0.10 2254192
0.25 13180432
0.50 24583963
1.0 25397821
3.0 25236740
Effect of FMOC-Cl concentration on derivatization
0.00E+00
5.00E+06
1.00E+07
1.50E+07
2.00E+07
2.50E+07
3.00E+07
0 0.5 1 1.5 2 2.5 3 3.5
FMOC-Cl Concentration (mM)
Pea
k A
rea
Figure 9: A profile showing the effect of FMOC-Cl concentration in the formation of
glyphosate-FMOC.
This profile demonstrates the change in peak areas with respect to the change in the
concentration of FMOC-Cl reagent.

69
Overall, a high amount of glyphosate-FMOC was formed by the reaction of glyphosate and
0.5 mM of FMOC-Cl after 30 minutes. This reaction was carried out using a reaction ratio of
0.7: 1 of glyphosate to FMOC-Cl. FMOC-Cl is added in excess to ensure the complete
derivatization of glyphosate and the excess amount of FMOC-Cl, left after derivatization, is
removed with an organic solvent (ethyl acetate).
5.3 Calibration of HPLC with fluorescence detector
A multipoint calibration was performed in the optimization and the calibration of the high
performance liquid chromatography. A blank and five standard solutions of glyphosate were
prepared in the range from 5 to 500 ppb and were used to construct the calibration line as
shown in Fig. 10. For AMPA, a blank and five standard solutions of AMPA were prepared
from 0.1 to 100 ppb and the calibration curve was constructed and is shown in Fig. 11.
The principle of calibration is based on the equation of the straight line which is as follows:-
cmxy +=
In the above equation, y represents the peak area of the analyte, m is the slope or gradient of
the straight line, x is the concentration of the analyte and c is 0.
Table 4: Concentrations and areas of analytes for calibration lines
Glyphosate AMPA
Concentration (ppb) Peak area Concentration (ppb) Peak area
0.00 0.00 0.00 0.00
5.0 188658 0.1 163100
10 284989 1.0 332476
50 1966402 10 1785022
100 4218533 50 7446917
100 15843901

70
Calibration line for glyphosate
y = 41502x
R2 = 0.9974
0.00E+00
5.00E+05
1.00E+06
1.50E+06
2.00E+06
2.50E+06
3.00E+06
3.50E+06
4.00E+06
4.50E+06
0 20 40 60 80 100 120
Concentration (ppb)
Pea
k ar
ea
Figure 10: Calibration line for glyphosate by HPLC-FD.
Calibration line for AMPA
y = 156728x
R2 = 0.9984
0.00E+00
2.00E+06
4.00E+06
6.00E+06
8.00E+06
1.00E+07
1.20E+07
1.40E+07
1.60E+07
1.80E+07
0 20 40 60 80 100 120
Concentration (ppb)
Pea
k ar
ea
Figure 11: Calibration line for AMPA by HPLC-FD.

71
5.4 HPLC-FD reproducibility
The reproducibility of the HPLC-FD system was determined as follows: Deionised water was
spiked to give 100 ppb of both glyphosate and AMPA. Recovery studies were undertaken.
The calculations of percent recoveries were done using the calibration lines shown in Figs.
10 and 11 for both analytes. The results obtained are shown in Table 5.
Table 5: Percent recoveries
Compound % recovery Average SD % RSD
Glyphosate 89 90 90 89.5 0.473 0.528
AMPA 101 99 100 99.9 0.473 0.473
5.5 Analytical column selection
Although FMOC-Cl has been used widely as a pre-column derivatising reagent, it has a
disadvantage. A drawback of using FMOC-Cl as a pre-column derivatizing reagent is that, it
tends to react with any water present in the reaction vessel, to form a highly fluorescing
product called FMOC-OH [14] according to the following reaction:
FMOC-Cl + H2O FMOC-OH + HCl
FMOC-Cl is a very reactive reagent and in aqueous solutions the FMOC-Cl reagent rapidly
converts into FMOC-OH (according to the above reaction). Therefore, the derivatization
reaction always produces a large excess of fluorogenic FMOC-OH interferent [16]. Water is
always present in the reaction vessel because glyphosate standards are prepared in water.
Glyphosate is soluble in water but insoluble in organic solvents, therefore the standards
cannot be prepared in organic solvents. FMOC-Cl is soluble in acetonitrile but is not soluble
in water and it is highly reactive with water to form the FMOC-OH product. Nedelkoska et
al [24] reported that in the chromatogram for glyphosate determination, FMOC-OH is
represented by the large peak in front of the FMOC-AMPA peak. FMOC-OH peak obscures
the analytes peaks in the analysis and this creates difficulties in the analysis of glyphosate and
AMPA. This difficulty was also experienced in this study (Fig.12). Several efforts were made

72
to overcome the problem. One attempt involved the elimination of FMOC-OH by using a
column switching technique and extracting FMOC-OH with an organic solvent. In the light
of this, a suitable analytical column was found by the trial and error method for the separation
of the interfering FMOC-OH product and FMOC-glyphosate (analyte). The analytical
columns tried are discussed in detail in sections 5.5.1, 5.5.2 and 5.5.3. For the selection of
analytical columns only the standards were used to investigate the behaviour of FMOC-
glyphosate, FMOC-AMPA and FMOC-OH in the columns.

73
Figure 12: A chromatogram for 100 µg/l mixture of glyphosate and AMPA after derivatizing with FMOC-Cl.
This chromatogram shows FMOC-OH peak (large front peak) overlapping the FMOC-AMPA peak. HPLC mobile phase (pH 10)
contained 55 % (v/v) acetonitrile in water, and 50 mM phosphate buffer.
74
5.5.1 C18 Column
Lichrospher C18 column was the first column investigated in this study for the separation of
FMOC-glyphosate, and the interfering FMOC-OH. This column showed that the
derivatization reaction between glyphosate and FMOC-Cl not only produced FMOC-
glyphosate but also produced FMOC-OH and some unknown fluorescing by-products. The
chromatogram (Fig.13) clearly revealed the presence of these fluorescing by-products. The
chromatogram in Fig.13 shows FMOC-OH peak interferes with the analysis of glyphosate.
Hence when this C18 column was employed, the limit of detection obtained for glyphosate
was 0.1 mg/l. This detection limit is not good enough for glyphosate determination in water.
The separation shown in the chromatogram, Fig.13, was achieved by using the Lichrospher
C18 column with a mobile phase containing a mixture of acetonitrile and 50 mM phosphate
buffer (pH 5.5) with a ratio of 35: 65 (v/v) acetonitrile to phosphate buffer, and a flow rate of
0.5 ml/min. When using 0.5 ml/min as the flow rate of the mobile phase, the retention time
for glyphosate was found to be 3.3 minutes and when using 1 ml/min the retention time for
glyphosate was 1.8 minutes.

75
Figure 13: Chromatogram showing separation of glyphosate on C18 column.
A chromatogram demonstrating the separation of FMOC-glyphosate (0.1mg/l) from FMOC-OH using a C18 column. The front peak
represents FMOC-glyphosate and the large peak represents FMOC-OH.

76
In order to achieve the best separation the mobile phase composition was varied. This was
done by changing the amount of acetonitrile in the mobile phase in order to achieve the best
separation. When the amount of acetonitrile in the mobile phase was increased, the retention
time for glyphosate was found to result in the non-separation of the analyte from the
interferents. This behaviour is illustrated in Fig.14.
Variations in amount of ACN in mobile phase
1.55
1.6
1.65
1.7
1.75
1.8
1.85
33 38 43 48 53 58
% of ACN in mobile phase
Ret
enti
on
tim
e /
min
Figure 14: Changes in retention time of glyphosate due to acetontrile in mobile phase.

77
In view of the above set-back it was decided to vary the pH of the mobile phase. However
changing the pH of the mobile phase did not improve the separation between the
interferences and the analyte. Increasing the pH of the mobile phase was actually reducing
the retention time of glyphosate slightly. The results obtained for the investigation of the
effect of pH are shown in Table 6. These results show the change in retention time of the
analyte while changing the pH of the mobile phase. The pH can only be changed over a small
range because low and high pH levels reduce the lifetime of the column. Silica based
columns usually degrade under high alkaline or under high acidity conditions.
As a further test of the suitability of the selected C18 column a calibration graph [see Fig.15]
was plotted for glyphosate standard solutions in the range of 10 to 1000 µg/l. From Fig.15 it
is clear that the relationship between peak area and concentration of glyphosate was not linear
in chosen concentration range. This is probably due to the fact that this column is unable to
separate glyphosate from the impurities that results from the derivatization reaction although
FMOC-OH is separated.
Graph for C18 column
0.00E+00
5.00E+06
1.00E+07
1.50E+07
2.00E+07
2.50E+07
3.00E+07
3.50E+07
0 0.2 0.4 0.6 0.8 1 1.2
Concentration (mg/l)
Pea
k ar
ea o
f g
lyp
ho
sate
Figure 15: The response of glyphosate when using C18 column.

78
According to the results obtained when using a C18 column, it is clear that this column is not
suitable for the determination of glyphosate in water using HPLC with a fluorescence
detector. Two other analytes, namely glufosinate and AMPA were injected into the same
column. From their retention times and chromatograms it can be seen that poor separation
was obtained for the three analytes. The retention times are shown in Table 7.
Table 6: Effect of pH of the mobile phase on retention times
pH of the mobile phase Retention time of the analyte /min
4 1.8
5.5 1.8
7 1.7
Table 7: Retention times of analytes using C18 column
Analyte Retention time (minutes)
Glyphosate 1.8
Glufosinate 2.0
AMPA 2.2
5.5.2 Silica-based amino column
The second column investigated in this research was a silica-based spherisorb amino column.
In this column, a mobile phase of pH 5.5 was used. In this mobile phase the analytes get
ionised yielding anionic compounds. According to the literature [16, 22 & 34], the separation
of FMOC-glyphosate and interferences arising from the derivatization reaction is preferably
performed on an amino-bonded silica based column in combination with aqueous phosphate
solution.
In this method the two peaks were completely resolved using the same mobile phase as used
in C18 column [a mixture of acetonitrile and 50 mM phosphate buffer (pH 5.5) with a ratio of
35: 65 (v/v) acetonitrile to phosphate buffer] and the mobile phase flow rate was set at 1
ml/min. This method suffers from the non-reproducibility of the retention times. The

79
retention times were changing from run to run for identical conditions. This was expected
since the phosphate solution at the selected pH (pH 5.5) does not have any buffer capacity
[19]. According to Sancho et al [34], at pH 5.5 the phosphate buffer does not have any buffer
capacity and therefore fluctuations in retention times should be expected. Sancho et al [34]
also suggested that 0.05 M citrate buffer (pH 5.5) would be more suitable for glyphosate
determination when using silica based amino column in comparison with 0.05 M phosphate
buffer (pH 5.5). The use of citrate solution with amino column was previously reported by
Sancho et al [19]. When using the combination of citrate solution with silica based amino
column they observed a considerable band broadening of the FMOC-glyphosate peak.
Sancho et al [34] also tried a mixture of phosphate buffer and citrate buffer but this did not
improve the problem of band broadening of the analyte situation.
When using the silica-based amino column a plot of glyphosate standard solutions against
peak areas was linear for standard solutions in water, for concentrations between 0.1 and 10
mg/l (R2 = 0.9953 when n = 6). The chromatogram and the calibration graph are shown in
Fig.16 and Fig.17 respectively. The limit of detection was determined for glyphosate for this
method and was found to be 0.1 mg/l, using signal/noise ratio of 3. Based on this detection
limit, it was concluded that this method suffered from poor sensitivity. By comparison, the
HPLC methods reported in the literature, have been shown to have detection limits of less
than 0.005 mg/l for glyphosate [3, 16 and 25].
To improve the sensitivity in silica-based amino column method, a method of removing
FMOC-OH and all interfering derivatization products was investigated. This was done by
coupling both C18 column and amino column discussed above.

80
Figure 16: Chromatogram showing separation of glyphosate on spherisorb amino column.
This chromatogram demonstrates the separation of FMOC-glyphosate (2 mg/l) from FMOC-OH.

81
Spherisorb amino columny = 1E+07x
R2 = 0.9949
0.00E+00
2.00E+07
4.00E+07
6.00E+07
8.00E+07
1.00E+08
1.20E+08
0 2 4 6 8 10 12
Concentration of glyphosate (mg/l)
Pea
k ar
ea
Figure 17: The response of glyphosate when using spherisorb (silica-based) amino
column.
5.5.3 Coupling of C18 and amino column
A silica-based amino column and a C18 column were coupled to attain the following two
objectives:
• To improve the detection limit obtained when using the silica-based amino columns,
• To remove FMOC-OH product and other interfering products produced from a pre-
column derivatization of glyphosate.
Fig. 18 shows two schematic diagrams of the chromatographic system set-up for the column
switching technique. The column coupling technique used two columns and two pumps.

82
Diagram A: Loading position Diagram B: Injecting position
Figure 18: Schematic diagrams of column switching HPLC system.
Symbols in diagrams: P1: first LC pump; P2: P100, second LC pump; SSV: six-port switching valve; IV: Rheodyne injection volume; C1: pre-
separation column (C18 column); C2: analytical column (amino column); W: waste bottle; F D: fluorescence detector.
P1 IV SSV
W
P2
C1
F D
C2
P1 IV SSV
C1
W
P2
C2
F D

83
5.5.3.1 Chromatographic system
As illustrated in both diagrams (Fig. 18, A and B) a pre-separation column which is a C18
column was coupled to the analytical column (silica-based amino column) through a six-port
switching valve. Analytical column was housed in a column block heater, and the column
was kept at a temperature of 250C and this column (C2) was the main separation column for
this work. In this column-coupling technique, a volume of 20 µl of glyphosate standard
obtained after derivatization with FMOC-Cl at pH 9 was injected into the pre-separation
column when the switching valve was in loading position (Fig. 18, diagram A). The
unretained analyte (FMOC-glyphosate) was passed through the pre-separation C18 column
with a mobile phase containing a mixture of acetonitrile and 0.05 M phosphate buffer (pH
5.5) at a ratio of 35: 65, v/v acetonitrile to phosphate buffer solution by pump 1 at a flow rate
of 0.5 ml/min, and simultaneously the derivatization interferents including FMOC-OH
product were retained in C18 column by a reverse phase mechanism. Five minutes after the
standard was injected, the switching valve was switched to the injecting position (Fig. 18,
diagram B) and the analyte was transferred to the analytical column in a back-flush mode and
applying a strong mobile phase consisting of 35% (v/v) acetonitrile in 0.1 M phosphate buffer
(pH 5.5) delivered by pump 2 at a flow rate of 1.0 ml/min. While the analyte was being
separated in analytical column (C2) by an ion exchange mechanism, the derivatization
interferences and FMOC-OH were sent from C18 column to waste without passing the second
analytical column.
5.5.3.2 Separation of interferences in C18 column
In this procedure the first column (C18 column) was used for the purpose of pre-separating the
un-wanted (interfering) derivatization products. This was done by injecting the standard or
sample directly into C18 column. In this LC integrated standard pre-separation set-up, the
standard was first fractioned into derivatization interferences and analyte by the use of the
Lichrospher C18 pre-separation column. When the glyphosate standard was injected into the
C18 pre-separation column, the highly polar FMOC-glyphosate was transferred to the second
column without adsorption, while the FMOC-OH and less polar interferences are adsorbed
and retained in the C18 column. In this way, the packing material in first column provides a
direct extraction of less polar interferences, and the separation of less polar interferences from
a highly polar analyte. In order to create enough selectivity in the system and to get high

84
recovery of the analyte in the pre-separation step, it was necessary to optimise the pre-
separation, the composition of the mobile phase as well as the switching time of the six-port
switching valve.
After optimization, a mobile phase of acetonitrile-phosphate buffer, pH 5.5 (35:65, v/v) was
used. In this approach, FMOC-glyphosate was ionised and resulted in little C18 retention on
C1 and adequate retention on the amino column (C2). The efficient removal of derivatization
interferences was obtained by transferring an almost unretained small analyte-containing
fraction to the amino column on C2. All interferences with more C18 retention such as
FMOC-OH were retained and sent to waste by the rinsing mobile phase during the separation
of the analyte on C2.
5.5.3.3 Separation on second column (C2)
During the derivatization reaction (Fig. 6), glyphosate reacts with FMOC-Cl (an acid
chloride) via its amine group, yielding an anionic compound, FMOC-glyphosate. According
to the literature [22, 34], the separation of FMOC-glyphosate is preferably performed on an
amino-bonded silica column in combination with aqueous phosphate solution. C2 was
directly connected to the fluorescence detector. Therefore, the analyte, after elution from the
second column (C2), is monitored by a fluorescence detector set at an emission wavelength
of 315 nm and an excitation wavelength of 266 nm.
5.5.3.4 Results and discussion based on column switching technique
The chromatogram obtained in column switching technique for 1 mg/l (1 ppm) of glyphosate
standard is shown in Fig. 19. This chromatogram shows that less polar interferences
including FMOC-OH arising from derivatization reaction can be separated and effectively
removed from the glyphosate chromatogram. A series of glyphosate standards were prepared
and injected. The calibration graph of this method using the mentioned parameters was
constructed. The response for glyphosate standards was found to be linear with
concentrations ranging between 0.1 and 10 mg/l with R2 = 0.9979 (n = 5). The calibration
graph is shown in Fig. 20. The detection limit of glyphosate when using the column coupling
technique was found to be 0.05 mg/l. This was found by using the signal to noise ratio of 3.

85
Figure 19: Chromatogram showing glyphosate in column switching technique.
A chromatogram of 1 mg/l (ppm) glyphosate standard obtained in column coupling technique.

86
Column switching technique
y = 2E+07x
R2 = 0.9979
0.00E+002.00E+074.00E+076.00E+078.00E+071.00E+081.20E+081.40E+081.60E+081.80E+082.00E+08
0 2 4 6 8 10 12
Concentration of glyphosate (mg/l)
Pea
k ar
ea
Figure 20: The response of glyphosate when using column switching technique.
Aiming for a detection limit of 0.7 mg/l which is the maximum contaminant level of
glyphosate in drinking water (set by US-EPA), a good sensitivity was obtained in the
column-coupling technique. In literature, the coupling of short C18 column and amino column
is reported by Hogendoorn et al [16] and Tadeo et al [26] with much better detection limits.
Hogendoorn et al [16] published a paper that is based in glyphosate determination in grain
samples down to a level of 0.5 mg/kg using the coupling of short (30 x 4.6 mm I.D.) C18
column and amino column. When the two columns were coupled in this work, it was
observed that the retention times for the glyphosate peak were not stable; therefore AMPA
was not investigated although the objectives for the use of this technique were achieved. The
retention times for glyphosate peak were fluctuating.

87
5.6 Polymer amino column for separation of glyphosate and AMPA
The polymer amino column was investigated to overcome the problems encountered when
using silica based columns (C18 and amino column). As stated previously, for a silica-based
amino column at pH 5.5 the retention times are not reproducible from run to run. To
overcome the fluctuation of retention times, the use of a polymer amino column at high pH
(pH 10) was investigated. Silica based amino columns cannot be used at high pH values
because they usually degrade at high alkaline conditions [24]. The degradation of a silica
based amino column occurred after few weeks when this column was used at pH 10 in this
research. Sancho et al [34] reported that there is a gradual decrease in efficiency of the silica-
based amino column after continuous usage for about two months at high alkaline conditions.
In view of this problem, it was decided to find a more robust amino separation column for
glyphosate analysis which can tolerate a greater pH range and can be easily regenerated.
A polymer amino column was chosen on the basis of its properties, namely;
• It has a good mechanical strength,
• It has a good chemical stability and
• It is capable of working over a wide pH range (pH 2-13).
5.6.1 Preparation of solutions before injection into polymer amino column
In this method the standards were prepared as for silica based columns. The method for the
derivatization of standards in C18 column was adapted and used on the polymer column. The
standards were derivatized with FMOC-Cl. The latter was added in excess to ensure complete
derivatization of the analyte.
Once formed FMOC-OH and other interferences from derivatization reaction were removed
by extracting the reaction mixture with organic solvent. Ethyl acetate is the only organic
solvent investigated for the removal of interferences from derivatization reaction in this
research. The use of ethyl acetate has been reported [24]. Solvent extraction was performed
with ethyl acetate after 30 minutes of pre-column derivatization of glyphosate with FMOC-
Cl. The reaction mixture was extracted three times with 6 ml of ethyl acetate and by doing

88
this the interferences arising from the derivatizing reaction are removed (for more
information see experimental section).
5.6.2 Separation of glyphosate and AMPA
The two compounds, glyphosate and AMPA were well separated using a polymeric amino
column with a mobile phase containing a mixture of acetonitrile-0.05 M phosphate buffer
(pH 10) (55:45, v/v). The flow rate of the mobile phase was 1 ml/min and the temperature of
the column was kept at 250C. The chromatogram obtained when using these conditions is
shown in Fig. 21.

89
Figure 21: The separation of glyphosate and AMPA derivatives on a polymeric amino column after the removal of FMOC-OH with
ethyl acetate. HPLC mobile phase (pH 10) contained 55% (v/v) acetonitrile in water, and 50 mM phosphate buffer.

90
5.6.3 Results and discussion for polymer amino column
5.6.3.1 Behaviour of glyphosate and AMPA on polymeric amino column
Secondary amides are formed from the reactions between the FMOC-Cl and both glyphosate
and AMPA in a mobile phase of acetonitrile-phosphate buffer at pH 10. The resulting amides
are negatively charged species; the structures of which are shown in Fig. 22. The amino
groups of the column at pH 10 are positively charged. The interactions of these positively
charged groups with the derivatives of glyphosate and AMPA may be ascribed to an ion-
exchange mechanism, possibly complemented by hydrophobic interaction with the polymeric
backbone of the column [24].
O
O
Cl O
O
Glyphosate
N
CH2COOH
CH2
PO
+ HCl
Glyphosate FMOCFMOC-Cl
AMPA
O
O
Cl
FMOC-Cl
O
O
N
PO
CH2
H
+ HCl
AMPA FMOC
OO
--
P
O
CH2NHCH2COOH
O
O
-
-
OO-
-P
O
O
O CH2NH2
-
-
Figure 22: The structures of amides formed at pH 10.
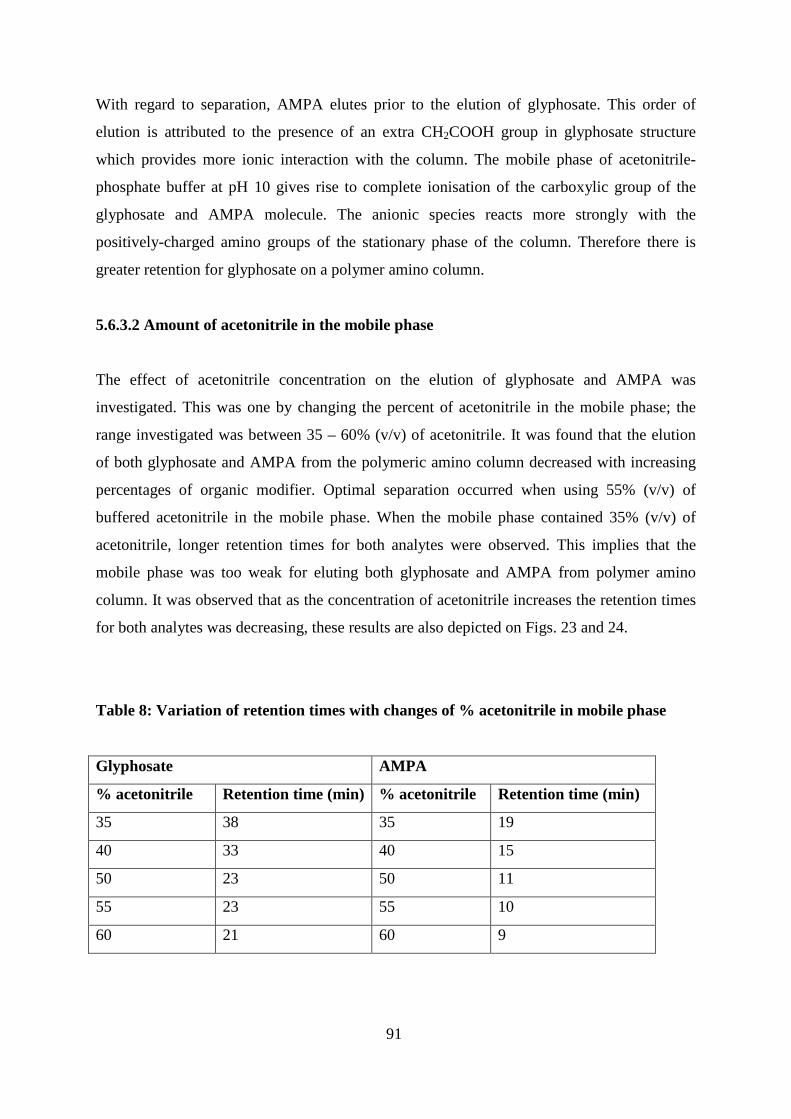
91
With regard to separation, AMPA elutes prior to the elution of glyphosate. This order of
elution is attributed to the presence of an extra CH2COOH group in glyphosate structure
which provides more ionic interaction with the column. The mobile phase of acetonitrile-
phosphate buffer at pH 10 gives rise to complete ionisation of the carboxylic group of the
glyphosate and AMPA molecule. The anionic species reacts more strongly with the
positively-charged amino groups of the stationary phase of the column. Therefore there is
greater retention for glyphosate on a polymer amino column.
5.6.3.2 Amount of acetonitrile in the mobile phase
The effect of acetonitrile concentration on the elution of glyphosate and AMPA was
investigated. This was one by changing the percent of acetonitrile in the mobile phase; the
range investigated was between 35 – 60% (v/v) of acetonitrile. It was found that the elution
of both glyphosate and AMPA from the polymeric amino column decreased with increasing
percentages of organic modifier. Optimal separation occurred when using 55% (v/v) of
buffered acetonitrile in the mobile phase. When the mobile phase contained 35% (v/v) of
acetonitrile, longer retention times for both analytes were observed. This implies that the
mobile phase was too weak for eluting both glyphosate and AMPA from polymer amino
column. It was observed that as the concentration of acetonitrile increases the retention times
for both analytes was decreasing, these results are also depicted on Figs. 23 and 24.
Table 8: Variation of retention times with changes of % acetonitrile in mobile phase
Glyphosate AMPA
% acetonitrile Retention time (min) % acetonitrile Retention time (min)
35 38 35 19
40 33 40 15
50 23 50 11
55 23 55 10
60 21 60 9

92
Effect of acetonitrile on glyphosate elution
0
10
20
30
40
33 43 53
% acetonitrile in the mobile phase
Ret
ention tim
e (m
in)
Figure 23: Effect of acetonitrile in glyphosate elution.
Effect of acetonitrile on AMPA elution
0
5
10
15
20
33 43 53
% acetonitrile in the mobile phase
Ret
ention tim
e (m
in)
Figure 24: Effect of acetonitrile in AMPA elution.

93
5.6.3.3 Calibration
After a good separation of both glyphosate and AMPA was achieved by the use of a
polymeric amino column, a multipoint calibration was performed for both compounds. This
was done to construct a calibration graph. As shown in Figs. 25 and 26 the curves for both
analytes were linear.
Table 9: Results for calibration lines of glyphosate and AMPA
Glyphosate AMPA
Concentration (ppb) Peak area Concentration (ppb) Peak area
0.0 0.00 0.0 0.00
5.0 100116 1.0 539928
10 198078 5.0 2712844
50 1132104 10 4428310
100 2132726 50 22206930
100 50870276

94
Glyphosate
y = 21573x
R2 = 0.9989
0.00E+00
5.00E+05
1.00E+06
1.50E+06
2.00E+06
2.50E+06
0 20 40 60 80 100 120
Concentration (ppb)
Pea
k ar
ea
Figure 25: Polymer column; calibration line for glyphosate.
Calibration line for AMPA
y = 495467x
R2 = 0.9952
0.00E+00
1.00E+07
2.00E+07
3.00E+07
4.00E+07
5.00E+07
6.00E+07
0 20 40 60 80 100 120
Peak area
Conce
ntr
atio
n (ppb)
Figure 26: Polymer column; calibration line for AMPA.

95
5.7 Investigation of the efficacy of SPE in sample clean-up procedure
For the determination of glyphosate and AMPA in environmental water samples, an
additional step was required in sample preparation procedure. This additional step was used
for the separation of non-polar interferences from the highly polar analytes, glyphosate and
AMPA. A sample clean-up step was investigated; this step being necessary for samples with
high amount of interferences and in this work a suitable SPE cartridge was required for the
removal of interferences. Thus SPE cartridges packed with different sorbents were
investigated. This was done by doing the recovery studies of 100 µg/l (ppb) mixture of both
glyphosate and AMPA.
5.7.1 Strata C18-E and Strata C18-U cartridges
The packing material in both of these cartridges is 100 mg of C18 sorbent. This is a non-polar
sorbent with a tendency of retaining the non-polar compounds. Hogendoorn et al [16] have
reported the use of C18 SPE cartridges for the extraction of glyphosate from cereal samples
with an overall recovery of 86%. At early stages of the investigation the method used by
Hogendoorn et al [16] for SPE was adapted and the method was optimised to get better
recoveries. For calculation of recoveries, the calibration graphs of both glyphosate and
AMPA were plotted. These graphs are shown in Figs. 27 and 28.
Table 10: Concentrations and peak areas of analytes for calibration lines
Glyphosate AMPA
Concentration (ppb) Peak area Concentration (ppb) Peak area
10 229836 5.0 698155
50 1546402 10 1318966
100 4218533 50 5728962
500 24177676 100 13153118

96
Calibration line for glyphosate
y = 47945x
R2 = 0.9969
0.00E+00
5.00E+06
1.00E+07
1.50E+07
2.00E+07
2.50E+07
3.00E+07
0 100 200 300 400 500 600
Concentration (ppb)
Pea
k ar
ea
Figure 27: Calibration line for glyphosate.
Calibration line for AMPA
y = 128193x
R2 = 0.9941
0.00E+00
2.00E+06
4.00E+06
6.00E+06
8.00E+06
1.00E+07
1.20E+07
1.40E+07
0 20 40 60 80 100 120
Concentration (ppb)
Pea
k ar
ea
Figure 28: Calibration line for AMPA.

97
5.7.1.1 SPE methodology for Strata cartridges
The conditioning of the cartridges was carried out, sequentially, with 3 ml of acetonitrile, 3
ml of water and 1 ml of standard, at a flow rate of 1 ml/min; these quantities were sent to
waste. Then 1.5 ml of the standard was transferred through the cartridge at a flow rate of 1
ml/min and collected into a tube. The collected standard was then derivatized, extracted with
ethyl acetate before the injection into the HPLC column.
5.7.1.2 Calculation of % recoveries
Strata C18-E
Glyphosate
y = 47945x = 1250539
x = 1250539/47945 = 26.1 ppb
% recovery = 26.1 ppb / 100 ppb x 100%
= 26.1%
The 100 ppb standard gave a peak of area = 1250539, which gives a recovery of 26.1%.
Table 11: % recoveries for Strata C18 cartridges
Cartridge type % recovery
Glyphosate AMPA
Strata C18-E 26.1 96.0
Strata C18-U 13.2 90.7

98
5.7.1.3 Optimization of SPE methodology
To improve the percent recovery of glyphosate, the SPE method was optimized. The
following two changes in SPE methodology were made.
• The amount of standard passed through the cartridge was increased to 2.5 ml.
• The standard obtained after derivatization and solvent extraction was transferred through
the cartridge.
These two procedures did not improve the percent recovery of glyphosate; therefore another
cartridge packed with 500 mg of C18 was investigated.
5.7.2. Sep-Pak Vac 3cc (500 mg) C18 cartridges
5.7.2.1 Methodology for Sep-Pac cartridges
The conditioning of the cartridges was carried, sequentially, with 3 ml of acetonitrile, 3 ml of
water and 1 ml of standard at a flow rate of 1 ml/min; these quantities were sent to waste.
Then 1.5 ml of the standard was transferred through the 500 mg SPE cartridge at a flow rate
of 1 ml/min and collected into the tube. The collected standard was then derivatized,
extracted with ethyl acetate before the injection into the HPLC column.
• This method is adapted from that reported by Hogendoorn et al [16] and percent
recoveries are reported in Table 12 A.
• The results, indicated in Table 12 B and 12 C, were obtained by passing the standard
obtained after derivatization through the cartridge and increasing the volume of
derivatized standard passed through the cartridge to 3 ml, respectively. Acceptable
recoveries were obtained when 3 ml of the derivatised standard was passed through the
cartridge. Therefore the same conditions were applied in the case of environmental water
samples.
• The recoveries obtained when spiking tap water with 100 ppb mixture of glyphosate and
AMPA are shown in Table 13.

99
Table 12 A: % recoveries for 500 mg C18 cartridges
Cartridge type % recovery
Glyphosate AMPA
500 mg C18 SPE cartridge 21.7 96.0
Table 12 B: % recoveries obtained when passing derivatized standard through the 500
mg C18 cartridge
Cartridge type % recovery
Glyphosate AMPA
500 mg C18 SPE cartridge 57.6 107
Table 12 C: % recoveries obtained when passing 3 ml of derivatized standard through
the 500 mg C18 cartridge
Cartridge type % recovery
Glyphosate AMPA
500 mg C18 SPE cartridge 105 95.2
Table 13: % recoveries obtained when spiking tap water
Cartridge type % recovery
Glyphosate AMPA
500 mg C18 SPE cartridge 101 90.2
5.7.3. Oasis HLB 6cc (200 mg) SPE cartridges
Good recoveries were obtained using 500 mg of C18 SPE cartridges but due to the limitations
regarding the use of C18 SPE cartridges the use of Oasis cartridges was investigated for
sample clean-up in the analysis of glyphosate and AMPA in water using HPLC with
fluorescence detector.

100
C18 SPE cartridges have limitations because they are not hydrophilic or water wettable
therefore during the extraction, care was taken to ensure that the sorbent stays wet before
loading the sample to avoid low analyte recoveries. To overcome the reverse phase
limitations, HLB cartridges are normally used. HLB cartridges are packed with a copolymer
known as poly (divinylbenzene-co-N-vinylpyrrolidone) that exhibits both hydrophilic and
lipophilic retention characteristics [43]. HLB has a tendency of retaining both polar and non-
polar compounds [43].
5.7.3.1 Oasis HLB cartridge methodology
The following solvents were prepared and used for SPE clean-up.
Eluting solution Composition of eluting solution
(1) LC-grade water at pH 2.5 was adjusted with formic acid.
(2) Ammonium acetate (5 mM) pH 4.8 was adjusted with acetic acid.
(3) A mixture of 90% acetonitrile and 10% of 5 mM ammonium acetate
pH 4.8.
(4) A mixture of 50% acetonitrile and 50% of 5 mM ammonium acetate
pH 4.8.
(5) A mixture of 10% acetonitrile and 90% of 5 mM ammonium acetate
pH 4.8.
In SPE, the cartridge was conditioned with 7 ml of LC-grade water (pH 2.5) at a flow rate of
1 ml/min. An aliquot of 4.3 ml of 100 ppb standard obtained after derivatization was loaded
into the Oasis HLB cartridge at a flow rate of 1 ml/min followed by washing with acidified
water (pH 2.5). After washing, the analytes were eluted with solvent no: (3).
5.7.3.2 Results for Oasis HLB extraction
Poor recovery of < 10% was obtained for AMPA with no recovery for glyphosate. Solvent no
(4) and (5) were used for elution of analytes but the recoveries were not improved. It was
concluded that a suitable solvent is required for the elution of analytes to improve recoveries

101
because all the fractions of solvents collected from the cartridge contained no analytes,
therefore the analytes were not recovered from the SPE cartridge.
5.7.4. Oasis MAX 6cc (150 mg) SPE cartridges
Oasis MAX cartridges contain a mixed-mode polymeric sorbent with a reversed-phase and an
anion-exchange functionalities [43]. In Oasis Max, strong anion-exchange quaternary amine
groups are on the surface of a poly (divinylbenzene-co-N-vinylpyrrolidone) copolymer.
During this work different methods were investigated.
5.7.4.1 MAX cartridge methodology
100 ppb standard containing a mixture of glyphosate and AMPA was prepared in water; the
pH of the standard was 6.3. The cartridge was conditioned by passing 2 ml of methanol, 4 ml
of 0.5 M sodium hydroxide and 2 ml of HPLC-grade water, respectively at a flow rate of 1
ml/min. After conditioning, the cartridge was rinsed with 4 ml of 0.5 M sodium hydroxide
and 2 ml of water respectively. Therefore, 20 ml of the standard was loaded into the cartridge
and washed with 2 ml of HPLC-grade water. The retained analytes were eluted with 4 ml of
0.5 M hydrochloric acid in acetonitrile. The eluted sample was dried under nitrogen gas and
reconstituted in water; the pH was adjusted back from 1.95 to 6.3 prior to derivatization.
5.7.4.2 Results and method optimization
Glyphosate was not recovered and 44% recovery of AMPA was achieved. The method was
optimized by decreasing the amount of sample loaded to 15 ml, this improved the AMPA
recovery to 48% but still glyphosate was not recovered. Further method optimization was
carried by increasing the volume of hydrochloric acid from 4 to 8 ml for the elution step, this
yielded 50% of AMPA and 22% of glyphosate recovery. The volume of hydrochloric acid
was increased further to 12 ml, but this did not improve the recoveries.

102
5.8 Analysis of environmental water samples
After the SPE method had been developed, it was applied in determination of residual
glyphosate and AMPA in environmental water samples. The environmental water samples
were collected from the following areas namely; industrial effluent water, Umdloti river,
Amanzimtoti river mouth and Hammersdale dam. The preparation of these samples was
discussed in section 4.4. Fig. 29 is the chromatogram for Hammersdale dam water sample
prepared without the use of SPE cartridge. Fig. 30 is the chromatogram for the same sample
after the matrix interferences have been removed by the use of C18 SPE cartridge. The
samples were prepared and injected into the polymer amino column.

103
Figure 29: Interferences in field sample.
Chromatogram demonstrates the matrix interferences in the sample obtained from Hammersdale dam. The sample was injected into a
polymeric amino column after derivatization with FMOC reagent. HPLC mobile phase (pH 10) contained 55% (v/v) acetonitrile in
water, and 50 mM phosphate buffer.

104
Figure 30: Removal of interferences using SPE.
Chromatogram of Hammersdale dam water sample after the removal of matrix interferences using SPE. The sample was cleaned-up on
SPE procedure described in the text (sample preparation), then injected in polymer amino column using the HPLC mobile phase (pH
10) contained 55% (v/v) acetonitrile in water, and 50 mM phosphate buffer.

105
5.8.1 Levels of glyphosate and AMPA in field samples
For field water samples, the presence and the levels of glyphosate and AMPA were
determined. The calibration graphs for both analytes were plotted and used for determining
the amount of analytes present in environmental samples (graphs in Figs. 31 and 32).
Table 14: Concentration and peak areas of analytes used for quantitative analysis
Glyphosate AMPA
Concentration (ppb) Peak area Concentration (ppb) Peak area
0.0 0.00 0.0 0.00
5.0 213165 0.5 142159
10 432104 1.0 354353
50 2693494 5.0 698176
100 5689459 10 1266045
50 6716395
100 13048668

106
Calibration line for glyphosate
y = 56159x
R2 = 0.998
0.00E+00
1.00E+06
2.00E+06
3.00E+06
4.00E+06
5.00E+06
6.00E+06
0 20 40 60 80 100 120
Concentration (ppb)
Pea
k ar
ea
Figure 31: Field samples; calibration line for glyphosate.
Calibration line for AMPA
y = 131255x
R2 = 0.9993
0.00E+00
2.00E+06
4.00E+06
6.00E+06
8.00E+06
1.00E+07
1.20E+07
1.40E+07
0 20 40 60 80 100 120
Concentration (ppb)
Pea
k ar
ea
Figure 32: Field samples; calibration line for AMPA.

107
The samples were collected in Hammersdale dam a day after the dam was sprayed with
glyphosate, and hence traces of both glyphosate and AMPA were detected in dam samples.
None of the analytes were detected in Umdloti River and only AMPA was detected in
industrial effluent, and Amanzimtoti river mouth.
Table 15: Performance of HPLC-FD for standard solutions
Method Analyte Response
Retention time (minutes) Glyphosate 25.4
AMPA 10.8
LOD (µg/l) Glyphosate 3.2
AMPA 0.23
LOQ (µg/l) Glyphosate 10.5
AMPA 3.2
Linearity range (µg/l) Glyphosate 5-100
AMPA 0.5-100
Calibration curve Glyphosate y = 56159x
AMPA y = 134107x
R2 Glyphosate 0.9983
AMPA 0.9996
Table 16: Concentrations of analytes detected in water
Sample Glyphosate
(ppb)
AMPA (ppb) N
Hammersdale Below LOQ 5.00 3
Umdloti river Not detected Below LOQ 3
Effluent Not detected 3.24 3
Amanzimtoti river mouth Not detected Below LOQ 3
Stream sample Not detected 3.15 3

108
Table 17: Concentrations of AMPA in samples not cleaned-up with SPE
Sample Concentration of AMPA
(ppb)
Concentration of
glyphosate (ppb)
No SPE SPE No SPE SPE
Stream 3.15 3.35 Not detected Not detected
Umdloti 0.68 0.71 Not detected Not detected
Amanzimtoti river mouth 0.30 0.86 Not detected Not detected
5.9 Method validation
The method was validated by spiking deionised water, tap water and umdloti river water with
100 µgl-1 of each analyte.
Table 18: Results for spiked deionised water
Analyte % recoveries Average SD % RSD
Glyphosate 110 111 111 111 0.577 0.520
AMPA 78.5 79.4 78.8 79 0.458 0.580
Table 19: Results for spiked tap water
Analyte % recoveries Average SD % RSD
Glyphosate 84.4 84.5 83.5 84 0.325 0.386
AMPA 109 111 109 109 1.154 1.059
Table 20: Results for spiked umdloti river water
Analyte % recoveries Average SD % RSD
Glyphosate 93.5 92.5 94 93 0.601 0.646
AMPA 77 76.8 77.5 77 0.361 0.469

109
5.10 Presence of AMPA in water
The presence of AMPA in dam and river water can be due to the following several possible
sources, namely
1. Glyphosate degradation to form AMPA.
2. AMPA can also originate from several phosphonates. These phosphonates can be
regarded as precursors for the environmental occurrence of AMPA. These phosphonates
are used in corrosion inhibitors, soaps, shampoos and detergents. This can cause AMPA
to be more widely spread in the environment even without the use of glyphosate.
5.11 Analytical methods employed for glyphosate and AMPA analysis
The method discussed in this project was compared with other analytical methods developed
for the analysis of glyphosate and AMPA in various matrices. It was found that the LOD’s
found in this work for glyphosate and AMPA, generally agrees with the results reported in
literature. Table 21 gives a summary of various sample preparation procedures, analytical
methods and LOD’s obtained for those methods.
A manuscript (Appendix H) on this work is being finalised for submission to Water South
Africa.

110
Table 21: Summary of analytical methods used for glyphosate and AMPA analysis
Sample Preparation Derivatization Matrix Analysis Detection LOD Reference
Online-SPE Pre-column Water, soil HPLC MS 5 ng/L for water, 5 µg/kg [3]
for soil, (Both)
SPE Non Water CE UV 85 µg/L (GLY), [4]
60 µg/L (AMPA)
Non Non Water IC CNLSD 53 µg/L (GLY) [5]
Non Pre-column Water HPLC UV 40 µg/L (GLY) [15]
SPE Pre-column Cereal HPLC FD 0.5 mg/kg (GLY) [16]
SLM Pre-column Fruit Juices HPLC UV 25 µg/L (Both) [17]
LLE, SPE Post-column Water HPLC FD < 2 µg/L (GLY) [19]
SPE Post-column Water HPLC FD 2 µg/L (GLY), [20]
4 µg/L (AMPA)
Non Pre-column Water CC-LC FD 1 µg/L (Both) [22]
SPE Pre-column Water, plant HPLC FD 0.16 µg/L (GLY in water), [24]
0.3 mg/kg (GLY in plant)
Online-SPE Pre-column Water HPLC MS 0.03 µg/L (Both) [25]
LE, AE Pre-column Water, soil GC MS 0.05 µg/L (GLY in water), [27]
0.003 µg/g (GLY in soil)
LLE Non Water IC SCD 42 µg/L (GLY) [28]

111
SE, Centrifuge Non Soybeans CE ECL 0.06 µg/mL (GLY), [32]
4.04 µg/mL (AMPA)
Non Pre-column Natural water HPLC FD 10 µg/L (GLY), [35]
5 µg/L (AMPA)
Non Post-column Water HPLC FD 1 µg/L (GLY) [36]
0.4 µg/L (AMPA)
SPE Pre-column Water HPLC FD 3.2 µg/L (GLY) This Work
0.23 µg/L (AMPA)

112
CHAPTER 6
CONCLUSIONS AND RECOMMENDATIONS
6.1 Removal of derivatization interferences
• Solvent extraction versus column coupling technique
In this study the two methods of removing derivatization interferences were solvent
extraction and column coupling technique. All derivatization interferences were effectively
removed by using the column coupling technique. Nevertheless, this technique suffers from
the instability of retention times at low pH values (pH 5.5). The column coupling mode could
not be used at high pH values. Furthermore, the columns degrade at pH 10. Therefore solvent
extraction is a preferred technique since it can be used at low and high pH values.
6.2 Conclusion for HPLC columns
6.2.1 Silica-based columns
The sensitivity for the HPLC methods discussed in this research is good for the determination
of glyphosate in water since the detection limits of 0.1 mg/l and less were obtained.
Although a good sensitivity was achieved in this research there are other problems that limit
the use of the HPLC methods for glyphosate analysis when using silica-based columns for
separation. A calibration line is not linear for the method that uses a C18 column. As for the
other two methods that use silica based amino column and column coupling technique, a
good linear response was obtained but the methods suffered from the instability of retention
times for the analyte. The problem with these methods arises from the formation of
fluorescing FMOC-OH during the derivatization reaction. As mentioned by other researchers
(literature review in section 2.1.1), the FMOC-OH creates problems in glyphosate analysis.
The major problem of silica-based columns is their degradation at high and low pH values.
Because of its mechanical strength and resistance to degradation, a polymer amino column
was used for the separation of glyphosate and AMPA at pH 10. Ethyl acetate was used to
remove the derivatization by-products.

113
6.2.2 Polymer amino column
The interferences arising from the derivatization process were removed with organic solvent
(ethyl acetate). For the determination of glyphosate and AMPA in different matrices, a
polymeric amino column was found to be most suitable. From this study it appeared that the
hydrophobic interaction of analytes with the polymeric backbone of the column complements
the ion exchange mechanism. The chromatographic method that uses a polymeric amino
column for the separation of glyphosate and AMPA after pre-column derivatization of
analytes with FMOC-Cl and removal of derivatization interferences with an organic solvent
has been demonstrated and is simple. This method can be used for the direct determination of
glyphosate and its major metabolite, AMPA, in water. For the application of the method for
field samples, a suitable sample clean-up procedure (solid-phase extraction) was required.
6.3 Conclusion for IC analysis
In view of the ionic character of the target analytes, IC should be the method of choice. IC
method used in this study was found to be simpler than HPLC methods in that it does not
require the derivatization of analytes (therefore there are no FMOC-OH interferences). IC
method is fast and inexpensive but it has the following drawbacks.
1. The major degradation product of glyphosate, known as AMPA, could not be determined
simultaneously with glyphosate using this method.
2. In the absence of modification, IC lacks the level of sensitivity required for the trace
analysis of glyphosate and AMPA (since 1 mg/l is the limit of detection for unmodified
IC).
• Recommendations:
To attain the µg/l levels (permissible in drinking water nationally and internationally) using
IC, the use of modifications such as column-suppression, pre-concentration and more
sensitive detectors is recommended.

114
6.4 Conclusion on Solid phase extraction
Acceptable percent recoveries were obtained using SPE cartridges packed with 500 mg of C18
sorbent. Therefore these cartridges were used for clean up in the determination of glyphosate
and AMPA in environmental water samples. The recoveries obtained in this work when using
500 mg C18 SPE cartridges are much better compared to the overall recovery of 86% obtained
by Hogendoorn et al [16] when using the same packing material (C18 sorbent).
Low percent recoveries (≤ 44%) were obtained when using the Oasis cartridges although the
use of HLB cartridges has been previously reported [3] with acceptable recoveries. During
this investigation, it was found that the analytes were not well eluted from the cartridge.
• Recommendation
A suitable solvent combination has to be investigated for elution of analytes from Oasis HLB
and Oasis MAX cartridges.
6.5 Overall conclusion
• To produce high amount of fluorescing analytes, derivatization reaction was carried out
with FMOC-Cl reagent at pH 9. The effect of derivatization time and the effect of
FMOC-Cl concentration were investigated. It was discovered that the optimal amounts of
the fluorescing products are produced by using 0.5 mM of FMOC-Cl reagent and
derivatization reaction was complete in 30 minutes at room temperature.
• A rapid method for sample preparation has been described in this report. Derivatization
and organic interferences were effectively removed in a solvent extraction step. The
existing SPE method developed by Hogendoorn et al [16] for the clean-up of cereal
samples was optimized and used for the clean-up of environmental water samples. This
simple and fast SPE method was used to eliminate the relatively non-polar interferences
present in river, dam and effluent water samples.
• A sensitive and rapid HPLC method was determined for the simultaneous determination
of glyphosate and AMPA in water. The separation of glyphosate and AMPA in this
method was achieved by using a polymeric amino column and a mobile phase at pH 10.

115
� The methods developed for sample preparation and HPLC analysis were applied for the
determination of concentrations of glyphosate and AMPA in water samples collected
from dam, river and industrial effluent. Whereas trace amounts of analytes were detected
in dam water, neither of them were detected in river water. Only AMPA was detected in
industrial effluent water.
� The current method can be applied in routine analysis of environmental water samples
with small amount of samples available.

116
REFERENCES
[1] http://en.wikipedia.org/wiki/herbicide, Herbicides from wikipedia, the free
encyclopedia. Access date July 2007.
[2] Sato, k., Jin, J., Takeuchi, T., Miwa, T., Suenami, K., Takakoshi, Y., Kanno, S.,
Intergrated pulsed amperometric detection of glufosinate, bialaphos and glyphosate at
gold electrodes in anion-exchange chromatography. Journal of Chromatography A
919, 2001, 313-320.
[3] Ibanez, M., Pozo, O. J., Sancho, J. V., Lopez, F. J., Hernandez, F., Residue
determination of glyphosate, glufosinate and aminomethlyphosphonic acid in water
and soil samples by liquid chromatography coupled to electrospray tandem mass
spectrometry. Journal of Chromatography A 1031, 2005, 145-155.
[4] Chang, S. Y., Liao, C., Analysis of glyphosate, glufosinate and
aminomethylphosphonic acid by capillary electrophoresis with indirect fluorescence
detection. Journal of Chromatography A 959, 2002, 309-315.
[5] You, J., Koropchak J. A., Condensation nucleation light scattering detection with ion
chromatography for direct determination of glyphosate and its metabolite in water.
Journal of Chromatography A 989, 2003, 231-238.
[6] http://www.pan-uk.org/pestnews/actives/glyphosa.htm, Pesticides News, [The article
first appeared in pesticides News No.33, September 1996, p28-29]. Access date
2007/7/14.
[7] http://www.poptel.org.uk/panap/pest/pe-gly.htm, Pesticide Action Network – Asia
and the Pacific. Prepared by: Meriel Watts and Ronald Macfarlane.
[8] http://www.pan-uk.org/pestnews/actives/glufosin.htm, Pesticides News, [This article
first appeared in pesticides News No.42, December 1998, p20-21]. Access date
2006/10/11.
[9] Kataoka, H., Ryu, S., Sakiyama, N., Makita, M., Simple and rapid determination of
the herbicides glyphosate and glufosinate in river water, soil and carrot samples by
gas chromatography with flame photometric detection. Journal of Chromatography A
726, 1996, 253-258.
[10] Forlani, G., Mangiagalli, A., Nielsen, E., Suardi, C. M., Degradation of the
phosphonate herbicide glyphosate in soil: Evidence for a possible involvement of
unculturable micro organisms. Soil Biology and Biochemistry 31, 1999, 991-997.

117
[11] Schuette, J., Environmental fate of glyphosate. Department of Pesticide Regulation.
Sacramento, CA 95824-5624. 1998.
[12] Mehrsheikh, A., Bleeke, M., Brosillon, S., Laplanche, A., Roche, P., Investigation of
the mechanism of chlorination of glyphosate and glycine in water. Water Research 40,
2006, 3003-3014.
[13] Maughan, E. V., Gericke, G., Roscoe, G., The measurement of TOC in the cycle fluid
of modern power plants and correct selection of monitoring equipment. Power Plant
Chemistry 2 (4), 2000, 219-221.
[14] Guo, Zhong-Xian., Cai, Q., Yang, Z., Determination of glyphosate and phosphate in
water by ion chromatography-inductively coupled plasma mass spectrometry
detection. Journal of Chromatography A 1100, 2005, 160-167.
[15] Peruzzo, P. J., Porta, A. A., Ronco, A. E., Levels of glyphosate in surface waters,
sediments and soils associated with direct sowing soybean cultivation in north
pampasic region of Argentina. Environmental Pollution 156, 2008, 61-66.
[16] Hogendoorn E. A., Ossendrijver, F. M., Dijkman, E., Baumann, R. A., Rapid
determination of glyphosate in cereal samples by means of pre-column derivatisation
with 9-fluorenylmethyl chloroformate and coupled-column liquid chromatography
with fluorescence detection. Journal of Chromatography A 833, 1999, 67-73.
[17] Khrolenko, M. V., Wieczorek, P. P., Determination of glyphosate and its metabolite
aminomethylphosphonic acid in fruit juices using supported-liquid membrane
preconcentration method with high-performance liquid chromatography and UV
detection after derivatization with p-toluenesulphonyl chloride. Journal of
Chromatography A 1093, 2005, 111-117.
[18] Department of Health and Population Development (DHPD), GNR.246 of February
1994: Regulations governing the maximum limits for pesticide residues that may be
present in foodstuff, Pretoria, 1994.
[19] Abdullah, M. P., Daud, J., Hong, K. S., Yew, C. H., Improved method for the
determination of glyphosate in water. Journal of Chromatography A 697, 1995, 363-
369.
[20] Mallat, E., Barcelo, D., Analysis and degradation study of glyphosate and of AMPA
in natural waters by means of polymeric and ion-exchange solid-phase extraction
columns followed by ion chromatography-post-column derivatization with
fluorescence detection. Journal of Chromatography A 823, 1998, 129-136.

118
[21] Hidalgo, C., Rios, C., Hidalgo, M., Salvado, V., Sancho, J. V., Hernandez, F.,
Improved coupled-column liquid chromatographic method for the determination of
glyphosate and aminomethylphosphonic acid residues in environmental waters.
Journal of Chromatography A 1035, 2004, 153-157.
[22] Sancho, J. V., Hernandez, F., Lopez, F. J., Hogendoorn, E. A., Dijkman, E., Zoonen,
P., Rapid determination of glufosinate, glyphosate and aminomethylphosphonic acid
in environmental water samples using precolumn fluorogenic labelling and coupled-
column liquid chromatography. Journal of Chromatography A 737, 1996, 75-83.
[23] Ghanem, A., Bados, P., Kerhoas, L., Dubroca, J., Einhorn, J., Glyphosate and AMPA
analysis in sewage sludge by LC-ES-MS/MS after FMOC derivatization on strong
anion-exchange resin as solid support. Analytical Chemistry 79, 2007, 3794-3801.
[24] Nedelkoska, T. V., Low, G. K-C., High-performance liquid chromatographic
determination of glyphosate in water and plant material after pre-column
derivatization with 9-fluorenylmethyl chloroformate. Analytica Chimica Acta 511,
2004, 145-153.
[25] Vreeken, R. J., Speksnijder, P., Bobeldijk-pastorova, I., Noij, Th. H. M., Selective
analysis of the herbicides glyphosate and aminomethylphosphonic acid in water by
on-line solid-phase extraction-high-performance liquid chromatography-electrospray
ionization mass spectrometry. Journal of Chromatography A 794, 1998, 187-199.
[26] Tadeo, J. L., Sanchez-Brunete, C., Perez, R. A., Fernandez, M. D., Analysis of
herbicide residues in cereals, fruits and vegetables. Journal of Chromatography A 882,
2000, 175-191.
[27] Borjesson, E., Torstensson L., New methods for determination of glyphosate and
(aminomethyl)phosphonic acid in water and soil. Journal of Chromatography A 886,
2000, 207-216.
[28] Zhu, Y., Zhang, F., Tong, C., Liu, W., Determination of glyphosate by ion
chromatography. Journal of Chromatography A 850, 1999, 297-301.
[29] Bauer, K. H., Knepper, T. P., Maes, A., Schatz, V., Voihsel, M., Analysis of polar
organic micro pollutants in water with ion chromatography-electrospray mass
spectrometry. Journal of Chromatography A 837, 1999, 117-128.
[30] Cikalo, M. G., Goodall, D. M., Matthews, W., Analysis of glyphosate using capillary
electrophoresis with indirect detection. Journal of Chromatography A 745, 1996, 189-
200.

119
[31] Corbera, M., Hildago, M., Salvado, V., Wieczorek, P. P., Determination of glyphosate
and aminomethylphosphonic acid in natural water using capillary electrophoresis
combined with enrichment step. Analytica Chimica Acta 540, 2005, 3-7.
[32] Chiu, H. Y., Lin, Z., Tu, H., Whang, C., Analysis of glyphosate and
aminomethylphosphonic acid by capillary electrophoresis with
electrochemiluminescence detection. Journal of Chromatography A 1177, 2008, 195-
198.
[33] Jiang, J., Lucy, C. A., Determination of glyphosate using off-line ion exchange
pre-concentration and capillary electrophoresis-laser induced fluorescence detection.
Talanta 72, 2007, 113-118.
[34] Sancho, J. V., Lopez, F. J., Hernandez, F., Hogendoorn, E. A., van Zoonen, P., Rapid
determination of glufosinate in environmental water samples using 9-
fluorenylmethoxycarbonyl precolumn derivatization, large-volume injection and
coupled-column liquid chromatography. Journal of Chromatography A 678, 1994, 59-
67.
[35] Miles, C. J., Wallace, L. R., Moye, H. A., Determination of glyphosate herbicide and
aminomethylphosphonic acid in natural waters by liquid chromatography using pre-
column fluorogenic labelling with 9-fluorenylmethylchloroformate. Journal of the
Association of Official Analytical Chemists 69, 1986, 458-461.
[36] Wigfield, Y. Y., Lanouette, M., Simplified liquid chromatographic determination of
glyphosate and metabolite residues in environmental water using post-column
fluorogenic labelling. Analytica Chimica Acta 233, 1990, 311-314.
[37] Kealey, D., Haines, P. J., Analytical Chemistry. Section D1, Pages 109-118.
[38] Gunzler, H., Williams, A., Handbook of Analytical techniques. Volume 1, Chapter
12, Page 261-326.
[39] Kennedy, J. H., Analytical Chemistry Principles. Chapter 19, Page 681-687.
[40] Robards, K., Haddad, P. R., Jackson, P. E., Principles of Modern Chromatographic
Methods. Chapter 5 and 6, Pages 257-289 and 358-365.
[41] Lindsay, S., High Performance Liquid Chromatography. Second edition, Analytical
Chemistry by open Learning. Chapter 7, Pages 149-186.
[42] Mitra, S., Sample Preparation Techniques in Analytical Chemistry. Chapter 2, Pages
78-113.
[43] Waters, Oasis HLB product and generic method information. Waters application note,
volume 720000609EN, 2003, 10-21.

120
APPENDICES
Appendix A: Abbreviations
POEA Polyoxyethylene amine
US EPA United States Environmental Protection agency
M Molar or moles per litre
µg/ml Micrograms per millilitre
µg/l Micrograms per litre
ng/l Nanograms per litre
mg/l Milligrams per litre
mg/kg Milligrams per kilogram
mg Milligram
ml Millilitre
L Litre
µl Micro litre
ppm Parts per million
ppb Parts per billion
GLY Glyphosate
AMPA Aminomethylphosphinic acid
HPLC High performance liquid chromatography
HPLC-FD High performance liquid chromatography – fluorescence detector
LC Liquid Chromatography
GC Gas Chromatography
IC Ion Chromatography
ICP-MS Inductively Coupled Plasma-Mass spectrometry
FMOC-Cl 9-fluorenylmethylchloroformate
OPA o-phthalaldehyde
MERC Mercaptoethanol
SPE Solid-phase extraction
LC-ESI-MS/MS Liquid chromatography coupled to electrospray tandem mass
spectrometry
MS Mass spectrometry
SD Standard deviation

121
% RSD Percent relative standard deviation 0C Degrees Celsius
% Percent
ACN Acetonitrile
LOD Limit of detection
LOQ Limit of quantification
CNLSD Condensation nucleation light scattering detection
SLM Supported liquid membrane
SCD Suppressed conductivity detection
FD Fluorescence detection
SE Solvent extraction
ECL Electro-chemiluminescence
CC-LC Coupled-column liquid chromatography
FPD Flame photometric detector
LE Ligand-exchange
AE Anion-exchange

122
Appendix B: Explanation of equations used in text
Limit of detection (LOD) = S/N = 3
Where S/N is signal to noise ratio
Limit of quantification (LOQ) = S/N = 10
Standard deviation (SD) = )1/()( 2 −−−
∑ nxxi
ix is the measured value, −x is the mean or average and n is the number of measured values.
Mean (Average), −x = nxxxx n
/)...(321
++++
Relative standard deviation (% RSD) = (SD / −x ) x 100

123
Appendix C: Chromatograms for samples injected without being derivatized
1. Stream sample

124
2. Umdloti sample

125
3. Amanzimtoti sample

126
Appendix D: Chromatograms for derivatized samples
1. Stream sample

127
2. Umdloti sample
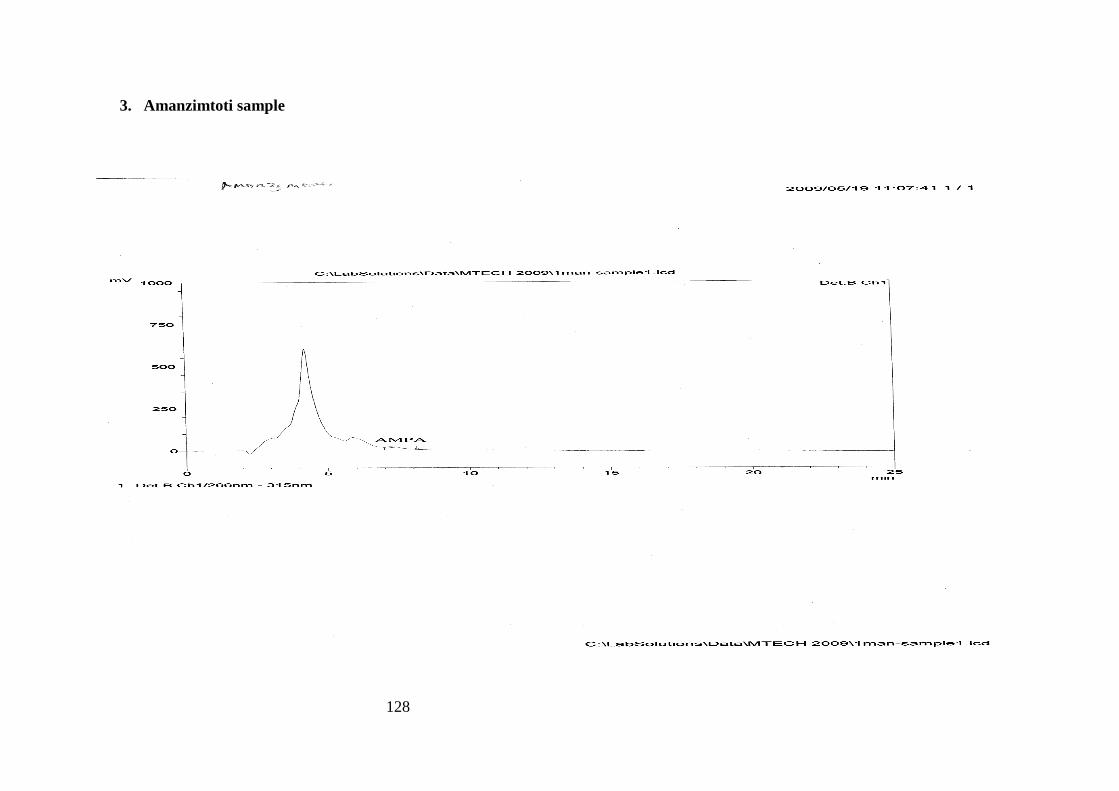
128
3. Amanzimtoti sample

129
Appendix E: Chromatograms for samples derivatized followed by SPE clean-up
1. Stream sample

130
2. Umdloti sample

131
3. Amanzimtoti sample

132
Appendix F: Chromatograms for spiked samples.
These samples were spiked with 100 mg/l of both glyphosate and AMPA, then derivatized with FMOC-Cl followed by SPE.
1. Stream sample

133
2. Umdloti sample

134
3. Amanzimtoti sample

135
Appendix G: SPE apparatus.
Vacuum
Vacuum manifold
Removable
SPE
Sample