optimeal eu dataset€¦ · and helps to elevate the level of discussion on eating better for...
TRANSCRIPT

1-1
v
Optimeal EU dataset
Methodology and data development
DATE: 14-2-2019

1-2
Optimeal is a software package for optimization of diets on health and sustainability. It was developed by Blonk Consultants in cooperation with Voedingscentrum (the Netherlands Nutrition Centre). Optimeal and the included environmental data have been applied in several peer-reviewed scientific papers.
Title Optimeal EU dataset
Date 14-2-2019
Place Gouda, NL
Authors Roline Broekema
Hans Blonk
Elena Koukouna
Blonk Consultants
Blonk Consultants
Blonk Consultants
Mike van Paassen Blonk Consultants
Optimeal (+31) 0182 579970
Gravin Beatrixstraat 34 www.optimeal.info
2805 PJ Gouda [email protected]

1-3
Optimeal EU dataset
Methodology and data development

1
Summary This document describes the basic principles of Optimeal, and it explains the methodology to derive the
background datasets in Optimeal and specifically how the EU dataset has been derived.
The Challenge
The world’s food system faces a great balancing act. By 2050 it must feed around 10 billion people in a more
sustainable way. In addition, diets should prevent both malnutrition and non-communicable diseases, like
obesity and cardiovascular disease.
Optimeal is developed to support organizations to grasp the full picture of possible changes to come to healthy
and sustainable diets. It identifies the possibilities to improve product performance to make food products more
future proof (healthy and sustainable)
Optimeal
Optimeal is a tool that uses optimization to solve dietary questions that involve sustainability as well as
nutritional parameters. The tool identifies new opportunities and helps to elevate the level of discussion on
eating better for a healthy and sustainable future.
Using optimization requires many data. Optimeal comes with a default dataset for the EU which is mainly built
on EFSA data. The EU dataset consists of:
1. Reference diet (chapter 2)
2. Nutritional constraints (chapter 3)
3. Nutritional properties for the products in the reference diet (chapter 4)
4. Environmental properties (LCA impacts) for the products in the reference diet (chapter 5)
An optimal diet is a diet that complies to the constraints that have been set for nutrition and environment. This
optimal diet can be derived by two optimization methods: Linear (LP) or Quadratic programming (QP). A penalty
is attributed for every change and the goal of the optimization is to minimise the amount of penalties.
Reference diet
The reference diet (EU) is the starting point of the optimization. It is based on Food Consumption Surveys in
Europe and is a representation of the average EU diet. The diet is constructed for doing environmental oriented
optimizations with a synoptic and limited set of products (173 products). To derive the EU reference dataset the
EFSA Comprehensive European Food Consumption Database (EFSA, 2018a) was used. It is a source of information
on food consumption across the European Union and contains detailed data for many EU countries.
Nutritional constraints
The nutritional constraints define if a diet can be considered healthy or “nutritionally sound”. The upper and
lower limits of the nutritional properties are the boundaries used in the optimization. If the nutrition provided
by the diet falls outside one of the boundaries, it will be corrected during the optimization to fit the nutritional
constraints. Two reports of EFSA substantiate the nutritional constraints for the EU: Dietary Reference Values for
Nutrients (EFSA, 2017) and Tolerable Upper Intake Values for Vitamins and Minerals (EFSA, 2006).
Nutritional properties
The nutritional properties of the products in the EU database are based on the EFSA Food Composition Data
(EFSA, 2018b). This database contains over 2500 products with multiple preparation methods (e.g. cooking in
water, baking, cooking in oil, steaming) reported by 10 European countries1. For each nutrient, an average was
calculated based on the reporting countries. Missing nutrient data were supplemented with data from the NEVO
1 Denmark, Finland, France, United Kingdom, Iceland, Netherlands, Portugal, Serbia, Sweden, Slovenia.

2
(Dutch Food Composition Database), the USDA Food Composition Databases, or a similar product or preparation
method from the EFSA database was used as a proxy.
Environmental properties
The environmental properties of products are important for determining the environmental sustainability of a
diet. Environmental properties of all the products in the reference diet are determined using the LCA
methodology. This methodology captures the impact of a product (or service) through-out its life cycle. The list
of impact categories assessed for the EU Optimeal dataset are listed here:
Impact category unit
Global warming - excl LUC kg CO2eq
Fine particulate matter formation kg PM2.5 eq
Terrestrial acidification kg SO2 eq
Freshwater eutrophication kg P eq
Marine eutrophication kg N eq
Land use m2a crop eq
Fossil resource scarcity kg oil eq
Water consumption m3
The system boundary in this database is defined as from Farm-to-Fork, including all activities taking place at the
farm (cultivation or husbandry), all the way through processing, retail and consumption. The LCAs carried out for
Optimeal are in line with the the ISO 14040/44 series (ISO, 2006a, 2006b). For the life cycle stages from
processing to plate the Product Environmental Footprint (PEF) guidance (European Commission, 2017) and PEF
default data have been used.
Limitations
There are a couple of limitations of the EU Optimeal dataset which should be considered:
Scope
The scope of the EU Optimeal dataset is the European Union, including the United Kingdom at the time of
publication. This is a large region with high dietary variation and therefore not representative of individual
countries. The EU Optimeal dataset comes with several nutritional profiles specified per gender, age and activity
level, but only one EU average diet. This EU average diet should be adapted to the target group of the study and
its nutritional profile. The EU Optimeal dataset fits for use in the Optimeal context but should not be the starting
point for dietary advice on a more individual level.
Compliance and data quality
The EU Optimeal dataset is not fully compliant to the PEF guidance and the PEFCRs per product category. Since
the PEFCRs are not consistent in terms of allocation, using the PEFCRs as a starting point would lead to an internal
inconsistent database. For analyses, using the EU Optimeal dataset, consistency is very relevant and valued more
than compliance to the PEF guidance and PEFCRs. Data quality has not been monitored for the EU Optimeal
dataset. We are working on implementing data quality rating in the database development and wish to include
this rating in a future release.
3
Table of Contents 1 Introduction .................................................................................................................................................... 5
1.1 Sustainable and healthy nutrition ......................................................................................................... 5
1.2 Why Optimeal? ...................................................................................................................................... 5
1.3 How does Optimeal work ...................................................................................................................... 5
1.3.1 Reference diet ................................................................................................................................... 6
1.3.2 Nutritional constraints ...................................................................................................................... 6
1.3.3 Properties .......................................................................................................................................... 6
1.3.4 Optimization ...................................................................................................................................... 6
1.4 Reading guidance .................................................................................................................................. 7
2 Reference diet ................................................................................................................................................ 8
2.1 EFSA Comprehensive European Food Consumption Database ............................................................. 8
2.2 Defining the EU reference diet .............................................................................................................. 8
2.3 Product constraints ............................................................................................................................... 9
3 Nutritional constraints ................................................................................................................................. 10
3.1 Dietary reference values ...................................................................................................................... 10
3.2 Different nutritional profiles ............................................................................................................... 10
4 Nutritional properties................................................................................................................................... 11
5 Environmental properties ............................................................................................................................ 12
5.1 Introduction ......................................................................................................................................... 12
5.2 Life Cycle Assessment (LCA) framework .............................................................................................. 12
5.3 Scope ................................................................................................................................................... 13
5.3.1 Included products............................................................................................................................ 13
5.3.2 Function, functional unit and reference flow .................................................................................. 13
5.3.3 Allocation method ........................................................................................................................... 13
5.4 Data generation and quality procedure .............................................................................................. 14
5.4.1 Workflow in dataset development.................................................................................................. 14
5.4.2 Data quality assessment and review ............................................................................................... 15
5.5 Methodology and data used ................................................................................................................ 15
5.5.1 Agriculture and animal husbandry .................................................................................................. 15
5.5.2 Market mix and transport of raw ingredients to processing plant ................................................. 16
5.5.3 Processing ....................................................................................................................................... 16
5.5.4 Packaging ......................................................................................................................................... 18
5.5.5 Distribution...................................................................................................................................... 19
5.5.6 Supermarket .................................................................................................................................... 20
5.5.7 Consumption ................................................................................................................................... 20
5.5.8 Final (food losses) ............................................................................................................................ 22

4
6 Limitations of the EU Optimeal dataset ....................................................................................................... 23
7 References .................................................................................................................................................... 24
8 Annex 1 List of food products....................................................................................................................... 27
9 Annex 2 Building the reference diet ............................................................................................................. 29

5
1 Introduction This report is part of the Optimeal software package for the EU. Blonk Consultants developed Optimeal in 2012
to support the Netherlands Nutrition Centre (Voedingscentrum) in defining their dietary guidelines at that time.
Taking account of more diverse dietary habits and sustainability aspects were new challenges for which
optimization is the most appropriate method. Optimeal is a tool that uses optimization to solve questions that
involve sustainability as well as nutritional parameters. Optimeal gives understanding of the full picture of
healthy and sustainable nutrition and allows assessment of a multitude of options. It identifies new opportunities
and helps to elevate the level of discussion on eating better for healthy and sustainable future.
1.1 Sustainable and healthy nutrition The world’s food system faces a great balancing act (World Resources Institute (Searchinger & et al., 2013). By
2050 it must feed around 10 billion people (United Nations Department of Economic and Social Affairs Population
Division, 2017) in a more sustainable way: without increasing the area of agricultural land, using less natural
resources and emitting less greenhouse gases. In addition, diets should be healthier, reduce disease risks and
meet human nutritional needs. They should prevent both malnutrition and non-communicable diseases, like
obesity and cardiovascular disease. This research area is at the center of recent studies like the Eat Lancet report
(Willett et al., 2019). Sustainable nutrition attempts to provide answers on how to meet these challenges.
1.2 Why Optimeal? A main challenge for all food and beverage producing companies is to become more “future proof” with respect
to nutrition, environmental and other sustainability concerns. Making food and beverage products more future
proof means improving the balance between the nutrients provided and the environmental impact. Optimeal is
developed to help companies create insight in their product’s position regarding the balance between nutritional
and sustainability aspects. It supports identifying the possibilities to improve the performance of products.
Optimeal came about from the fact that food and beverage items all have their specific nutritional contribution
and cannot be simply compared. For instance, milk and soy drink are marketed as alternatives but are from a
nutritional viewpoint not comparable. These differences need to be considered when replacement is studied, for
health or sustainability reasons. Another example is the comparison between meat and meat alternatives. This
comparison is often made in analyses related to the shift from animal protein to vegetable protein. The
nutritional profile of meat products and meat alternatives is not similar and thus their environmental profiles
should not be simply compared on the mass basis. Their nutritional content should be considered for a fair
comparison.
Optimeal analyses the impact of shifts between products in a diet or changes of a product’s consumption by
evaluating the effect on the complete diet and how the diet should optimally be adapted to these changes. The
starting point can be an average diet based on national food consumption surveys or any other realistic and
relevant diet for a target group. When changes in the reference diet occur, for instance by changing from milk to
soy drink, Optimeal will find the optimal adjustment to the new diet so it meets all the nutritional (and
environmental) boundaries that have been set. During an optimization, products are added and excluded from
the diet to make this happen, compensating for the nutritional changes due to the shift in product consumption.
1.3 How does Optimeal work Using optimization to gain insight into sustainable nutrition requires a lot of data. Optimeal comes with a default
dataset for the EU. A dataset consists of:
1. Reference diet
2. Nutritional constraints
3. Nutritional properties for the products in the reference diet
4. Environmental properties for the products in the reference diet

6
1.3.1 Reference diet The reference diet is the starting point of the optimization. It is based on Food Consumption Surveys and is
representative of the average diet in the region of focus. For the EU the EFSA Comprehensive European Food
Consumption Database has been used. It is a source of information on food consumption across the European
Union. It contains detailed data for many EU countries.
For the EU dataset, an average has been made from the EFSA Comprehensive European Food Consumption
Database (EFSA, 2018a), resulting in an average EU diet. Products can be added to the reference diet/dataset as
well.
1.3.2 Nutritional constraints Nutritional constraints determine whether a diet is healthy. The nutritional constraints are upper and lower
boundaries for all the nutritional properties (e.g. consumption of dietary fibre should be over 25g per person per
day). The optimal diet falls in between the upper and lower boundaries. Additional constraints can be set for
other properties, like environmental properties or price.
The nutritional constraints are based on EFSA Dietary Reference Values (EFSA, 2017)(EFSA, 2006).
1.3.3 Properties Various properties of the products are needed to be able to optimize a reference diet. About 60 nutritional
properties (e.g. gram protein, microgram vitamin D and milligram magnesium per 100 gram of food product) as
well as 8 environmental properties (e.g. impact on climate change and water depletion per 100 gram of food
product) are part of the default dataset. Properties can also be added to the default dataset, for instance on
price.
Nutritional properties of all the products in the reference diet are based on EFSA Food Composition Data (EFSA,
2018b). Environmental properties of all the products in the reference diet are determined using Life Cycle
Assessment (LCA).
1.3.4 Optimization The optimal diet is a diet that complies to the constraints that have been set for nutrition and environment, and
that is as similar as possible to the reference diet. Reasoning behind this is that people find changing their dietary
habits quite difficult and adoption of dietary changes is likelier to happen when the suggested diet is close to the
reference diet.
Optimeal uses either Linear (LP) or Quadratic programming (QP) for the optimization. A penalty is attributed for
every change and the goal of the
optimization is to minimise the
amount of penalties. Using LP a
specific amount of changes comes
with a set amount of penalty, but
with QP the penalty increases with
the amount of changes per
product. This results in more
changed products than when
applying LP. It is also possible to
approach a goal, either directly or
using stepwise optimization.
Figure 1 Linear vs Quadratic programming
7
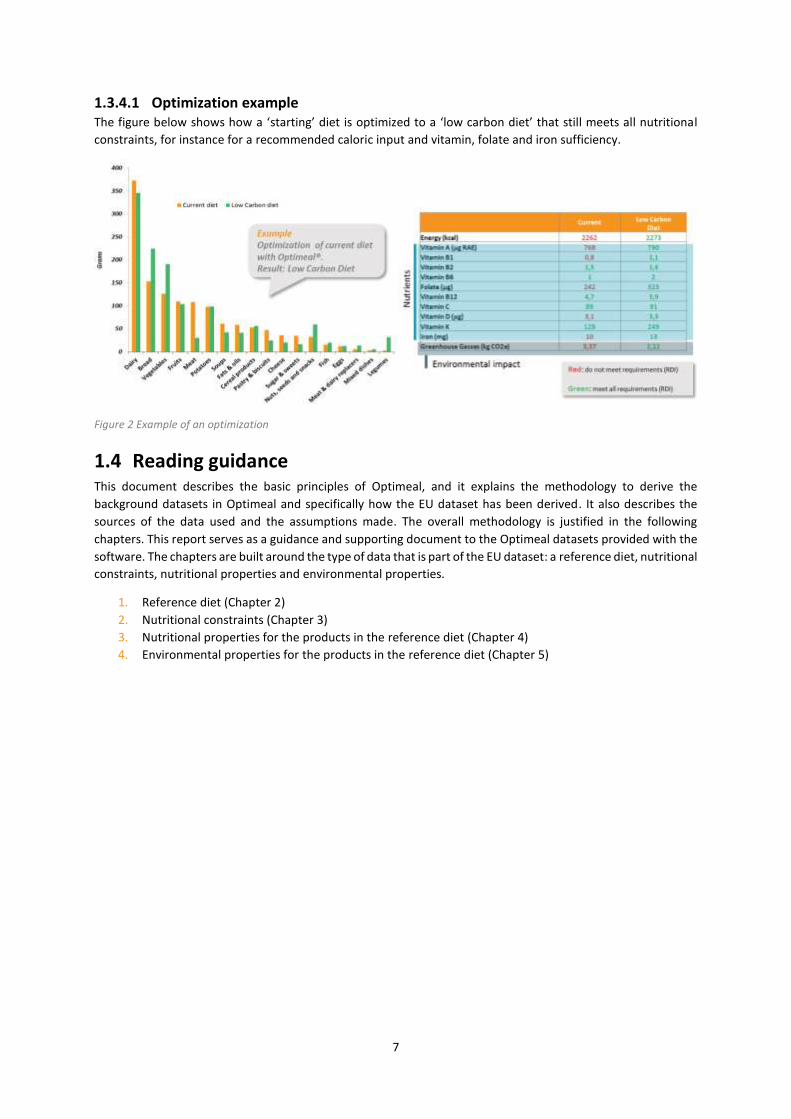
1.3.4.1 Optimization example The figure below shows how a ‘starting’ diet is optimized to a ‘low carbon diet’ that still meets all nutritional
constraints, for instance for a recommended caloric input and vitamin, folate and iron sufficiency.
Figure 2 Example of an optimization
1.4 Reading guidance This document describes the basic principles of Optimeal, and it explains the methodology to derive the
background datasets in Optimeal and specifically how the EU dataset has been derived. It also describes the
sources of the data used and the assumptions made. The overall methodology is justified in the following
chapters. This report serves as a guidance and supporting document to the Optimeal datasets provided with the
software. The chapters are built around the type of data that is part of the EU dataset: a reference diet, nutritional
constraints, nutritional properties and environmental properties.
1. Reference diet (Chapter 2)
2. Nutritional constraints (Chapter 3)
3. Nutritional properties for the products in the reference diet (Chapter 4)
4. Environmental properties for the products in the reference diet (Chapter 5)
8
2 Reference diet The reference diet (EU) is the starting point of the optimization. It is based on Food Consumption Surveys and is
representative of the EU average diet. The diet is constructed for doing environmental oriented optimizations
with a synoptic and limited set of products. To derive the EU reference dataset the EFSA Comprehensive
European Food Consumption Database (EFSA, 2018a) was used. It is a source of information on food
consumption across the European Union and contains detailed data for many EU countries.
The EU reference diet is an average diet over all age categories, activity levels and gender. The EU reference diet
is composed of 173 products (see chapter Error! Reference source not found.) out of 4000+ products.
2.1 EFSA Comprehensive European Food Consumption Database The EFSA Comprehensive European Food Consumption Database has been built from existing national
information on food consumption at a detailed level, as explained in EFSA (2011). Competent organizations in 19
European Union ‘s Member States provided EFSA with data from the most recent national dietary survey in their
country, at the level of consumption by the individual consumer. The countries are:
Austria
Belgium
Bulgaria
Cyprus
Czech Republic
Germany
Denmark
Spain
Finland
France
United Kingdom
Greece
Hungary
Ireland
Italy
Latvia
Netherlands
Romania
Sweden
2.2 Defining the EU reference diet The EFSA Comprehensive European Food Consumption Database describes food consumption using the food
classification and description system FoodEx. This system is aimed at covering the need to describe food in data
collections across different food safety domains. The FoodEx system uses an exposure-oriented hierarchy. It is
designed to facilitate the grouping of food items for exposure (for instance to toxins) calculations. The exposure
hierarchy consists of 4 445 terms, including hierarchy terms (134 terms) and reportable terms (4 311 terms). The
exposure hierarchy is structured in six levels with 21 groups at the top level. The top level are very generic food
groups like ‘dairy and dairy products’, ‘legumes, nuts and oilseeds’ and ‘grains and grain-based products’. At this
level the products are too generic to attribute nutritional and environmental properties to, because the diversity
within the groups is too big. At the most detailed level however there are too many products to attribute
nutritional and environmental properties to. At the same time the differences between the products at this level
can be very small in terms of composition, nutrition and environmental impact. This level of detail might not be
sensible for the analysis.
We’ve composed the EU reference diet based mostly on level 2 of FoodEx. For some level 2 product groups we’ve
selected one level 3 product to represent the whole product group. For instance, for level 2 ‘grains for human
consumption’ we have selected rice. Rice represents over 95% of the EU consumption of ‘grains for human
consumption’. For other level 2 product groups we’ve selected multiple level 3 products. For instance, for level
2 ‘bread and rolls’ we selected wheat bread and rolls, rye bread and rolls, mixed wheat and rye bread and rolls
and multigrain bread and rolls. These 4 types of bread and rolls represent over 85% of the EU consumption for
‘bread and rolls’. The coverage per product group (level 2) is at minimum 80%, but for some product groups the
9
coverage is close to 100%. Chapter 9 provides more inside in the decisions that were made in composing the
reference diet.
2.3 Product constraints Product constraints help to ensure that the optimized diet is acceptable to the general consumer. It ensures that
the optimized diet does not contain large amounts of individual products which are generally not consumed in
large quantities. The EFSA Comprehensive European Food Consumption Database (EFSA, 2018a) was used to
define these product constraints. For the maximum consumption the 99th percentile of Food consumption was
multiplied by two. This allows for reasonable dietary changes in the light of healthy, sustainable and adoptable
diets.

10
3 Nutritional constraints The nutritional constraints define if a diet can be considered healthy or “nutritionally sound”. The upper and
lower limits of the nutritional properties are the boundaries used in the optimization. If the nutrition provided
by the diet falls outside of one of the boundaries, it will be corrected during the optimization to fit the nutritional
constraints. Two reports of EFSA substantiate the nutritional constraints for the EU: Dietary Reference Values for
Nutrients (EFSA, 2017) and Tolerable Upper Intake Values for Vitamins and Minerals (EFSA, 2006).
3.1 Dietary reference values Dietary Reference Values (DRVs) is the umbrella term for the complete set of nutrient reference values which
include population reference intakes (PRIs2), the average requirements (ARs3), adequate intakes (AIs4) and
reference intake (RIs5) ranges for macronutrients. These values indicate the amount of a nutrient which must be
consumed on a regular basis to maintain health in an otherwise healthy individual (or population) (EFSA, 2017).
PRIs, ARs, AIs and RIs were not all available for all the nutritional properties. When a choice was to be made
between PRIs, ARs and AIs; PRI was chosen over AR and AI, and AR was chosen over AIs. RIs were used for
macronutrients like ‘fat’ and ‘carbohydrate’ which were given as energy% referenced to the total dietary energy.
When DRVs were defined per age groups, the age categorization did not always match between the nutrients.
This was especially the case for the younger age categories (up to 18 years of age), where many adjustments
would be needed to align the DRVs per age categorization. This is one of the reasons why the younger age
categories are not included as part of the default software package for the EU.
3.2 Different nutritional profiles The Optimeal EU database comes with a set of nutritional profiles specified for gender, age and activity level.
There are different profiles for males and females. The age categories included are: 19 to 30 years of age, 31 to
50 years of age & 51 to 70 years of age.
We can provide profiles for younger than 18 and over 70 years of age, but these are not part of the default
package. This is because the data from EFSA had to be adjusted quite extensively for the younger age categories,
as the age categories were not equal between different nutrient requirements. Also, the EU Optimeal dataset
comes with one default average EU diet and diets for the young and elderly can deviate largely from this average
EU diet. Therefore, the provided average EU diet is less compatible with these age categories.
The nutritional profiles are specified per physical activity level (PAL). In EFSA (2017) PAL is defined as the ratio of
total energy expenditure (TEE) to resting energy expenditure (REE) per 24 hours and reflects the part of TEE that
is due to physical activity. Accordingly, TEE is predicted as PAL x REE. Nutritional profiles have been defined for
two physical activity levels: 1.4, 1.6.
2 the level of (nutrient) intake that is adequate for virtually all people in a population group. 3 the level of (nutrient) intake that is adequate for half of the people in a population group, given a normal distribution of requirement. 4 the value estimated when a Population Reference Intake cannot be established because an average requirement cannot be determined. An Adequate Intake is the average observed daily level of intake by a population group (or groups) of apparently healthy people that is assumed to be adequate. 5 the intake range for macronutrients, expressed as % of the energy intake. These apply to ranges of intakes that are adequate for maintaining health and associated with a low risk of selected chronic diseases.

11
4 Nutritional properties The nutritional properties of the products in the EU database are based on the EFSA Food Composition Data
(EFSA, 2018b). This database contains over 2500 products with multiple preparation methods (e.g. cooking in
water, baking, cooking in oil, steaming) reported by 10 European countries6. For each nutrient, an average was
calculated based on the reporting countries. The nutrients included in the EU database are:
Energy
Protein total
Protein
vegetable
Protein animal
Fat total
SAFA
MUFA
PUFA
Linoleic acid
ALA
EPA
DHA
Trans fatty acids
Fatty acids n-3
Fatty acids n-6
Cholesterol
Carbohydrates
total
Polysaccharides
Mono- and
disaccharides
Lactose
Fibre
Water
Alcohol
DHA+EPA
Retinol eq.
Vitamin B1
Vitamin B2
Niacin
Vitamin B5
Vitamin B6
Folate eq.
Vitamin B8
Vitamin B12
Vitamin C
Vitamin D
Vitamin E
Vitamin K total
Calcium
Phosphorus
Iron total
Haem iron
Sodium
Fluoride
Manganese
Iodine
Potassium
Magnesium
Zinc
Selenium
Copper
Tryptophan
Threonine
Isoleucine
Leucine
Lysine
Methionine
Cystine
Valine
Histidine
Grams
Dry matter
Missing nutrient data were completed with data from the NEVO (Dutch Food composition database), the USDA
Food Composition Databases, or a similar product or preparation method from the EFSA database was used as a
proxy.
Proteins are reported in the EFSA database as total protein, plant protein and animal protein. Some
inconsistencies were found between the three. In some cases, only the total protein was reported, but not
specified to plant or animal protein. When the considered product is made of either plant or animal material, the
total protein was allocated to the plant or animal protein, respectively. When the considered product consists of
both plant and animal products (e.g. meat and vegetable soup), the ratio was taken from NEVO and applied to
the EFSA total protein to make the distinction between plant and animal protein. In other cases, the sum of the
plant protein and animal protein did not match the total protein reported. This inconsistency was solved by
taking the ratio plant: animal protein and applying it to the total protein to get to a new value for plant protein
and animal protein, respectively.
A correction for outliers was applied to the EFSA data. For example, in some cases data implied that more than
100 grams of a nutrient was present per 100 grams of product. In other cases, a country reported a quantity that
was far out of the range reported by other countries. For example, one country reported 10 grams of nutrient,
while other countries reported within a range of 10-15 milligrams. In these situations, it was assumed the country
misreported the unit of measurement.
There are a few products in the Optimeal database that represent food groups, for example condiments,
vegetable oil, or tree nuts. These are a mix of two or more products and their nutritional properties are therefore
compiled as such. Condiments, for example, is compiled of 1/3 mustard, 1/3 ketchup and 1/3 mayonnaise.
6 Denmark, Finland, France, United Kingdom, Iceland, Netherlands, Portugal, Serbia, Sweden, Slovenia.

12
5 Environmental properties
5.1 Introduction The environmental properties of products are important in determining the environmental sustainability of a
diet. Environmental properties of all the products in the reference diet are determined using the Life Cycle
Assessment (LCA) methodology.
5.2 Life Cycle Assessment (LCA) framework The calculated environmental performance in the background analysis of Optimeal, is based on environmental
data analysis with the use of LCA methodology. This methodology captures the impact of a product (or service)
through-out its life cycle. Examples of environmental impacts are climate change, fossil depletion, water use, and
land use. The list of impact categories assessed for the EU Optimeal dataset are listed in Table 1.
Table 1 Impact categories assessed for the EU Optimeal dataset.
Impact category unit
Global warming - excl LUC kg CO2eq
Fine particulate matter formation kg PM2.5 eq
Terrestrial acidification kg SO2 eq
Freshwater eutrophication kg P eq
Marine eutrophication kg N eq
Land use m2a crop eq
Fossil resource scarcity kg oil eq
Water consumption m3
The system boundary in this dataset is defined as from Farm-to-Fork, including all activities taking place at the
farm (agriculture or husbandry), all the way through processing, retail and consumption. These activities are
more elaborately discussed in Chapter 5.3.
The life cycle assessments carried out for Optimeal are in line with the ISO 14040/44 standards (ISO, 2006a,
2006b)7. For the life cycle stages from processing to plate the Product Environmental Footprint (PEF) guidance
(European Commission, 2017) and PEF default data have been used.
Product Environmental Footprint Category Rules (PEFCRs) are available for various products in this dataset. These
PEFCRs have not always been the basis for the modelling. It is in our view more important that the environmental
profile of the products within the EU Optimeal dataset are generated in a consistent way to make meaningful
analyses possible. However, the PEFCRs are not consistent amongst one another. They opt for instance for
different allocation methods.
7 The ISO 14040 series (ISO, 2006a) describe the basic requirements for performing an LCA study. This includes, amongst others, directions on how to define the functional unit of a product, how to determine which processes need to be included or excluded, and how to deal with co-production situations where elementary flows need to be allocated to the different products.

13
5.3 Scope
5.3.1 Included products The average EU diet is modelled based on EFSA (2011). The products in scope are classified in the following
product groups8:
Table 2 Classification of the product groups which are used to categorize the food products
FoodEx codes Product group A.01.000001 Grains and grain-based products A.01.000317 Vegetables and vegetable products A.01.000467 Starchy roots and tubers A.01.000486 Legumes, nuts and oilseeds A.01.000544 Fruit and fruit products A.01.000727 Meat and meat products (incl. edible offal) A.01.000876 Fish and other seafood A.01.000948 Milk and dairy products A.01.001252 Eggs and egg products A.01.001267 Sugar and confectionary A.01.001346 Animal and vegetable fats and oils A.01.001394 Fruit and vegetable juices A.01.001470 Non-alcoholic beverages A.01.001534 Alcoholic beverages A.01.001573 Drinking water A.01.001580 Herbs, spices and condiments A.01.001715 Composite food A.01.001748 Snacks, desserts and other foods
5.3.2 Function, functional unit and reference flow The primary function of food products is to provide nutrition to consumers. Food products with different
nutritional profiles satisfy different nutritional needs. Of course, social determinants and personal satisfaction
also affect the food patterns, but there is no parameter reflecting these functions in the present analysis.
Optimeal uses the dietary context to compare products and diets based on equal functions. The functional unit
is defined on a mass basis and the environmental impact is displayed in the dataset per 100g of product.
5.3.3 Allocation method The ISO14044:2006 standard (ISO, 2006b), provides guidelines on the allocation procedure. The first guideline is
that allocation should be avoided whenever possible by dividing the unit multioutput process into two or more
sub-processes and collecting the inventory data related to these sub-processes separately. If this is not possible
allocation may be avoided by expanding the product system to include the additional functions related to the
co-products. If allocation cannot be avoided, the inputs and outputs of the system should be partitioned between
its different products or functions in a way that reflects the underlying physical relationships between them; i.e.
they should reflect the way in which the inputs and outputs are changed by quantitative changes in the products
or functions delivered by the system. If physical relationship alone cannot be established or used as the basis for
allocation, the inputs should be allocated between the products and functions in a way that reflects other
relationships between them. For example, input and output data might be allocated between co-products in
proportion to the economic value of the products or another property.
System expansion as such is not applied in Optimeal because no consistent approach exists and aspects of
consequential LCA are introduced. Also, allocation based on a (bio)-physical mechanism is generally not used, as
these mechanisms are generally not well quantified. An exception is the PEF Cattle model working group (JRC &
8 A full list of products available in Optimeal are listed in Chapter 8.

14
European Commission, 2015) compliant versions of the dairy production process, where the biophysical
allocation according to IDF methodology (IDF, 2010) is implemented.
It should also be realised that allocation based on physical keys of the outputs is not the same as allocation based
on (bio) physical mechanism but could be considered as a proxy for this approach. Likewise, economic allocation
may be regarded as a proxy for a market-based approach (substitution through system expansion). If allocation
keys are not directly related to a physical mechanism, they should be treated as allocation based on another
causality (ISO step 3).
In Optimeal, economic allocation is applied in all multifunctional processes, except for the dairy farm, where
biophysical allocation (IDF) is implemented, in accordance with the Product Environmental Footprint Category
Rules (PEFCR) for dairy products (Technical Secretariat Dairy PEF, 2018). However, Optimeal is not in line with
the PEFCR for dairy products, which opts for mass or dry matter allocation9 of raw milk and transport from farm
to processing plant. In the future it would be possible to develop an EU Optimeal dataset with other allocation
methods consistently applied, like mass allocation or energy allocation.
Allocation is applied without the use of cut-offs for so called residual product streams whenever possible. There
are a couple of exceptions to this allocation rule:
• Citrus pulp dried, from drying, at plant
• Brewers’ grains, wet, at plant
• Animal manure
• Nut shells
The reason for these exceptions is pragmatism. Most of these products are required for the LCI of a couple of
animal production systems and are taken from Agri-footprint (Durlinger, Koukouna, Broekema, van Paassen, &
Scholten, 2017b, 2017a). This may be adapted in a future update of Agri-footprint. Dried citrus pulp and wet
brewers’ grain do not include any inputs from previous life cycle stages. Dried citrus pulp only includes the energy
required for drying. Animal manure is a residual product of the animal production systems and does not receive
part of the emissions of the animal production system when animal manure is applied.
5.4 Data generation and quality procedure
5.4.1 Workflow in dataset development Data are generated via a workflow with pre-defined steps.
Step 1. Defining the origin of agricultural products
The market mixes of production countries of agricultural raw materials are determined with the ‘crop mix tool’,
which uses FAO trade statistics (2009-2013) to map the origin of raw materials. Sometimes the FAO trade
statistics are not available, consistent or complete. In this case Eurostat, product specific literature on trade
statistics or production mixes are used to determine a reliable market mix.10 These exceptions are reported in
chapter 5.5.2.
Step 2. Data collection for agriculture and processing
Once the origin of agricultural production countries is known, the data collection starts. The methodology for
modelling cultivation systems is the same as the Agri-footprint methodology (Durlinger et al., 2017a). Animal
9 Mass allocation is using the dry weight (i.e. dry matter content) of the product under study and its co-products (e.g. skimmed milk powder and cream). 10 FAO statistics be disturbed for instance by second degree trades, for instance when a country possesses a port which is of importance for receiving trade for a large region (eg. avocadoes are shipped to Belgium and from there distributed throughout the EU, which makes it seem like Belgium is a relevant avocado producer for the Netherlands). In this case the crop mix tool is used to determine the product origin and determine the final market mix.

15
cultivation systems are modelled based on literature review and IPCC guidelines. The processing of the crops/
raw materials into final products is modelled based on general processing data as well as product specific data.
Step 3. The data for the final life cycle stages are added
The life cycles stages from processing till consumption are modelled based on fixed parameters and default
methods via an automated procedure, called “processing-to-mouth” model, which concerns the following
lifecycle stages:
a) Processing (default for vegetables and fruits)
b) Packaging
c) Distribution
d) Supermarket
e) Consumption
f) Final (food losses)
Where possible and meaningful the default parameters set by the PEF Guidance document 6.3 (European
Commision, 2017) are used. These concern energy use and losses at retail, as well as energy use and food losses
during cooking and consumption. Other data concerning food preparation (i.e. cooking procedure) and the
amount of packaging material, as well as assumed packaging disposal scenarios. Raw-to-cook ratios are mostly
based on publicly available data. All parameters and default data are further elaborated in chapter 5.5.
5.4.2 Data quality assessment and review The environmental impact results are reviewed internally at the cultivation stage (qualitative review), at the
processing stage (quantitative review) and at the end of life stage (i.e. after consumption) (quantitative review).
No data quality rating (DQR) matrix was developed yet. Furthermore, the EU Optimeal dataset is not reviewed
by an external party.
5.5 Methodology and data used The life cycle inventory is modelled in the LCA software SimaPro. The impact results are calculated by applying
the lifecycle impact assessment method ReCiPe Midpoint (H) 2016. This chapter describes the methodology and
methods for collecting and analysing the data.
5.5.1 Agriculture and animal husbandry Crop cultivation (Figure 3) is modelled on country level, with the Agri-footprint methodology (Durlinger et al.,
2017a) (with country/ region specific crop yields, fertilizer composition, fertilizer application rates and energy
use) which is also compliant to the EC PEF methodology (European Commision, 2017). Carbon storage in crops
and animal products is not included because this carbon is part of the short-term carbon cycle. The carbon
dioxide emissions at the end of the life cycle (e.g. emitted during fermentation or digestion) are also not modelled
except when the stored carbon is released as methane due to enteric fermentation or manure management and
storage, which is inventoried as ‘methane, biogenic’.
Data collection and analysis for cultivation are elaborately discussed in Chapter 3 of Agri-footprint data report
(Durlinger et al., 2017b). This section covers issues with regards to land use change, water use for irrigation,
artificial fertilizer application rates, manure application and emissions from managed soils. Pesticides production
and use is included when Agri-footprint processes are used but are out of scope for processes which have been
created specifically in the context of the development of the EU Optimeal dataset.

16
Figure 3 System boundary for crop cultivation (taken from Agri-footprint 4.0 methodology report)
5.5.2 Market mix and transport of raw ingredients to processing plant The market mixes of raw materials are determined based on Blonk Consultants’ crop mix tool. For some crops
trade statistics were not available, in this case the global production mix or global export mix statistics were used
instead (Table 3). The assumption is made that these mixes are a good estimate of the European market share.
Table 3 Crops for which global production or export statistics were used to model the market mix
Crop (FAO name) Type of statistics Year
Almonds, with shell Global production 2009 - 2013
Hazelnuts, with shell Global production 2009 - 2013
Peppermint Global production 2009 - 2013
Groundnuts, with shell Global production 2009 - 2013
Rice, paddy Global export 2013 - 2017
Sugar cane Global production 2009 - 2013
5.5.3 Processing Processing based on Agri-footprint data are: Cereal dry milling, rice parboiling, sugar production, oilseed crushing
and refining and animal slaughtering.
Processing data for vegetables and fruits have been collected. These data include energy and water consumption
for processing vegetables and fruits for fresh consumption or for processed foods. Energy consumption is
modelled according to Sanjuán, Stoessel and Hellweg (2014). Six types of vegetables’ and fruits’ processing are
applied; fresh, canned, in jar, peeled, scraped and frozen. Water consumption is modelled according to Lehto et
al. (2014), from which an average water consumption is used for all vegetables and fruits at processing.
For products other than vegetables and fruits, processing is modelled manually in the LCA software based on the
sources as shown in Table 4 and Table 5.
Table 4 Main sources used for processing (from raw material to product/co-product) products other than vegetables and fruits
Relevant processes Source
Oat and Wheat flaking Energy use based on McDevitt & i Canals (2009). Flaking yield based on Welch (1995).
Crop cultivation
Fertilizer (N-P-K), lime
Irrigation water
Manure
Diesel, electricity
Pesticides
Production fertilizers
Production energy carriers
Production manure
Production pesticides
Capital goods
Yield
Co-product
System boundary crop cultivation
Cultivation seeds Seeds
Production capital goods

17
Tree nuts Tree nuts drying and deshelling energy use based on various sources: (almond: (Kendall, Marvinney, Brodt, & Zhu, 2015), cashew nuts: (Jekayinfa & Bamgboye, 2006) , hazelnuts: (China Win Tone Machinery, 2014)&(Anil, Kurt, Akar, & Köse, 2018), walnuts: (Thompson & Elkins, 2009)). Kernel/shell ratio based on FAOstat. A cut-off approach was applied for shell: neither impact, nor benefit was allocated to the shell (with exception of cashew shell and cashew shell liquid co-products).
Black tea and herbal tea Drying and moisture loss based on Taulo & Sebitosi (2016) and Tarhan, Telci, Tuncay, & Polatci (2011).
Black pepper drying (Joy, Peter Pittappillil, & Jose, 2002)
Fish cleaning and degutting (Broekema, Kuling, & Scholten, 2015b)
Meat processing Intensive and extensive processing11 based on (Broekema, Kuling, & Scholten, 2015a).
Milk pasteurization (Sheane et al., 2011)
Honey (Arena, Barón, Piastrellini, Curadelli, & Civit, 2014).
Table 5 Main sources used for processing (assembling) products other than vegetables and fruits
Relevant processes Source
Baking of bread and rolls, pastries and cakes, biscuits, pizza, pretzels
Energy use from Therkelsen, Masanet, & Worrell (2014), recipes from “Het Nieuwe Kookboek”.
Pasta production (Technical Secretariat of the PEF dry pasta Pilot 2004)
French fries and potato crisps (Ponsioen & Blonk, 2011) & (Broekema, Kuling, & Koukouna, 2016)
Jam, fruit compote, liquorice candies, ready to eat-meals.
Energy use default (heated mixing) based on Andersson, Ohlsson, & Olsson (1998).
Peanut butter (Center for Agricultural and Rural Sustainability, 2012)
Margarine (Broekema et al., 2016)
Sauces, mustard, dressing and mayonnaise
Energy use default (ingredient mixing) based on average between peanut butter and margarine
Tomato puree/paste (Manfredi & Vignali, 2014).
Soups (Milà I Canals et al. 2011)
Chocolate (Recanati et al., 2018) & (Konstantas, Jeswani, Stamford, & Azapagic, 2018)
Olive oil (Technical Secretariat of the olive oil PEF pilot, 2016)
Concentrated fruit juice (used for juice production)
(Pluimers, Blonk, Broekema, Ponsioen, & van Zeist, 2011) & (Lekkergezond, 2016)
Soft drinks Recipe based on Ercin, Aldaya, & Hoekstra (2011), energy use based on Pluimers et al. (2011).
Coffee beans and instant coffee (Humbert, Loerincik, Rossi, Margni, & Jolliet, 2009)
Alcoholic drinks (and related) Beer: (Broekema & Scholten, 2015), wine: (Thecnical Secretariat of the PEF pilot on wine, 2015), cider: (Iannone, Miranda, Riemma, & De Marco, 2016), spirits: (Broekema et al., 2016), vinegar: (Bartocci, Fantozzi, & Fantozzi 2017)
Vegetable burger (Broekema & Blonk, 2009)
Fish cakes and fish fingers (Broekema et al., 2015b)
11 A differentiation was made between intensive processed products and extensive processed products. Extensive processed products are chopped into consumer parts and packed at the processor but are not mixed with other ingredients/ seasoned and prepared at the processor. Extensive processed products are: steak, chicken fillet, hamburger, lamb, minced beef and pork. An example of intensive product is sausage, chorizo etc.

18
Cheeses Mass and energy based on Broekema et al. (2015a).
Other dairy production Yoghurt, ice-cream, pudding and custard production based on (Sheane et al. (2011), evaporated milk energy use based on Fox, Akkerman, Straatsma, & Jong de (2010), butter and buttermilk production based on Technical Secretariat Dairy PEF (2018).
5.5.4 Packaging The type and weight of packaging material is estimated based on own estimates. The production of packaging is
based on background datasets, shown in Table 6. All background datasets are from the Ecoinvent 3 database,
except from aluminium, which is taken from the ELCD database. The amount of packaging is based on
measurements of representative products12,. The transport distances and modalities for specific packaging types
modelled are based on PEF default data from the PEF Guidance document 6.3 (European Commision, 2017).
Default transport distance of packaging materials is determined from manufacturing plants to filler plants. For
all materials, except glass, the following transportation distances are used: 230 km by truck, 280 km by train, 360
km by ship. For glass, this transportation requirements are based on empty bottles and are: 350 km by truck, 39
km by train and 87 km by ship. The background datasets used to model the modalities (i.e. inland and sea
transport) are shown in Thermoforming (Ecoinvent 3: Thermoforming, with calendering {RER}| production |
APOS, S) is used for making packaging from plastic granulates.
Table 7Table 7.
Table 6 Overview of background dataset used for various packaging material
Packaging material Background dataset Cardboard Corrugated board box {RER}| production | APOS, S PP Polypropylene, granulate {RER}| production | APOS, S Paper: 50% Paper: 50%
Kraft paper, bleached {RER}| production | APOS, S Kraft paper, unbleached {RER}| production | APOS, S
Chromium steel Steel, chromium steel 18/8, hot rolled {RER}| production | APOS, S Modified starch Maize starch {RER}| citric acid production | APOS, S EPS Polystyrene, expandable {RER}| production | APOS, S Glass Packaging glass, white {RER w/o CH+DE}| production | APOS, S PET Polyethylene terephthalate, granulate, bottle grade {RER}|
production | APOS, S
LDPE Polyethylene, low density, granulate {RER}| production | APOS, S HDPE Polyethylene, high density, granulate {RER}| production | APOS, S LPB Liquid packaging board container {RER}| production | APOS, S Aluminium Aluminium sheet, primary prod., prod. mix, aluminium semi-
finished sheet product RER S System - Copied from ELCD
Thermoforming (Ecoinvent 3: Thermoforming, with calendering {RER}| production | APOS, S) is used for making
packaging from plastic granulates.
Table 7 Background datasets used to model transportation modalities of packaging materials
Transport mode Background dataset
Truck Transport, truck >20t, EURO5, 80%LF, default/GLO Economic
Train Transport, freight train, electricity, bulk, 80%LF, hilly terrain, default/GLO Economic
Ship Transport, barge ship, bulk, 5500t, 80%LF, default/GLO Economic
12 A representative product is a product of same or similar properties and specifications to the product in scope.

19
5.5.5 Distribution Supermarket and distribution phases are modelled predominantly based on PEF default data from the PEF
guidance document (European Commision, 2017). Default data are defined for cooling, freezing, lighting and
heating during distribution (Table 8). These parameters depend on the defined storage time (i.e. short, average
and long) as well as the products density (Charrondiere, Haytowit, & Stadlmayr, 2012) (i.e. the volume that the
product occupies per kg product) (Table 9). The use of storage time and density as parameters to estimate the
energy use is explained in the text box. A minimum product density of 0.3 kg/l is used. Lower product densities
lead to unrealistic large energy use for these products. The product losses at retail (i.e. distribution and
supermarket) are modelled based on PEF default data from the PEF Guidance document 6.3 (European
Commision, 2017), as shown in Table 17.
Table 8 Overview of defaults used for distribution phase
Parameter PEF default (2015) Distance to distribution 150 km Losses at distribution 0% Cooling at distribution 2.31 kWh/ton Freezing at distribution 6.15 kWh/ton Lighting at distribution See Table 9 Heating at distribution See Table 9 R-404a emissions See Table 9
Table 9 Calculated energy demand, water use and R404a emissions per cubic meter of product for distribution phase
Type of delivery
Storage volume (volume/product)
Storage time (weeks)
Storage demand (m3-week)
Lighting (kWh/m3)
Heating (MJ/m3)
Cooling (kWh/m3)
R404a (kg/m3)
Water use (L/m3)
Ambient short term
4 1 4 1.15 13.85 NA NA 0.468
Ambient average
4 4 16 4.61 55.38 NA NA 1.872
Ambient long term
4 7 28 8.08 96.92 NA NA 3.276
Chilled 3 1 3 0.87 10.38 2.31 0.000837 0.351 Frozen 2 4 8 2.31 27.69 6.15 0.002231 0.936
How product’s life time and density relate to the energy consumption at the distribution:
The energy requirement of products at distribution are determined in unit energy per m3, in the PEF
Guidance Document. So, each product needs to be allocated some occupied space and time. An average
distribution centre can store 60000 m3 of product. The storage period on a year basis is 52 weeks, i.e.,
3120000 m3-weeks/year. The total capacity is then allocated with the following storage volumes and times:
1. For ambient products: 4 times the product volume * 4 stored weeks
- For ambient products Blonk Consultants developed 3 different options:
• Ambient short term: 4 times the product volume * 1 stored weeks
• Ambient average: 4 times the product volume * 4 stored weeks
• Ambient long term: 4 times the product volume * 7 stored weeks
2. For chilled products: 3 times the product volume * stored 1 week
3. For frozen products: 2 times the product volume * stored 4 weeks

20
5.5.6 Supermarket Supermarket and distribution phases are modelled predominantly based on PEF default data from the PEF
guidance document (European Commision, 2017). Default data used at the supermarket are listed in Table 10.
Table 10 Overview of defaults used for retail phase
Item PEF default Distance to supermarket 50 km
Losses at supermarket See Table 17
Cooling at supermarket 219.23 kWh/ton
Freezing at supermarket 415.38 kWh/ton
Lighting at supermarket See Table 11
Heating at supermarket Not considered
R404 emissions See Table 11
Table 11 Calculated energy demand and R404a emissions per ton of product for retail phase
Type of delivery
Storage volume (volume/product)
Storage time (weeks)
Storage demand (m3-week)
Energy (kWh/m3)
Cooling (kWh/m3)
R404a (kg/m3)
Water use (L/m3)
Ambient short term
4 1 4 30.77 NA NA 140.4
Ambient average
4 4 16 123.08 NA NA 561.5
Ambient long term
4 7 28 269.23 NA NA 1228.4
Chilled 3 2 6 46.15 219.23 0.001673 210.6 Frozen 2 4 8 61.54 415.38 0.002231 280.8
5.5.7 Consumption Food preparation methods and product characteristics with regards to inedible parts and raw-to-cooked ratios
are determined for the consumption stage. At this point, the pre-defined packaging material is also disposed.
The disposal scenario depends on the type of packaging. The packaging disposal scenarios and background
datasets (Ecoinvent 3.4) are shown in Table 12. Food preparation at consumer is modelled according to default
data and relate to the defined preparation/ cooking scenarios per product. The type of preparation is based on
most common practices per food type.
Table 12 Packaging disposal scenarios and background datasets per packaging material
Packaging material
Disposal scenario Background dataset
Paper Waste incineration with energy recovery Waste paperboard {Europe without Switzerland}| treatment of waste paperboard, municipal incineration | APOS, S
Plastics Waste incineration with energy recovery Waste plastic, mixture {Europe without Switzerland}| treatment of waste plastic, mixture, municipal incineration | APOS, S
Steel Waste incineration with energy recovery Scrap steel (waste treatment) {CH}| treatment of scrap steel, municipal incineration | APOS, S
Aluminium Waste incineration with energy recovery Scrap aluminium (waste treatment) {CH}| treatment of scrap aluminium, municipal incineration | APOS, S

21
Glass Waste incineration with energy recovery Waste glass {Europe without Switzerland}| treatment of waste glass, municipal incineration | APOS, S
5.5.7.1 Energy for cooking Energy for cooking is determined by several factors, such as the:
• Type of preparation technique, i.e. 9 preparation techniques are considered (Table 13)
• Mass of food (and water) input for preparation (Table 16)
• Electricity and natural gas share to the energy consumed (Table 13,
• Table 14 and Table 15)
Some types of food preparation, such as the deep frying or microwave are considered to use 100% electricity.
The rest are using a ratio of 25% and 75%, for electricity and natural gas respectively.
Table 13 Overview of preparation techniques and amount of input per kg of input.
Preparation technique Electricity (kWh/kg)
Natural gas (MJ/kg) Oil Water
Deep frying 0.667 (default value) n/a Yes -
Pan frying (See Table 14 for cooking times)
(25%) (75%)
Yes -
Boiling (See Table 15 for cooking times)
(25%) (75%)
- Yes
Water cooker 0.127 (default value) n/a - Yes
Oven Not considered
Microwave 1100 W * time unit n/a - -
Chilled at consumer 0.0777 0.0111 (for bottled water) 0 (for tap water)
n/a - -
Freezing at consumer 0.294 n/a - -
No preparation - - - -
Table 14 Baking time on low and high heat for “Pan frying” preparation option.
Product category Baking time low (600 W) Baking time high (3500 W)
Meat 4 min 7 min
Fish 8 min 0 min
Vegetables 3 min 7 min
Potatoes 3 min 17 min
Table 15 Boiling time and added water per kg of product for “Boiling” preparation option.
Product category Boling time Added water (L/kg)
Meat 120 min 0.2
Fish 10 min 0.05
Eggs 5 min 5
Vegetables 11 min 0.7
Potatoes 20 min 0.8
Rice 15 min 1.5
Pasta 10 min 5

22
Table 16 Inputs and added water for beverages prepared at consumers.
Beverage Input (kg/kg) Water added Comment
Coffee 0.05833 1.10 Based on PEF data (7g/120 ml)
Coffee drink, espresso 0.1325 1.10 Based on PEF data (5.3g/40 ml)
Coffee drink, café americano
0.05833 1.10 Based on PEF data (7g/120 ml)
Instant coffee, liquid 0.05833 1.10 Based on PEF data (7g/120 ml)
Tea 0.01 1
Black tea, infusion 0.01 1
Fruit tea, infusion 0.01 1
Lemonade 0.12 0.88
Lemonade (light) 0.08 0.92
5.5.8 Final (food losses) Avoidable food losses are determined per product group, in the last life cycle stage marked as “final”. These
losses refer to the edible food not consumed and therefore wasted (i.e. food waste at consumption phase). Food
losses at consumption are determined based on PEF default data from the PEF Guidance document 6.3 (European
Commision, 2017), as shown in Table 17.
Table 17 Loss rate for various product categories at distribution and consumer phase (European Commision, 2017).
Product category Loss rate retail Loss rate consumer
Fruits and vegetables 10% 19%
Meat and meat alternatives 4% 11%
Dairy products 0.5% 7%
Grain products 2% 25%
Oils and fats 1% 4%
Prepared/processed meals (ambient) 10% 10%
Prepared/processed meals (chilled) 5% 5%
Prepared/processed meals (frozen) 0.6% 0.5%
Confectionery 5% 2%
Other foods 1% 2%

23
6 Limitations of the EU Optimeal dataset 1. Limitations of the LCA method applied:
The applied LCA method is meant to generate a database of average EU products which is internally
consistent and good enough for optimization studies in Optimeal. A limitation is that variability and
uncertainty is not captured yet. In Optimeal, however the impact of variability can be well studied with
Monte Carlo analysis. With this method the implications of variability on EU level can be explored.
The emissions due to use of pesticides are not considered. Therefore, the toxicity indicators are not
included in the dataset.
The LCA data are not useful for analysis specific for a country within the EU and do not take seasonality
into account.
The EU Optimeal LCA data are not compliant to the PEF guidance and the PEFCRs per product category.
Since the PEFCRs are not consistent in terms of allocation between them, using the PEFCRs as a starting
point would lead to an internal inconsistent database. For the purpose of the analyses performed using
the EU Optimeal dataset consistency is very relevant and valued more than compliance to the PEF
guidance and PEFCRs.
Data quality has not been monitored for the EU Optimeal dataset. This means that the environmental
impact indicators do not come with a data quality rating. We are working on implementing data quality
rating in the database development and wish to include this rating in a future release.
2. The scope of the EU Optimeal dataset is the European Union. This is a large region with high dietary
variation and therefore not representative of individual countries.
3. The EU Optimeal dataset comes with several nutritional profiles specified per gender, age and activity
level, but only one EU average diet. This EU average diet should be adapted to the target group of the
study and its nutritional profile.
4. Products in the dataset have been based on EFSA Comprehensive European Food Consumption
Database. This is a compilation of Food Consumption Surveys of many European countries. The database
has been used as a starting point to come to a more aggregated set of food products using the FoodEx
classification system. The EU Optimeal dataset fits for use in the Optimeal context but should not be the
starting point for dietary advice on a more individual level.
24
7 References Andersson, K., Ohlsson, T., & Olsson, P. (1998). Screening life cycle assessment (LCA) of tomato ketchup: a case
study. Journal of Cleaner Production, 6(3–4), 277–288. https://doi.org/10.1016/S0959-6526(98)00027-4
Anil, S., Kurt, H., Akar, A., & Köse, Ç. B. (2018). Hazelnut culture in Turkey. Instanbul, Turkey. https://doi.org/10.2460/ajvr.72.5.634
Arena, A. P., Barón, G. N., Piastrellini, R., Curadelli, S., & Civit, B. M. (2014). Environmental profile of the life cycle of honey production from small scale in Mendoza, Argentina. Retrieved from http://lcafood2014.org/abstracts/202.pdf
Bartocci, P., Fantozzi, P., & Fantozzi, F. (2017). Environmental impact of Sagrantino and Grechetto grapes cultivation for wine and vinegar production in central Italy. Journal of Cleaner Production, 140, 569–580. https://doi.org/10.1016/j.jclepro.2016.04.090
Broekema, R., & Blonk, H. (2009). Milieukundige vergelijking van vleesvervangers. Gouda, the Netherlands: Blonk Milieu Advies, Gouda.
Broekema, R., Kuling, L., & Koukouna, E. (2016). Life Cycle Inventories of nuts , potatoes and beverages consumed in the Netherlands Also includes some types of vegetables , breads and fish, 8–9.
Broekema, R., Kuling, L., & Scholten, J. (2015a). Life Cycle Inventories of dairy- and animal products consumed in the Netherlands. Gouda, the Netherlands: Blonk Consultants.
Broekema, R., Kuling, L., & Scholten, J. (2015b). Life Cycle Inventories of fish products consumed in the Netherlands.
Broekema, R., & Scholten, J. (2015). Product Environmental Footprint (PEF) screening report of beer.
Center for Agricultural and Rural Sustainability. (2012). National Scan-level Life Cycle Assessment for Production of US Peanut Butter. University of Arkansas; American Peanut Counsil.
Charrondiere, U. R., Haytowit, D., & Stadlmayr, B. (2012). Food Density Database Version 2.0. Fao/Infoods, 2, 24. Retrieved from http://www.fao.org/docrep/017/ap815e/ap815e.pdf
China Win Tone Machinery. (2014). Hazelnuts Dehulling and Separating Machine. Retrieved from http://www.grain-processing.org/PRODUCTS/Seed-Dehulling-and-Separating-Machine/646.html
Durlinger, B., Koukouna, E., Broekema, R., van Paassen, M., & Scholten, J. (2017a). Agri-footprint 4.0 - Part 1: Methodology and basic principles.
Durlinger, B., Koukouna, E., Broekema, R., van Paassen, M., & Scholten, J. (2017b). Agri-footprint 4.0 - Part 2: Description of data. Gouda, the Netherlands.
EFSA. (2006). Tolerable Upper Intake Levels for Vitamins and Minerals. Brussels.
EFSA. (2011). Use of the EFSA comprehensive european food consumption database in exposure assessment. European Food Safety Authority Journal, 9(3), 2097. https://doi.org/10.2903/j.efsa.2011.2097.
EFSA. (2017). Dietary Reference Values for nutrients - summary report. https://doi.org/10.2903/sp.efsa.2017.e15121
EFSA. (2018a). EFSA Comprehensive Food Consumption Database. Retrieved from http://www.efsa.europa.eu/en/food-consumption/comprehensive-database
EFSA. (2018b). EFSA Food Composition Database. Retrieved from https://www.efsa.europa.eu/en/microstrategy/food-composition-data
Ercin, A. E., Aldaya, M. M., & Hoekstra, A. Y. (2011). Corporate Water Footprint Accounting and Impact Assessment: The Case of the Water Footprint of a Sugar-Containing Carbonated Beverage. Water Resources Management, 25(2), 721–741. https://doi.org/10.1007/s11269-010-9723-8

25
European Commision. (2017). Product Environmental Footprint Category rules Guidance - Version 6.3. Brussels, Belgium.
European Commission. (2017). Product Environmental Footprint Category Rules Guidance - version 6.1.
Fox, M., Akkerman, C., Straatsma, H., & Jong de, P. (2010). Energy reduction by high dry matter concentration and drying. New Food Magazine, (2), 60–63. Retrieved from https://www.newfoodmagazine.com/article/474/energy-reduction-by-high-dry-matter-concentration-and-drying/
Humbert, S., Loerincik, Y., Rossi, V., Margni, M., & Jolliet, O. (2009). Life cycle assessment of spray dried soluble coffee and comparison with alternatives (drip filter and capsule espresso). Journal of Cleaner Production, 17(15), 1351–1358. https://doi.org/10.1016/j.jclepro.2009.04.011
Iannone, R., Miranda, S., Riemma, S., & De Marco, I. (2016). Improving environmental performances in wine production by a life cycle assessment analysis. Journal of Cleaner Production, 111, 172–180. https://doi.org/10.1016/j.jclepro.2015.04.006
IDF. (2010). The IDF guide to standard LCA methodology for the dairy sector. Bulletin of the International Dairy Federation, 445, 1–40.
ISO. (2006a). ISO 14040 Environmental management — Life cycle assessment — Principles and framework.
ISO. (2006b). ISO 14044 - Environmental management — Life cycle assessment — Requirements and guidelines. ISO.
Jekayinfa, S. O., & Bamgboye, A. I. (2006). Estimating energy requirement in cashew ( Anacardium occidentale L .) nut processing operations, 31, 1305–1320. https://doi.org/10.1016/j.energy.2005.07.001
Joy, C. M., Peter Pittappillil, G., & Jose, K. (2002). Drying of Black Pepper (Piper nigrum L.) Using Solar Tunnel Dryer. PertanikaJ. Trap. Agric. Sci, 25(1), 39–45.
JRC, & European Commission. (2015). Baseline Approaches for the Cross-Cutting Issues of the Cattle Related Product Environmental Footprint Pilots in the Context of the Pilot Phase.
Kendall, A., Marvinney, E., Brodt, S., & Zhu, W. (2015). Life Cycle-based Assessment of Energy Use and Greenhouse Gas Emissions in Almond Production, Part I: Analytical Framework and Baseline Results. Journal of Industrial Ecology, 00(0), n/a-n/a. https://doi.org/10.1111/jiec.12332
Konstantas, A., Jeswani, H. K., Stamford, L., & Azapagic, A. (2018). Environmental impacts of chocolate production and consumption in the UK. Food Research International, 106(October 2017), 1012–1025. https://doi.org/10.1016/j.foodres.2018.02.042
Lehto, M., Sipilä, I., Alakukku, L., & Kymäläinen, H. (2014). Water consumption and wastewaters in fresh-cut vegetable production, (March), 246–256.
Lekkergezond. (2016). Appelsap, gezond alternatief voor appel? Nee! Retrieved from https://lekkergezond.nl/2014/07/25/appelsap-gezond-alternatief-voor-appel-nee/
Manfredi, M., & Vignali, G. (2014). Life cycle assessment of a packaged tomato puree: A comparison of environmental impacts produced by different life cycle phases. Journal of Cleaner Production, 73, 275–284. https://doi.org/10.1016/j.jclepro.2013.10.010
McDevitt, J. E., & i Canals, L. M. (2009). Life Cycle Assessment for the Ecodesign of Uk Porridge Oat Plant Varieties., 1–8. Retrieved from http://conference.alcas.asn.au/2009/McDevitt and Canals.pdf
Milà I Canals, L., Sim, S., García-Suárez, T., Neuer, G., Herstein, K., Kerr, C., … King, H. (2011). Estimating the greenhouse gas footprint of Knorr. International Journal of Life Cycle Assessment, 16(1), 50–58. https://doi.org/10.1007/s11367-010-0239-5
Pluimers, J., Blonk, H., Broekema, R., Ponsioen, T., & van Zeist, W. J. (2011). Milieuanalyse van dranken in Nederland.

26
Ponsioen, T., & Blonk, H. (2011). Case studies for more insight into the methodology and composition of carbon footprints of table potatoes and chips. Gouda, the Netherlands.
Recanati, F., Marveggio, D., & Dotelli, G. (2018). From beans to bar: A life cycle assessment towards sustainable chocolate supply chain. Science of the Total Environment, 613–614, 1013–1023. https://doi.org/10.1016/j.scitotenv.2017.09.187
Sanjuán, N., Stoessel, F., & Hellweg, S. (2014). Closing Data Gaps for LCA of Food Products: Estimating the Energy Demand of Food Processing. Environmental Science & Technology, 48(2), 1132–40. https://doi.org/10.1021/es4033716
Searchinger, T., & et al. (2013). Creating a Sustainable Food Future - World Resources Report 2013–14: Interim Findings. Washington, USA.
Sheane, R., Lewis, K., Hall, P., Holmes-Ling, P., Kerr, A., Stewart, K., & Webb, D. (2011). Identifying opportunities to reduce the carbon footprint associated with the Scottish dairy supply chain. Edinburgh.
Tarhan, S., Telci, I., Tuncay, M. T., & Polatci, H. (2011). Peppermint drying performance of contact dryer in terms of product quality, energy consumption, and drying duration. Drying Technology, 29(6), 642–651. https://doi.org/10.1080/07373937.2010.520421
Taulo, J. L., & Sebitosi, A. B. (2016). Material and energy flow analysis of the Malawian tea industry. Renewable and Sustainable Energy Reviews, 56(February 2018), 1337–1350. https://doi.org/10.1016/j.rser.2015.11.072
Technical Secretariat Dairy PEF. (2018). Product Environmental Footprint Category Rules for Dairy Products, 168. Retrieved from http://ec.europa.eu/environment/eussd/smgp/pdf/PEFCR-DairyProducts_2018-04-25_V1.pdf
Technical Secretariat of the olive oil PEF pilot. (2016). PRODUCT ENVIRONMENTAL FOOTPRINT CATEGORY RULES FOR OLIVE OIL - 3RD DRAFT.
Technical Secretariat of the PEF dry pasta Pilot. (2004). PRODUCT ENVIRONMENTAL FOOTPRINT SCREENING REPORT: Dry Pasta, 21(3), 111–147.
Thecnical Secretariat of the PEF pilot on wine. (2015). PEFCR Pilot on Wine. PEF screening report (Final draft).
Therkelsen, P., Masanet, E., & Worrell, E. (2014). Energy efficiency opportunities in the U.S. commercial baking industry. Journal of Food Engineering, 130, 14–22. https://doi.org/10.1016/j.jfoodeng.2014.01.004
Thompson, J., & Elkins, R. (2009). Sample costs to hull and dry walnuts.
United Nations Department of Economic and Social Affairs Population Division. (2017). World Population Prospects The 2017 Revision Key Findings and Advance Tables. World Population Prospects The 2017, 1–46. https://doi.org/10.1017/CBO9781107415324.004
Welch, R. W. (1995). The Oat Crop - Production and utilization. (R. W. Welch, Ed.) (First Eiti). Chapman & Hall.
Willett, W., Rockström, J., Loken, B., Springmann, M., Lang, T., Vermeulen, S., … Murray, C. (2019). Food in the Anthropocene: the EAT–Lancet Commission on healthy diets from sustainable food systems - Supplementary Appendix. Lancet, 6736(18), 3–49. https://doi.org/10.1124/pr.58.3.10

27
8 Annex 1 List of food products The Optimeal EU dataset contains 173 products. The products included in this dataset are:
Almond, sweet
Apple
Bacon
Bananas
Beans
Beans, green, without pods
Beans, with pods
Beef meat
Beer and beer-like beverage
Beer, regular
Beetroot
Biscuits
Bitter chocolate
Black tea, infusion
Bottled water
Brown sauce
Butter
Buttermilk
Carrots
Cashew nuts
Cereal flakes
Cheese
Cheese, Camembert
Cheese, Cheddar
Cheese, Danbo
Cheese, Edam
Cheese, Gouda
Cheese, Mozzarella
Cheese, processed spreadable
Chicken egg
Chicken meat
Chocolate (Cocoa) products
Cider
Cod and whiting
Coffee
Cola beverages, caffeinic
Concentrated fruit juice
Condiment
Confectionery (non-chocolate)
Cooked smoked sausage
Cow milk
Cream
Cucumbers
Cultivated mushroom
Curry sauce
Custard
Dressing
Dry sausage
Egg-based meal
Evaporated milk
Fats of mixed origin
Fermented milk products
Fish fingers
Fish products
Fish roe
Fishcakes
Flavoured milk
French fries
Fresh and lightly cooked
sausage
Fruit and vegetable juices
Fruit compote
Fruit juice
Fruit nectar
Fruit sauce
Hake
Ham, pork
Hazelnuts
Head cabbage
Herbal tea, infusion
Herring
Honey
Ice cream, milk-based
Iceberg-type lettuce
Ices and desserts
Instant coffee, liquid
Jam
Juice, Apple
Juice, Orange
Juice, Tomato
Kiwi
Leaf vegetables
Leek
Lentils
Lettuce, excluding Iceberg-type
lettuce
Liquorice candies
Main-crop potatoes
Mandarins
Margarine, low fat
Margarine, normal fat
Mayonnaise, > 50% oil

28
Meat and meat products
Meat balls
Meat burger
Meat stew
Meat/poultry soup
Meat-based meals
Melons
Milk chocolate
Mixed beef and pork meat
Mixed wheat and rye bread and
rolls
Molasses and other syrups
Multigrain bread and rolls
Mustard, mild
Mutton / lamb meat
Olive oil
Onions, bulb
Oranges
Parsley, herb
Pasta, cooked
Pasta, wheat flour, without
eggs
Pastries and cakes
Pate, pork liver
Peaches
Peanut
Peanuts butter
Pear
Peas
Peas, green, without pods
Pepper, black and white
Peppers, paprika
Pizza and pizza-like pies
Pork / piglet meat
Pork liver
Pork meat loaf
Potato based dishes
Potato boiled
Potato crisps
Potatoes and potatoes
products
Prepared mixed vegetable
salad
Pretzels
Quark
Ready to eat soups
Rice
Rice-based meals
Rye bread and rolls
Salmon and trout
Salt, iodised
Sandwich and sandwich-like
meal
Sausages
Savoury sauces
Shrimps
Snack food
Soft drink, flavoured
Soft drink, fruit content
Spinach (fresh)
Spirits
Squid
Starchy pudding
Still mineral water
Strawberries
Sunflower oil
Sunflower seed
Tap water
Tomato ketchup
Tomato purée
Tomatoes
Tree nuts
Tuna
Turkey meat
Veal meat
Vegetable oil
Vegetable sauce
Vegetable/herb soup
Vegetable-based meals
Vinegar, wine
Walnuts
Wheat bread and rolls
Wheat milling products
White sauce
White sugar
Wine, red
Wine, white
Yoghurt, cow milk, plain

29
9 Annex 2 Building the reference diet The starting point for composing the EU reference diet is level 2 of FoodEx. When a level 2 product represents less than 1% of the level 1 food categories, we’ve decided to
neglect it. We’ve also decided to omit the level 1 food categories ‘Food for infants and small children’ and ‘Products for special nutritional use’. They represent respectively
0.1% and 0.9% of the mass consumed per person per day on average.
For the other level 2 product groups we’ve selected one level 3 product to represent the whole product group at level 2, when that product represents over 80% of all the
level 3 products within that group. For instance, for level 2 ‘grains for human consumption’ we have selected rice. Rice represents over 95% of the EU consumption of ‘grains
for human consumption’.
For other level 2 product groups we’ve selected multiple level 3 products. For instance, for level 2 ‘bread and rolls’ we selected ‘wheat bread and rolls’, ‘rye bread and rolls’,
‘mixed wheat and rye bread and rolls’ and ‘multigrain bread and rolls’. These 4 types of bread and rolls represent over 85% of the EU consumption for ‘bread and rolls’. The
coverage per product group (level 2) is at minimum 80%, but for some product groups the coverage is close to 100%.
Some descriptions of level 3 products are not very precise. An example is ‘wheat milling products’. A more specific product was selected to represent it in terms of
environmental impact and nutritional profile. This is mentioned in the remarks. For ‘wheat milling products’ we selected white wheat flour to represent it. There are also
products which are represented by a mix of the other products in that product group. ‘Tree nuts’ for instance is represented by a mix of almonds, cashews, hazelnuts and
walnuts.
Foodex code L1
Foodex code L1
Foodex code L2 Foodex code L2
% withi
n Food
ex code
L1 Foodex code L3 Foodex code L3
% withi
n Food
ex code
L2 Remark
A.01.000001
Grains and grain-
based products
A.01.000001 Grains and grain-based products 0.0%
A.01.000013 Grains for human consumption 5.9%
A.01.000030 Rice
A.01.000043 Grain milling products 7.1%
A.01.000044 Wheat milling products White wheat flour
A.01.000098
Bread and rolls 52.2
%
A.01.000099 Wheat bread and rolls 64%
A.01.000118 Rye bread and rolls 13%

30
A.01.000129
Mixed wheat and rye bread and rolls 14%
A.01.000140 Multigrain bread and rolls 9%
A.01.000168 Pasta (Raw) 7.5%
A.01.000174 Pasta, wheat flour, without eggs
A.01.000184 Breakfast cereals 7.3%
A.01.000185 Cereal flakes
A.01.000252
Fine bakery wares 20.0
%
A.01.000253 Pastries and cakes 80% Croissant
A.01.000
302 Biscuits (cookies) 20%
A.01.000317
Vegetables and
vegetable products
A.01.000317 Vegetables and vegetable products 0.5%
A.01.000318
Root vegetables 13.9
%
A.01.000320 Beetroot 8%
A.01.000321 Carrots 92%
A.01.000331 Bulb vegetables 7.1%
A.01.000333 Onions, bulb
A.01.000337
Fruiting vegetables 43.3
%
A.01.000338 Tomatoes 61%
A.01.000339 Peppers, paprika 11%
A.01.000343 Cucumbers 21%
A.01.000346 Melons 8%
A.01.000350 Brassica vegetables 9.9%
A.01.000354 Head cabbage
A.01.000359
Leaf vegetables 11.1
%
A.01.000359 Leaf vegetables 43% mix of kale and endive
A.01.000361
Lettuce, excluding Iceberg-type lettuce 35%
A.01.000362 Iceberg-type lettuce 9%
A.01.000369 Spinach (fresh) 14%
A.01.000382 Legume vegetables 2.7%
A.01.000383 Beans, with pods

31
A.01.000385 Stem vegetables (Fresh) 3.3%
A.01.000391 Leek
A.01.000395 Sugar plants 0.6%
A.01.000399 Sea weeds 0.0%
A.01.000404 Tea and herbs for infusions (Solid) 0.1%
A.01.000418 Cocoa beans and cocoa products 0.6%
A.01.000423
Coffee beans and coffee products (Solid) 0.4%
A.01.000431 Coffee imitates (Solid) 0.0%
A.01.000440 Vegetable products 4.4%
A.01.000443 Tomato purée
A.01.000453 Fungi, cultivated 2.0%
A.01.000454 Cultivated mushroom
A.01.000458 Fungi, wild, edible 0.2%
A.01.000467
Starchy roots and
tubers
A.01.000467 Starchy roots and tubers 0.2%
A.01.000468
Potatoes and potatoes products 99.6
%
A.01.000468 Potatoes and potatoes products 25%
A.01.000470 Main-crop potatoes 10%
A.01.000471 French fries 13%
A.01.000474 Potato boiled 52%
A.01.000480 Other starchy roots and tubers 0.2%
A.01.000486
Legumes, nuts and oilseeds
A.01.000486 Legumes, nuts and oilseeds 0.1%
A.01.000487
Legumes, beans, green, without pods 37.3
%
A.01.000488 Beans, green, without pods 28%
A.01.000489 Peas, green, without pods 72%
A.01.000491
Legumes, beans, dried 48.4
% A.01.000
492 Beans 47%

32
A.01.000493 Lentils 23%
A.01.000494 Peas 13%
A.01.000512 Peanut 17%
A.01.000513
Tree nuts 11.5
%
A.01.000513 Tree nuts 25%
mix of almonds, cashews, hazelnuts and walnuts
A.01.000514 Almond, sweet 15%
A.01.000517 Cashew nuts 12%
A.01.000520 Hazelnuts 26%
A.01.000525 Walnuts 23%
A.01.000527 Oilseeds 2.7%
A.01.000532 Sunflower seed
A.01.000543 Other seeds 0.0%
A.01.000544
Fruit and fruit
products
A.01.000544 Fruit and fruit products 0.3%
A.01.000545
Citrus fruits 14.4
%
A.01.000547 Oranges 65%
A.01.000550 Mandarins 35%
A.01.000552
Pome fruits 39.4
%
A.01.000553 Apple 85%
A.01.000554 Pear 15%
A.01.000562 Stone fruits 6.9%
A.01.000573 Peaches
A.01.000575 Berries and small fruits 8.5%
A.01.000578 Strawberries
A.01.000606 Oilfruits 0.0%
A.01.000611
Miscellaneous fruits 19.3
% A.01.000
619 Kiwi 12%

33
A.01.000626 Bananas 88%
A.01.000647 Dried fruits 0.9%
A.01.000657
Jam, marmalade and other fruit spreads 4.6%
A.01.000658 Jam strawberry jam
A.01.000682
Other fruit products (excluding beverages) 5.8%
A.01.000701 Fruit compote apple compote
A.01.000727
Meat and meat
products (including
edible offal)
A.01.000727
Meat and meat products (including edible offal) 2.2%
A.01.000727
Meat and meat products (including edible offal)
A.01.000728
Livestock meat 37.9
%
A.01.000729 Beef meat 42%
A.01.000730 Veal meat 6%
A.01.000731 Pork / piglet meat 47%
A.01.000732 Mutton / lamb meat 5%
A.01.000736
Poultry 20.6
%
A.01.000737 Chicken meat 85%
A.01.000738 Turkey meat 15%
A.01.000744 Game mammals 0.6%
A.01.000751 Game birds 0.1%
A.01.000760 Mixed meat 2.6%
A.01.000761 Mixed beef and pork meat
A.01.000766 Edible offal, farmed animals 1.1%
A.01.000769 Pork liver
A.01.000791 Edible offal, game animals 0.0%
A.01.000795
Preserved meat 11.3
%
A.01.000796 Ham, pork 79%
A.01.000802 Bacon 21%
A.01.000811
Sausages 20.7
%
A.01.000811 Sausages 18%
A.01.000812 Fresh and lightly cooked sausage 24%

34
A.01.000826 Cooked smoked sausage 36%
A.01.000844 Dry sausage 22%
A.01.000857 Meat specialities 1.0%
A.01.000858 Pork meat loaf
A.01.000867 Pastes, pâtés and terrines 1.5%
A.01.000871 Pate, pork liver
A.01.000873 Meat imitates 0.3%
A.01.000876
Fish and other
seafood
A.01.000876 Fish and other seafood 0.3%
A.01.000877
Fish meat 76.9
%
A.01.000878 Herring 13%
A.01.000883 Salmon and trout 37%
A.01.000891 Tuna 18%
A.01.000894 Cod and whiting 25%
A.01.000895 Hake 6%
A.01.000910
Fish products 10.6
%
A.01.000910 Fish products 32% mix of fish fingers and fish cakes
A.01.000912 Fishcakes 15%
A.01.000913 Fish fingers 53%
A.01.000916 Fish offal 1.0%
A.01.000917 Fish roe
A.01.000919 Crustaceans 6.0%
A.01.000924 Shrimps
A.01.000927 Water molluscs 5.0%
A.01.000928 Squid
A.01.000942 Amphibians, reptiles, snails, insects 0.1%
A.01.000948
A.01.000948 Milk and dairy products 0.0%

35
Milk and dairy
products
A.01.000949 Liquid milk
60.8%
A.01.000950 cow milk
A.01.000963 Milk based beverages 3.8%
A.01.000964 Flavoured milk
A.01.000973 Concentrated milk 1.0%
A.01.000974 Evaporated milk
A.01.000985
Whey and whey products (excluding whey cheese) 0.2%
A.01.001000 Cream and cream products 2.0%
A.01.001001 Cream
A.01.001027
Fermented milk products 20.7
%
A.01.001027 Fermented milk products 35% mix of buttermilk and yoghurt
A.01.001028 Yoghurt, cow milk, plain 49%
A.01.001041 Buttermilk 16%
A.01.001049 Milk derivatives 0.0%
A.01.001053
Cheese 10.5
%
A.01.001053 Cheese 26%
A.01.001054 Quark 27%
A.01.001057 Cheese, processed spreadable 3%
A.01.001094 Cheese, Camembert 4%
A.01.001102 Cheese, Cheddar 5%
A.01.001112 Cheese, Danbo 9%
A.01.001117 Cheese, Edam 6%
A.01.001133 Cheese, Gouda 13%
A.01.001173 Cheese, Mozzarella 8%
A.01.001240 Milk and milk product imitates 0.8%
A.01.001252
A.01.001252 Eggs and egg products 0.1%

36
Eggs and egg
products
A.01.001253 Eggs, fresh
99.9%
A.01.001254 chicken egg
A.01.001263 Eggs, powder 0.0%
A.01.001267
Sugar and confectio
nary
A.01.001267 Sugar and confectionary 0.4%
A.01.001268 Sugars
33.1%
A.01.001269 white sugar
A.01.001280 Sugar substitutes 0.4%
A.01.001295
Chocolate (Cocoa) products 34.6
%
A.01.001295 Chocolate (Cocoa) products 60%
A.01.001296 Bitter chocolate 13%
A.01.001303 Milk chocolate 28%
A.01.001310
Confectionery (non-chocolate) 19.0
%
A.01.001310 Confectionery (non-chocolate) 82% mix of strawberry jam and liqourice
A.01.001321 Liquorice candies 18%
A.01.001328 Dessert sauces 2.6%
A.01.001329 Fruit sauce strawberry sauce
A.01.001333 Molasses and other syrups 4.7%
A.01.001333 Molasses and other syrups
A.01.001340 Honey 5.1%
A.01.001340 Honey
A.01.001346
Animal and
vegetable fats and
oils
A.01.001346 Animal and vegetable fats and oils 1.5%
A.01.001347 Animal fat
28.2%
A.01.001348 Butter
A.01.001358 Fish oil 0.0%
A.01.001362 Vegetable fat 1.6%
A.01.001363 Peanuts butter
A.01.001367
Vegetable oil 28.2
%
A.01.001367 Vegetable oil 19%
mix of rapeseed, sunflour and soybean oil
A.01.001375 Olive oil 54%

37
A.01.001384 Sunflower oil 27%
A.01.001388 Fats of mixed origin 6.5%
A.01.001388 Fats of mixed origin mix of butter and vegetable oil
A.01.001389
Margarine and similar products 34.0
%
A.01.001390 Margarine, normal fat 70%
A.01.001391 Margarine, low fat 30%
A.01.001394
Fruit and vegetable
juices
A.01.001394 Fruit and vegetable juices 2.3%
A.01.001394 Fruit and vegetable juices mix of tomato and apple juice
A.01.001395
Fruit juice 79.1
%
A.01.001395 Fruit juice 11%
A.01.001396 Juice, Apple 48%
A.01.001397 Juice, Orange 41%
A.01.001418 Concentrated fruit juice 4.9%
A.01.001418 Concentrated fruit juice
A.01.001434 Fruit nectar 4.4%
A.01.001434 Fruit nectar
A.01.001442 Mixed fruit juice 7.6%
A.01.001453 Dehydrated/powdered fruit juice 0.0%
A.01.001454 Vegetable juice 1.1%
A.01.001455 Juice, Tomato
A.01.001463 Mixed vegetable juice 0.0%
A.01.001467 Mixed fruit and vegetable juice 0.6%
A.01.001470
Non-alcoholic
beverages
A.01.001470 Non-alcoholic beverages 0.1%
A.01.001471
Soft drinks 23.3
%
A.01.001472 Soft drink, fruit content 24%
A.01.001494 Soft drink, flavoured 46%
A.01.001510 Cola beverages, caffeinic 30%

38
A.01.001515
Tea (Infusion)
32.7%
A.01.001516 Black tea, infusion 77%
A.01.001
519 Herbal tea, infusion 23%
A.01.001522
Coffee (Beverage) 42.8
%
A.01.001522 Coffee (Beverage) 85%
A.01.001529 Instant coffee, liquid 15%
A.01.001530 Coffee imitates beverage 0.3%
A.01.001531 Cocoa beverage 0.8%
A.01.001534
Alcoholic beverages
A.01.001534 Alcoholic beverages 0.3%
A.01.001535
Beer and beer-like beverage 69.4
%
A.01.001535 Beer and beer-like beverage 20%
A.01.001537 Beer, regular 80%
A.01.001541
Wine 24.7
%
A.01.001542 Wine, white 31%
A.01.001544 Wine, red 69%
A.01.001546 Fortified and liqueur wines 0.5%
A.01.001549 Wine-like drinks 2.4%
A.01.001550 Cider
A.01.001552 Liqueur 0.4%
A.01.001561 Spirits 1.5%
A.01.001561 Spirits
A.01.001569 Alcoholic mixed drinks 0.9%
A.01.001573
Drinking water
A.01.001573 Drinking water 4.4%
A.01.001574 Tap water
56.0%
A.01.001574 tap water
A.01.001575 Well water 0.0%

39
A.01.001576
Bottled water 39.6
%
A.01.001576 Bottled water 75%
A.01.001577 Still mineral water 25%
A.01.001579 Water ice (for consumption) 0.0%
A.01.001580
Herbs, spices and condimen
ts
A.01.001580 Herbs, spices and condiments 0.4%
A.01.001581 Herbs 2.3%
A.01.001586 Parsley, herb
A.01.001593 Spices 1.5%
A.01.001621 Pepper, black and white
A.01.001625 Herb and spice mixtures 0.2%
A.01.001632 Seasoning or extracts 6.6%
A.01.001635 Salt, iodised
A.01.001649
Condiment 17.1
%
A.01.001649 Condiment 13%
mix of mustard, tomato ketchup and mayonaise
A.01.001651 Mustard, mild 11%
A.01.001653 Vinegar, wine 9%
A.01.001655 Tomato ketchup 58%
A.01.001661 Curry sauce 9%
A.01.001665
Dressing 18.8
%
A.01.001665 Dressing 65%
A.01.001669 Mayonnaise, > 50% oil 35%
A.01.001672 Chutney and pickles 0.5%
A.01.001684
Savoury sauces 50.9
%
A.01.001684 Savoury sauces 23% tomato based sauce
A.01.001685
White sauce (Bechamel sauce, Cheese sauce) 11%
A.01.001686
Brown sauce (Gravy, Lyonnais sauce) 44%

40
A.01.001694 Vegetable sauce 22%
A.01.001695 Flavourings or essences 0.0%
A.01.001704 Baking ingredients 1.6%
A.01.001715
Food for infants
and small children
A.01.001715 Food for infants and small children 0.1%
A.01.001716 Infant formulae, powder 1.5%
A.01.001722 Follow-on formulae, powder 0.8%
A.01.001728
Cereal-based food for infants and young children 4.0%
A.01.001733
Ready-to-eat meal for infants and young children
18.0%
A.01.001739
Yoghurt, cheese and milk-based dessert for infants 1.1%
A.01.001743
Fruit juice and herbal tea for infants and young c 2.8%
A.01.002000 Infant formulae, liquid
52.6%
A.01.002010 Follow-on formulae, liquid
19.2%
A.01.001748
Products for special nutritiona
l use
A.01.001748 Products for special nutritional use 0.2%
A.01.001749 Food for weight reduction
13.1%
A.01.001752 Dietary supplements 9.2%
A.01.001765
Food for sports people (labelled as such)
69.3%
A.01.001771
Dietetic food for diabetics (labelled as such) 2.9%
A.01.001784
Medical food (are specially formulated and intende 5.2%
A.01.001789
Composite food
A.01.001789
Composite food (including frozen products) 0.7%

41
(including frozen
products) A.01.001790
Cereal-based dishes 16.0
%
A.01.001791 Sandwich and sandwich-like meal 20%
A.01.001800 Pizza and pizza-like pies 38%
A.01.001809 Pasta, cooked 42%
A.01.001816 Rice-based meals 2.4%
A.01.001816 Rice-based meals
A.01.001820 Potato based dishes 2.1%
A.01.001820 Potato based dishes
A.01.001825 Beans-based meals 1.0%
A.01.001829
Meat-based meals 12.2
%
A.01.001829 Meat-based meals 32%
A.01.001830 Meat burger 22%
A.01.001831 Meat balls 20%
A.01.001833 Meat stew 26%
A.01.001834 Fish and seafood based meals 0.9%
A.01.001839 Vegetable-based meals 7.9%
A.01.001839 Vegetable-based meals
A.01.001847 Egg-based meal (e.g., omelette) 5.5%
A.01.001847 Egg-based meal (e.g., omelette)
A.01.001855 Mushroom-based meals 0.1%
A.01.001856
Ready to eat soups 43.9
%
A.01.001856 Ready to eat soups 48%
mix of vegetable/herb soup and meat/poultry soup
A.01.001857 Vegetable/herb soup 35%
A.01.001860 Meat/poultry soup 16%
A.01.001866 Prepared salads 7.3%
A.01.001868 Prepared mixed vegetable salad
A.01.001877
Snacks, desserts,
A.01.001877 Snacks, desserts, and other foods 0.0%

42
and other foods
A.01.001878
Snack food 20.1
%
A.01.001878 Snack food 19%
Mix of chocolat, potato crisps and tree nuts
A.01.001879 Potato crisps 69%
A.01.001884 Pretzels 12%
A.01.001888
Ices and desserts 78.8
%
A.01.001888 Ices and desserts 22% mix of ice cream, yoghurt and custard
A.01.001889 Ice cream, milk-based 41%
A.01.001891 Starchy pudding 13%
A.01.001892 Custard 25%
A.01.001896 Other foods 1.1%

9-1
Optimeal (+31) 0182 579970
Gravin Beatrixstraat 34 www.optimeal.info
2805 PJ Gouda [email protected]
Optimeal is a software package for optimization of diets on health and sustainability. It was developed by Blonk Consultants in cooperation with Voedingscentrum (the Netherlands Nutrition Centre). Optimeal and the included environmental data have been applied in several peer-reviewed scientific papers.