optimal site selection for a solar power plant in the
TRANSCRIPT

Research ArticleOptimal Site Selection for a Solar Power Plant in the CentralAnatolian Region of Turkey
Ozge Pinar Akkas, Mustafa Yasin Erten, Ertugrul Cam, and Nihat Inanc
Department of Electrical and Electronics Engineering, Kirikkale University, Kirikkale, Turkey
Correspondence should be addressed to Mustafa Yasin Erten; [email protected]
Received 17 November 2016; Revised 14 February 2017; Accepted 19 March 2017; Published 7 June 2017
Academic Editor: Md. Rabiul Islam
Copyright © 2017 Ozge Pinar Akkas et al. This is an open access article distributed under the Creative Commons AttributionLicense, which permits unrestricted use, distribution, and reproduction in any medium, provided the original work isproperly cited.
Primary energy sources are running out due to the increase in electrical energy consumption. Environmental problems causedby primary energy sources are also increasing. Using more renewable energy resources (RES) can be considered as one of themost powerful solutions to address these problems. Today, required photovoltaic power systems (PVPS) and wind energysystems (WES) are widely used as RES for addressing these problems. Because of their high costs, feasibility studies arerequired for locating large systems associated with these resources. In this study, various suggestions are determined aboutlocation selection, which is an important stage in the PVPS’s establishment. Hence, the criteria for selecting theappropriate location are analyzed by the multicriteria decision making (MCDM) methods and the results are evaluated for5 cities in the Central Anatolian Region of Turkey. In conclusion, it is determined which city is the most suitable placefor installation of solar power plants.
1. Introduction
Solar energy is one of the most important RES, and it isbecoming more popular day by day for many reasons suchas the purification of raw materials and the reduction ofdependence on foreign oil and gas. Moreover, solar energyis an inexhaustible reliable source and it is harmless to theecological environment. The choice of the appropriate solarenergy location, which is important in their setup, dependson many factors. These factors should be optimized toget more energy as well as to reduce initial investmentand operation costs. These operations should be consideredduring the first phase of solar energy installation to locatethe plant accurately. Hence, many studies are performed inthe literature locating the power plants in to the most appro-priate places [1–4]. Multicriteria decision making (MCDM)methods are used in the optimization of systems with multi-ple parameters taken into consideration at the same time [5].For this purpose, various submethods have been used to meetthe requirements.
MCDM is a subbranch of a decision process. The deci-sion process consists of the determination of different criteriafor modelling goals, evaluation of alternatives, and gettingresults. To evaluate the alternatives based on criteria, differ-ent methods are used, such as analytic hierarchy process(AHP), analytic network process (ANP), Technique forOrder Preference by Similarity to Ideal Solution (TOPSIS),Elimination and Choice Translating Reality English (ELEC-TRE), The Preference Ranking Organization Method forEnrichment Evaluation (PROMETHEE), and Vise Kriteri-jumska Optimizacija I Kompromisno Resenje (VIKOR) [6].
There are many studies that use the MCDM methods tosolve location problems in the literature. Kengpol et al. devel-oped a decision support system for solar power plant siteselection in Thailand. They applied fuzzy analytic hierarchyprocess (Fuzzy AHP) model for the problem [7]. Uyanworked for suitable site selection in solar farms using geo-graphical information system (GIS) and AHP. KarapinarRegion in Konya/Turkey was chosen as the study area [8].Asakereh et al. used a Fuzzy AHP and GIS to locate the most
HindawiInternational Journal of PhotoenergyVolume 2017, Article ID 7452715, 13 pageshttps://doi.org/10.1155/2017/7452715
appropriate sites for solar energy farms in Shodirvan regionin Iran [9]. ElQuoliti used AHP to determine the suitable sitefor solar power generation in the Western Region of SaudiArabia. Fourteen site selection criteria are determined inthe study [10]. Sozen et al. presented an approach for thelocation of solar plants by data envelopment analysis(DEA) and using the TOPSIS method. They applied it to 30different cities in different regions of Turkey [11]. Lee et al.proposed a multiple-criteria decision-making model thatincorporates the interpretive structural modeling (ISM),fuzzy ANP, and VIKOR to select the most suitable photo-voltaic solar plant location and applied it in a case studyin evaluating photovoltaic solar plant locations in Taiwan[12]. Sindhu et al. used hybrid combination of AHP andfuzzy TOPSIS to select an appropriate site in India [13].
In this study, four different MCDM methods areused to select the most suitable city among 5 cities inthe Central Anatolian Region of Turkey for the establishmentof solar power plant in order to get maximum power out-put and have minimum cost. Aksaray, Konya, Karaman,Nevşehir, and Niğde, which have the highest solar radia-tion, are selected for comparison. Three main criteria aredefined for solar power plant location selection. These cri-teria rely on solar energy potential, feeder capacity, andsurface slope. This study differs from other studies interms of comparative use of all the MCDM methods. Thissituation has not been studied previously in the literature,especially when choosing suitable locations for PVPS. Inaddition, associating such a study with cities that have notbeen selected before is another contribution of this study.In conclusion of the study, it is observed that Karaman isdetermined as the most suitable city for the establishmentof the solar plant station.
2. Problem Definition
It has become important to determine the installation loca-tion of solar energy systems that are in the foreground amongthe RES. Since the lifetime of such systems is a long time in 25years, the location of a solar power plant that can obtain max-imum energy is significant. Moreover, it is not possible tochange the place of the system after installation because ofthe construction costs.
There are different criteria that can be used to deter-mine the solar power plant location. Solar energy poten-tial, feeder capacity of the distribution center, and surfaceslope are the main criteria that have been used for theselection of the solar power plant location. These main cri-teria have subcriteria to examine the problem in detail. Sub-criteria of energy potential criterion are photovoltaic (PV)solar radiation, sunshine duration, and the total amount ofenergy/PV area. The feeder capacity of the distribution centerhas subcriteria of total capacity and available quota. Subcri-teria of the power plant surface are the surface slope, ice load,and wind potential. Each subcriterion has its own weightfactor for the related main criterion. In the following, theabove-mentioned main criteria for the related cities willbe, respectively, explained.
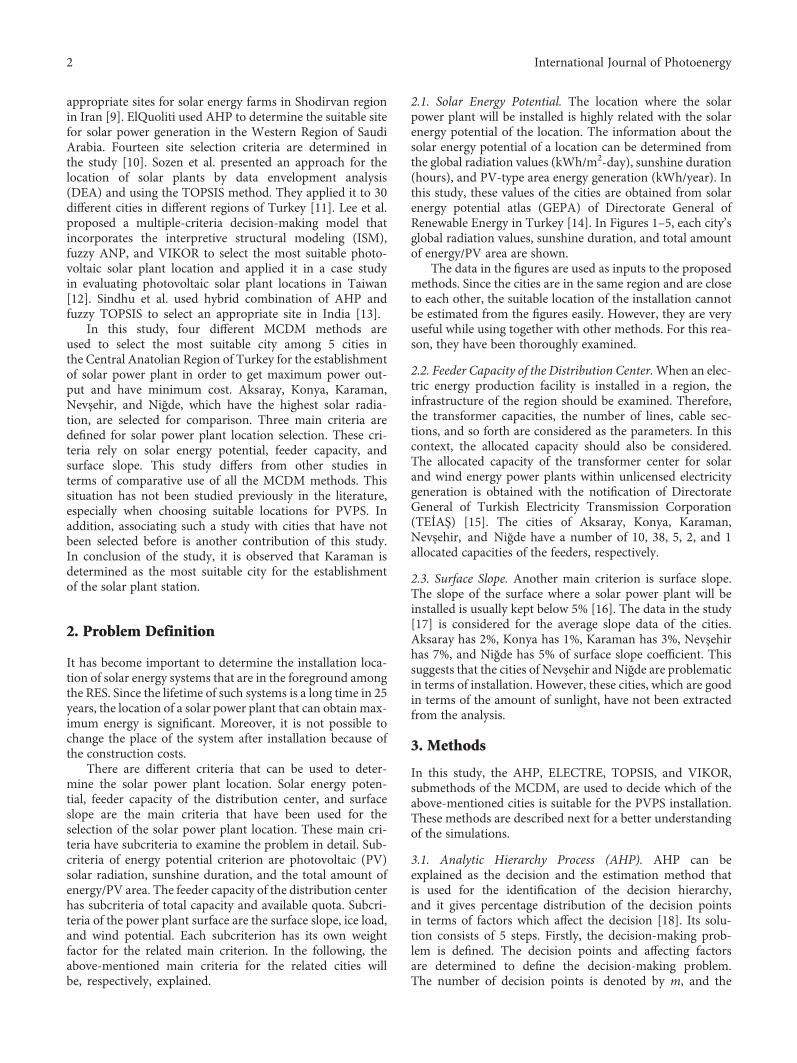
2.1. Solar Energy Potential. The location where the solarpower plant will be installed is highly related with the solarenergy potential of the location. The information about thesolar energy potential of a location can be determined fromthe global radiation values (kWh/m2-day), sunshine duration(hours), and PV-type area energy generation (kWh/year). Inthis study, these values of the cities are obtained from solarenergy potential atlas (GEPA) of Directorate General ofRenewable Energy in Turkey [14]. In Figures 1–5, each city’sglobal radiation values, sunshine duration, and total amountof energy/PV area are shown.
The data in the figures are used as inputs to the proposedmethods. Since the cities are in the same region and are closeto each other, the suitable location of the installation cannotbe estimated from the figures easily. However, they are veryuseful while using together with other methods. For this rea-son, they have been thoroughly examined.
2.2. Feeder Capacity of the Distribution Center.When an elec-tric energy production facility is installed in a region, theinfrastructure of the region should be examined. Therefore,the transformer capacities, the number of lines, cable sec-tions, and so forth are considered as the parameters. In thiscontext, the allocated capacity should also be considered.The allocated capacity of the transformer center for solarand wind energy power plants within unlicensed electricitygeneration is obtained with the notification of DirectorateGeneral of Turkish Electricity Transmission Corporation(TEİAŞ) [15]. The cities of Aksaray, Konya, Karaman,Nevşehir, and Niğde have a number of 10, 38, 5, 2, and 1allocated capacities of the feeders, respectively.
2.3. Surface Slope. Another main criterion is surface slope.The slope of the surface where a solar power plant will beinstalled is usually kept below 5% [16]. The data in the study[17] is considered for the average slope data of the cities.Aksaray has 2%, Konya has 1%, Karaman has 3%, Nevşehirhas 7%, and Niğde has 5% of surface slope coefficient. Thissuggests that the cities of Nevşehir and Niğde are problematicin terms of installation. However, these cities, which are goodin terms of the amount of sunlight, have not been extractedfrom the analysis.
3. Methods
In this study, the AHP, ELECTRE, TOPSIS, and VIKOR,submethods of the MCDM, are used to decide which of theabove-mentioned cities is suitable for the PVPS installation.These methods are described next for a better understandingof the simulations.
3.1. Analytic Hierarchy Process (AHP). AHP can beexplained as the decision and the estimation method thatis used for the identification of the decision hierarchy,and it gives percentage distribution of the decision pointsin terms of factors which affect the decision [18]. Its solu-tion consists of 5 steps. Firstly, the decision-making prob-lem is defined. The decision points and affecting factorsare determined to define the decision-making problem.The number of decision points is denoted by m, and the
2 International Journal of Photoenergy

number of factors affecting them is denoted by n. In thesecond step, comparison matrix among factors is formed.It is a square matrix of size nxn. The components onthe diagonal of the matrix take the value of “1.” Theresulting comparison matrix is shown in
A =
a11 a12 … a1na21 a22 … a2n⋮ ⋮ ⋮ ⋮am1 am2 … amn
, 1
where amn is the element of mth row, nth column of
matrix A, and shows the intensity of importance of mthfactor over nth factor. The relative importance of pairwisecomparisons is measured according to a numerical scalefrom 1 to 9 as shown in Table 1 [19]. When factor m com-pared to n is assigned with the number shown in Table 1,the factor n compared to m becomes its reciprocal.
In the third step, percentage importance distribution ofthe factors is determined. Comparison matrix shows theimportance level with respect to each factor. The column vec-tor B that has k components is formed to determine weightsor the percentage importance distribution of all factors byusing column vectors that form the comparison matrix.The column vector B is shown in
Glo
bal r
adia
tion
valu
es (k
Wh/
m2 -d
ay) 8.00
7.00
6.00
5.00
4.00
3.00
2.00
1.00
0.00
1.98 2.
56
4.23
5.20
6.30 6.
78
6.81
6.05
5.12
3.73
2.36
1.77
Months
Janu
ary
Febr
uary
Mar
ch
April
May
June July
Augu
st
Sept
embe
r
Oct
ober
Nov
embe
r
Dec
embe
r
Suns
hine
dur
atio
n (h
our)
0.00
2.00
4.00
6.00
8.00
10.00
12.00
14.00
4.19
5.51
6.88
8.03
9.46
11.2
8
11.9
7
11.3
6
9.79
7.36
5.53
3.93
Months
Janu
ary
Febr
uary
Mar
ch
April
May
June July
Augu
st
Sept
embe
r
Oct
ober
Nov
embe
r
Dec
embe
r
(a) (b)
Tota
l am
ount
of e
nerg
y/PV
area
(kW
h/ye
ar)
3000028000260002400022000200001800016000140001200010000
8000600040002000
00
10 20 30 40 50 60 70 80 90 100m2
Monocrystallinesilicon
Polycrystallinesilicon
Thin copper filmstrip
Cadmiumtellurium
Amorphoussilicon
(c)
Figure 1: Konya province (a) global radiation values, (b) sunshine duration, and (c) total amount of energy/PV area.
3International Journal of Photoenergy

Bi =
b11b21⋮bn1
2
The components of the column vector B are calculated asshown in
bmn =amn
〠k
m=1amn3
The matrix C is formed by combining the column vectorB as shown in
C =
c11 c12 … c1nc21 c22 … c2n⋮ ⋮ ⋮ ⋮cm1 cm2 … cmn
, 4
where cmn is the element ofmth row, nth column of matrix C.The percentage importance distribution that shows the
relative importance of each factor can be obtained with thehelp of matrix C. The column vector W called weighting
8.00
7.00
6.00
5.00
4.00
3.00
2.00
1.00
0.00
Months
Janu
ary
Febr
uary
Mar
ch
Apr
il
May
June
July
Aug
ust
Sept
embe
r
Oct
ober
Nov
embe
r
Dec
embe
r
Glo
bal r
adia
tion
valu
es (k
Wh/
m2 -d
ay)
2.16 2.
69
4.38
5.35
6.45 6.
98
6.91
6.15
5.22
3.86
2.52
1.91
0.00
2.00
4.00
6.00
8.00
10.00
12.00
14.00
Months
Janu
ary
Febr
uary
Mar
ch
Apr
il
May
June
July
Aug
ust
Sept
embe
r
Oct
ober
Nov
embe
r
Dec
embe
r
4.46
5.85
7.14
8.44
9.84 11
.51
12.0
2
11.4
7
10.1
1
7.77
5.95
4.31
Suns
hine
dur
atio
n (h
our)
(a) (b)
Tota
l am
ount
of e
nerg
y/PV
area
(kW
h/ye
ar)
3000028000260002400022000200001800016000140001200010000
8000600040002000
00 10 20 30 40 50 60 70 80 90 100
m2
Monocrystallinesilicon
Polycrystallinesilicon
Thin copper filmstrip
Cadmiumtellurium
Amorphoussilicon
(c)
Figure 2: Karaman province (a) global radiation values, (b) sunshine duration, and (c) total amount of energy/PV area.
4 International Journal of Photoenergy

vector is obtained by taking the mean of row components ofmatrix C. W is shown in (5). The calculation of componentsof vector W is shown in (6).
W =
w1
w2
⋮wn
, 5
wm =〠k
n=1cmn
k6
In the fourth step, consistency of factor comparisonis measured. Consistency ratio (CR) determines whetherthe comparisons that are made by AHP method are trueor not. Firstly, column vector D is obtained by multiply-ing comparison matrix A with weighting vector W asshown in
8.00
7.00
6.00
5.00
4.00
3.00
2.00
1.00
0.00
Months
Janu
ary
Febr
uary
Mar
ch
Apr
il
May
June
July
Aug
ust
Sept
embe
r
Oct
ober
Nov
embe
r
Dec
embe
r
Glo
bal r
adia
tion
valu
es (k
Wh/
m2 -d
ay)
2.03 2.
65
4.23
5.11
6.37 6.
84 6.92
6.06
5.10
3.76
2.39
1.81
Janu
ary
Febr
uary
Mar
ch
Apr
il
May
June
July
Aug
ust
Sept
embe
r
Oct
ober
Nov
embe
r
Dec
embe
r
0.00
2.00
4.00
6.00
8.00
10.00
12.00
14.00
Months
Suns
hine
dur
atio
n (h
our)
4.41 5.
48
6.74 7.
85
9.51
11.3
9
12.1
6
11.5
7
10.0
6
7.61
5.65
3.90
(a) (b)
Tota
l am
ount
of e
nerg
y/PV
area
(kW
h/ye
ar)
3000028000260002400022000200001800016000140001200010000
8000600040002000
00 10 20 30 40 50 60 70 80 90 100
m2
Monocrystallinesilicon
Polycrystallinesilicon
Thin copper filmstrip
Cadmiumtellurium
Amorphoussilicon
(c)
Figure 3: Niğde province (a) global radiation values, (b) sunshine duration, and (c) total amount of energy/PV area.
5International Journal of Photoenergy

D =
a11 a12 … a1na21 a22 … a2n⋮ ⋮ ⋮ ⋮
am1 am2 … amn
x
w1
w2
⋮
wn
7
Main value related to each evaluation factor (EF) isobtained by dividing column vector D to the correspondingelements of column vector W as shown in
EFm = dmwm
m = 1, 2,…, k 8
Mean value related to the comparison (λ) is obtained bytaking the mean of EF elements as shown in
λ =〠k
i=mEFmk
9
Then, consistency index (CI) and the (CR) are calculatedas shown in (10) and (11).
The value of CR must be smaller than 0.10 to be consis-tent with comparison matrix [20].
Random index (RI) in (11) takes different values bythe number of criteria. The values of RI according to n,which is the number of criteria, are shown in Table 2.
1.87 2.
48
4.03
4.95
6.20 6.
61 6.71
5.94
4.95
3.56
2.22
1.68
8.00
7.00
6.00
5.00
4.00
3.00
2.00
1.00
0.00
Months
Janu
ary
Febr
uary
Mar
ch
Apr
il
May
June
July
Aug
ust
Sept
embe
r
Oct
ober
Nov
embe
r
Dec
embe
r
Glo
bal r
adia
tion
valu
es (k
Wh/
m2 -d
ay)
4.07
5.32 6.
43
7.65
9.16
11.1
7 12.0
5
11.4
8
9.68
7.27
5.35
3.57
0.00
2.00
4.00
6.00
8.00
10.00
12.00
14.00
Months
Suns
hine
dur
atio
n (h
our)
Janu
ary
Febr
uary
Mar
ch
Apr
il
May
June
July
Aug
ust
Sept
embe
r
Oct
ober
Nov
embe
r
Dec
embe
r
(a) (b)
Tota
l am
ount
of e
nerg
y/PV
area
(kW
h/ye
ar)
28000260002400022000200001800016000140001200010000
8000600040002000
00 10 20 30 40 50 60 70 80 90 100
m2
Monocrystallinesilicon
Polycrystallinesilicon
Thin copper filmstrip
Cadmiumtellurium
Amorphoussilicon
(c)
Figure 4: Nevşehir province (a) global radiation values, (b) sunshine duration, and (c) total amount of energy/PV area.
6 International Journal of Photoenergy

In this study, the value of RI is taken as 0.58 from thetable since there are 3 criteria.
CI = λ− kk− 1 ,
10
CR = CIRI 11
In the final step, percentage importance distribution(PID) at m decision points is found for each factor. In otherwords, the comparisons and matrix operations are repeatedk times. However, the size of the comparison matrix that willbe used as the decision points of each factor will be mxm.
After each comparison operation, column vector S thatshows percentage distribution and has a size of mx1 isobtained. The column vector S is shown in
Sm =
s11s21⋮sm1
12
The decision matrix K is formed with mxn size, and itconsists of n column vector S which has the size of mx1. Itis shown in
1.90 2.
48
4.13
5.03
6.22 6.
67 6.76
6.00
5.03
3.66
2.29
1.71
8.00
7.00
6.00
5.00
4.00
3.00
2.00
1.00
0.00
Months
Janu
ary
Febr
uary
Mar
ch
Apr
il
May
June
July
Aug
ust
Sept
embe
r
Oct
ober
Nov
embe
r
Dec
embe
r
Glo
bal r
adia
tion
valu
es (k
Wh/
m2 -d
ay)
4.11
5.40
6.80
7.97
9.36
11.2
7
12.1
2
11.5
3
9.81
7.36
5.45
3.73
0.00
2.00
4.00
6.00
8.00
10.00
12.00
14.00
Months
Suns
hine
dur
atio
n (h
our)
Janu
ary
Febr
uary
Mar
ch
Apr
il
May
June
July
Aug
ust
Sept
embe
r
Oct
ober
Nov
embe
r
Dec
embe
r
(a) (b)
Tota
l am
ount
of e
nerg
y/PV
area
(kW
h/ye
ar)
28000260002400022000200001800016000140001200010000
8000600040002000
00 10 20 30 40 50 60 70 80 90 100
Monocrystallinesilicon
Polycrystallinesilicon
Thin copper filmstrip
Cadmiumtellurium
Amorphoussilicon
m2
(c)
Figure 5: Aksaray province (a) global radiation values, (b) sunshine duration, and (c) total amount of energy/PV area.
7International Journal of Photoenergy

K =
s11 s12 … s1ns21 s22 … s2n⋮ ⋮ ⋮ ⋮sm1 sm2 … smn
13
As a result, the column vector L is obtained by multiply-ing the decision matrix with column vector W (weightingvector) as shown in (14). The column vector L gives the per-centage distribution of decision points, and the sum of its ele-ments is 1.
L =
s11 s12 … s1ns21 s22 … s2n⋮ ⋮ ⋮ ⋮
sm1 sm2 … smn
x
w1
w2
⋮
wn
=
l11l21⋮
lm1
14
3.2. Elimination and Choice Translating Reality English(ELECTRE). The method depends on dual superioritycomparisons among the decision points for each evaluationfactor. This method basically consists of 8 steps [21].Firstly, the decision matrix A is formed. There are decisionpoints and evaluation factors in rows and columns of thedecision matrix. The matrix A is the initial matrix that isformed by the decision maker. The number of decisionpoints and the number of the evaluation factors are repre-sented by m and n in the Amn matrix. The resulting deci-sion matrix is shown in
Amn =
a11 a12 … a1na21 a22 … a2n⋮ ⋮ ⋮ ⋮
am1 am2 … amn
15
In the second step, standard decision matrix, X, isformed. It is shown in
Xmn =
x11 x12 … x1nx21 x22 … x2n⋮ ⋮ ⋮ ⋮xm1 xm2 … xmn
16
X is formed by the help of matrix A. The elements ofmatrix X are calculated as shown in
xmn =amn
〠m
k=1a2kn
, 17
where m is the number of the decision points, n is thenumber of the columns, and a is the element of matrix A.
In the third step, the weighted standard decision matrix,Y, is formed. The matrix Y is used to reflect importance dif-ferences of the criteria to the solution. The matrix Y isobtained by multiplying matrix X with a weighting vectorwi as shown in
Ymn =
w1x11 w2x12 … wnx1nw1x21 w2x22 … wnx2n⋮ ⋮ ⋮ ⋮
w1xm1 w2xm2 … wmxmn
18
In the fourth step, consistency (Ckl) and inconsistency(Dkl) sets are determined. Matrix Y is used to determine theconsistency sets. The decision points are evaluated in termsof the criteria. Equation (19) is used in this evaluation pro-cess. Every consistency set corresponds to one inconsistencyset in this method. Inconsistency set consists of the elementsthat are not in the consistency set.
Ckl = n, ykn ≥ yln 19
In the fifth step, consistency (C) and inconsistency (D)matrices are formed with the help of the consistency andinconsistency sets. The elements of the consistency matrixare found with (20), and the elements of the inconsistencymatrix are found with (21).
ckl = 〠n∈Ckl
wn, 20
dkl =max ykn − yln
n∈Dkl
max ykn − ylnn
21
Table 1: Rating scale of AHP method.
Intensity of importance Definition Explanation
1 Equal importance Two factors contribute equally to the objective.
3 More important Experience and judgement slightly favour one over the other.
5 Much more important Experience and judgement strongly favour one over the other.
7 Very much more important Experience and judgement very strongly favour one over the other.
9 Absolutely more important The evidence favouring one over the other is of the highest possible validity.
2, 4, 6, 8 Intermediate values When compromise is needed.
Table 2: The values of RI.
k RI k RI
1 0 6 1.24
2 0 7 1.32
3 0.58 8 1.41
4 0.90 9 1.45
5 1.12 10 1.49
8 International Journal of Photoenergy

The matrix C is obtained with (20) as shown in (22), andthe matrix D is obtained with (21) as shown in (23).
C =
− c12 c13 … c1mc21 − c23 … c2m⋮ ⋮ ⋮ ⋮ ⋮cm1 cm2 cm3 … −
, 22
D =
− d12 d13 … d1md21 − d23 … d2m⋮ ⋮ ⋮ ⋮ ⋮dm1 dm2 dm3 … −
23
In the sixth step, consistency superiority (F) and incon-sistency superiority (G) matrices are formed.
The matrix F is in the size of mxm, and the elements ofthe matrix F are obtained by the comparison of a consistencythreshold value c
¯and the elements of consistency matrix
ckl . Consistency threshold value is found with
c¯
= 1m m− 1 〠
m
k=1〠m
l=1ckl 24
The elements of the matrix F f kl take a value of 1 or 0,and there are no values on the diagonal of the matrix becausethe diagonal elements show the same decision point. Ifckl ≥ c
¯⇒f kl = 1, and if ckl < c
¯⇒f kl = 0
The matrixG is in the size of mxm, and it is formed in thesame manner as matrix F. Inconsistency threshold value d
¯is found with
d¯
= 1m m− 1 〠
m
k=1〠m
l=1dkl 25
The elements of the matrix G gkl take a value of 1 or 0,and there are no values on the diagonal of the matrix becausethe diagonal elements show the same decision point. Ifdkl < d
¯⇒gkl = 1, and if dkl ≥ d
¯⇒gkl = 0
In the seventh step, total dominance matrix (E) is formed.E is obtained with the multiplication of matrices F and K andconsists of 1’s and 0’s. Finally, the order of importance of thedecision points is determined.
3.3. Technique for Order Preference by Similarity to IdealSolution (TOPSIS). In the first step of this method, thedecision matrix A is formed. There are decision points inthe rows of the decision matrix and evaluation factors atthe columns of the decision matrix. The matrix A is an initialmatrix that is formed by the decision maker [22]. The result-ing decision matrix is shown in
Amn =
a11 a12 … a1na21 a22 … a2n⋮ ⋮ ⋮ ⋮am1 am2 … amn
26
In the second step, standard decision matrix R is formed.The matrix R is shown in
Rmn =
r11 r12 … r1nr21 r22 … r2n⋮ ⋮ ⋮ ⋮rm1 rm2 … rmn
27
The elements of the matrix R are calculated with the helpof the matrix A as shown in
rmn =amn
〠m
k=1a2kn
28
In the third step, standard weighted decision matrix V isformed. Firstly, weight values (wn) related to evaluation fac-tors are determined. Then, elements for each column in thematrix R are multiplied with related wn value. The matrix Vis shown in
Vmn =
w1r11 w2r12 … wnr1nw1r21 w2r22 … wnr2n⋮ ⋮ ⋮ ⋮
w1rm1 w2rm2 … wnrmn
29
In the fourth step, ideal A∗ and nonideal A− solutionsare formed. The biggest value of the weighted evaluation fac-tors of matrix V is chosen to form an ideal solution set. Equa-tion (30) shows the finding of the ideal solution set.
A∗ = maxm
vmn n ∈N , minm
vmn n ∈N 30
The smallest value of weighted evaluation factors ofmatrix V is chosen to form a nonideal solution set. Equation(31) shows the finding of the nonideal solution set.
A− = minm
vmn n ∈N , maxm
vmn n ∈N 31
In the fifth step, discrimination measurements are calcu-lated. The deviation values related to the decision points arecalculated with the help of Euclidean distance approach.Ideal discrimination S∗m and nonideal discrimination S−mmeasurement values are found with
S∗m = 〠n
n=1 vmn − v∗n2, 32
S−m = 〠n
n=1 vmn − v−n2 33
In the final step, the relative proximity of the ideal solu-tion is calculated. The ideal and nonideal discriminationvalues are used to calculate relative proximity of the idealsolution for each decision point. The calculation is shown in
C∗m = S−m
S−m + S∗m34
In (34), the value of C∗m is between 0 and 1 as shown in
9International Journal of Photoenergy

0 ≤ C∗m ≤ 1 35
If C∗m equals 1, it shows the absolute proximity of related
decision point to the ideal solution, and if C∗m equals 0, it
shows the absolute proximity of the related decision pointto the nonideal solution.
3.4. Vise Kriterijumska Optimizacija I Kompromisno Resenje(VIKOR). This method solves the problems by calculating thebest and the worst values of all the criteria functions. The best(f m
∗) and the worst (f m−) values are found with [22, 23]
f m∗ =max f mn, 36
f m− =min f mn, 37
where m represents criteria and n represents alternatives.Then, the values of Sn and Rn are calculated with [22, 23]
Sn = 〠n
m=1
wm fm∗ − f mnfm∗ − f m− , 38
Rn =max wm fm∗ − f mnfm∗ − f m− , 39
where wm represents the weight of the mth criteria.After that, the value of Qn that represents the maximum
group benefit is found with (40) for each alternative.
Qn =v Sn − S∗
S− − S∗+ 1− v Rn − R∗
R− − R∗ , 40
where S∗ =minnSn, S− =maxnSn, R∗ =minnRn, andR− =maxnRn. v refers to the weight for the strategy thatensures maximum group utility, and (1− v) refers to theweight of the minimum regret in dissent. The value of v
changes between 0 and 1. Generally, the value of v is takenas 0.5.
Finally, the calculated values of Sn, Rn, and Qn are rankedin a decreasing order. Qn with the smallest value is expressedas the best option among alternatives.
4. Simulation and Results
In this study, a simulation is implemented by using theMATLAB program to establish the location of the solarpower plants for the suggested cities with the help of themethods that are described next. The results obtained fromthe methods according to the problem definition have beenexplained in this section.
4.1. AHP Results. In this method, the matrices to be found forthe three main criteria described in the previous chapters will
Table 3: Comparison matrix for solar energy potential.
Solar energypotential
Aksaray Konya Karaman Nevşehir Niğde
Aksaray 1 1/3 1/7 3 1/5
Konya 3 1 1/5 5 1/3
Karaman 7 5 1 9 3
Nevşehir 1/3 1/5 1/9 1 1/7
Niğde 5 3 1/3 7 1
Table 4: Comparison matrix for maximum capacity that can beallocated.
Maximumcapacity thatcan be allocated
Aksaray Konya Karaman Nevşehir Niğde
Aksaray 1 1/3 3 5 8
Konya 3 1 5 7 9
Karaman 1/3 1/5 1 2 5
Nevşehir 1/5 1/7 1/2 1 3
Niğde 1/8 1/9 1/5 1/3 1
Table 5: Comparison matrix for surface slope.
Aksaray Konya Karaman Nevşehir Niğde
Aksaray 1 1/3 2 8 5
Konya 3 1 5 9 7
Karaman 1/2 1/5 1 6 3
Nevşehir 1/8 1/9 1/6 1 1/3
Niğde 1/5 1/7 1/3 3 1
Table 6: Decision matrix.
Solar energy potential Surface slope Capacity
Aksaray 4 8 8
Konya 6 10 10
Karaman 10 6 6
Nevşehir 2 2 4
Niğde 8 4 2
Table 7: Matrix E.
Aksaray Konya Karaman Nevşehir Niğde
Aksaray — 0 0 1 0
Konya 1 — 0 1 0
Karaman 1 1 — 1 1
Nevşehir 0 0 0 — 0
Niğde 1 0 0 1 —
Table 8: Proximity values based on ideal solution.
C∗
Aksaray 0.34
Konya 0.56
Karaman 0.83
Nevşehir 0.07
Niğde 0.62
10 International Journal of Photoenergy

be shown in a tabular form. These matrices are the compar-ative matrices of the solar energy potential, the allocatedcapacity, and the surface slope. The data to be used for thispurpose is taken from the study in [14]. Since the rows andcolumns have the same cities, the diagonal values of Table 3are 1. However, the other elements of the matrices are com-posed of different values found by using the AHP equations.These values show which city is superior to the others.
The comparison matrix that is formed by comparing thecities is shown in Table 3. Here, the row side shows the mainvariable. (This will also be applied to all other tabs through-out the article.) So, the order of importance will also beextracted according to the row. For example, Karaman hasmore solar energy potential than Aksaray, because whenKaraman is written in a row and Aksaray is written in a col-umn, the intersection point of the two cities in the table isdetermined as 7. However, for the opposite case, the elementat the intersection point is 1/7. When the whole table isexamined in this way, it can be seen that Karaman has thegreatest solar potential. This city is followed by Niğde, Konya,Aksaray, and Nevşehir, respectively.
After that, the CR value is calculated with the help of (11).This value is 0.054 for the solar energy potential criterion. ACR value that is less than 0.10 indicates consistency.
Similar to the above procedures, maximum allocatedcapacity values are found. The data of the maximum capacityare taken from the study in [15]. According to the data,Konya has the highest maximum capacity that can be allo-cated. Aksaray, Karaman, Nevşehir, and Niğde follow Konya,respectively. The comparison matrix among alternatives forthe maximum allocated capacity criterion is given in Table 4.
After that, the CR value is calculated with the help of 11.This value is 0.042 for the maximum allocated capacity crite-rion. Since this value is also smaller than 0.10, CR of the max-imum allocated capacity value is consistent.
With the same repeated operations, the surface gradi-ent matrix is also constructed using the data from thestudy [17]. The generated matrix, as Table 5, is given next.According to the table, Konya has the most suitable city
and is followed by Aksaray, Karaman, Niğde, and Nevşe-hir, respectively.
The value of the CR for the surface slope criteria is calcu-lated with (11) and found as 0.047. It is less than 0.10, and itshows the consistency.
Equation (14) is used to combine all the results. As aresult, it is found where the PVPS should be installed.Accordingly, installation should be done in the cities of Kara-man, Konya, Niğde, Aksaray, and Nevşehir, respectively. Thepercentage values for this situation are listed as 37%, 26%,18%, 14%, and 5%, respectively.
4.2. ELECTRE Results. In this method, the decision matrix isformed as mentioned in (15). The decision points (Aksaray,Konya, Karaman, Nevşehir, and Niğde) are put in the rows,and evaluation factors (solar energy potential, surface slope,and capacity) are put in the columns of the decision matrix.While forming the decision matrix, 2, 4, 6, 8, and 10 pointsare given to alternatives by considering their importance.For example, Karaman has the biggest point 10 due to havingthe highest solar energy potential. This city is followed byNiğde, Konya, Aksaray, and Nevşehir with 8, 6, 4, and 2points, respectively, for the solar energy potential criterion.The decision matrix is shown in Table 6.
After forming the decision matrix, total dominancematrix called matrix E is found by doing solution steps ofELECTRE method that are shown in (16)–(25). The matrixE is shown in Table 7.
When results in Table 7 are examined, the order ofimportance of decision points is determined by looking atthe values of 1. It is seen that Karaman is more dominantthan all of the other cities. Konya and Niğde are more dom-inant than Aksaray and Nevşehir. It is observed that Konyaand Niğde are not superior to each other. Therefore, thesecond choice can be Konya or Niğde. Aksaray is moredominant than Nevşehir. Nevşehir is not more dominantthan any of the other cities. When the results are com-bined, the order of priority for the solution is found asKaraman>Konya=Niğde>Aksaray>Nevşehir.
Table 9: Values of Sn, Rn, Qn, and decreasing order.
Sn Order of Sn Rn Order of Rn Qn Order of Qn
Aksaray 0.575 4 0.4875 4 0.6086 4
Konya 0.325 2 0.325 3 0.2939 2
Karaman 0.175 1 0.115 1 0 1
Nevşehir 0.9425 5 0.65 5 1 5
Niğde 0.4825 3 0.23 2 0.3077 3
Table 10: Results with AHP, ELECTRE, TOPSIS, and VIKOR methods.
Method 1 2 3 4 5
AHP Karaman Konya Niğde Aksaray Nevşehir
ELECTRE Karaman Konya/Niğde Konya/Niğde Aksaray Nevşehir
TOPSIS Karaman Niğde Konya Aksaray Nevşehir
VIKOR Karaman Konya Niğde Aksaray Nevşehir
11International Journal of Photoenergy

4.3. TOPSIS Results. In this method, decision matrix isneeded to obtain proximity values. Therefore, the decisionmatrix in Table 6 that is used in the solution with ELECTREmethod is taken. After that, the solution steps of the TOPSISmethod that are shown in (27)–(35) are performed. Theresults helping us to find the ideal decision points areobtained with calculating proximity values based on the idealsolution. They are shown in Table 8.
The alternative, which has C* value closest to 1, is theideal solution as mentioned in (35). According to the resultsin Table 8, Karaman which has the biggest C∗ is the ideal cityfor the problem solution. This city is followed by Niğde,Konya, Aksaray, and Nevşehir, respectively.
4.4. VIKOR Results. In this method, the decision matrix inTable 6 that is used in the solution with the ELECTREmethod is taken again. After that, the solution steps ofVIKOR method that are shown in (36)–(40) are performed.The values of Sn, Rn, and Qn are calculated. These valuesare ordered decreasingly. The results are shown in Table 9.
According to the VIKOR method, Qn with the smallestvalue is expressed as the best option among the alternativesas mentioned in the solution steps of this method. WhenTable 9 is examined, Karaman has the smallest value of Qn.Therefore, Karaman is the first choice among the alterna-tives. This city is followed by Konya, Niğde, Aksaray, andNevşehir, respectively, for solar power plant installation bylooking at the value of Qn.
4.5. Comparative Results of All Methods. Table 10 isobtained by combining the results of the 4 MCDMmethods used above. Thus, it is aimed that all the resultscould be seen together.
5. Conclusions
In this study, deciding on the most suitable location for asolar power plant installation is investigated. The results areobtained with the AHP, ELECTRE, TOPSIS, and VIKORmethods from MCDM submethods. The cities of Aksaray,Konya, Karaman, Nevşehir, and Niğde from the CentralAnatolian Region of Turkey are selected for the study. Thesolar energy potential, the allocated feeder connection capac-ity, and the surface slope are chosen as criteria for the study.According to the chosen criteria, it has shown that Karamanhas been identified as the most suitable city for solar powerplant installation for all of the methods. Moreover, currentpractical works are also in the line with our study’s results.Therefore, this is a verification of the methods used in thisstudy and they can be proposed for a solar power plant loca-tion selection.
Conflicts of Interest
The authors declare that there is no conflict of interestsregarding the publication of this paper.
References
[1] H. M. Kandirmaz, K. Kaba, and M. Avci, “Estimation ofmonthly sunshine duration in Turkey using artificial neuralnetworks,” International Journal of Photoenergy, vol. 2014,Article ID 680596, 9 pages, 2014.
[2] T. Khatib, A. Mohamed, K. Sopian, and M. Mahmoud,“Assessment of artificial neural networks for hourly solar radi-ation prediction,” International Journal of Photoenergy,vol. 2012, Article ID 946890, 7 pages, 2012.
[3] S. Daliento, A. Chouder, P. Guerriero et al., “Monitoring diag-nosis, and power forecasting for photovoltaic fields: a review,”International Journal of Photoenergy, vol. 2017, Article ID1356851, 13 pages, 2017.
[4] S. Kittisontirak, A. Bupi, P. Chinnavornrungsee, K. Sriprapha,P. Thajchayapong, and W. Titiroongruang, “An improved PVoutput forecasting model by using weight function: a casestudy in Cambodia,” International Journal of Photoenergy,vol. 2016, Article ID 2616750, 10 pages, 2016.
[5] Ö. Aydın, S. Öznehir, and E. Akçalı, “Optimal hospital loca-tion selection by analytical hierarchical process,” SuleymanDemirel University the Journal of Faculty Economics andAdministrative Sciences, vol. 14, no. 2, pp. 69–86, 2009.
[6] Y. Çınar, Çok Nitelikli Karar Verme ve Bankaların MaliPerformansının Değerlendirilmesi Örneği, [M.S. Thesis],Ankara Üniversitesi, Sosyal Bilimler Enstitüsü, 2004.
[7] A. Kengpol, P. Rontlaong, and M. Tuominen, “Design of adecision support system for site selection using fuzzy AHP: acase study of solar power plant in north eastern parts of Thai-land,” in 2012 Proceedings of PICMET '12: Technology Man-agement for Emerging Technologies, pp. 734–743, 2012.
[8] M. Uyan, “GIS-based solar farms site selection usinganalytic hierarchy process (AHP) in Karapinar region,Konya/Turkey,” Renewable and Sustainable Energy Reviews,vol. 28, pp. 11–17, 2013.
[9] A. Asakereh, M. Omid, R. Alimardani, and F. Sarmadian,“Developing a GIS-based fuzzy AHP model for selecting solarenergy sites in Shodirwan region in Iran,” International Jour-nal of Advanced Science and Technology, vol. 68, pp. 37–48,2014.
[10] S. A. H. ElQuoliti, “An analytic hierarchy process to evaluatecandidate locations for solar energy stations: Kingdom ofSaudi Arabia as a case study,” International Journal on PowerEngineering and Energy (IJPEE), vol. 6, no. 3, 2015.
[11] A. Sozen, A. Mirzapour, and M. T. Çakir, “Selection of the bestlocation for solar plants in Turkey,” Journal of Energy inSouthern Africa, vol. 26, no. 4, 2015.
[12] A. H. I. Lee, H. Kang, and Y. Liou, “A hybrid multiple-criteriadecision-making approach for photovoltaic solar plant loca-tion selection,” Sustainability, vol. 9, no. 2, p. 184, 2017.
[13] S. Sindhu, V. Nehra, and S. Luthra, “Investigation of feasibilitystudy of solar farms deployment using hybrid AHP-TOPSISanalysis: case study of India,” Renewable and SustainableEnergy Reviews, vol. 73, pp. 496–511, 2017.
[14] Directorate General of renewable energy, October 2016, http://www.eie.gov.tr/MyCalculator/Default.aspx.
[15] Energy institute, October 2016, http://enerjienstitusu.com/2016/03/21/teias-ges-res-trafo-merkezi-kapasiteleri-mart-2016/.
[16] D. Turney and V. Fthenakis, “Environmental impacts from theinstallation and operation of large-scale solar power plants,”
12 International Journal of Photoenergy

Renewable and Sustainable Energy Reviews, vol. 15, no. 6,pp. 3261–3270, 2011.
[17] M. Elibüyük and E. Yılmaz, “Altitude steps and slope groups ofTurkey in comparison with geographical regions and sub-regions,” Coğrafi Bilimler Dergisi, vol. 8, no. 1, pp. 27–55, 2010.
[18] T. L. Saaty, The Analytic Hierarchy Process, McGraw Hill, NewYork, 1980.
[19] G. Coyle, “The analytic hierarchy process (AHP),” PracticalStrategy, Open Access Material, AHP, 2014.
[20] F. Dweiri, S. Kumar, S. A. Khan, and V. Jain, “Designing anintegrated AHP based decision support system for supplierselection in automative industry,” Expert Systems with Appli-cations, vol. 62, pp. 273–283, 2016.
[21] F. Urfalıoğlu and T. Genç, “Comparison of the economic per-formance between Turkey and the European Union memberswith multi criteria decision making methods,” Marmara Uni-versity Journal of E.A.S, vol. 35, no. 2, pp. 329–360, 2013.
[22] İ. Ertuğrul and A. Özçil, “Air conditioner selection withTOPSIS and VIKOR methods in multi-criteria decisionmaking,” Çankırı Karatekin University, Journal of the Facultyof Economics and Administrative Sciences, vol. 4, no. 1,pp. 267–282, 2014.
[23] M. Kuo and G. Liang, “Combining VIKOR with GRAtechniques to evaluate service quality of airports under fuzzyenvironment,” Expert Systems with Applications, vol. 38,no. 3, pp. 1304–1312, 2011.
13International Journal of Photoenergy

Submit your manuscripts athttps://www.hindawi.com
Hindawi Publishing Corporationhttp://www.hindawi.com Volume 2014
Inorganic ChemistryInternational Journal of
Hindawi Publishing Corporation http://www.hindawi.com Volume 201
International Journal ofInternational Journal ofPhotoenergy
Hindawi Publishing Corporationhttp://www.hindawi.com Volume 2014
Carbohydrate Chemistry
International Journal ofInternational Journal of
Hindawi Publishing Corporationhttp://www.hindawi.com Volume 2014
Journal of
Chemistry
Hindawi Publishing Corporationhttp://www.hindawi.com Volume 2014
Advances in
Physical Chemistry
Hindawi Publishing Corporationhttp://www.hindawi.com
Analytical Methods in Chemistry
Journal of
Volume 2014
Bioinorganic Chemistry and ApplicationsHindawi Publishing Corporationhttp://www.hindawi.com Volume 2014
SpectroscopyInternational Journal of
Hindawi Publishing Corporationhttp://www.hindawi.com Volume 2014
The Scientific World JournalHindawi Publishing Corporation http://www.hindawi.com Volume 2014
Medicinal ChemistryInternational Journal of
Hindawi Publishing Corporationhttp://www.hindawi.com Volume 2014
Chromatography Research International
Hindawi Publishing Corporationhttp://www.hindawi.com Volume 2014
Applied ChemistryJournal of
Hindawi Publishing Corporationhttp://www.hindawi.com Volume 2014
Hindawi Publishing Corporationhttp://www.hindawi.com Volume 2014
Theoretical ChemistryJournal of
Hindawi Publishing Corporationhttp://www.hindawi.com Volume 2014
Journal of
Spectroscopy
Analytical ChemistryInternational Journal of
Hindawi Publishing Corporationhttp://www.hindawi.com Volume 2014
Journal of
Hindawi Publishing Corporationhttp://www.hindawi.com Volume 2014
Quantum Chemistry
Hindawi Publishing Corporationhttp://www.hindawi.com Volume 2014
Organic Chemistry International
ElectrochemistryInternational Journal of
Hindawi Publishing Corporation http://www.hindawi.com Volume 2014
Hindawi Publishing Corporationhttp://www.hindawi.com Volume 2014
CatalystsJournal of