optimal placement and sizing of a dg based on a new power stability index and line losses
TRANSCRIPT

Electrical Power and Energy Systems 43 (2012) 1296–1304
Contents lists available at SciVerse ScienceDirect
Electrical Power and Energy Systems
journal homepage: www.elsevier .com/locate / i jepes
Optimal placement and sizing of a DG based on a new power stability indexand line losses
M.M. Aman a,⇑, G.B. Jasmon a, H. Mokhlis a,b, A.H.A. Bakar a,b
a Department of Electrical Engineering, Faculty of Engineering, University of Malaya, 50603 Kuala Lumpur, Malaysiab UM Power Energy Dedicated Advanced Centre (UMPEDAC), Level 4, Wisma R&D UM, University of Malaya, 59990 Kuala Lumpur, Malaysia
a r t i c l e i n f o a b s t r a c t
Article history:Received 22 August 2011Received in revised form 18 December 2011Accepted 26 May 2012Available online 24 July 2012
Keywords:Distributed generationPlacementSizingPower stability indexVoltage stabilityRadial networks
0142-0615/$ - see front matter � 2012 Elsevier Ltd. Ahttp://dx.doi.org/10.1016/j.ijepes.2012.05.053
⇑ Corresponding author. Tel.: +60 3 7967 5348.E-mail addresses: [email protected]
(M.M. Aman), [email protected] (G.B. Jasmon), [email protected] (A.H.A. Bakar).
This paper proposes a new algorithm for Distributed Generator (DG) placement and sizing for distribu-tion systems based on a novel index. The index is developed considering stable node voltages referredas power stability index (PSI). A new analytical approach is adopted to visualize the impact of DG on sys-tem losses, voltage profile and voltage stability. The proposed algorithm is tested on 12-bus, modified 12-bus and 69-bus radial distribution networks. The test results are also compared and found to be in closeagreement with the existing Golden Section Search (GSS) algorithm.
� 2012 Elsevier Ltd. All rights reserved.
1. Introduction
With the Distributed Generation (DG), many power companiesare investing in small scale renewable energy resources such aswind, photo-voltaic cells, micro-turbines, small hydro turbines,CHP or hybrid. In England and Wales for example, DG was only1.2 GW during 1993–1994, however today this figure has in-creased substantially and reached up to over 12GW [1]. It is alsoexpected with the KYOTO protocol commitment by variouscountries to reduce CO2 emission, the market for DGs as a ‘‘CleanEnergy’’ resource is promising. According to Energy Network Asso-ciation (ENA) report [2], the UK government is targeting to achieve15% of electricity from renewable sources by 2015, implying rapidgrowth in DG and investment in the power infrastructure.
However there are several issues concerning the integration ofDGs with existing power system networks; that needs to be ad-dressed [3–5]. The integration of DG changes the system from pas-sive to active networks, which affects the reliability and operationof a power system network [4]. Furthermore, the non-optimalplacement of DG can result in an increase of the system lossesand thus making the voltage profile lower than the allowable limit[6]. Since utilities are already facing technical and non-technicalissues, they cannot tolerate such additional issues. Hence an
ll rights reserved.
y, [email protected]@um.edu.my (H. Mokhlis),
optimum placement of DG is needed in order to minimize overallsystem losses and therefore improve voltage profiles.
In the past, different methodologies have been developed todetermine the optimum location and optimum size of the DG. Thesemethodologies are either based on analytical tools or on optimiza-tion programming methods. Analytical approaches have been pro-posed by several authors. In [7], the authors presented analyticalapproach to determine the optimal location for the DG with anobjective of loss minimization for distribution and transmissionnetworks. In [8], the author used the loss sensitivity equation todetermine the optimum size of DG and the exact loss equation todetermine the optimum location of DG based on minimum losses.In [9], the author presented the loss sensitivity factor based onequivalent current injection using two Bus-Injection to Branch-Cur-rent (BIBC) and Branch-Current to Bus-Voltage (BCBV) matrix. Asimple search algorithm is proposed in [10] for optimal sizing andplacement of DG for a network system, based on losses and costfunction as an objective function. The method is simple but timeconsuming for searching both the best location and optimum size.In [11], the author considered the minimum loss and generationcost as a parameter in addition to DG power limits to determinethe optimal size and location of the DG. The author developedtwo programs named ‘‘Bloss’’ and ‘‘dpslack’’ for optimum sizing ofDG, considering DG min–max limits also. Later-on, site is decidedby considering the minimum total power losses considering DGon each bus. The method is accurate but very tedious and mathe-matical computation need much computation time. In [12] authorshave evaluated the effect of DG placement on network reliability,
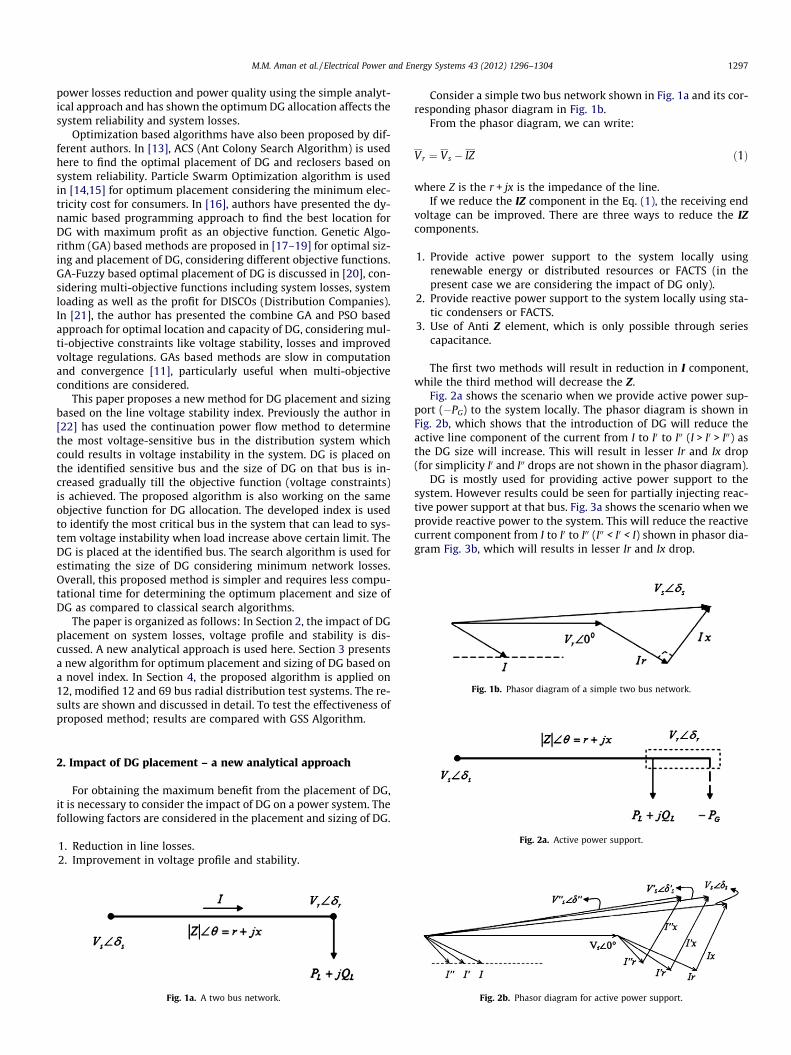
Fig. 1b. Phasor diagram of a simple two bus network.
M.M. Aman et al. / Electrical Power and Energy Systems 43 (2012) 1296–1304 1297
power losses reduction and power quality using the simple analyt-ical approach and has shown the optimum DG allocation affects thesystem reliability and system losses.
Optimization based algorithms have also been proposed by dif-ferent authors. In [13], ACS (Ant Colony Search Algorithm) is usedhere to find the optimal placement of DG and reclosers based onsystem reliability. Particle Swarm Optimization algorithm is usedin [14,15] for optimum placement considering the minimum elec-tricity cost for consumers. In [16], authors have presented the dy-namic based programming approach to find the best location forDG with maximum profit as an objective function. Genetic Algo-rithm (GA) based methods are proposed in [17–19] for optimal siz-ing and placement of DG, considering different objective functions.GA-Fuzzy based optimal placement of DG is discussed in [20], con-sidering multi-objective functions including system losses, systemloading as well as the profit for DISCOs (Distribution Companies).In [21], the author has presented the combine GA and PSO basedapproach for optimal location and capacity of DG, considering mul-ti-objective constraints like voltage stability, losses and improvedvoltage regulations. GAs based methods are slow in computationand convergence [11], particularly useful when multi-objectiveconditions are considered.
This paper proposes a new method for DG placement and sizingbased on the line voltage stability index. Previously the author in[22] has used the continuation power flow method to determinethe most voltage-sensitive bus in the distribution system whichcould results in voltage instability in the system. DG is placed onthe identified sensitive bus and the size of DG on that bus is in-creased gradually till the objective function (voltage constraints)is achieved. The proposed algorithm is also working on the sameobjective function for DG allocation. The developed index is usedto identify the most critical bus in the system that can lead to sys-tem voltage instability when load increase above certain limit. TheDG is placed at the identified bus. The search algorithm is used forestimating the size of DG considering minimum network losses.Overall, this proposed method is simpler and requires less compu-tational time for determining the optimum placement and size ofDG as compared to classical search algorithms.
The paper is organized as follows: In Section 2, the impact of DGplacement on system losses, voltage profile and stability is dis-cussed. A new analytical approach is used here. Section 3 presentsa new algorithm for optimum placement and sizing of DG based ona novel index. In Section 4, the proposed algorithm is applied on12, modified 12 and 69 bus radial distribution test systems. The re-sults are shown and discussed in detail. To test the effectiveness ofproposed method; results are compared with GSS Algorithm.
Fig. 2a. Active power support.
2. Impact of DG placement – a new analytical approach
For obtaining the maximum benefit from the placement of DG,it is necessary to consider the impact of DG on a power system. Thefollowing factors are considered in the placement and sizing of DG.
1. Reduction in line losses.2. Improvement in voltage profile and stability.
Fig. 1a. A two bus network.
Consider a simple two bus network shown in Fig. 1a and its cor-responding phasor diagram in Fig. 1b.
From the phasor diagram, we can write:
Vr ¼ Vs � IZ ð1Þ
where Z is the r + jx is the impedance of the line.If we reduce the IZ component in the Eq. (1), the receiving end
voltage can be improved. There are three ways to reduce the IZcomponents.
1. Provide active power support to the system locally usingrenewable energy or distributed resources or FACTS (in thepresent case we are considering the impact of DG only).
2. Provide reactive power support to the system locally using sta-tic condensers or FACTS.
3. Use of Anti Z element, which is only possible through seriescapacitance.
The first two methods will result in reduction in I component,while the third method will decrease the Z.
Fig. 2a shows the scenario when we provide active power sup-port (�PG) to the system locally. The phasor diagram is shown inFig. 2b, which shows that the introduction of DG will reduce theactive line component of the current from I to I0 to I00 (I > I0 > I00) asthe DG size will increase. This will result in lesser Ir and Ix drop(for simplicity I0 and I00 drops are not shown in the phasor diagram).
DG is mostly used for providing active power support to thesystem. However results could be seen for partially injecting reac-tive power support at that bus. Fig. 3a shows the scenario when weprovide reactive power to the system. This will reduce the reactivecurrent component from I to I0 to I00 (I00 < I0 < I) shown in phasor dia-gram Fig. 3b, which will results in lesser Ir and Ix drop.
Fig. 2b. Phasor diagram for active power support.
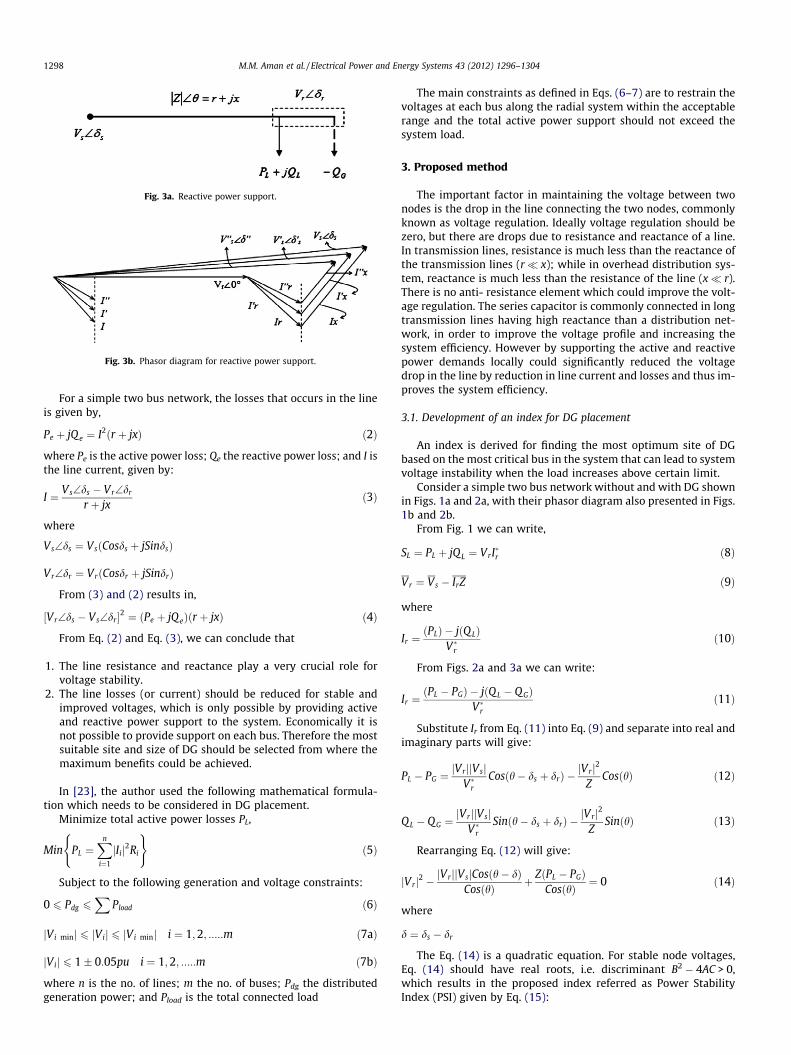
Fig. 3a. Reactive power support.
Fig. 3b. Phasor diagram for reactive power support.
1298 M.M. Aman et al. / Electrical Power and Energy Systems 43 (2012) 1296–1304
For a simple two bus network, the losses that occurs in the lineis given by,
Pe þ jQ e ¼ I2ðr þ jxÞ ð2Þ
where Pe is the active power loss; Qe the reactive power loss; and I isthe line current, given by:
I ¼ Vs\ds � Vr\dr
r þ jxð3Þ
where
Vs\ds ¼ VsðCosds þ jSindsÞ
Vr\dr ¼ VrðCosdr þ jSindrÞ
From (3) and (2) results in,
½Vr\ds � Vs\dr �2 ¼ ðPe þ jQ eÞðr þ jxÞ ð4Þ
From Eq. (2) and Eq. (3), we can conclude that
1. The line resistance and reactance play a very crucial role forvoltage stability.
2. The line losses (or current) should be reduced for stable andimproved voltages, which is only possible by providing activeand reactive power support to the system. Economically it isnot possible to provide support on each bus. Therefore the mostsuitable site and size of DG should be selected from where themaximum benefits could be achieved.
In [23], the author used the following mathematical formula-tion which needs to be considered in DG placement.
Minimize total active power losses PL,
Min PL ¼Xn
i¼1
jIij2Ri
( )ð5Þ
Subject to the following generation and voltage constraints:
0 6 Pdg 6X
Pload ð6Þ
jVi minj 6 jVij 6 jVi minj i ¼ 1;2; :::::m ð7aÞ
jVij 6 1� 0:05pu i ¼ 1;2; :::::m ð7bÞ
where n is the no. of lines; m the no. of buses; Pdg the distributedgeneration power; and Pload is the total connected load
The main constraints as defined in Eqs. (6–7) are to restrain thevoltages at each bus along the radial system within the acceptablerange and the total active power support should not exceed thesystem load.
3. Proposed method
The important factor in maintaining the voltage between twonodes is the drop in the line connecting the two nodes, commonlyknown as voltage regulation. Ideally voltage regulation should bezero, but there are drops due to resistance and reactance of a line.In transmission lines, resistance is much less than the reactance ofthe transmission lines (r� x); while in overhead distribution sys-tem, reactance is much less than the resistance of the line (x� r).There is no anti- resistance element which could improve the volt-age regulation. The series capacitor is commonly connected in longtransmission lines having high reactance than a distribution net-work, in order to improve the voltage profile and increasing thesystem efficiency. However by supporting the active and reactivepower demands locally could significantly reduced the voltagedrop in the line by reduction in line current and losses and thus im-proves the system efficiency.
3.1. Development of an index for DG placement
An index is derived for finding the most optimum site of DGbased on the most critical bus in the system that can lead to systemvoltage instability when the load increases above certain limit.
Consider a simple two bus network without and with DG shownin Figs. 1a and 2a, with their phasor diagram also presented in Figs.1b and 2b.
From Fig. 1 we can write,
SL ¼ PL þ jQL ¼ VrI�r ð8Þ
Vr ¼ Vs � IrZ ð9Þ
where
Ir ¼ðPLÞ � jðQ LÞ
V�rð10Þ
From Figs. 2a and 3a we can write:
Ir ¼ðPL � PGÞ � jðQ L � Q GÞ
V�rð11Þ
Substitute Ir from Eq. (11) into Eq. (9) and separate into real andimaginary parts will give:
PL � PG ¼jVr jjVsj
V�rCosðh� ds þ drÞ �
jVrj2
ZCosðhÞ ð12Þ
QL � QG ¼jVr jjVsj
V�rSinðh� ds þ drÞ �
jVrj2
ZSinðhÞ ð13Þ
Rearranging Eq. (12) will give:
jVrj2 �jVrjjVsjCosðh� dÞ
CosðhÞ þ ZðPL � PGÞCosðhÞ ¼ 0 ð14Þ
where
d ¼ ds � dr
The Eq. (14) is a quadratic equation. For stable node voltages,Eq. (14) should have real roots, i.e. discriminant B2 � 4AC > 0,which results in the proposed index referred as Power StabilityIndex (PSI) given by Eq. (15):
M.M. Aman et al. / Electrical Power and Energy Systems 43 (2012) 1296–1304 1299
PSI ¼ 4rijðPL � PGÞ½jVijCosðh� dÞ�2
6 1 ð15Þ
Under stable operation, this value should be less than unity;closer the value of PSI to zero, more stable will be the system.
The above index is used to find the optimum placement of DG.The PSI value is calculated for each line in the given networkand sorted from the highest to the lowest value. For the i - j linehaving the highest value of PSI, the DG should be placed at j-bus.For multi DG placement, the location of the second DG will bebased on the effect of first DG on PSI using Eq. (15). PSI valuefor each line will be re-calculated and sorted in the same fashionfrom highest to lowest. The DG will be placed at the end of theline having the highest value of PSI.
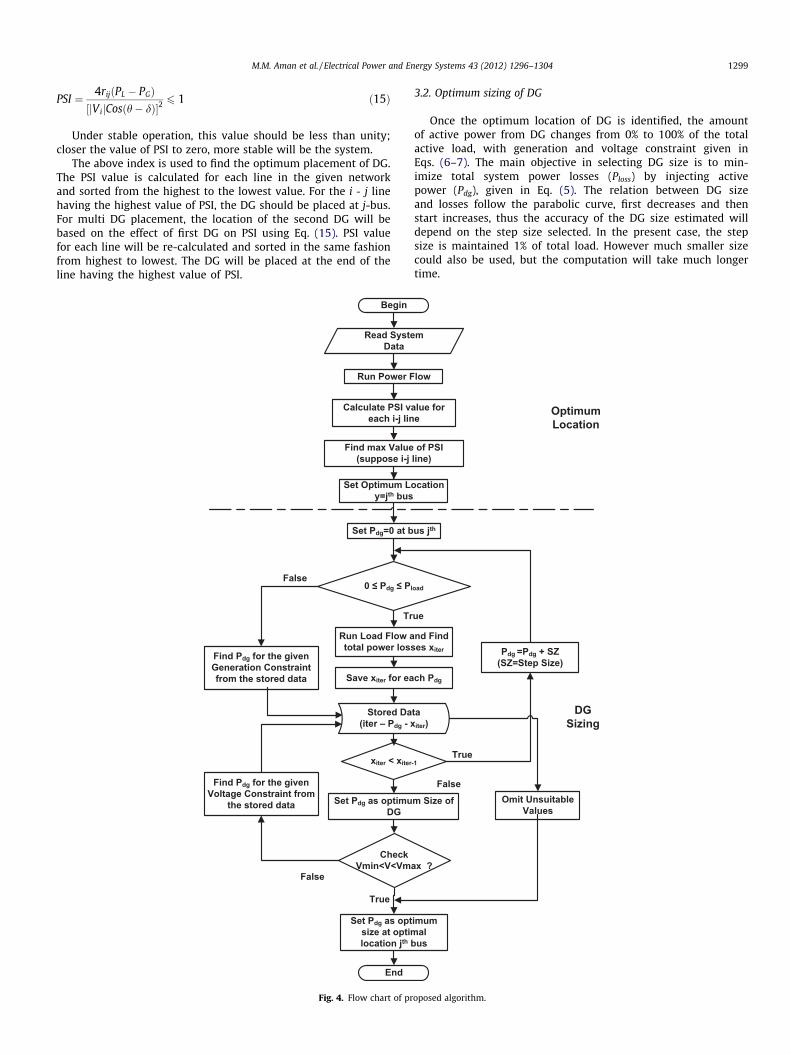
Fig. 4. Flow chart of pr
3.2. Optimum sizing of DG
Once the optimum location of DG is identified, the amountof active power from DG changes from 0% to 100% of the totalactive load, with generation and voltage constraint given inEqs. (6–7). The main objective in selecting DG size is to min-imize total system power losses (Ploss) by injecting activepower (Pdg), given in Eq. (5). The relation between DG sizeand losses follow the parabolic curve, first decreases and thenstart increases, thus the accuracy of the DG size estimated willdepend on the step size selected. In the present case, the stepsize is maintained 1% of total load. However much smaller sizecould also be used, but the computation will take much longertime.
oposed algorithm.
1300 M.M. Aman et al. / Electrical Power and Energy Systems 43 (2012) 1296–1304
3.3. Proposed algorithm
For a radial distribution network, load flow analysis is carriedout and PSI value is computed for each line using Eq. (15). Fori � j line having the highest value of PSI, the DG will be placed atjth bus. The search algorithm is used for finding the optimum sizeof DG at optimum location based on a minimum total power loss,with constraints given in Eqs. (6–7). The complete flow chart forDG allocation and sizing is represented in Fig. 4.
4. Simulations and results
In Section 3, the proposed algorithm for DG placement and siz-ing is presented. For verification, the proposed algorithm is appliedon 12-bus, modified 12-bus and 69-bus radial distribution net-works. A computer program has been written in MATLAB 7.12and run on Core 2 Duo 3.07 GHz processor. Shirmohammadi theo-rem [24] is used to carry out the load flow analysis. As conven-tional load flows are not suitable for radial distribution systemsbecause they got diverges, due to high X/R ratio which results insingularity of Jacobian matrix.
4.1. Test systems
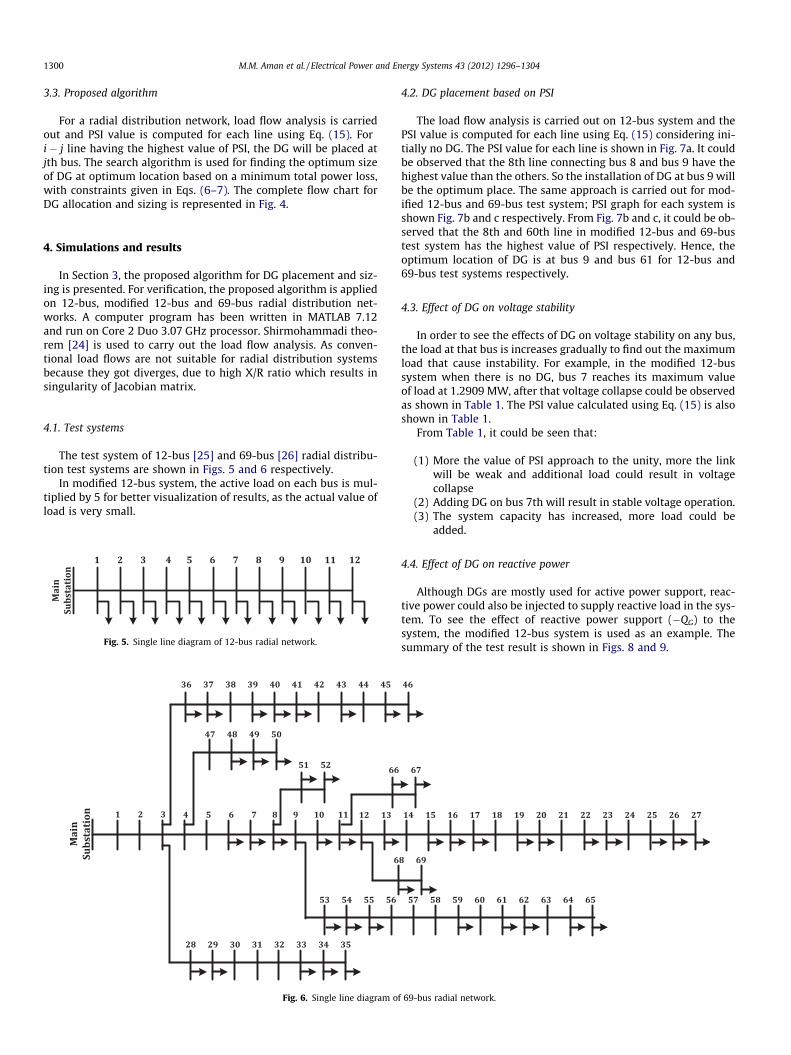
The test system of 12-bus [25] and 69-bus [26] radial distribu-tion test systems are shown in Figs. 5 and 6 respectively.
In modified 12-bus system, the active load on each bus is mul-tiplied by 5 for better visualization of results, as the actual value ofload is very small.
Fig. 5. Single line diagram of 12-bus radial network.
Fig. 6. Single line diagram o
4.2. DG placement based on PSI
The load flow analysis is carried out on 12-bus system and thePSI value is computed for each line using Eq. (15) considering ini-tially no DG. The PSI value for each line is shown in Fig. 7a. It couldbe observed that the 8th line connecting bus 8 and bus 9 have thehighest value than the others. So the installation of DG at bus 9 willbe the optimum place. The same approach is carried out for mod-ified 12-bus and 69-bus test system; PSI graph for each system isshown Fig. 7b and c respectively. From Fig. 7b and c, it could be ob-served that the 8th and 60th line in modified 12-bus and 69-bustest system has the highest value of PSI respectively. Hence, theoptimum location of DG is at bus 9 and bus 61 for 12-bus and69-bus test systems respectively.
4.3. Effect of DG on voltage stability
In order to see the effects of DG on voltage stability on any bus,the load at that bus is increases gradually to find out the maximumload that cause instability. For example, in the modified 12-bussystem when there is no DG, bus 7 reaches its maximum valueof load at 1.2909 MW, after that voltage collapse could be observedas shown in Table 1. The PSI value calculated using Eq. (15) is alsoshown in Table 1.
From Table 1, it could be seen that:
(1) More the value of PSI approach to the unity, more the linkwill be weak and additional load could result in voltagecollapse
(2) Adding DG on bus 7th will result in stable voltage operation.(3) The system capacity has increased, more load could be
added.
4.4. Effect of DG on reactive power
Although DGs are mostly used for active power support, reac-tive power could also be injected to supply reactive load in the sys-tem. To see the effect of reactive power support (�QG) to thesystem, the modified 12-bus system is used as an example. Thesummary of the test result is shown in Figs. 8 and 9.
f 69-bus radial network.
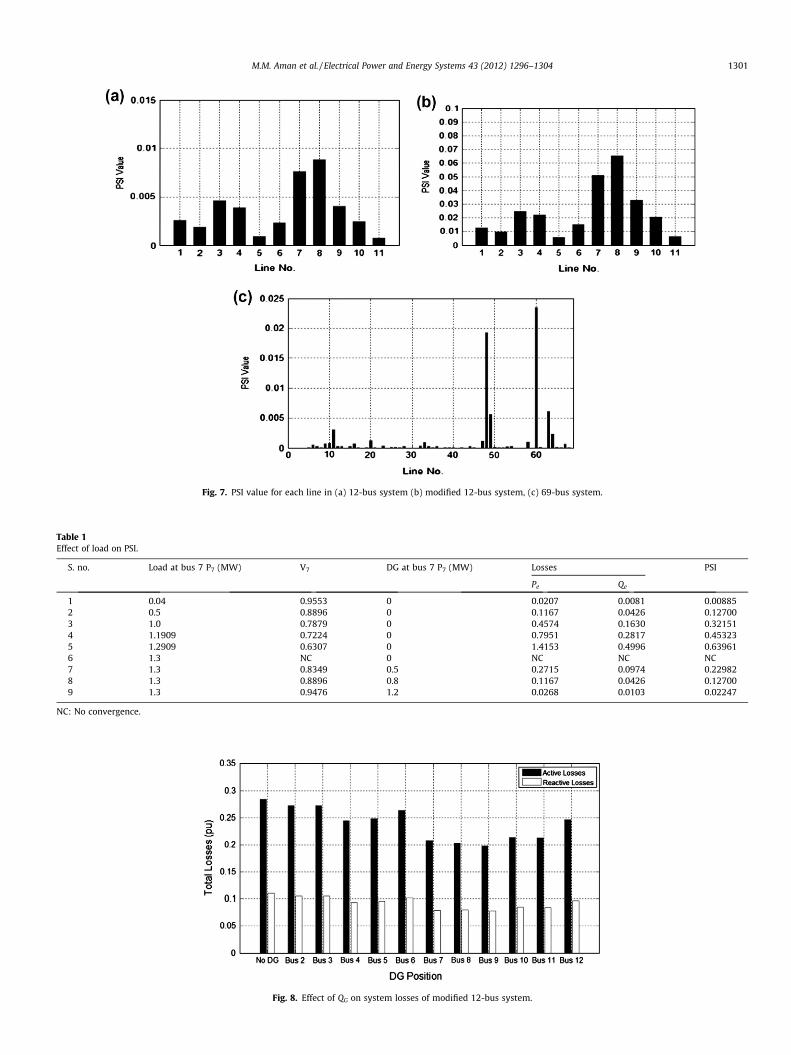
Fig. 7. PSI value for each line in (a) 12-bus system (b) modified 12-bus system, (c) 69-bus system.
Table 1Effect of load on PSI.
S. no. Load at bus 7 P7 (MW) V7 DG at bus 7 P7 (MW) Losses PSI
Pe Qe
1 0.04 0.9553 0 0.0207 0.0081 0.008852 0.5 0.8896 0 0.1167 0.0426 0.127003 1.0 0.7879 0 0.4574 0.1630 0.321514 1.1909 0.7224 0 0.7951 0.2817 0.453235 1.2909 0.6307 0 1.4153 0.4996 0.639616 1.3 NC 0 NC NC NC7 1.3 0.8349 0.5 0.2715 0.0974 0.229828 1.3 0.8896 0.8 0.1167 0.0426 0.127009 1.3 0.9476 1.2 0.0268 0.0103 0.02247
NC: No convergence.
Fig. 8. Effect of QG on system losses of modified 12-bus system.
M.M. Aman et al. / Electrical Power and Energy Systems 43 (2012) 1296–1304 1301

Fig. 9. Effect of QG on system voltage profile of modified 12-bus system.
1302 M.M. Aman et al. / Electrical Power and Energy Systems 43 (2012) 1296–1304
Fig. 8 shows the results when a reactive power equal to thereactive load on each bus is injected by the DG. It could be seenthe active and reactive power losses have reduced as comparedto without reactive power support on ith bus.
Fig. 9 shows the effect of reactive power support on systemvoltage profile. When a reactive power is supplied on bus 9 fromthe DG, the overall voltage profile has improved.
Fig. 11. Effect of DG on system voltage profile of modified 12-bus system, (a) 12 busnetwork (DG size = 0.2349 MW @ Bus 9th). (b) Modified 12 bus network (DGsize = 1.2 MW @ Bus 9th). (c) 69 bus network (DG size = 1.8631 MW @ Bus 61th).
4.5. Optimum DG size
To determine the optimum size of DG, the proposed algorithmis applied on all test systems and the results are tabulated in Table2. The proposed algorithm is also compared with the GSS Algo-rithm, implemented using VS&OP power tool [27]. The results are
Table 2Application of proposed algorithm on radial distribution networks.
Bus system Proposed Algorithm
Max PSI values Bus no. Optimum size (MW)
12 0.008845 9th 0.2349Modified 12 Bus 0.065252 9th 1.200069 0.023466 61th 1.8631
Fig. 10. System losses profile of modified 12-bu
shown in Table 2, from where it could be seen the close agreementof the propose method with the existing one.
From Table 2, it could be observed that:
� The proposed method results are in close agreement with GSSalgorithm� The computation time has been decreased considerably for
three test systems (53.6%, 52.39%, 58.45% respectively withthe 12-bus, modified 12-bus and 69-bus).
Golden Section Search algorithm
CPU time (s) Bus no. Optimum size (MW) CPU time (s)
0.414 9th 0.23545 0.8920.427 9th 1.19119 0.897
11.085 61th 1.87270 26.681
s with optimum DG size = 1.2 MW at bus-9.

M.M. Aman et al. / Electrical Power and Energy Systems 43 (2012) 1296–1304 1303
The DG size vs. loss-curves follow a parabolic curve, first de-creases and then increases. Thus the size of DG should be carefullyselected, above optimum size of DG the system losses increaseswhich results in poor efficiency and voltage regulation.
(a) 12 bus Network (DG Size = 0.2349 MW @ Bus 9th)
(b) Modified 12 bus Network (DG Size = 1.2 MW @ Bus 9th)
(c) 69 Bus Network (DG Size = 1.8631 MW @ Bus 61th)
Fig. 12. PV characteristics curve with and without DG.
4.6. Effect of DG on system losses and voltage profile
In Section 2, we have seen the impact of DG on system losses basedon analytical analysis. To verify the derived analytical equations, theeffect of DG on modified 12-bus system studied by injecting optimumactive power of 1.2 MW on each bus. The total active and reactivelosses occurring due to different DG location is shown in Fig. 10. Itcan be observed that the most suitable location of DG in terms oflosses is at bus 9, which is in agreement with the result in Fig. 10.
In Section 2, it has also been shown that the reduction in activeand reactive losses improve the voltage profile. From Fig. 11, thiscould be visualized whereby the optimum placement of DG at9th bus has improved the overall voltage profile.
4.7. Overall findings
From the analysis of the simulation results presented in Section 4,we can conclude the following due to DG placement.
1. The voltage profile has improved and the system voltage stabil-ity has increased.
2. Line losses have reduced.3. The overall system capacity has increased.
The third statement is better presented in Fig. 12 by connectingthe most optimum DG size found out in Table 2 to the most opti-mum location of each system and the nose curve (PV curve) isplotted.
Fig. 12 demonstrates that the system capacity has increased dueto the installation of DG at the best location and of optimum size.
5. Conclusion
In this paper, a new analytical approach is presented on the im-pact of DG in power system. A new algorithm is also proposed forDG location and sizing. The DG allocation and sizing is based on anovel Power Stability Index (PSI) index to determine the most volt-age sensitive bus and minimum total power losses. Using the pro-posed algorithm optimum DG allocation and correct sizing resultsin an improved voltage profile and minimizes the burden of systemlosses.
The proposed algorithm has also been tested using three differ-ent radial distribution test systems and the results are verifiedusing GSS Algorithm. It has been found that overall the proposedalgorithm takes less computation time by 50–60% as comparedto Golden Section Search (GSS) algorithm.
Acknowledgments
This work was supported by the Bright Spark Programme(University of Malaya-Malaysia), HIR/MOHE research grant - GrantCode: D000004-16001 (Ministry of Higher Education – Malaysia)and Post Graduate Research Funding by the Institute of ResearchManagement and Monitoring (IPPP - University of Malaya -Malaysia).
References
[1] Jenkins N, Ekanayake J, Strbac G. Distributed generation – IET Factfiles; 2010.<http://www.theiet.org/factfiles/energy/distributed-generation.cfm>[accessed 10.08.11].
[2] Energy Networks Association (UK). <http://2010.energynetworks.org/distributed-generation> [accessed 10.08.11].
[3] Koeppel. G. Distributed generation-literature review and outline of the Swissstation: Internal Report, ETH Zurich; November 2003.
[4] Hadjsaid N, Canard JF, Dumas F. Dispersed generation impact on distributionnetworks. IEEE Comput Appl Power 1999;12:22–8.

1304 M.M. Aman et al. / Electrical Power and Energy Systems 43 (2012) 1296–1304
[5] Tuitemwong K, Premrudeepreechacharn S. Expert system for protectioncoordination of distribution system with distributed generators. Int J ElectrPower 2011;33:466–71.
[6] Griffin T, Tomosovic K, Secrest D, Law A. Placement of dispersed generationssystems for reduced losses. In: 33rd International conference on sciences.Hawaii; 2000.
[7] Caisheng W, Nehrir MH. Analytical approaches for optimal placement ofdistributed generation sources in power systems. IEEE Trans Power Syst2004;19(4):2068–76.
[8] Acharya N, Mahat P, Mithulananthan N. An analytical approach for DGallocation in primary distribution network. Int J Electr Power.2006;28(10):669–78.
[9] Gözel T, Hocaoglu MH. An analytical method for the sizing and siting ofdistributed generators in radial systems. Electr Power Syst Res2009;79(6):912–8.
[10] Ghosh S, Ghoshal SP, Ghosh SA. Optimal sizing and placement of distributedgeneration in a network system. Int J Electr Power 2010;32(8):849–56.
[11] Kamel RM, Kermanshahi B. Optimal size and location of distributedgenerations for minimizing power losses in a primary distribution network.Scientia Iranica, Comput Sci Eng Electr Eng Trans D 2009;16(6):137–44.
[12] Hamedi H, Gandomkar M. A straightforward approach to minimizingunsupplied energy and power loss through DG placement and evaluatingpower quality in relation to load variations over time. Int J Elec Power2012;35:93–6.
[13] Lingfeng W, Singh C. Reliability-constrained optimum placement of reclosersand distributed generators in distribution networks using an ant colonysystem algorithm. IEEE Trans Syst, Man Cyber, Part C: Appl Rev2008;38:757–64.
[14] Kuersuk W, Ongsakul W. Optimal placement of distributed generation usingparticle swarm optimization. In: Australian universities power engineeringconference (AUPEC’ 06); 2006.
[15] Moshtagh J, Jalali A, Karimizadeh K. Optimum placement and sizing of DGusing binary PSO algorithm to achieve the minimum electricity cost forconsumers. Int Rev Electr Eng-I 2010;5(6):2873–81.
[16] Khalesi N, Rezaei N, Haghifam MR. DG allocation with application of dynamicprogramming for loss reduction and reliability improvement. Int J Electr Power2011;33:288–95.
[17] Borges CLT, Falcão DM. Optimal distributed generation allocation forreliability, losses, and voltage improvement. Int J Electr Power2006;28(6):413–20.
[18] Abou El-Ela AA, Allam SM, Shatla MM. Maximal optimal benefits of distributedgeneration using genetic algorithms. Electr Power Syst Res 2010;80:869–77.
[19] Kim K-H, Lee Y-J, Rhee S-B, Lee S-K, You S-K. Dispersed generator placementusing fuzzy-GA in distribution systems. In: Proceeding of IEEE powerengineering society summer meeting. Chicago; July 2002. p. 1148–53.
[20] Akorede MF, Hizam H, Aris I, Ab Kadir MZA. Effective method for optimalallocation of distributed generation units in meshed electric power systems.IET Gene Trans Dist 2011;5(2):276–87.
[21] Moradi MH, Abedini M. A combination of genetic algorithm and particleswarm optimization for optimal DG location and sizing in distributionsystems. Int J Electr Power Energy Syst 2012;34:66–74.
[22] Hedayati H, Nabaviniaki SA, Akbarimajd A. A method for placement of DGunits in distribution networks. IEEE Trans Power Deliver 2008;23(3):; 1620–8.
[23] Lalitha MP, Reddy VCV, Usha V. Optimal DG placement for minimum realpower loss in radial distribution systems using PSO. J Theor Appl InformTechnol 2010;13:107–16.
[24] Shirmohammadi D, Hong HW, Semlyen A, Luo GX. A compensation-basedpower flow method for weakly meshed distribution and transmissionnetworks. IEEE Trans Power Syst 1988;3(2):753–62.
[25] Das D, Nagi HS, Kothari DP. Novel method for solving radial distributionnetworks. IEE Proc – Gene Trans Distrib 1994;141(4):291–8.
[26] Baran ME, Wu FF. Optimum sizing of capacitor placed on radial distributionsystems. IEEE Trans PWRD 1989;4:735–43.
[27] Gözel T, Eminoglu U, Hocaoglu MH. A tool for voltage stability andoptimization (VS&OP) in radial distribution systems using matlab graphicaluser interface (GUI). Simul Model Pract Theory 2008;16(5):505–18.