optimal option portfolio strategies: deepening the puzzle ...docentes.fe.unl.pt/~psc/oops.pdf ·...
TRANSCRIPT
Optimal Option Portfolio Strategies:
Deepening the Puzzle of Index Option Mispricing
Jose Afonso Faias and Pedro Santa-Clara∗
∗Faias, [email protected], UCP - Catolica Lisbon School of Business & Economics, Palma de Cima,
1649-023 Lisboa, Portugal; Santa-Clara, [email protected], Millennium Chair in Finance. Nova
School of Business and Economics, NBER, and CEPR, Campus de Campolide, 1099-032 Lisboa,
Portugal. We thank the editor Hendrik Bessembinder and an anonymous referee for valuable
comments which significantly improved the paper. We also thank Rui Albuquerque, Pierre Collin-
Dufresne, Joost Driessen, Miguel Ferreira, Mark Grinblatt, Jose Correia Guedes, Christopher Jones,
Angel Leon, Andre Lucas, Pedro Matos, David Moreno, Andreas Rathgeber, Enrique Sentana, Ivan
Shaliastovich, and participants at Nova School of Business and Economics, the QED 2010 Meeting
at Alicante, Catolica Lisbon School of Business and Economics, the 6th PFN Conference, the
Finance & Economics 2010 Conference, the XVIII Foro de Finanzas, the 2011 AFA Annual Meeting,
the 5th Conference on Professional Asset Management, the Oxford–Man Institute at Quantitative
Finance, the 2011 EFMA Annual Meeting, the EcoMod2011, the Conference in honor of Richard
Roll and Eduardo Schwartz, the Swissquote Conference 2011, the Sixth Annual Conference on
Advances in the Analysis of Hedge Fund Strategies, the Boston University, and the Research in
Options Conference for helpful comments and discussions. This research was funded by grant
PTDC/EGE-ECO/119683/2010 of the Portuguese Foundation for Science and Technology-FCT.

Abstract
Traditional methods of asset allocation (such as mean-variance optimization) are not ade-
quate for option portfolios because the distribution of returns is non-normal and the short
sample of option returns available makes it difficult to estimate their distribution. We pro-
pose a method to optimize a portfolio of European options, held to maturity, with a myopic
objective function that overcomes these limitations. In an out-of-sample exercise, incorpo-
rating realistic transaction costs, the portfolio strategy delivers a Sharpe ratio of 0.82 with
positive skewness. This performance is mostly obtained by exploiting mispricing between
options and not by loading on jump or volatility risk premia.

I Introduction
Although options are well known to help span states of nature (Ross (1976)) and to
provide exposure to (priced) risk factors like stochastic volatility and jumps,1 they are seldom
used in investment portfolios.2 Part of the problem is that the portfolio optimization methods
available, like the Markowitz mean-variance model, are ill suited to handle options.
There are three main problems in option portfolio optimization. First, the distribution
of option returns departs significantly from normality and therefore cannot be described
by means and (co)variances alone. Second, the short history of option returns available
severely limits the precision of the estimation of their complex joint distribution thereby
adding considerable estimation error to the portfolio.3 For example, we have only data for
Standard & Poor’s 500 options since 1996, which is not long enough to estimate reliably the
moments of their joint return distribution. Third, there are high transaction costs in this
market. On average, at-the-money (ATM) options have a 5% relative bid-ask spread, while
out-of-the-money (OTM) options have relative bid-ask spreads of 10%. Taking these costs
into account is thus critical but unfortunately hard to do within the traditional optimization
approach.
We offer a simple portfolio optimization method – optimal option portfolio strategies
(OOPS) – that solves these problems. Instead of a mean-variance objective, we maximize
1See Bates (1996), Bakshi, Cao, and Chen (1997), Andersen, Benzoni, and Lund (2002), and Liu and
Pan (2003), among others.
2Mutual funds’ use of derivatives is limited (Koski and Pontiff (1999), Deli and Varma (2002), Almazan,
Brown, Carlson and Chapman (2004)). Mutual funds generally face legal constraints in terms of short-
selling, borrowing and derivatives usage. This does not happen with hedge funds, which do use derivatives,
but these represent only a small part of their holdings (Chen (2011), Aragon and Martin (2012)).
3This is especially problematic since the optimization process tends to amplify this estimation noise
(Michaud and Michaud (2008)).
1

an expected utility function, such as power utility, which takes into account all the moments
of the portfolio return distribution, penalizing negative skewness and high kurtosis. We deal
with the limited sample of option returns by relying only on historical data for the underlying
asset. The only option data needed to simulate option returns are their current prices, as the
payoff is fully determined by the simulations of the underlying asset. We simulate returns
of the underlying asset going forward and, given the definition of option payoffs, simulate
corresponding option returns. We use simple bootstrap methods fitted to index data since
1950. Plugging the simulated returns of the option portfolio into the utility function and
averaging across simulations gives us an approximation of the expected utility that can be
maximized to obtain optimal portfolio weights.4 This metholodogy is similar in spirit to
Brandt, Santa-Clara, and Valkanov (2009).
We apply our method to a portfolio allocation problem between a risk-free asset and
four European options on the S&P 500 index with one-month to maturity: a ATM call, a
ATM put, a 5% OTM call, and a 5% OTM put option.5 These are liquid options that can
be combined to generate a variety of final payoffs. We study optimal option strategies in a
realistic setting with transaction costs. To incorporate transaction costs, we follow Eraker
(2013) and Plyakha and Vilkov (2008). For each option, we define two securities: a “long
option” initiated at the ask quote and a “short option” initiated at the bid quote. The
“short options” enter the optimization process with negative signal. Finally, we impose no
4Hedging demands and long-term horizons might potentially be important. However, Tan (2013) finds
that the benefit of adding options is quite small for long-horizon constant relative risk aversion (CRRA)
investors and Liu and Pan (2003) and Driessen and Maenhout (2007) show that improvements by including
derivatives are driven mostly by a myopic component. Our results show low predictability of returns of the
optimal strategy and little correlation with the stock market. These two features imply that there would be
no hedging demand and thus little loss from our myopic approach.
5The method is usable with American options if we are willing to ignore the impact of early exercise. It
is an empirical question whether the method remains useful.
2

short-selling so that only one of the two, long or short positions, is ever taken.
We study the performance of the OOPS in an out-of-sample exercise using a conservative
CRRA utility function. Between January 1996 and August 2013, the OOPS yields an annu-
alized certainty equivalent of 9.94% and an annualized Sharpe ratio of 0.82. This compares
well with the stock market in the same period which had a certainty equivalent of −1.31%
and a Sharpe ratio of 0.29. Surprisingly, OOPS returns present positive skewness and rel-
atively low excess kurtosis which compare favorably to simply shorting individual options.
We find that our strategy loads significantly on all four options and that the optimal weights
vary over time. OOPS is almost delta-neutral and has a low beta of 0.03 on average. This
is interesting as we expected a greater exposure to the stock market given that the return
distribution on which the portfolio choice is based is calibrated to data since 1950 in which
the equity Sharpe ratio was quite large at around 0.48.
Besides loading on the equity premium, there could be two reasons for an investor to buy
or sell options: to obtain exposure to risk premia for volatility and jump risk or to exploit
option mispricing. Broadie, Chernov, and Johannes (2009) argue that there is little evidence
of mispricing of options relative to the underlying stock index. However, we show that the
OOPS returns are little exposed to the market, volatility and jump risk factors identified in
the literature as having significant premia implying that the main source of returns come
from exploiting mispricings of options relative to each other.
A related literature investigates the returns of simple option trading strategies. Coval
and Shumway (2001) show that short positions in crash-protected, delta-neutral straddles
present Sharpe ratios of around one.6 Driessen and Maenhout (2013) confirm these results for
short-term options in U.S. and U.K. markets. Coval and Shumway (2001) and Bondarenko
(2003) also find that selling naked puts offers high returns even after taking into account
their considerable risk. In contrast to OOPS, all these strategies have negative skewness
6The sample period of their study is different from ours making the comparison of Sharpe ratios impos-
sible.
3

and high kurtosis implying a lower (negative in many cases) certainty equivalent than ours.
We find that our portfolio departs significantly from exploiting these simple strategies. For
instance, there are several periods in which the OOPS is net long in options.
There are a few papers that also address optimal portfolio allocation with options. Liu
and Pan (2003) model stochastic volatility and jump processes and derive the optimal port-
folio policy of a CRRA investor across one stock, a 5% OTM put option, and cash. Although
they obtain an analytic solution for the optimal option allocation, they need to specify a
particular parametric process for the stock dynamics and estimate its parameters. They try
different parameter sets and obtain ambiguous conclusions in terms of optimal put weights.
Most importantly, their approach cannot be extended to multiple options. In contrast, we
can use any model (parametric or not) for the distribution of returns of the underlying asset.
Our work is empirical in nature and we impose no restrictions on the number of options that
could be used in the optimization problem.
Driessen and Maenhout (2007) maximize the average utility of realized returns for a
portfolio of a stock, a simple option strategy, and cash. As the option strategy, they consider
either a 4% OTM put, a ATM straddle, or corresponding crash-neutral strategies. They
conclude that positive put holdings are never optimal given historic option returns. We find,
in contrast, that optimal option weights are time-varying and change signs during our sample
period.
Jones (2006) studies optimal portfolios to exploit the apparent put mispricing. He uses a
general nonlinear latent factor model and maximizes a constrained mean-variance objective.
He circumvents the short history of data by using daily option returns. However, his model
is quite complex, with 57 parameters to estimate even when only one factor is considered.
This limits the practical usefulness of this approach.
Constantinides, Jackwerth, and Savov (2013) study portfolios made up of either calls
or puts with a targeted moneyness. Although they find high Sharpe ratios, mostly for put
strategies, these strategies yield negative skewness and high kurtosis implying a lower (or
4

even negative) certainty equivalent than the OOPS.
Malamud (2014) studies dynamic portfolio selection with out-of-the-money options. His
approach, based on option greeks, allows him to combine several options to obtain high
Shape ratios albeit with substantial kurtosis. His approach induces large turnover which
leads to very high transaction costs.
The paper is organized as follows. Section II explains the methodology. Section III
describes the data used. Section IV presents the results. Finally, we present some concluding
remarks.
II Portfolio Allocation
A Methodology
Let time be represented by the subscript t and simulations indexed by n. Our portfolio
allocation is implemented for one risk-free asset and a series of call and put options with
one period to maturity. We consider call options indexed by c and put options indexed by
p. We include only assets that are not redundant by put-call parity.7 At time t, the value
of the underlying asset is denoted by St and each option i has an exercise price of Kt,i. The
risk-free interest rate from time t to t+1, known at time t, is denoted by rft. For each date t,
weights are obtained through maximization of the investor’s expected utility of end-of-period
wealth, which is a function of simulated portfolio returns. The latter are derived from option
returns, which in turn depend on the underlying asset returns. The steps below describe the
OOPS algorithm in detail. Appendix A shows a simple illustration.
1. We simulate N log-returns rnt+1, n = 1, ..., N of the underlying asset. The simulation is
performed under the empirical density not the risk-adjusted measure.
2. The returns from step 1 are used to simulate the next period’s underlying asset value,
7Although put-call parity does not hold because of transactions costs, incorporating the stock market is
still redundant because its payoff is strickly dominated by the other assets’ payoffs.
5

given its current value:
(1) Snt+1|t = St exp(rnt+1)
where n = 1, ..., N , and Snt+1|t denotes the simulated underlying asset value in period
t + 1 conditional on information up to time t, and St denotes the current underlying
asset value, which is observed.
3. Using the known strike prices for call options, Kt,c, and put options, Kt,p, and one-
period simulated underlying asset values St+1|t from Equation (1), we simulate option
payoffs at their maturity t+ 1:
Cnt+1|t,c = max(Snt+1|t −Kt,c, 0) and P n
t+1|t,p = max(Kt,p − Snt+1|t, 0)(2)
where n = 1, ..., N . Using the simulated payoffs in Equation (2) and observed current
option prices Ct,c and Pt,p, option returns are computed by:
rnt+1|t,c =Cnt+1|t,c
Ct,c− 1 and rnt+1|t,p =
P nt+1|t,p
Pt,p− 1(3)
where n = 1, ..., N .
4. We construct simulated portfolio returns in the usual way:
(4) rpnt+1|t = rft +C∑c=1
ωt,c(rnt+1|t,c − rft) +
P∑p=1
ωt,p(rnt+1|t,p − rft)
where ωt,c and ωt,p denote the call and put option weights and n = 1, ..., N . Each
simulated portfolio return is a weighted average of the asset returns and only the
risk-free rate is not simulated.
5. We choose weights by maximizing expected utility over simulated portfolio returns
(5) maxω
E[U(Wt[1 + rpt+1|t]
)]≈ max
ω
1
N
N∑n=1
U(Wt[1 + rpnt+1|t]
).
6

The output is given by ωt,c and ωt,p.
6. One-period out-of-sample performance is evaluated with realized option returns.
We determine the option realized payoffs:
Ct+1,c = max(St+1 −Kt,c, 0) and Pt+1,p = max(Kt,p − St+1, 0)(6)
We find the corresponding returns:
rt+1,c =Ct+1,c
Ct,c− 1 and rt+1,p =
Pt+1,p
Pt,p− 1(7)
Finally, we determine the one-period out-of-sample portfolio return:
(8) rpt+1 = rft +C∑c=1
ωt,c(rt+1,c − rft) +P∑p=1
ωt,p(rt+1,p − rft)
using the weights determined ex ante in step 5 above.
Our approach essentially compares the current price of an option to the expected payoff
and risk of the option that follows from the assumed probability distribution of the underlying
asset implicit in the simulation. If the option appears cheap relative to the expected payoff
and risk profile, the investor buys it. The investor sells the option if its current price is too
high relative to the expectation and risk profile of the simulated payoff at maturity.
B Return simulation
Our method requires the simulation of the distribution of the underlying stock market
returns. It is known that the distribution of raw stock market returns is left skewed, lep-
tokurtic, and presents ARCH effects which can be verified in Table 1. We study historic
standardized returns, sr, as the ratio between raw returns, rr, and their standard deviation,
sdev, as:
(9) srnt+1 =rrnt+1
sdevt+1
, n = 1, ..., N
From Table 1, we confirm that this series is closer to a normal distribution, although still
left-skewed, and no significant ARCH effects are present.
7
Each month after 1995, based on an expanding sample of historical standardized returns
starting in 1950, we simulate different paths for standardized returns. Following Efron
and Tibshirani (1993), we resample directly from the standardized empirical distribution
(bootstrap). This is appropriate since standardized returns are approximately i.i.d. This
approach has the same moments as the historical distribution by construction.
The final step is to scale up or down simulated returns by the current realized volatility:
(10) rnt+1 = srnt+1 × rvt, n = 1, ..., N
The current realized volatility is calculated from the last d trading days and scaled by 21
days ( the average number of trading days in a month) to get monthly units. We consider
alternatives values of d to be 1, 5, 10, 20, 30, and 60 days. In each month, we only use
the realized volatility length that maximizes the expected utility in sample.8 This simple
approach to incorporate time-varying volatility is close in spirit to the filtered historical
simulation of Barone-Adesi, Giannopolos, and Vosper (1999) in which volatility is estimated
by a parametric method such as a generalized autoregressive conditional heteroscedastic
(GARCH) model instead of using past realized volatility as we do. Hull and White (1998),
Diebold, Schuermann, and Stroughair (1998) and Barone-Adesi, Engle, and Mancini (2008)
also build on the same idea. Of course this model is simplistic and we ignore all the great
work on GARCH, implied volatility, MIDAS, and time-varying crashes. Our point is to show
that our method works well even in a simple setting such as this one.
C Maximizing expected utility
In the fourth step, the investor maximizes the conditional expected utility of next period’s
wealth:
8We also consider other finer grids and a range-based integrated volatility estimator. The results lead to
the same economic conclusions.
8

(11) maxωt,i∈R
E[U(Wt+1)]
subject to the usual budget constraint Wt+1 = Wt (1 + rpt+1). Maximizing expected utility
takes into account all the moments of the return distribution. If returns are normal, investors
care only about the mean and variance of portfolio returns. In practice, normality does not
hold, especially for option returns. Investors thus care also about tail risk (extreme events)
and asymmetry, so mean and variance do not provide enough information to make asset
allocation choices.
We use the power utility function (see Brandt (1999)). This utility function presents
constant relative risk aversion (CRRA) and is given by:
(12) U(W ) =
1
1−γW1−γ, if γ 6= 1
ln(W ), if γ = 1
where γ is the coefficient of relative risk aversion.
This utility function is attractive for two reasons. First, because of the homotheticity
property, portfolio weights are independent of the initial level of wealth. So maximizing
E[U(Wt+1)] is the same as maximizing E[U (1 + rpt)]. Second, investors care about all mo-
ments of the distribution and this particular utility function penalizes negative skewness and
high kurtosis.9
Bliss and Panigirtzoglou (2004) estimate an empirical risk aversion of 4 for S&P 500 index
option data. Even though, we set the constant relative risk aversion parameter γ equal to
10 in the optimization for a conservative asset allocation choice.10 Intuitively, we optimize
9We use the routine FMINCON with the active-set algorithm in Matlab. The results are robust to
different initial values.
10We run OOPS for different values of risk aversion coefficient such as 7 and 13 and the performance is
similar.
9

as if the risk aversion coefficient was higher than it truly is in reality to minimize in-sample
overfitting. We can think of this as akin to shrinking portfolio weights which is often done
in practice.11 Finally, note that we can use any other objective function in applying our
methodology.12
D Transaction costs
There is a large body of literature that documents high transaction costs in the option
market that are in part responsible for pricing anomalies such as violations of the put-call
parity relation.13 Hence, it is essential to take these frictions into account in our optimization
approach. We discuss only the impact of transaction costs measured by the bid-ask spread.
Other types of costs like brokerage fees and market price impact may be substantial but are
ignored here.
Figure 1 shows bid-ask spreads for options between Junuary 1996 and August 2013. Table
2 shows average bid-ask spreads of about $1.40 for ATM options and $0.70 for OTM options.
Dividing this by midprices, we measure relative bid-ask spreads for ATM options of around
5%, increasing to 10% on average for OTM options. Relative bid-ask spreads change over
time and for OTM options can reach up to 30%.14
We incorporate transaction costs into our approach by decomposing each option into
11When the optimization leads to extreme portfolio weights – due to the large simulated returns from
current option prices – we use the risk-free rate in that month. We do this for realism since in practice
options traders face constraints in terms of the risk exposure of their portfolios. We also tried simply using
the allocation of the previous month with virtually the same results.
12Driessen and Maenhout (2007) discuss several alternatives for disappointment aversion.
13See, for instance, Phillips and Smith (1980), Baesel, Shows, and Thorp (1983), and Saretto and Santa-
Clara (2009).
14Dennis and Mayhew (2009) shows that the effective spread is about two-thirds of the quoted spread
given in OptionMetrics, so quoted spreads may overestimate costs which seems a conservative assumption
to use in our strategy.
10

two securities: a “bid option” and an “ask option.” We initiate long positions at the ask
quote and short positions at the bid quote; shorts enter the optimization with a minus sign.
This follows the approach taken by Eraker (2013) and Plyakha and Vilkov (2008). Then
we run the algorithm as a constrained optimization problem by imposing a no short-selling
condition. This means that in each month only one of the securities, either the bid or the ask
option, is ever traded. Note that the wider the bid-ask spread, the less likely an allocation
to the security is.
III Data
A Securities
We analyze the optimal option portfolio allocation from January 1996 through August
2013. The choice of the period relates to the availability of option data. We use log returns
of the Standard & Poor’s 500 index from February 1950 through August 2013 as the basis
for the simulation process. Figure 2 presents the monthly time-series of Standard & Poor’s
500 and VIX indices in the portfolio allocation period.15
This is a rich period with a variety of market conditions comprising events such as the
1997 Asian crisis, the 1998 Russian financial crisis, the 1998 collapse of Long Term Capital
Management, the 2000 Nasdaq peak, the September 2001 attack on New York’s World Trade
Center, the 2002 business corruption scandals (Enron and Worldcom), the second Gulf War,
the 2006-2008 subprime mortgage crisis and Lehman Brothers default, the 2010 sovereign
crisis and Flash Crash, and the August 2011 stock market fall.
We use data from the OptionMetrics Ivy DB database for European options on the S&P
15VIX index is calculated and disseminated by the Chicago Board Options Exchange. It estimates the
implied volatility of ATM options on the S&P 500 index over the next month. The formula uses a kernel-
smoothed estimator that takes as inputs the current market prices for several call and put options over a
range of moneyness and maturity.
11

500 index traded on the CBOE.16 The underlying asset is the index level multiplied by 100.
Option contracts expire on the third Friday of each month. The options are settled in cash
on the business day following expiration. The dataset includes the closing bid and ask prices,
volume, and open interest for the period between January 1996 and August 2013. In order to
eliminate unreliable data, we apply a series of filters typically used in the literature. First, we
exclude all observations for which the bid is lower than $0.125 or higher than the ask price.
Second, we exclude all observations with no volume to mitigate the impact of non-trading.
Finally, we exclude all observations that violate arbitrage bounds.
We assume the risk-free interest rate is represented by the one-month T-Bill. This series
is from Bloomberg for the period between January 1996 and August 2013.
B Construction of option returns
Our asset allocation uses a risk-free asset and a set of risky “securities.” We consider four
options with different levels of moneyness: a ATM call, a ATM put, a 5% OTM call, and a
5% OTM put. This limited number of securities keeps the model simple but still generates
flexible payoffs as a function of the underlying asset price: OTM options are important for
kernel spanning (Buraschi and Jackwerth (2001) and Vanden (2004)) and a deep OTM put
option is very sensitive to crash risks.17 The options we use are among the most liquid
contracts, using volume as a proxy for liquidity.
We choose one-month to maturity options. Buraschi and Jackwerth (2001) report that
16The options trade under the ticker SPX. Average daily volume in January 2013 was about 800,000
contracts.
17In practice, you can use more options across moneyness or options across different assets. As an example,
we consider three call options (ATM, 2% OTM, and 7% OTM) and three put options (ATM, 2% OTM, and
7% OTM) and the performance is very similar. The only numerical constraint that sometimes occurs is
due to redundancy of some options in some periods. This happens when moneyness of the different options
values are not sufficiently apart. The problem of a portfolio with a large number of options is incurring high
transaction costs prevalent in this market. This solution is thus, in practical terms, infeasible.
12

most of the trading activity in S&P 500 index options is concentrated in the nearest contracts
of less than 30 days to expiration. This target maturity is also appealing as longer-maturity
option contracts may stop trading if the underlying asset moves in such a way that the options
become very deeply ITM or OTM. Most importantly, holding the options to maturity incurs
transaction costs only at inception of the trade.
We first find all available option contracts with exactly one-month to maturity, i.e., we
use the returns from Friday before the third Saturday to Friday before the third Saturday of
the next month.18 We then define buckets for option moneyness in terms of the ratio of the
underlying price to the strike price less one, S/K − 1. We set a range of moneyness between
−1.0% and 1.0% for ATM options and a range of 2% around 5.0% for OTM options.
For each month and bucket we are left with several potential securities from which we
choose the option with the lowest relative bid-ask spread. When more than one contract has
the same spread, we choose the one with the highest open interest. Finally, we construct the
synthetic one-month hold-to-expiration option returns:
(13) rt,t+1 =Payofft+1
Pricet− 1
where Payofft+1 is the payoff of the option at maturity calculated using the closing price of
the underlying asset on the day before settlement, and Pricet is the option price observed at
the beginning of the period. We obtain a time-series of 212 observations for each security.
Figure 3 presents histograms of each individual option returns. For any of the options
considered, we confirm that the option return distributions depart significantly from the
normal distribution with considerable negative tail risk. Mean time-series characteristics for
each option by moneyness are presented in Table 2. ATM call and put options have average
18There are other alternatives that we do not follow. For example, Buraschi and Jackwerth (2001), Coval
and Shumway (2001), and Driessen and Maenhout (2013) select options on the first day of each month and
compute returns until the first day of the next month.
13

moneyness of 0.24% and −0.10%, respectively, while OTM call and put options have average
moneyness of −4.09% and 4.37%, respectively. These numbers show how close each contract
is to the target of each bucket. Volume for each contract is around 13,000 and open interest
is close to 15 million. Mean implied volatility varies with moneyness from 17% to 22%,
confirming the well known smile effect.
Table 3 reports summary statistics of returns for the various securities. We compute the
certainty equivalent of an investor with a CRRA utility function with risk aversion parameter
of 4, which is given by
(14) CE = [(1− γ)U ]1/(1−γ) − 1
where γ is 4, U = 1T
∑Tt=1 Ut and Ut is the CRRA utility function for each month t. We
use a risk aversion coefficient of 4 to evaluate the returns of the strategy. This is lower
than the coefficient used in the optimization. Intuitively, we optimize as if the risk aversion
coefficient was higher than it truly is in reality to minimize in-sample overfitting. We can
think of this as akin to shrinking portfolio weights which is ofter done in practice. We
also compute the Sharpe ratio, and offer descriptive statistics of the return distribution, in
particular, skewness and excess kurtosis.19 We use the S&P 500 total return index as a
benchmark.20 The S&P 500 total return index has an average annualized return of 6.4%
19The main problem of the Sharpe ratio in this setup is that it takes into account only the first two
moments, the mean and the standard deviation. See Bernardo and Ledoit (2000) and Ingersoll, Spiegel,
Goetzmann and Welch (2007) for problems with the Sharpe ratio. Broadie et al. (2009) show that although
the Sharpe ratio is not the best measure to evaluate performance in an option framework, other alternative
measures such as Leland’s alpha or the manipulation–proof performance metric face the same problems.
20We also construct a portfolio consisting of the stock market and the T-bill optimized each month using
the CRRA bootstrap methodology as defined in Section II. The performance is similar although with lower
and less volatile returns.
14

over the sample period, corresponding to an annualized certainty equivalent of −1.31% and
an annualized Sharpe ratio of 0.29.21 This Sharpe ratio is lower than for the entire sample,
reflecting the low returns in the recent period. S&P 500 index returns are negatively skewed
and leptokurtic. The middle panel of the same table presents the same summary statistics
for individual options. Options present large negative average annualized returns ranging
from −440% to −131%, except the ATM call with a positive mean return of 52%. This
suggests that writing options would have been a good strategy, with annualized Sharpe
ratios ranging from 0.14 to 0.60 for this period.22 Writing options, however, has negative tail
risk that is very onerous in some months. The returns to writing options have a maximum
of 100%, but the minimum ranges from −2, 496% to −664% depending on the option. This
leads to large negative skewness and excess kurtosis as high as 38 and a deeply negative
certainty equivalent of -100%. The last row of this panel shows a strategy that allocates the
same weight to each option. DeMiguel, Garlappi, and Uppal (2009) argue that a naive 1/N
uniform rule is generally a good strategy. Using this rule for our four risky assets, we obtain
smoother skewness and kurtosis, and an annualized Sharpe ratio of 0.47. However, as with
individual options, the certainty equivalent is still −100%. We note that looking at these
extremely levered securities may lead to unreasonable returns. No investor would invest all
wealth on them. We therefore construct low-leverage portfolios that short only 4.47% of the
wealth in each option and go long 104.47% in the risk-free asset. This choice allows us to
relate the returns of individual options to our OOPS returns later on since OOPS invests,
on average, 104.47% in the risk-free asset and has an average short position of 4.47% in
options. Of course, mean, standard deviation, minimum and maximum drop dramatically
while skewness, excess kurtosis and annualized Sharpe ratio do not. However, the simple
21This negative certainty equivalent is due to the low return, high volatility, and large drawdowns of the
market in this period, as well as the high risk aversion of our investor.
22Coval and Shumway (2001) and Eraker (2013) show that writing put options earns Sharpe ratios of 0.68
or above for a different time period.
15

option strategies still deliver negative skewness returns and in most cases negative certainty
equivalents showing that risk-averse investors would not want to use them.
IV Results
A Out-of-sample OOPS returns
Figure 4 presents the distribution of OOPS out-of-sample returns. In contrast to indi-
vidual options, the OOPS is closer to a normal distribution with a symmetric shape and
low tail risk. Table 4 reports summary statistics of out-of-sample returns for the OOPS
and the S&P 500 total return index (for comparison) between January 1996 and August
2013. Our strategies deliver an annualized certainty equivalent of 9.94% after transaction
costs which contrasts to the S&P 500 certainty equivalent of −1.31%. The OOPS yields an
average annualized return of 16.1% and an annualized standard deviation of 18.4%. This
implies an annualized Sharpe ratio of 0.82.23 The S&P 500 total index returns present lower
mean and larger standard deviation which imply a relatively lower annualized Sharpe ratio
in this period of 0.29. In contrast to the stock market, OOPS has positive skewness and low
kurtosis. This is remarkable since shorting individual options has large negative skewness
and much higher kurtosis. The OOPS has a minimum return of −18.4% and a maximum
return of 20.8% which compares to the S&P 500 index minimum of −29.5% and a maximum
of 18.6%. Figure 5 presents the cumulative returns for OOPS, S&P 500 total return index
and risk-free rate starting from $100 invested in January 1996. OOPS shows a relatively
stable increasing pattern. The final value is more than thirteen times the initial amount
invested, well above the performance of the S&P 500 index.The largest OOPS loss (-18%)
was associated with the 9/11 terrorist attacks. The second largest OOPS loss (−15%) was
associated with the Flash Crash on May 6, 2010. We cannot relate the third largest OOPS
23We tried our method for 2-month and 3-month options. For 2-month options, our method delivers a
Sharpe ratio of 0.81 and a certainty equivalent of 4.91%. For 3-month options, our method delivers a Sharpe
ratio of 0.42 and a certainty equivalent of 8.14%.
16

loss to any special event. On the other side, March 2009 was the inflection point after the
2007-08 crash. May 2013 and February 1996 did not have salient events, although associated
with largest OOPS gains. An investor may be worried by OOPS return drawdowns. Never-
theless, the OOPS return drawdowns are typically less severe than drawdowns for the S&P
500 index returns. This can also be confirmed by the positive certainty equivalent of OOPS
returns when compared to the negative certainty equivalent of the stock market returns.
Another concern would be neglecting price impact costs for OTM puts since the market is
fairly one-sided for this option. To test this concern, we run our method but we remove the
possibility of selling OTM puts while still allowing them to be bought. Alternatively, we
also run the methodology when the bid-ask spread for OTM puts is doubled. In both cases,
the impact on performance is marginal since the strategy does not meaningfully short these
options. These results are provided in the internet appendix.
The OOPS is quite different from the simple short put and other strategies described in
the literature (Coval and Shumway (2001), Saretto and Santa-Clara (2009)). Table 6 reports
the average, the minimum and the maximum net weights of each option in the strategy and
Figure 6 presents the evolution of net weights for each option. Optimal call and put option
weights vary significantly over time, ranging from −8.7% to 3.5%. Put options have generally
lower weights relative to call options. On average, the OOPS takes low short positions in
options. Nonetheless, there are extended periods in which the OOPS is long in options.
There is an offsetting effect within ATM options and within OTM options.24
The bottom right picture in Figure 6 describes the evolution of the risk-free security
weight which is 100% minus the sum of the weights invested in options. The mean risk-free
weight is 104.47% ranging from 94% to 116%. In line with our expectation, OOPS is a net
seller of options on average, but in 27% of the months our investor holds a net long position
(on average equal to 3%). Note that Driessen and Maenhout (2007) show that constant
24Correlation figures confirm these results. The strongest correlated pair of weights is the ATM call and
puts of the order of 0.82.
17

relative risk aversion investors always find it optimal to short OTM puts, and only with
distorted probability assessments using cumulative prospect theory and anticipated utility
are they able to obtain positive weights for puts. In contrast, we find that there are many
periods when this does not apply. For example, in July 1997, the OOPS takes a long position
of 0.7% in OTM put options. In their setting, they have a static setting - constant weights
in each option over time – and a smaller opportunity set – only one option strategy at a
time. It is clearly not the case that the OOPS methodology simply sells volatility at all
times. There is a strong correlation, 0.94, between the sum of call weights and the sum of
put weights. Figure 6 shows that the optimal portfolio is short OTM puts most of the time
(85% of the months), but partially hedges this position with other options.
1 Choice of volatility estimator
OOPS uses the current realized volatility which is calculated from the last d trading days
and scaled by 21 days (the average number of trading days in a month) to express it in
monthly units. In each month, we use the length d that maximizes the expected utility in
sample. Alternatively, we also use the VIX, the RiskMetrics estimate or a fixed lenght of d
for computing realized volatility. The RiskMetrics model assumes that the variance process
is given by σ2t = λσ2
t−1 + (1 − λ)r2t−1 where 0 ≤ λ ≤ 1 is the smoothing parameter. The
smaller the smoothing parameter, the greater weight is given to recent return data. We
present the results of using these estimators for OOPS in Table 5. OOPS returns are robust
to the choice of volatility estimator, although there is some deterioration of performance
when using VIX, RiskMetrics and different fixed levels for d. The decrease in performance
from using VIX shows that part of OOPS returns are due to an underestimation of volatility
immediately following a positive shock to volatility. Alternatively, it may be that VIX
overshoots the true volatility. The results using RiskMetrics are also enlightening. With
higher λ and stronger persistence of the estimator, we get worse performance of OOPS.
This means that the performance of our method depends on using very recent information
to estimate volatility. We see the same results as we vary the length of the window to
18

estimate volatility. It is particularly important for our method to put most weight on recent
observations.
B Risk or mispricing?
There are two alternative justifications for the OOPS performance: loading in priced risk
factors or exploiting option mispricing. The existing literature supports both hypotheses.
Bakshi et al. (1997), Bates (1996), Chernov and Ghysels (2000), Duffie, Pan, and Singleton
(2000), Pan (2002), Liu and Pan (2003), Eraker (2004), Broadie, Chernov, and Johannes
(2007), Todorov (2010), and Christoffersen, Jacobs, and Heston (2013) show that option
prices reflect priced volatility and crash risk exposures, whereas Coval and Shumway (2001),
Jackwerth (2000), Jones (2006), Saretto and Goyal (2009), and Constantinides et al. (2013)
show that risk factor exposures do not fully explain option prices. In this section, we explore
the two alternatives.
We find that the OOPS has low exposure to priced risk factors. Ex ante, our strategies
have, on average, low exposure to the market, volatility and jump risks. There are, however,
some periods of time in which OOPS is more exposed, especially when volatility is low.
Figure 7 presents the time-series evolution of three risk measures in the period between
January 1996 and August 2013. We use greeks from Black and Scholes (1973) to evaluate
this. The beta of an option is computed by multiplying the Black–Scholes delta by the ratio
between the underlying asset value and the option value. The portfolio beta is the weighted
average of the option betas.25 This measure has the advantage that it takes into account
option leverage. OOPS has lower beta than individual options.26 It varies between −0.75
and 0.62 with a mean value of 0.03. This means beta is not significantly different from zero
using a Newey-West (1987) t-statistic.
25We do not present the delta, since its time-series distribution is very narrow and close to zero.
26Beta for individual options is presented in Table 2 and the differences between individual option betas
and OOPS betas are statistically significant.
19
We use percent vega to proxy for the volatility exposure. Percent vega is the percentage
change in the portfolio due to a one percentage point change in volatility. This is generally
low, varying between −1.4% and 0.7%. The mean percent vega is −0.3% and significantly
different from zero using a Newey-West t-statistic. So, if volatility increases by 1%, the
portfolio returns decrease by 0.3% on average. The magnitude of the exposure is low (and
the sign changes often) so that the OOPS returns cannot be explained by the volatility
risk premium only. Market Jump of -5% is the OOPS return from a sudden drop of 5%
in the stock market. Jump risk at time t for each option in the portfolio is computed as
OBSt (S, σ) − OBS
t (0.95S, σ) where OBSt is the Black-Scholes option value for each option
in the strategy. We aggregate these exposures in the portfolio and present the result in
percent. Market Jump of -5% evolves between −4.8% and 3.7%, and the average time-series
value is −0.6%. This exposure is on average negative, i.e, the strategy loses when there
are large market drops, but OOPS always loses less than the market. So the magnitude of
the exposure is low (and the sign changes often) so that OOPS returns cannot be explained
by the jump risk only.27 Therefore, the high OOPS returns cannot be fully explained as
compensation for jump risk. From these ex-ante measures it is clear that, on average, OOPS
is not particularly exposed to the market, volatility or jump risks. This agrees with the
low realized volatility, positive skewness and low kurtosis of the OOPS ex post distribution
discussed in the previous section.
To clarify the risk exposures of the OOPS even further, we present payoff profiles (the
return of the portfolio as a function of S&P500 returns) for the time-series average portfolio
27We also address more extreme scenarios of market jump. A negative market jump of two (three)
standard deviations - a drop of 8% (12%) - results in a average time-series of −2.6% (−6.2%). A positive
market jump of of two (three) standard deviations - an increase of 8% (12%) - results in a average time-series
of −3.9% (−5.9%). All these are relatively small. We also compute a combination of a large increase in
volatility (50% more) and a large drop in the market (a drop of 5%). The average impact on the portfolio
is of −2.1% which is relatively small.
20

and three particular dates which present different weight profiles: June 2002, April 2005,
and March 2007. Figure 8 presents these four payoff functions in the top four graphs. The
OOPS profile in June of 2002 is little exposed to market risk. In April of 2005, OOPS is
exposed to low volatility. In March of 2010, OOPS is exposed to left tail risk. These three
cases show the diversity of profiles of OOPS. On average, the OOPS time-series average
profile is somewhat exposed to the right tail risk. We also present payoff profiles for four
traditional strategies for comparison: short OTM put option, short ATM straddle, short
zero-beta straddle, and short crash-neutral straddle, all delevered (4.47% weight) so that
they can be easily compared to the OOPS. The contrast is stark especially in terms of the
volatility exposure.
Next, we study the ex post risk exposure of OOPS. Firstly, we define the variables to
be used. Excess market return is the difference between market return and the risk-free
rate. As a proxy for the market return, we use the S&P 500 index monthly return, rS&P500.
We proxy jump risk by a variable Jump equal to the value of the S&P 500 index return
when the monthly return is below −5% and zero otherwise.28 We consider two volatility
measures: realized volatility (RV ) of the previous month using daily data, and the V IX
level (V IX). We also construct a proxy for the volatility risk premium, V RP , which is the
spread between the implied and realized volatility (e.g. Adrian and Shin (2010), Saretto and
Goyal (2009), among others). We use Gamma, the second derivative of the option price in
respect to the underlying stock. It proxies for non-linear changes of the stock price. We use
the slope of the implied volatility term structure, IV Term, defined as the 2-month ATM put
implied volatility less 1-month ATM put implied volatility. We also use the implied volatility
moneyness slope, IVMoneyness, defined as the 1-month OTM put implied volatility less
1-month ATM put implied volatility. All these variables are customary in the equities and
28We also address more extreme scenarios. We run the same regressions with a market drop of two and
three standard deviations. We do the same for a sudden increase of the same magnitude. The conclusions
remain unchanged.
21

options literature.29
We run explanatory regressions of out-of-sample OOPS excess returns, rt − rft, on con-
temporary risk variables, Xt:
(15) rt − rft = α + βXt + εt
We run simple linear regressions on traditional risk factors. The factors considered are excess
market return, jump risk, and changes of the following variables: realized volatility, VIX,
implied volatility term structure, and implied volatility moneyness slope. Table 7 reports the
results. The market coefficient is positive and significant at the 5% level. So OOPS returns
are positively related to market returns. The OOPS expected returns are negatively related
to contemporaneous jump and changes in realized volatility. All these estimates agree with
previous ex ante risk measures findings. Notice that the magnitude of the coefficients on
these variables are all low. This shows the low economic risk implied by exposures to market,
volatility or jump risks. Moreover, R-squares are very low, i.e, these variables are only able
to explain a maximum of 4.99% of the variation of OOPS out of sample returns.
Next we study predictive regressions. We regress out–of–sample OOPS excess returns,
rt − rft, on a lagged variable Zt−1, using the following regression:
(16) rt − rft = α + βZt−1 + εt
These regressions study the conditional expected return of the strategy. We therefore use
variables that proxy for conditional risk premia. The value at the beginning of the month
of the following variables: realized volatility, V IX, variance risk premia, jump risk, gamma,
29We also tried different explanatory variables and models. For example, there is insignificant exposure
to the Carhart factors (http://mba.tuck.dartmouth.edu/pages/faculty/ken.french/), Fung and Hsieh hedge
fund factors (http://faculty.fuqua.duke.edu/∼dah7/HFData.htm), liquidity measures such as relative bid-
ask spread or open interest, and the VOL and JUMP factors of Cremers, Halling, and Weinbaum (2015).
22
implied volatility term, and implied volatility moneyness slope. Table 8 shows the results
of these regressions. No variable is significant at the 5% significance level. Moreover, these
variables present a maximum R2 of 0.41%.
We conclude that there is no variable able to meaningfully explain the variation of ex-
pected or unexpected OOPS returns. Both the results using ex-ante risk measures and payoff
profiles and the ex-post regressions are strong evidence that OOPS returns are mostly based
on the exploiting mispricing between options, rather than loading on priced risk factors.30
C Significance
Broadie et al. (2009) question the significance of the abnormal returns of simple short
option strategies. They show that empirically observed option returns are not inconsistent
with what would have been obtained in a Black-Scholes world with no mispricing and no risk
premia for volatility or crashes. We conduct a simulation study similar to theirs of a Black-
Scholes economy under the objective measure. The calibration fits the historic behavior
of the S&P500 index returns in our sample between 1950 and 2013. The historic average
annualized index return is 7.17%, the annualized volatility is 14.58%, and the annualized
risk-free rate is 1.74%. This translates to a historic risk premium of 5.43% and a Sharpe
ratio of 0.37 for the stock market, in line with the estimates in Broadie et al. (2009). In this
economy there are no transaction costs. We simulate 1, 000 paths of 756 months each (the
sample length of our data) of the index level.
For each simulated path, we use the first 551 observations as the basis of the simulations
used in the OOPS algorithm. These observations corresponds to the initial period between
1950 and 1995 in our sample. For each of the last 212 months, we price options with the
moneyness as used in our empirical study using the Black-Scholes formula. Note that, by
assumption, in this economy there is no mispricing nor risk premia for crash and volatility risk
30We only study linear risk factors. We scatter plot the OOPS returns against each risk-factor in order
to assess nonlinear dependencies. No pattern is recognized.
23

factors. Then, we run the OOPS algorithm on these artificial samples. In the end we compute
the same time-series performance metrics as before, including the certainty equivalent and
Sharpe ratio of the OOPS. In Figure 9, we plot the histograms of the difference between
simulated OOPS and stock market Sharpe ratios and certainty equivalents, as well as our
point estimates reported in Table 4 which are represented by a dashed vertical line. The
OOPS annualized Sharpe ratio and certainty equivalent are in the extreme right tail of the
simulated distribution showing clearly the significance of our estimates.
V Conclusion
We offer a new method for portfolio optimization using options. This method takes into
account the complex distribution of option returns and investor preferences for higher-order
moments. The method is straightforward to implement and requires virtually no computing
resources. Our approach does not rely on a long time series of option returns but just requires
currently observed prices. The approach takes into account the substantial transaction costs
in this market in a simple and convenient manner.
We apply the method out-of-sample in the period 1996 to 2013 with impressive results.
We obtain a high certainty equivalent and a large Sharpe ratio. We show that these results
are driven mostly by exploiting option mispricings, coupled with a small exposure to market
and volatility risk premia but not to crash risk.
24

Appendix A
In this appendix, we provide a small example of the method explained in Section II.A. In this
small example, we assume two time periods, t = 1, 2. At time 1, we run the optimization problem
and obtain the weights of each security. At time 2, we perform our out-of-sample exercise. We
set the stock prices for this exerise as S1 = 1 for time period 1, and S2 = 0.98 for time period 2
only known at period 2. We also set the risk-free interest rate equal to 1% (rf = 0.01), for both
periods. We use four options over the same underlying with the same maturity. The only difference
between options is moneyness and the choice between call and put options. Hence, we define the
two call options (ATM, c1, and OTM, c2) and two put options (ATM, p1, and OTM, p2) with strike
prices given by K1,c1 = K1,p1 = 1, K1,c2 = 1.05 and K1,p2 = 0.95. The current option prices are
C1,c1 = 0.04, C1,c2 = 0.0008, P1,p1 = 0.07, P1,p2 = 0.02. We assume a power utility function with
γ = 10. In this example, we run our method for 4 simulations and we assume no transaction costs.
Table A.1 presents the results for each step of the method explained in Section II.A. We assume
the four simulated returns of 5%, 1%, -4%, and -10% in Step 1. Then, in Step 2, we compute
the next-period underlying asset value. Using this four values, we compute the simulated optiono
payoffs at maturity and the corresponding returns for each option. In Step 4, we compute the
simulated portfolio returns. Based on these simulated portfolio returns, we maximize the expected
utility function and get the weights for each of the four options. The last step is to determine the
out-of-sample portfolio return. The resulting portfolio return for this hypothetical example is of
3.60%.
25

Table A1
Example of the Methodology
Table A1 shows an example of the method explained in Section II.A for a two-period model with
4 simulations and assuming no transaction costs.
1. Simulate the underlying asset log-returnr12 = 0.0500 r22 = 0.0100 r32 = −0.0400 r42 = −0.1000
2. Find the next-period underlying asset valueS12|1 = 1.0513 S2
2|1 = 1.0101 S32|1 = 0.9608 S4
2|1 = 0.9048
3.a. Determine simulated option payoffs at maturityC1
2|1,c1 = 0.0513 C22|1,c1 = 0.0101 C3
2|1,c1 = 0.0000 C42|1,c1 = 0.0000
C12|1,c2 = 0.0013 C2
2|1,c2 = 0.0000 C32|1,c2 = 0.0000 C4
2|1,c2 = 0.0000
P 12|1,p1 = 0.0000 P 2
2|1,p1 = 0.0000 P 32|1,p1 = 0.0392 P 4
2|1,p1 = 0.0952
P 12|1,p2 = 0.0000 P 2
2|1,p2 = 0.0000 P 32|1,p2 = 0.0000 P 4
2|1,p2 = 0.0452
3.b. And corresponding returns for each optionr12|1,c1 = 0.2818 r22|1,c1 = −0.7487 r32|1,c1 = −1.0000 r42|1,c1 = −1.0000
r12|1,c2 = 0.5889 r22|1,c2 = −1.0000 r32|1,c2 = −1.0000 r42|1,c2 = −1.0000
r12|1,p1 = −1.0000 r22|1,p1 = −1.0000 r32|1,p1 = −0.4398 r42|1,p1 = 0.3595
r12|1,p2 = −1.0000 r22|1,p2 = −1.0000 r32|1,p2 = −1.0000 r42|1,p2 = 1.2581
4. Construct the simulated portfolio returnrp12|1 = 0.01+ rp22|1 = 0.01+ rp32|1 = 0.01+ rp42|1 = 0.01+
+ω1,c1 × (0.2718)+ +ω1,c1 × (−0.7587)+ +ω1,c1 × (−1.0100)+ +ω1,c1 × (−1.0100)++ω1,c2 × (0.5789)+ +ω1,c2 × (−1.0100)+ +ω1,c2 × (−1.0100)+ +ω1,c2 × (−1.0100)++ω1,p1 × (−1.0100)+ +ω1,p1 × (−1.0100)+ +ω1,p1 × (−0.4498)+ +ω1,p1 × (0.3495)++ω1,p2 × (−1.0100) +ω1,p2 × (−1.0100) +ω1,p2 × (−1.0100) +ω1,p2 × (1.2481)
5. Choose weights by maximizing expected utility over simulated returns 14
∑4n=1
(1+rpn2|1)−9
−9ω1,c1 = −0.10, ω1,c2 = 0.07, ω1,p1 = −0.05, ω1,p2 = 0.04 and E(U) = −0.0804
6.a. Determine option actual payoffs... 6.b. ...and returns for each optionC2,c1 = 0.0000 C2,c2 = 0.0000 r2,c1 = −1.0000 r2,c2 = −1.0000P2,p1 = 0.0200 P2,p2 = 0.0000 r2,p1 = −0.7143 r2,p2 = −1.0000
6.c. Determine one-period out-of-sample portfolio returnrp2 = 0.0360
26

References
Adrian, T., and H. S. Shin.“Liquidity and Leverage.” Journal of Financial Intermediation,
19 (2010), 418–437.
Almazan, A.; K. Brown; M. Carlson; and D. Chapman. “Why Constrain your Mutual Fund
Manager?” Journal of Financial Economics, 73 (2004), 289–322.
Andersen, T. G.; L. Benzoni; and J. Lund. “An Empirical Investigation of Continuous Time
Equity Return Models.” Journal of Finance, 57 (2002), 1239–1284.
Aragon, G. O., and J. S. Martin. “A Unique View of Hedge Fund Derivatives Usage: Safe-
guard or Speculation?” Journal of Financial Economics, 105 (2012), 436–456.
Baesel, J.; G. Shows; and E. Thorp. “The Cost of Liquidity Services in Listed Options.”
Journal of Finance, 38 (1983), 989–995.
Bakshi, G.; C. Cao; and Z. Chen. “Empirical Performance of Alternative Option Pricing
Models.” Journal of Finance, 52 (1997), 2003–2049.
Barone-Adesi, G.; R. F. Engle; and L. Mancini. “A GARCH Option Pricing Model with
Filtered Historical Simulation.” Review of Financial Studies, 21 (2008), 1223–1258.
Barone-Adesi, G.; K. Giannopolos; and L. Vosper. “VaR without Correlations for Non-
Linear Portfolios.” Journal of Futures Markets, 19 (1999), 583–602.
Bates, D. “Jump and Stochastic Volatility: Exchange Rate Processes Implicit in Deutsche
Mark Options.” Review of Financial Studies, 9 (1996), 69–107.
Bernardo, A. E., and O. Ledoit. “Gain, Loss, and Asset Pricing.” Journal of Political Econ-
omy, 108 (2000), 144–172.
Black, F., and M. Scholes. “The Pricing of Options and Corporate Liabilities.” Journal of
Political Economy, 81 (1973), 637–659.
Bliss, R. R., and N. Panigirtzoglou. “Option-Implied Risk Aversion Estimates.” Journal of
Finance, 59 (2004), 407–446.
Bondarenko, O. “Why Are Puts so Expensive?” Unpublished working paper, University of
27

Illinois, Chicago (2003).
Brandt, M. W. “Estimating Portfolio and Consumption Choice: A Conditional Euler Ap-
proach.” Journal of Finance, 54 (1999), 1609–1645.
Brandt, M. W.; P. Santa-Clara; and R. Valkanov. “Parametric Portfolio Policies: Exploiting
Characteristics in the Cross Section of Equity Returns.” Review of Financial Studies, 22
(2009), 3411–3447.
Broadie, M.; M. Chernov; and M. Johannes. “Model Specification and Risk Premia: Evi-
dence from Futures Options.” Journal of Finance, 62 (2007), 1453–1490.
Broadie, M.; M. Chernov; and M. Johannes. “Understanding Index Option Returns.” Re-
view of Financial Studies, 22 (2009), 4493–4529.
Buraschi, A., and J. Jackwerth. “The Price of a Smile: Hedging and Spanning in Option
Markets.” Review of Financial Studies, 14 (2001), 495–527.
Chen, Y. “Derivatives Use and Risk Taking: Evidence from the Hedge Fund Industry.”
Journal of Financial and Quantitative Analysis, 46 (2011), 1073–1106.
Chernov, M., and E. Ghysels. “A Study Towards a Unified Approach to the Joint Estimation
of Objective and Risk Neutral Measures for the Purpose of Options Valuation.” Journal of
Financial Economics, 56 (2000), 407–458.
Christoffersen, P.; K. Jacobs; and S. L. Heston. “Capturing Option Anomalies with a Vari-
ance Dependent Pricing Kernel.” Review of Financial Studies 26 (2013), 1963–2006.
Constantinides, G. M.; J. C. Jackwerth; and A. Z. Savov. “The Puzzle of Index Option
Returns.” The Review of Asset Pricing Studies 3 (2013), 1–29.
Coval, J. D., and T. Shumway. “Expected Option Returns.” Journal of Finance 56 (2001),
983–1009.
Cremers, M.; M. Halling; and D. Weinbaum. “Aggregate Jump and Volatility Risk in the
Cross-Section of Stock Returns.” Journal of Finance Forthcoming (2015).
Deli, D. N., and R. Varma. “Contracting in the Investment Management Industry: Evidence
from Mutual Funds.” Journal of Financial Economics 63 (2002), 79–98.
28

DeMiguel, V.; L. Garlappi; and R. Uppal. “Optimal versus Naive Diversification: How In-
efficient Is the 1/N Portfolio Strategy?” Review of Financial Studies 22 (2009), 1915–1953.
Dennis, P., and S. Mayhew. “Microstructural Biases in Empirical Tests of Option Pricing
Models.” Review of Derivatives Research 12 (2009), 169–191.
Diebold, F. X.; T. Schuermann; and J. D. Stroughair. “Pitfalls and Opportunities in the
Use of Extreme Value Theory in Risk Management.” In A.-P. N. Refenes A. N. Burgess
& J. D. Moody (Eds.), Decision Technologies for Computational Finance, Kluwer Academic
Publishers (1998) 3–12.
Driessen, J., and P. Maenhout. “An Empirical Portfolio Perspective on Option Pricing
Anomalies.” Review of Finance 11 (2007), 561–603.
Driessen, J., and P. Maenhout. “The World Price of Jump and Volatility Risk.” Journal of
Banking and Finance 37 (2013), 518–536.
Duffie, D.; J. Pan; and K. Singleton. “Transform Analysis and Asset Pricing for Affine
Jump-Diffusions.” Econometrica 68 (2000), 1343–1376.
Efron, B., and R. J. Tibshirani “An Introduction to the Bootstrap.” Chapman and Hall
New York (1993).
Eraker, B. “Do Stock Prices and Volatility Jump? Reconciling Evidence from Spot and
Option Prices.” Journal of Finance 59 (2004), 1367–1403.
Eraker, B. “The Performance of Model Based Option Trading Strategies.” Review of Deriva-
tives Research 16 (2013), 1–23.
Hull, J., and A. White. “Incorporating Volatility Updating into the Historical Simulation
Method for Value-at-Risk.” Journal of Risk 1 (1998), 5–19.
Ingersoll, J.; M. Spiegel; W. Goetzmann; and I. Welch. “Portfolio Performance Manip-
ulation and Manipulation-Proof Performance Measures.” Review of Financial Studies 20
(2007), 1503–1546.
Jackwerth, J. “Recovering Risk Aversion from Option Prices and Realized Returns.” Review
of Financial Studies 13 (2000), 433–451.
29
Jones, C. “A Nonlinear Factor Analysis of S&P 500 Index Option Returns.” Journal of
Finance 61 (2006), 2325–2363.
Koski, J. L., and J. Pontiff. “How Are Derivatives Used? Evidence from the Mutual Fund
Industry.” Journal of Finance 54 (1999), 791–816.
Liu, J., and J. Pan. “Dynamic Derivative Strategies.” Journal of Financial Economics 69
(2003), 401–430.
Malamud, S. “Portfolio Selection with Options and Transaction Costs. ”Swiss Finance In-
stitute Research Paper (2014) No. 14-08.
Michaud, R., and R. Michaud. “Estimation Error and Portfolio Optimization: A Resam-
pling Solution.” Journal of Investment Management 6 (2008), 8–28.
Newey, W. K., and K. D. West. “A simple, Positive Semi-Definite, Heteroskedasticity and
Autocorrelation Consistent Covariance Matrix.” Econometrica 55 (1987), 703–708.
Pan, J. “The Jump-Risk Premia Implicit in Options: Evidence from an Integrated Time-
Series Study.” Journal of Financial Economics 63 (2002), 3–50.
Phillips, S., and C. Smith. “Trading Costs for Listed Options: The Implications for Market
Efficiency.” Journal of Financial Economics 8 (1980), 179–201.
Plyakha, Y., and G. Vilkov. “Portfolio Policies with Stock Options.” Working Paper, (2008).
Ross, S. “Options and Efficiency.” Quarterly Journal of Economics 90 (1976), 75–89.
Saretto, A., and A. Goyal, 2009, “Cross-Section of Option Returns and Volatility.” Journal
of Financial Economics 94 (2009), 310–326.
Saretto, A., and P. Santa-Clara. “Option Strategies: Good Deals and Margin Calls.” Jour-
nal of Financial Markets 12 (2009), 391–417.
Tan, S. “The Role of Options in Long Horizon Portfolio Choice.” The Journal of Derivatives
20 (2013), 60–77.
Todorov, V. “Variance Risk Premium Dynamics: The Role of Jumps.” Review of Financial
Studies 23 (2010), 345–383.
Vanden, J. “Options Trading and the CAPM.” Review of Financial Studies 17 (2004),
30

207–238.
31

Figure 1Bid-Ask Spread
Figure 1 represents monthly observations of the relative bid-ask spread (the ratio of the
absolute bid-ask spread to the mid price) for the period between January 1996 and August
2013 for four options: a ATM call, a ATM put, a 5% OTM call, and a 5% OTM put options.
Each option security was created as defined in Section 1. Results in percentage. Period:
January 1996 to August 2013.
1996 1998 2000 2002 2004 2006 2008 2010 20120
5
10
15
20
25
30
35
40
Year
%
ATM call ATM put OTM call OTM put
32

Figure 2S&P 500 Index and VIX
Figure 2 represents monthly observations of the S&P 500 total return index and the VIX
index. Period: January 1996 to August 2013.
1996 1998 2000 2002 2004 2006 2008 2010 20120
1000
2000
S&
P 5
00 Index
Year
1996 1998 2000 2002 2004 2006 2008 2010 20120
50
100
VIX
(%
)
S&P 500 IndexVIX
33

Figure 3Densities of Monthly Option Returns
Figure 3 represents the histograms of monthly raw returns of a long position in ATM and
5% OTM options over the S&P 500 index. Period: January 1996 to August 2013.
Graph A. ATM Call
-100 0 100 200 300 400 500 600 700 800 900Returns (%)
Fre
quency
Graph B. ATM Put
-100 0 100 200 300 400 500 600 700 800 900Returns (%)
Fre
quency
Graph C. OTM Call
-100 0 100 200 300 400 500 600 700 800 900Returns (%)
Fre
quency
Graph D. OTM Put
-100 0 100 200 300 400 500 600 700 800 900Returns (%)
Fre
quency
34
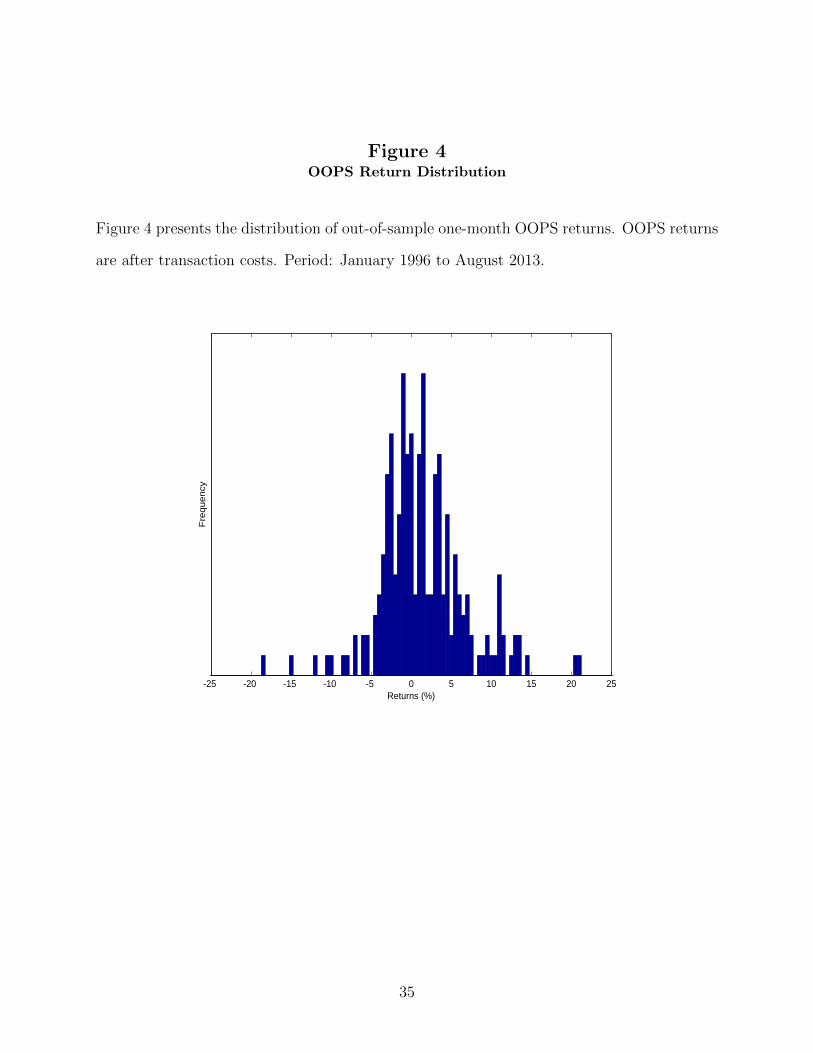
Figure 4OOPS Return Distribution
Figure 4 presents the distribution of out-of-sample one-month OOPS returns. OOPS returns
are after transaction costs. Period: January 1996 to August 2013.
-25 -20 -15 -10 -5 0 5 10 15 20 25
Fre
quency
Returns (%)
35

Figure 5OOPS Cumulative Returns
Figure 5 presents out-of-sample one-month OOPS cumulative returns. OOPS returns are
after transaction costs. Period: January 1996 to August 2013.
1996 1998 2000 2002 2004 2006 2008 2010 20120
200
400
600
800
1000
1200
1400
1600
1800
2000
Year
OOPS S&P 500 Risk-free
36
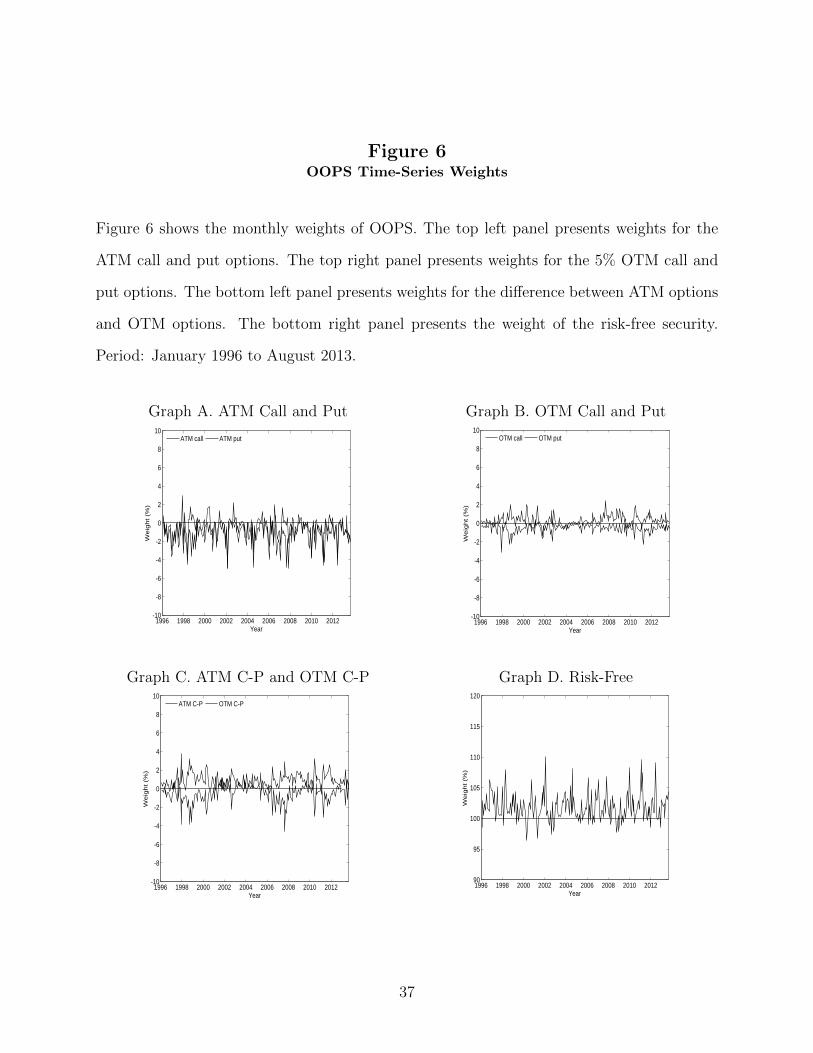
Figure 6OOPS Time-Series Weights
Figure 6 shows the monthly weights of OOPS. The top left panel presents weights for the
ATM call and put options. The top right panel presents weights for the 5% OTM call and
put options. The bottom left panel presents weights for the difference between ATM options
and OTM options. The bottom right panel presents the weight of the risk-free security.
Period: January 1996 to August 2013.
Graph A. ATM Call and Put
1996 1998 2000 2002 2004 2006 2008 2010 2012-10
-8
-6
-4
-2
0
2
4
6
8
10
Year
Weig
ht (%
)
ATM call ATM put
Graph B. OTM Call and Put
1996 1998 2000 2002 2004 2006 2008 2010 2012-10
-8
-6
-4
-2
0
2
4
6
8
10
Year
Weig
ht (%
)
OTM call OTM put
Graph C. ATM C-P and OTM C-P
1996 1998 2000 2002 2004 2006 2008 2010 2012-10
-8
-6
-4
-2
0
2
4
6
8
10
Year
Weig
ht (%
)
ATM C-P OTM C-P
Graph D. Risk-Free
1996 1998 2000 2002 2004 2006 2008 2010 201290
95
100
105
110
115
120
Year
Weig
ht (%
)
37
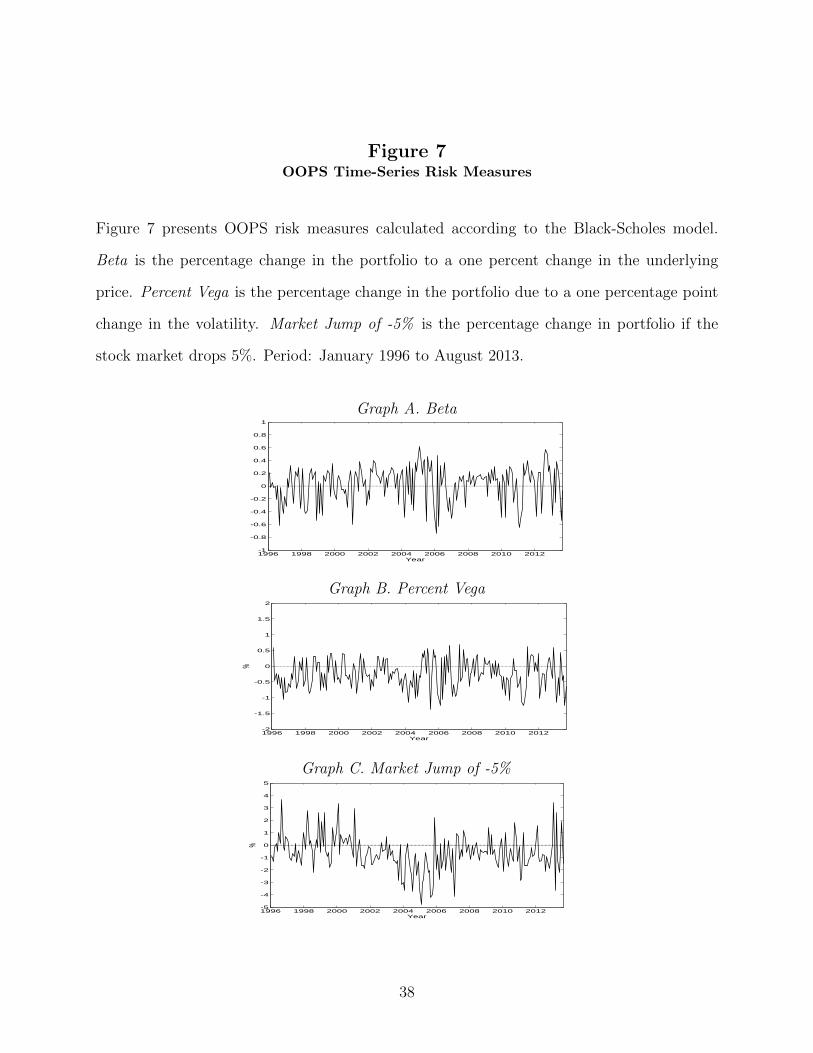
Figure 7OOPS Time-Series Risk Measures
Figure 7 presents OOPS risk measures calculated according to the Black-Scholes model.
Beta is the percentage change in the portfolio to a one percent change in the underlying
price. Percent Vega is the percentage change in the portfolio due to a one percentage point
change in the volatility. Market Jump of -5% is the percentage change in portfolio if the
stock market drops 5%. Period: January 1996 to August 2013.
Graph A. Beta
1996 1998 2000 2002 2004 2006 2008 2010 2012-1
-0.8
-0.6
-0.4
-0.2
0
0.2
0.4
0.6
0.8
1
Year
Graph B. Percent Vega
1996 1998 2000 2002 2004 2006 2008 2010 2012-2
-1.5
-1
-0.5
0
0.5
1
1.5
2
%
Year
Graph C. Market Jump of -5%
1996 1998 2000 2002 2004 2006 2008 2010 2012-5
-4
-3
-2
-1
0
1
2
3
4
5
%
Year
38
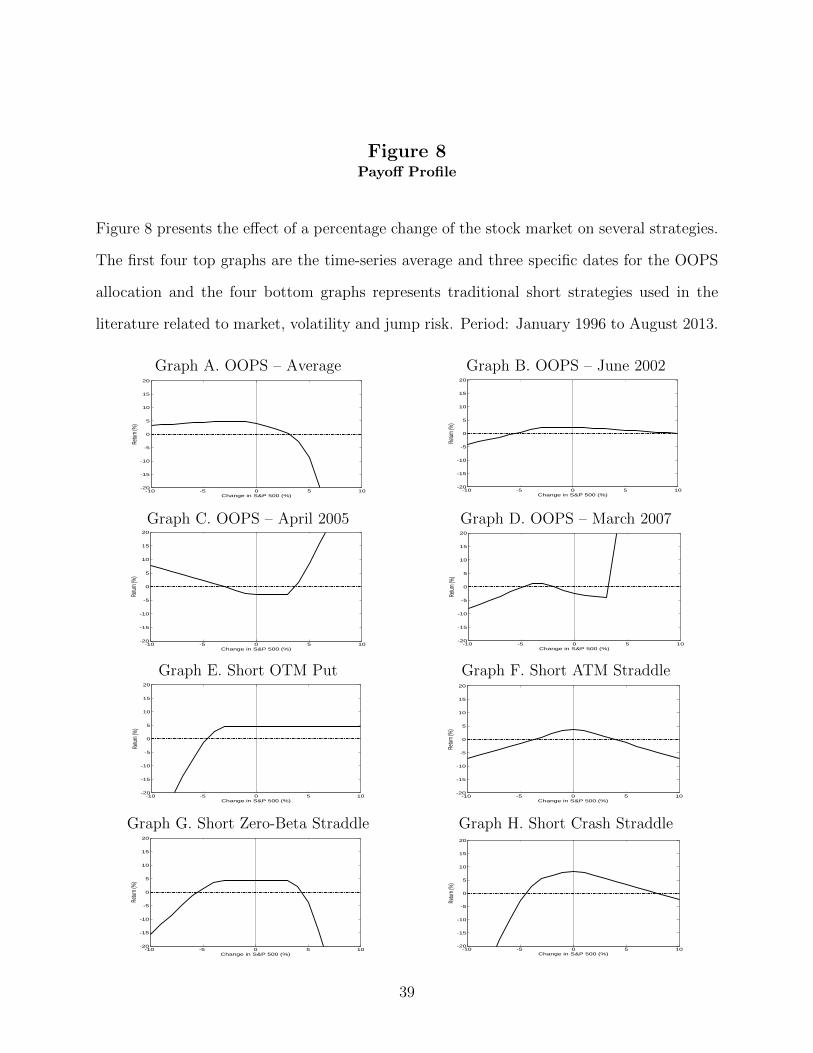
Figure 8Payoff Profile
Figure 8 presents the effect of a percentage change of the stock market on several strategies.
The first four top graphs are the time-series average and three specific dates for the OOPS
allocation and the four bottom graphs represents traditional short strategies used in the
literature related to market, volatility and jump risk. Period: January 1996 to August 2013.
Graph A. OOPS – Average
-10 -5 0 5 10-20
-15
-10
-5
0
5
10
15
20
Change in S&P 500 (%)
Retur
n (%)
Graph B. OOPS – June 2002
-10 -5 0 5 10-20
-15
-10
-5
0
5
10
15
20
Change in S&P 500 (%)
Retur
n (%)
Graph C. OOPS – April 2005
-10 -5 0 5 10-20
-15
-10
-5
0
5
10
15
20
Change in S&P 500 (%)
Retur
n (%
)
Graph D. OOPS – March 2007
-10 -5 0 5 10-20
-15
-10
-5
0
5
10
15
20
Change in S&P 500 (%)
Retur
n (%)
Graph E. Short OTM Put
-10 -5 0 5 10-20
-15
-10
-5
0
5
10
15
20
Change in S&P 500 (%)
Retur
n (%
)
Graph F. Short ATM Straddle
-10 -5 0 5 10-20
-15
-10
-5
0
5
10
15
20
Change in S&P 500 (%)
Retur
n (%)
Graph G. Short Zero-Beta Straddle
-10 -5 0 5 10-20
-15
-10
-5
0
5
10
15
20
Change in S&P 500 (%)
Retur
n (%
)
Graph H. Short Crash Straddle
-10 -5 0 5 10-20
-15
-10
-5
0
5
10
15
20
Change in S&P 500 (%)
Retur
n (%)
39

Figure 9Sampling Distribution of OOPS Sharpe Ratio and
Certainty Equivalent Under Black-Scholes Economy
Figure 9 presents histograms of the difference between the simulated OOPS and simulated
stock market Sharpe ratios and the difference of the simulated OOPS and simulated stock
market certainty equivalents under a Black-Scholes economy. The experiment uses 1,000
trajectories. The solid vertical line is the observed value from the data.
Graph A. SR(OOPS) – SR(Stock Market)
-1.2 -1 -0.8 -0.6 -0.4 -0.2 0 0.2 0.4 0.6
SR(OOPS)-SR(Stock Market)
Graph B. CE(OOPS) – CE(Stock Market)
-25 -20 -15 -10 -5 0 5 10 15
CE(OOPS)-CE(Stock Market)
%
40

Table 1S&P 500 Index Returns – Summary Statistics
Table 1 reports summary statistics (number of observations, skewness, excess kurtosis, one-month
autocorrelation for the returns and squared returns) and tests (one-month Ljung–Box and Arch
tests; p-values of each test are presented in squared brackets) for raw and standardized returns of
S&P 500 index.
Raw returns Standardized returns1950-1995 1996-2013 1950-2013 1950-1995 1996-2013 1950-2013
Obs 551 212 763 551 212 763Skew −0.56 −0.81 −0.66 −0.34 −0.48 −0.35Exc Kurt 5.97 4.30 5.41 3.60 3.36 3.78ρ1(z) 0.03 0.10 0.05 0.03 0.04 0.03ρ1(z
2) 0.13 0.23 0.16 −0.08 −0.10 −0.06Q1(z) 0.44 2.07 2.08 0.38 0.27 0.64
[0.51] [0.15] [0.15] [0.54] [0.60] [0.42]Arch(1) 9.60 10.83 20.50 3.93 2.04 3.12
[0.00] [0.00] [0.00] [0.05] [0.15] [0.08]
41
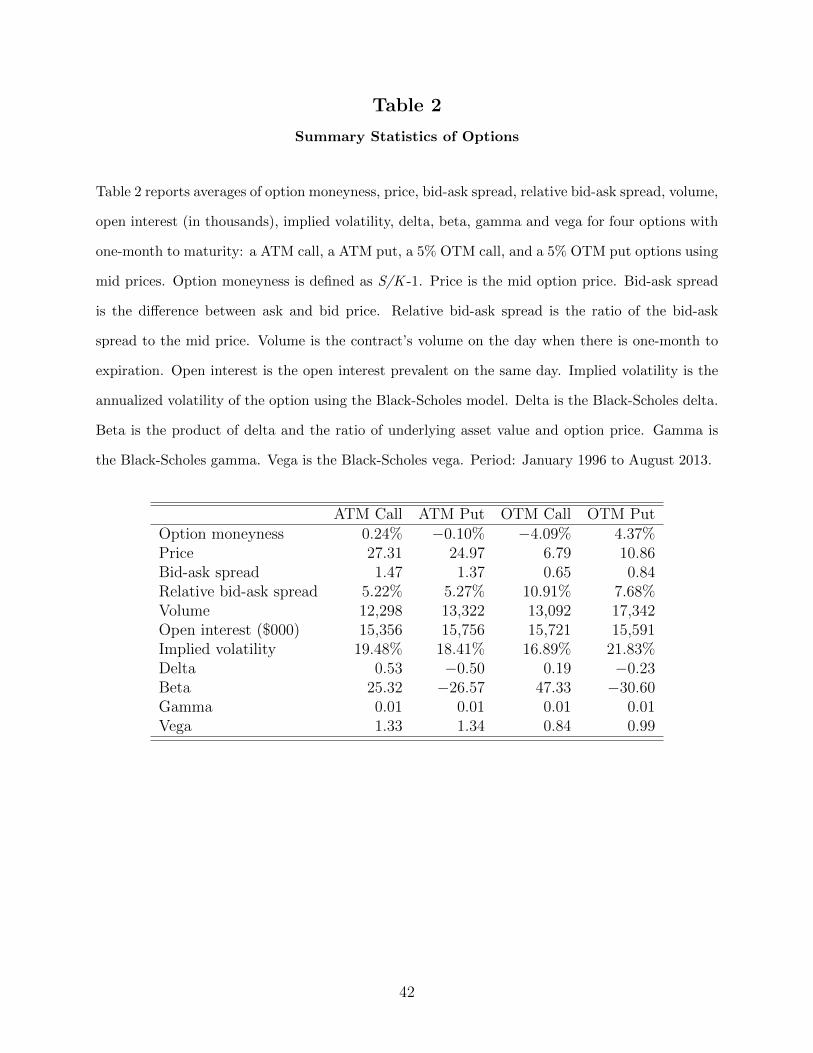
Table 2
Summary Statistics of Options
Table 2 reports averages of option moneyness, price, bid-ask spread, relative bid-ask spread, volume,
open interest (in thousands), implied volatility, delta, beta, gamma and vega for four options with
one-month to maturity: a ATM call, a ATM put, a 5% OTM call, and a 5% OTM put options using
mid prices. Option moneyness is defined as S/K -1. Price is the mid option price. Bid-ask spread
is the difference between ask and bid price. Relative bid-ask spread is the ratio of the bid-ask
spread to the mid price. Volume is the contract’s volume on the day when there is one-month to
expiration. Open interest is the open interest prevalent on the same day. Implied volatility is the
annualized volatility of the option using the Black-Scholes model. Delta is the Black-Scholes delta.
Beta is the product of delta and the ratio of underlying asset value and option price. Gamma is
the Black-Scholes gamma. Vega is the Black-Scholes vega. Period: January 1996 to August 2013.
ATM Call ATM Put OTM Call OTM PutOption moneyness 0.24% −0.10% −4.09% 4.37%Price 27.31 24.97 6.79 10.86Bid-ask spread 1.47 1.37 0.65 0.84Relative bid-ask spread 5.22% 5.27% 10.91% 7.68%Volume 12,298 13,322 13,092 17,342Open interest ($000) 15,356 15,756 15,721 15,591Implied volatility 19.48% 18.41% 16.89% 21.83%Delta 0.53 −0.50 0.19 −0.23Beta 25.32 −26.57 47.33 −30.60Gamma 0.01 0.01 0.01 0.01Vega 1.33 1.34 0.84 0.99
42
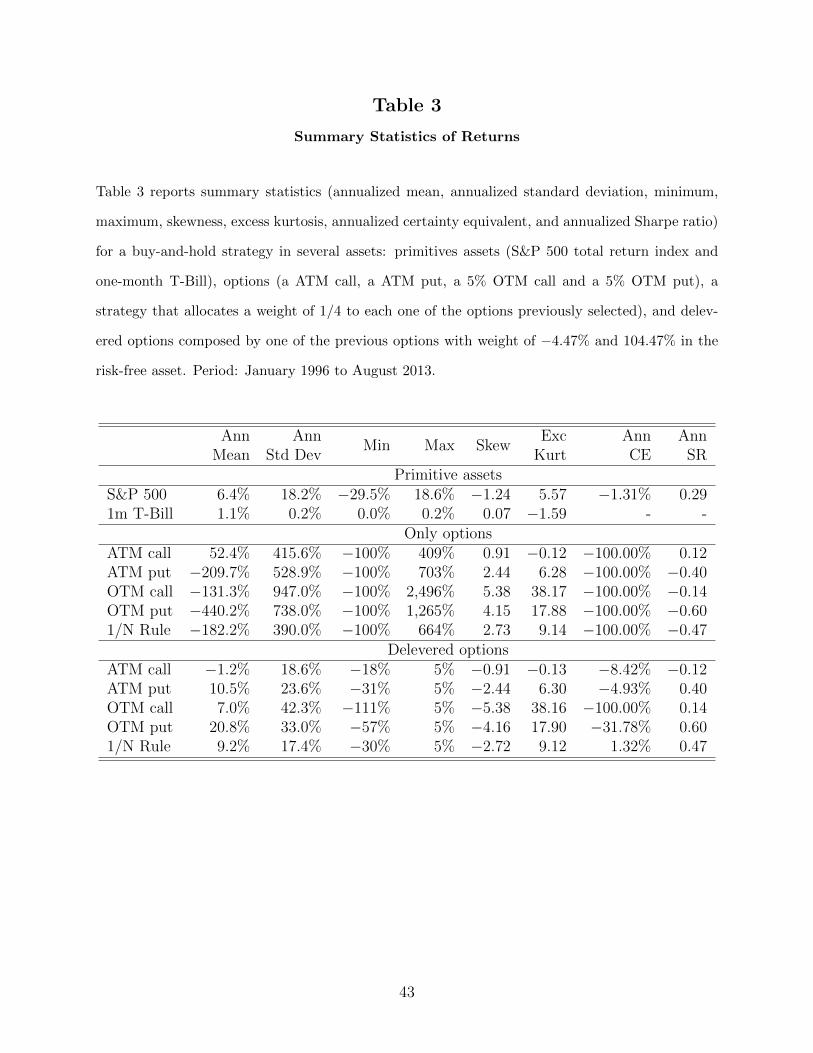
Table 3
Summary Statistics of Returns
Table 3 reports summary statistics (annualized mean, annualized standard deviation, minimum,
maximum, skewness, excess kurtosis, annualized certainty equivalent, and annualized Sharpe ratio)
for a buy-and-hold strategy in several assets: primitives assets (S&P 500 total return index and
one-month T-Bill), options (a ATM call, a ATM put, a 5% OTM call and a 5% OTM put), a
strategy that allocates a weight of 1/4 to each one of the options previously selected), and delev-
ered options composed by one of the previous options with weight of −4.47% and 104.47% in the
risk-free asset. Period: January 1996 to August 2013.
Ann AnnMin Max Skew
Exc Ann AnnMean Std Dev Kurt CE SR
Primitive assetsS&P 500 6.4% 18.2% −29.5% 18.6% −1.24 5.57 −1.31% 0.291m T-Bill 1.1% 0.2% 0.0% 0.2% 0.07 −1.59 - -
Only optionsATM call 52.4% 415.6% −100% 409% 0.91 −0.12 −100.00% 0.12ATM put −209.7% 528.9% −100% 703% 2.44 6.28 −100.00% −0.40OTM call −131.3% 947.0% −100% 2,496% 5.38 38.17 −100.00% −0.14OTM put −440.2% 738.0% −100% 1,265% 4.15 17.88 −100.00% −0.601/N Rule −182.2% 390.0% −100% 664% 2.73 9.14 −100.00% −0.47
Delevered optionsATM call −1.2% 18.6% −18% 5% −0.91 −0.13 −8.42% −0.12ATM put 10.5% 23.6% −31% 5% −2.44 6.30 −4.93% 0.40OTM call 7.0% 42.3% −111% 5% −5.38 38.16 −100.00% 0.14OTM put 20.8% 33.0% −57% 5% −4.16 17.90 −31.78% 0.601/N Rule 9.2% 17.4% −30% 5% −2.72 9.12 1.32% 0.47
43

Table 4
Out-of-Sample OOPS Returns
Table 4 reports time-series summary statistics (annualized mean, annualized standard deviation,
minimum, maximum, skewness, excess kurtosis, annualized certainty equivalent, and annualized
Sharpe ratio) for the S&P 500 total return index and the out-of-sample OOPS returns as explained
in Section 1. OOPS returns are after transaction costs. Period: January 1996 to August 2013.
Ann AnnMin Max Skew
Exc Ann AnnMean Std Dev Kurt CE SR
S&P 500 6.4% 18.2% −29.5% 18.6% −1.24 5.57 −1.31% 0.29OOPS 16.1% 18.4% −18.4% 20.8% 0.35 2.03 9.94% 0.82
44

Table 5
Out-of-Sample OOPS Returns – Different Volatility Estimators
Table 5 reports time-series summary statistics (annualized mean, annualized standard deviation,
minimum, maximum, skewness, excess kurtosis, annualized certainty equivalent, and annualized
Sharpe ratio) for the out-of-sample OOPS returns for different estimators of volatility. We present
in brackets the estimator used. RV stands for realized volatility, VIX stands for VIX, and RM
stands for RiskMetrics. OOPS returns are after transaction costs. Period: January 1996 to August
2013.
Ann AnnMin Max Skew
Exc Ann AnnMean Std Dev Kurt CE SR
OOPS (RV)Optimal d 16.1% 18.4% −18.4% 20.8% 0.35 2.03 9.94% 0.82d = 1 11.1% 14.4% −11.6% 20.8% 2.04 7.44 8.23% 0.75d = 5 11.9% 13.8% −12.9% 20.4% 0.93 4.47 8.65% 0.79d = 10 7.8% 12.1% −15.2% 16.1% 0.07 4.89 4.97% 0.56d = 20 3.7% 11.1% −18.4% 11.7% −1.52 8.59 0.95% 0.23d = 30 2.1% 9.5% −15.2% 7.6% −2.06 9.06 0.05% 0.11
OOPS (RM)λ = 0.80 9.3% 12.1% −13.9% 19.6% 0.61 6.11 6.61% 0.68λ = 0.90 5.9% 10.1% −15.2% 14.9% − 0.41 8.33 3.87% 0.48λ = 0.96 3.7% 8.8% −14.5% 9.9% −1.38 9.57 2.12% 0.31
OOPS (VIX) 6.6% 11.2% −16.8% 16.0% −0.33 7.75 4.03% 0.49
45

Table 6
OOPS Weights
Table 6 presents time-series mean, minimum and maximum weights for each risky security of the
OOPS. Period: January 1996 to August 2013.
ATM Call ATM Put OTM Call OTM PutMean −2.5% −1.8% 0.2% −0.4%Min −8.7% −8.4% −3.8% −4.2%Max 1.8% 3.2% 3.5% 0.9%
46

Table 7Explanatory Regressions for OOPS Returns
Table 7 presents estimated coefficients (p-values in squared brackets) and the adjusted R2
for explanatory regressions in which the dependent variable is the out-of-sample OOPS
excess returns and the independent variable is the variable stated in the left column and
defined in Section 3. ***, **, * denotes significant estimated parameters at 1%, 5%, and
10% levels, respectively. Period: January 1996 to August 2013 corresponding to 212 mothly
observations.
Variable OOPS excess returnsrS&P500 − rf 0.14∗∗
[0.04]Jump 0.34∗∗∗
[0.00]∆RV −0.07
[0.67]∆V IX −0.14
[0.51]∆IV Term −0.14
[0.49]∆IVMoneyness −0.06
[0.87]
R2(%) 1.46 4.99 −0.39 −0.27 −0.24 −0.47
47

Table 8Predictive Regressions for OOPS Returns
Table 8 presents estimated coefficients (p-values in squared brackets) and the adjusted
R2 for predictive regressions in which the dependent variable is the out-of-sample OOPS
excess returns and the independent variable is the variable stated in the left column and
defined in Section 3. ***, **, * denotes significant estimated parameters at 1%, 5%, and
10% levels, respectively. Period: January 1996 to August 2013 corresponding to 212 mothly
observations.
Variable OOPS excess returnsRV 0.07
[0.60]V IX 0.17
[0.22]V RP 0.32
[0.22]Jump −0.03
[0.78]Gamma −0.13
[0.17]IV Term −0.08
[0.73]IVMoneyness −0.07
[0.85]
R2(%) −0.35 0.24 0.23 −0.44 0.41 −0.42 −0.46
48