optimal blast wall layout design to mitigate gas
TRANSCRIPT

Optimal blast wall layout design to mitigate gas dispersion and explosion on a
cylindrical FLNG platform
Jingde Li1, a
, Guowei Ma2, b
, Hong Hao1, c
, Yimiao Huang2, d
1 Centre for Infrastructural Monitoring and Protection,
School of Civil and Mechanical Engineering, Curtin University,
Kent St, Bentley WA 6102, Australia
2School of Civil, Environmental and Mining Engineering, The University of Western
Australia, 35 Stirling Highway, Crawley, WA 6009, Australia
Abstract
This paper presents a comprehensive safety design of blast wall layout on a cylindrical
Floating Liquefied Natural Gas (FLNG) platform. Comparing to the mitigation measure –
safety gap investigated previously (Li et al., 2016a; Li et al., 2016b), blast wall is a better
option to be utilized in the congested areas with space limitation. Both of deterministic and
probabilistic studies on the cylindrical FLNG platform with and without blast walls subjected
to gas dispersion and explosion are conducted. The Computational Fluid Dynamics (CFD)
simulation results of more than 120 gas cloud sizes and 16,000 gas explosion overpressures
indicate that blast walls are exclusively beneficial for mitigating of flammable gas cloud and
explosion overpressure, if the initial gas leak rates are high momentous. A series of different
blast wall layouts are designed for the cylindrical FLNG. By taking all uncertainties including
different leak rates, leak locations, and gas cloud conditions etc. into account, the optimal
blast wall layout with lowest explosion overpressure exceedance frequencies is determined.

Keywords: blast wall; gas explosion; gas dispersion; cylindrical FLNG; safety design of
FLNG; safety gap
1. Introduction
The concept of Floating plant for Liquefied Nature Gas (FLNG) has been proposed since the
mid-1970s but made slow progress until May 2011, when Shell decided to proceed with the
development of Prelude FLNG. This world’s first FLNG vessel, which is 488 m long, 74 m
wide and weighting 600,000 tons with full loading, has been constructed in 2015 and is now
located in the Timor Seak of Australia to provide high production rate of up to 6 million tons
per annum of Liquefied Nature Gas (LNG), Liquefied Petroleum Gas(LPG) and
condensate(Shell-Global, 2016). Since then a series of FLNG projects have been approved
and most are in construction globally.
Comparing to onshore LNG facilities which consisting of costly fixed pipelines, land based
liquefaction plant and transportation, FLNG offers more advantages for the exploitation of
remote stranded offshore gas reserves. For example, FLNG project has a shorter build period
which reduces the construction cost (White and Longley, 2009). In addition, FLNG offers
higher efficiency in delivering schedule and completion date by using a shipyard rather than
onshore construction with frequent delays (Songhurst, 2016). Operation-wise, FLNG is
similar to FPSO, which has the flexibility to be anchored and towed out a different location in
the ocean (Suardin et al., 2009). Therefore, presently, many engineers in oil and gas industry
regard FLNG as a ‘game change’ for the development of remote and deep water oil and gas.
However, some weaknesses of the FLNG development also exist. For instance, the
maintenance fees of FLNGs are high. Additionally, FLNGs cannot operate in harsh
environments, due to the fact that there is a limit on offloading operation arm up to 2.5m
wave height (Naciri et al., 2007). When typhoons with large waves occur, the ship-shaped

FLNG cannot provide a stable platform due to the great ratio of its body length to width.
Moreover, risk analysis and safety design of FLNGs are not mature at the moment.
In order to address these shortcomings of FLNG, a conceptual design of cylindrical FLNG
has been proposed based on the conventionally ship-shape-design FLNG(Li et al., 2016a).
The cylindrical FLNG can efficiently minimize the wave induced fatigue loads due to the
symmetrically design body shape. Economically, the cost-driving turret and swivel facilities
are not required in the circular hull design (Hetland et al., 2009), which reduces the operation
and maintenance costs.
However, so far, there are very limited research existing regarding safety design and analysis
of the cylindrical FLNGs. (Huang et al., 2016) carried out a case study of Multi-Level
Explosion Risk Analysis (MLERA) on the cylindrical FLNG proposed by (Li et al., 2016a).
Nonetheless, the case study results merely proved that MLERA method is efficient in saving
computational time to identifying the highest level of potential risks, but nothing regarding
the safety measure design. In order to investigate the safety measure on gas explosion
mitigation, (Li et al., 2016a; Li et al., 2016b) designed a series of safety gaps between
congested facilities on the cylindrical FLNG topsides. The results of gas dispersion analysis
indicated that safety gap is efficient in reducing gas cloud size of a gas leakage in the near
field offshore modules, while safety gap increases gas cloud size in the far field of the
cylindrical FLNG topside (Li et al., 2016a). In terms of the subsequent gas explosion
analysis, beneficial effects of safety gaps on explosion overpressure mitigation were also seen
in the near field gas explosions. However, the safety gap could detrimentally enhance
explosion overpressure in certain scenarios if an inappropriate safety gap distance ratio was
used in the far field explosion design. It was worth noting that the determination of such
balanced safety gap distance ratio was not explicit, and the investigation was based on a

deterministic method. Furthermore, in (Li et al., 2016b)’s study, the safety gaps were
designed to separate the congested modules exclusively in the North-South direction as there
was sufficient space in such direction, whereas the available open space in the East-West
direction was limited.
Under such circumstances, blast wall turns out to be a more feasible safety measure in the
space-limited East-West direction. Blast wall, which provides protection to restrict the spread
of flammable fuel-air cloud and control the generation of turbulence and explosion waves
from neighboring modules, has been designed and generally used as one of the efficient
explosion mitigating approaches in the oil and gas industry(Syed et al.; Kang et al., 2016).
Blast walls could be installed very close to or are part of the explosion protecting
targets/temporary refuge (HSE, 2006). In other words, there is little space limitation on blast
wall’s application. Therefore, instead of safety gap, blast wall is chosen in this study to
investigate its explosion mitigation effect on the cylindrical FLNG platform in the East-West
direction.
There have been an extensive amount of studies regarding the structural analysis and design
of blast walls (Louca et al., 2004; Langdon and Schleyer, 2005, 2006; Schleyer et al., 2007).
However, most studies were about the blast wall material and structural response analysis,
while there is very little concern about the overpressure consequences of the arrangement
design of blast wall. Moreover, the existing offshore applications of blast walls were tend to
be in some traditional structures (Louca et al., 1996; Boh et al., 2007; Sohn et al., 2013; Kang
et al., 2016), but no research has been done on the state-of-the-art offshore structure - FLNG,
let alone the cylindrical-shaped FLNG.
In this paper, the same cylindrical FLNG platform investigated previously (Li et al., 2016a),
has been utilized. Comparing to the deterministic study of safety gap, both of worst-scenario

and probabilistic studies on a series of different blast wall layout are carried out, more
variabilities are considered. The widely-accepted and highly-validated CFD software FLACS
(Silvestrini et al., 2008; Hansen et al., 2010; Li et al., 2014; Hansen and Johnson, 2015) is
employed to perform gas dispersion and explosion simulations. Overall, the risk analysis is
composed of 120 gas dispersion simulations with different variables including 4 varying
leakage rates, 2 opposite leakage directions, 3 different gas release locations, 4 sets of blast
wall layout designs plus the original platform configuration without blast walls. In terms of
the investigation of gas explosion safety, about 200 monitor points are assigned to record the
overpressures in each gas explosion simulation. Therefore, over 16,000 gas explosion
simulation results are accounted by considering all variables, such as different gas cloud
coverages and ignition locations, in the overpressure mitigating design of blast wall layouts.
2. Geometry of the Cylindrical FLNG platform in FLACS
The PRICO® technology-designed FLNG units (Black&Veatch, 2016) are used on the
cylindrical FLNG topside. The layout of all modules including dehydration and mercury
removal facilities, compressors and liquefaction trains, etc. is designed in detail as shown in
Figure 1. The order of these 12 modules is retained the same as that in the ship-shaped FLNG,
except that a U-shape pipe rack is used to connect all modules. It is important to note that the
turret area commonly used in the ship-shaped FLNG is eliminated in this cylindrical hull (Li
et al., 2016a), and the living quarter and workshop is located in the far end of platform with a
certain distance away other modules.
The dimension of each topside module is 30m wide and 40m long, all main structural
components of these modules are converted into boxes and cylinders in the geometry
modelling by using the pre-processor CASD of FLACS (Gexcon, 2015). The total number of
the simplified components is 72,576. The experimentally calibrated sub-grid models of

FLACS are used to account for the influence of small objects, while large objects and walls
are represented on-grid in the porosity calculation of FLACS.
Figure 1 Wireframe of the cylindrical FLNG platform geometry in FLACS
3. Input of gas dispersion and explosion simulation
The major variations in the CFD simulation and risk analysis include leak rate, leak direction,
leak location, gas composition and wind condition. In this study, the investigation into blast
wall’s explosion mitigating effect is only in East-West direction, and the protection target -
living quarter, which was investigated and regarded as the area with the highest level of
potential risks (Huang et al., 2016), is in the very east side (Figure 2). Therefore, the authors
exclusively select west to east wind direction (+ x coordinate in CASD of FLACS) as the
worst wind scenario to examine the gas dispersion of a leakage. The wind speed is fixed as

+4 m/s, and both of east and west leak directions are considered in the gas dispersion
simulation.
Figure 2 Leak locations on the cylindrical FLNG platform
In terms of the choice of leak location, three critical locations in the liquefaction train
modules (as seen in Figure 2) are determined, which is based on the conclusion of previous
work (Li et al., 2016a) that gas leaks in these more congested regions are more likely to
generate bigger volume of stoichiometric gas clouds and transmit more gas cloud to the far
field. Accordingly, the representative leak rates from 0.25kg/s to 96kg/s (Norsok, 2001) for
these three leak locations are chosen in the gas dispersion simulations, as seen in Figure 3.
The inventory of gas composition inside the cylindrical FLNG are summarized in Table 1.

Figure 3 Leak rate data on the cylindrical FLNG platform
Table 1 Gas composition for dispersion and explosion study
Component Export gas
Methane 27%
Ethane 33%
Propane 15%
Hexane 19%
CO2 6%
4. Design of blast wall layout
Figure 4 provides the general overview of the geometry with blast wall installation in front of
the congested modules. In FLACS, all structural components are assumed to be unyielding
during the entire explosion. In other words, the blast walls remain in place even for gas
explosion with extreme overpressures. Therefore, the structural design and analysis of the
blast wall are not considered in this study. Instead, the purpose of using blast wall in the CFD
simulation is to provide interruption of gas cloud propagation from nearby modules and
protection against explosion loads from neighbouring modules. Moreover, this risk analysis is
0.25 0.75 1.5 3 6 12
24
48
96
0
20
40
60
80
100
120
0.1-0.5 0.5-1.0 1.0-2.0 2.0-4.0 4.0-8.0 8.0-16.0 16.0-32.0 32.0-64.0 >64.0
Lea
k r
ate
(k
g/s
)
Leak rate range (kg/s)

aim to investigate the consequences of different gas dispersions and explosions in different
congestion and confinement conditions if blast walls are used.
Consequently, as seen in Figure 5, blast walls are designed as barriers directly next to the
congested modules to account for different confinement scenarios. Due to the fact that only
west to east wind direction is chosen to investigate the high risk region – living quarter, blast
walls are mainly installed on the east side of the module to block the flammable gas cloud
propagating from more congested areas in west. Four essential blast wall layouts are
designed, the red colour represents blast wall in the plane view of the cylindrical FLNG
platform.
Figure 4 Blast wall installed in front of the modules of the cylindrical FLNG

Figure 5 Blast wall layout designs
5. Gas dispersion and gas explosion analysis
5.1 Gas dispersion analysis
5.1.1 Numerical model and input
In the gas dispersion analysis, the grid size of 1m near the leakage is chosen as FLACS relies
on numerous experimentally validated sub-grid models which are in a range of cell sizes
around or above 1m (Hansen et al., 2010; Daubech et al., 2013; Kuznetsov et al., 2015;
Vyazmina and Jallais, 2016). In addition, it is stated in FLACS guidelines that grids of 1-
1.5m should be sufficient for offshore modules > 8m in height (Gexcon, 2015), while the
dimension of the smallest FLNG topside module is 30×40×25 m3, not to mention the entire
size of the cylindrical FLNG platform. Therefore, the grid resolution of 1m is used for the
CFD modelling in this study.
For the specific leak rate, the effective cross-section area of a leak outlet in FLACS is
determined as:

Aum ' (1)
Where m’ is the leak/flow rate, u is the velocity at the outlet, is the gas density and A is
outlet areas.
The gas density of gas composition shown in Table 1 is 1.6 kg/m3, hence, for a representative
low-medium momentum leak rate of 6 kg/s, and outlet leakage velocity of 5 m/s, the effective
cross-section area of leak outlet is calculated as 0.75m2. Consequently, the theoretical grid
size of the leak outlet is determined as 0.87m (i.e. the square root of 0.75 m2), which is
smaller than the initial choice of 1m grid size near leakage. In order to model small leakage
area size (<1 m2), the overall CFD simulation time would be tremendously increased if the
refinement of the grid resolution is performed. For example, the required CPU-time will
increase 16 times when increasing grid resolution by a factor of two (=23+1
) due to 3 spatial
dimensions combined with the time step being proportional to the grid sizes (Hansen and
Johnson, 2015). Moreover, for gas leakages with small leak rates on the large-size cylindrical
FLNG platform, the generated steady state gas cloud size is too small that it could be
confined in just one module (Li et al., 2016a). After the ignition of such small size gas cloud,
the subsequently induced explosion overpressures are not big enough to threaten neighboring
modules (e.g. the living quarter with a safety gap away other congested modules)
Therefore, the low momentum leak rate case (≤ 6 kg/s) is not considered in this study. 4
categories of leak rates, which are 12 kg/s, 24 kg/s, 48 kg/s and 96 kg/s, have been taken into
account to study the possible gas cloud volume and explosion overpressure buildup in all
blast wall layout designs. In addition to the variations of 3 leak locations and 2 leak
orientations, Table 2 summarizes the overall leak cases. The gas monitor region covers all the
modules on the cylindrical FLNG platform, as seen in Figure 6.
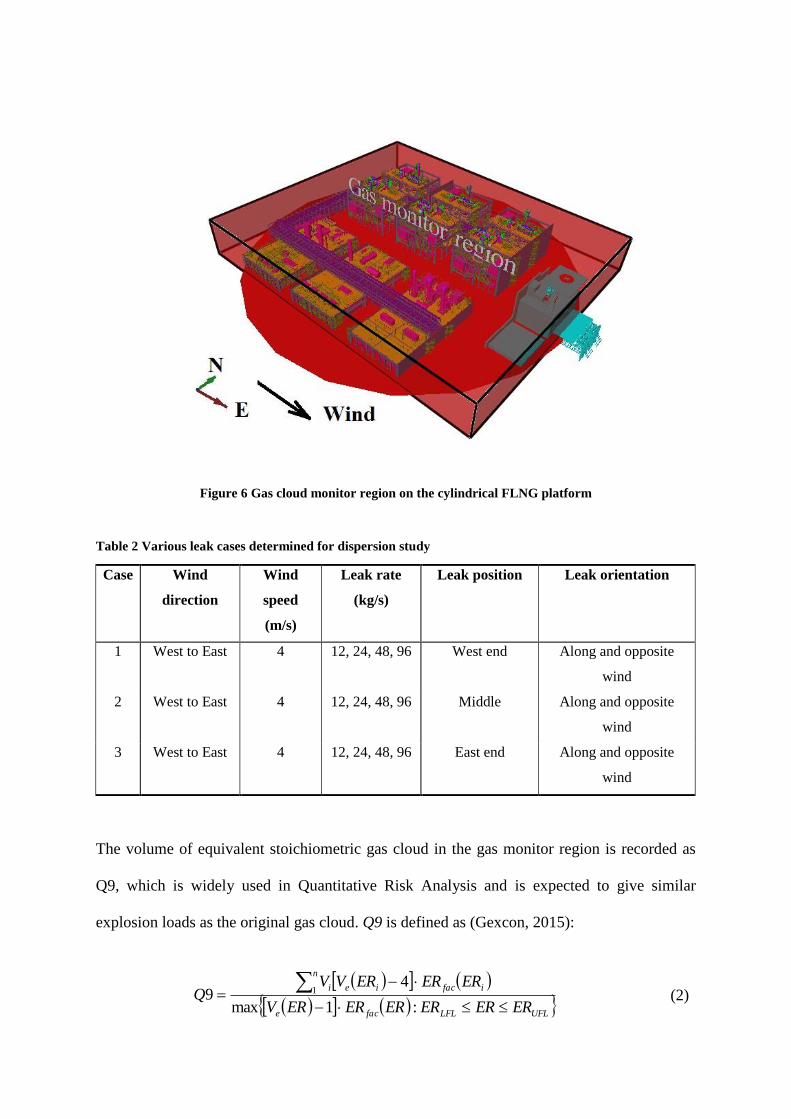
Figure 6 Gas cloud monitor region on the cylindrical FLNG platform
Table 2 Various leak cases determined for dispersion study
Case Wind
direction
Wind
speed
(m/s)
Leak rate
(kg/s)
Leak position Leak orientation
1 West to East 4 12, 24, 48, 96 West end Along and opposite
wind
2 West to East 4 12, 24, 48, 96 Middle Along and opposite
wind
3 West to East 4 12, 24, 48, 96 East end Along and opposite
wind
The volume of equivalent stoichiometric gas cloud in the gas monitor region is recorded as
Q9, which is widely used in Quantitative Risk Analysis and is expected to give similar
explosion loads as the original gas cloud. Q9 is defined as (Gexcon, 2015):
UFLLFLface
n
ifaciei
ERERERERERERV
ERERERVVQ
:1max
49 1 (2)

Where the summation i= 1,…,n is all numerical control volumes inside the gas monitor
region, Vi is the non-blocked open volumes of fluid flow, Ve(ER) is the volume ratio function
of equivalence ratio (ER), and the ER is a measure of the concentration of fuel compare to the
stoichiometric concentration. Ve(ER) and ER are defined as
tricstoichiomeOF
OFER
)/(
/ (3)
unburnt
burnte
V
VV (4)
Where F/O is the ratio of fuel to oxygen, Vburnt is the volume of burnt fuel-air mixture, and
Vunburnt is the fuel-air mixture volume before combustion.
The ER in Equation 2 is set with a value between the Lower Flammability Limit (LFL)
equivalence ratio and Upper Flammability Limit (UFL) equivalence ratio (i.e. ERLFL ≤ ER ≤
ERUFL). The function of ERfac(ER) is a laminar burning velocity profile, which is defined as:
UFLLFLL
iLifac
ERERERERS
ERSERER
:max (5)
Where SL is the laminar burning velocity corrected for lame wrinkling/ Lewis number effects.
5.1.2 Results and discussion of gas dispersion simulations
Firstly, the deterministic study of the worst gas dispersion scenarios is conducted. In the
previous study(Li et al., 2016a), it was concluded that the gas leakage occurring in more
congested regions results in bigger stoichiometric gas clouds. Therefore, here, the gas
dispersion simulations are carried out in the liquefaction train modules located in the middle
of the FLNG topside, where the congestion ratios are the highest. The leak rates are set as

48kg/s, leak directions are assigned along with the wind direction from west to east, and leaks
are placed on the ground in the middle module.
Figure 7 depicts the output of four gas dispersion simulations for gas releases in different
blast wall layouts. Q9 is recorded within the gas flammable range of ERLFL=0.5 to ERUFL=2.5.
The simulation time is terminated at 210s when the stoichiometric gas cloud reaches the
steady state.
(a) Design 1. Blast walls on 1 side (b) Design 2. Blast walls on 2 sides
(c) Design 3. Blast walls on 2 sides (d) Design 4. Blast walls on 3 sides
Figure 7 Gas dispersion simulations for leaks in the middle of different blast wall layouts
For blast wall design layout 1 and design layout 2, it is seen in Figure 7 (a) and (b) that blast
walls in the east end effectively restrain the propagation of the gas cloud. In addition to these
east end walls, extra installed blast walls in other modules in design layout 3 & 4 (as seen in
Figure 7 (c) and (d)), further prevent the cloud size propagating to the living quarter.

Meanwhile, the gas clouds become more concentrated in the middle modules of the design
layout 3 & 4. The richer gas concentrations in these two configurations result in higher ER
going beyond the upper flammability limit (e.g. ERUFL=2.5), which on the other hand reduces
the overall stoichiometric gas cloud size. To summarize, the results of this worst-scenario
investigation indicate that extra blast wall is beneficial in confining total gas cloud size.
However, the comparison above is only carried out based on 4 worst-scenario cases (high-
momentum leaks) of the overall 120 scenarios. In order to investigate all leak rate cases
thoroughly, cases from Table 2 for all blast wall layouts are modelled by using FLACS. The
stoichiometric gas cloud size of each case is recorded at the time when the gas dispersion
simulation reach steady state. By sorting the gas cloud size from small to large and giving
equal leak frequencies to all leakage cases, the exceedance curves of gas cloud sizes within
the gas monitor region are summarized in Figure 8.
Figure 8 Exceedance curve of gas cloud sizes for all leak rate scenarios

Figure 9 Exceedance curve of gas cloud sizes over 3104 m
3 for different leak rate scenarios
As seen in Figure 8, for stoichiometric gas cloud size smaller than 3104 m
3, all blast wall
designs have greater frequencies compared to the original cylindrical FLNG without blast
wall. In other words, these blast walls on the FLNG platform have higher chances to induce
larger gas clouds, which is due to the increase of confinement in these congested modules.
However, it is worth mentioning that all these enlarged gas clouds only exist in the cases
where leakages are at leak rates of 12 kg/s and 24 kg/s. For these low leak rate gas
dispersions, the corresponding gas clouds are much smaller than that in 48 kg/s and 96 kg/s
gas release cases, even though the gas cloud sizes are enlarged to some extent. Precisely, for
a liquefaction train with dimension of 30×40×25 m3, the gas cloud sizes equal or smaller than
3104 m
3 by gas leaking with rates of 12 kg/s and 24 kg/s will be mainly retained in the
liquefaction train itself. It is not expected to see the subsequent explosion overpressures of
the 12 kg/s and 24 kg/s cases after ignition are sufficient to threaten structures and people in
far field.
By contrast, for the gas dispersions at leak rate 48kg/s and 96kg/s, a distinct tendency of
cloud size restriction due to blast wall is seen in Figure 9. It is shown that most of the blast

wall layouts possess lower frequencies at the same stoichiometric gas cloud size. For instance,
for gas cloud size of 4.7104 m
3, the exceedance probability in blast wall layout No. 4 is
only 12% while it is 24% for the original configuration without blast walls. That is, if the
exceedance probability is read at 24%, the gas cloud size of 4.7104 m
3 could be reduced to
4.1104 m
3 by using the blast wall layout No. 4.
Figure 10 Averaged gas cloud size for different leak rate scenarios
In order to have a straightforward understanding of the gas cloud mitigating effect of blast
walls at different leak rates, the stoichiometric gas clouds at all locations are averaged and
displayed in Figure 10. It is seen in the figure that the blast wall only play active role in gas
cloud reducing when leakage rate goes over 48kg/s. Under such condition, gas dispersions
occurring on the cylindrical FLNG platform with blast wall layout No. 2 and layout No. 4
have the smallest stoichiometric gas cloud sizes. However, blast wall layout No. 2 is the most
disadvantageous configuration if the leak rate is 24kg/s. Overall, blast wall layout No. 4 is the
optimal design amongst all the configurations in terms of overall gas cloud size in all gas
dispersion cases.
In summary of all data of the exceedance curves and the averaged gas cloud size chart, it is
concluded that blast walls could be meaningless and even detrimental for gas dispersions
with low leak rates (≤24 kg/s). However, for high-momentum leakages (i.e. leak
rate >24kg/s), an appropriately designed blast wall system can effectively reduce the gas
cloud size. Comparing to these low leak rate (≤24 kg/s) gas dispersions with gas cloud sizes
below 3104 m
3, the high momentous leak cases with leak rates of 48 kg/s and 96 kg/s result
in much larger gas clouds propagating to neighbouring modules or even far field. Ignitions to
these large gas clouds can lead to more severe consequences to living quarter in far field.
Therefore, blast wall designs to these large gas cloud scenarios are more meaningful since the
blast walls are more efficient in reducing high momentous leak cases’ gas clouds.
Accordingly, the further investigation into gas explosion is required and carried out in the
following section.
5.2 Explosion analysis
5.2.1 Numerical model and input
All gas dispersion data above are utilized in the risk analysis of the cylindrical FLNG
subjected to gas explosion. As seen in Figure 11, the gas clouds are situated in 4 different
locations covering the entire platform so that the overall gas explosion consequences for all
modules could be analyzed. For all gas clouds, the plan view dimension is fixed as 10080
m2 so that at least 4 modules are covered by one gas cloud, while the height of cloud is
varying according to the gas dispersion simulation results obtained previously. For each gas
explosion simulation, the gas cloud is ignited in the ground center of one module, where the
congestion ratio is the highest.

For gas explosion simulation on the cylindrical FLNG platform, about 200 monitor points are
assigned on the ground to record the explosion overpressures. In addition, by taking all
variables of 4 different gas cloud coverages, and 4 different ignition locations of each gas
cloud into account, about 3200 explosion overpressures are monitored for each blast wall
layout design. Eventually, by multiplying the total number of 4 different blast wall layouts
plus the original layout without blast wall, more than 16,000 overpressures are recorded in
this probabilistic study of gas explosion.
Figure 11 Overview of gas cloud coverage and ignition locations
5.2.2 Results and discussion from explosion simulations
5.2.2.1 The integral analysis of gas explosion
Figure 12 shows the overpressure output of one of the gas explosion simulations for the
original FLNG platform without blast walls. The gas cloud size utilized in this explosion
simulation is corresponding to the dispersion simulation with the leak rates of 48kg/s in
Section 5.1.2. The ignition is in the center of the gas cloud located in the east end of the

platform. The overpressures are displayed in range of 0.1 to 2 bar, the red color represents the
maximum overpressure. It is seen that the gas explosion blast is spreading from the ignition
center to all surrounding objects, the maximum overpressures are observed in congested
region near the edge of the gas cloud, and the living quarter is subjected to about 1.0 bar
overpressure.
The comparison between the original platform and the blast wall layouts is then conducted
and shown in Figure 12 and Figure 13. The blast wall layout No. 1 in Figure 13 (a)
effectively reduce the overpressure from 1.0 bar to 0.6 bar near the living quarter, while an
extra blast wall installed in the layout No. 2 in Figure 13 (b) restricts more overpressures in
the neighboring area of the living quarter. However, the overpressure concentrations are seen
near the blast walls, over 2 bar overpressure could be reflected to the confined modules from
the blast walls unavoidably.
Figure 12 Gas explosion simulation of the original platform without blast wall configurations

(a) Design 1. Blast walls on 1 sides (b) Design 2. Blast walls on 2 sides
(c) Design 3. Blast walls on 2 sides (d) Design 4. Blast walls on 3 sides
Figure 13 Gas explosion simulations of different blast wall layouts
The issue of overpressure concentration is considerably addressed by adding additional blast
walls, as seen in Figure 13 (c) and (d). Precisely, the living quarter is subjected to lower
overpressures since blast walls in layout No. 4 more efficiently mitigate overpressures from
1.0 bar to below 0.1 bar (Figure 13 (d)). However, the above comparison of these design is
merely the deterministic analysis on gas explosion, which is corresponding to the worst-
scenario cases in previous section of gas dispersion analysis.
In order to probabilistically consider all gas dispersion output as input in the gas explosion
simulations, these 120 different gas clouds obtained previously are ignited in the gas
explosion simulations of this section. The exceedance curves of gas explosion simulations are
summarized in Figure 14. Equal frequencies are allocated to all monitored overpressures,
which are sorted from small to large.

Figure 14 Exceedance curve of overpressures for all leak rate scenarios
Figure 14 shows the integral overpressure data for all blast wall designs. Regardless of the
varying leak rate consequences, all blast wall layouts are detrimental in explosion mitigating
if the resulting overpressures are below 0.3 bar. Whereas if the gas explosions result in
overpressures over 0.3 bar, there are more than 50% possibilities that blast wall layout No.2,
3, 4 are beneficial to the integral structures, namely, all of the recorded overpressures can be
mitigated by using blast walls. It is noted that the overpressures over 0.3 bar have already
reach the detonation status of a gas explosion, which is more destructive to structures and
personals, compared to the pressure obtained in deflagration stage. In other words, blast wall
layouts of No. 2, 3, 4 here are efficient in gas explosion mitigating for gas explosions with
detonation overpressures over 0.3 bar. Amongst the designs, the blast wall layout No. 4 with
lowest exceedance frequencies in Figure 14 is the optimum.

The individual exceedance curves of gas explosion overpressure resulted from all different
leak rate scenarios are shown from Figure 15 to Figure 18. For leak rate of 12 kg/s, the gas
dispersion simulations result in around 0.5104 m
3 averaged gas cloud size (Figure 10),
which is less than one-tenth of that (6104 m
3) from the gas dispersion of leak rate 96kg/s
(Figure 10). These small gas clouds generates explosion overpressures smaller than 0.1 bar
for all blast wall layouts as seen in Figure 15, and the overpressures obtained from the
original cylindrical FLNG platform without blast walls are even too small to display.
Therefore, an extra diagram inside Figure 15 is added.
Overall, the data of Figure 15 indicates that blast walls are not beneficial in overpressure
reduction for the 12 kg/s leak cases as the recorded overpressures of blast-wall cases are
higher than that of no-blast-wall cases. However, the exceedance frequencies for all blast
wall configurations are almost below 10% if overpressures are around 0.1 bar, which is below
the threshold of 0.17 bar that causes distortion of steel frame structures, and 0.28 bar
threshold of storage tank rupture pressure (Santamaría and Braña, 1998; Shariff et al., 2006;
Lobato et al., 2009). For most cases that exceedance frequencies above 50%, overpressures
are even smaller than 0.05 bar. These smaller overpressures in low-leak-rate cases will have
little impact on the offshore structures, which is not major concerns of this study.
In terms of the results of gas explosions for 24 kg/s gas leak cases, obvious detrimental blast
wall effect is seen in Figure 16 that overpressures in all layouts are higher than 0.2 bar, which
are non-negligible and can cause partial demolition and collapse of wall structures (Lobato et
al., 2009). Moreover, it is evident that all blast wall layouts result in higher overpressures
than that in the original cylindrical FLNG without blast walls.

Figure 15 Exceedance curve of overpressures for leak rate at 12 kg/s
Figure 16 Exceedance curve of overpressures for leak rate at 24 kg/s
By contrast, the benefits of blast walls are seen in Figure 17 and Figure 18 where the gas
clouds used in the gas explosion simulations are from leak rates of 48 kg/s and 96 kg/s. It is
shown in Figure 17 that blast wall layout No. 2 and No. 3 have slightly lower exceedance
frequencies than the original configuration without blast walls, while blast wall layout No. 4

shows its distinct advantage of overpressure mitigation that most of the overpressures in this
design have much lower frequencies than others. Figure 18 further indicates the blast walls’
benefits in explosion overpressure mitigating in the 96 kg/s leak case. The overpressure
mitigation efficiency is more obvious for blast wall layout No. 2 and No. 4. For instance, as
seen in Figure 18, the exceedance probabilities of overpressures over 0.4 bar in the originally
no-blast-wall platform significantly drop from 83% to 63% by using blast wall layout No. 2
and No. 4.
Figure 17 Exceedance curve of overpressures for leak rate at 48 kg/s

Figure 18 Exceedance curve of overpressures for leak rate at 96 kg/s
Figure 19 Averaged overpressures for different leak rate scenarios
Therefore, according to the exceedance curves above, it is concluded that blast walls are only
effective in explosion mitigation for overpressures over the detonation status, blast wall

layout No. 2 and No. 4 are particularly beneficial in overpressure mitigation for high leak rate
scenarios. Additionally, Figure 19 compares all blast wall designs by averaging all monitored
overpressures in all different leak rate scenarios. Although it is mentioned that blast wall
layout No. 2 and No. 4 are the most effective blast wall designs for high leak rate gas
releases, blast wall layout No. 2 surprisingly increased the averaged overpressures for the
integral structure at leak rate of 24 kg/s, by contrast, blast wall layout No. 4 is consistent in
overpressure mitigation under the same circumstance. Consequently, blast wall layout No. 4
is again approved to be the optimal design in the integral analysis of gas explosion.
5.2.2.2 Investigation of the living quarter subjected to gas explosions
In addition to the integral analysis of gas explosion, another major interest of this study is to
investigate the protection target – living quarter, which is identified as it has the highest level
of potential risks (Huang et al., 2016). In order to monitor the overpressures in the living
quarter area, for each gas explosion scenario, 10 monitor points are assigned.

Figure 20 Averaged overpressures around the living quarter for different leak rate scenarios
Figure 20 shows the averaged overpressures from all monitors around the living quarter in
different leak rate scenarios. The similar overpressure mitigation effects of blast wall for
large leak rate (48 kg/s and 96 kg/s) cases are seen. However, comparing to the overpressure
mitigation in the integral structure in Figure 19, the blast wall layout No. 4 reduces more
averaged overpressures around the living quarter at 96 kg/s leakage case.
Furthermore, the detailed explosion frequency calculation is performed in this section. The
exceedance frequency of overpressure at the living quarter are calculated by using the
monitored overpressures over 1000 scenarios along with the leak frequencies and ignition
probability determined previously (Gexcon, 2012).
Table 3 indicates the ignition intensities for all releases from 12 kg/s to 96 kg/s in this study.
The exposed area in the CFD simulations is corresponding to the area on the vessel exposed
to Equivalent Stoichiometric gas Cloud (ESC) from a release in the liquefaction module. The
leak frequency is taken as 3.33 10-1
per year according to the Guidelines for quantitative
risk assessment Purple Book (Uijt and Ale, 2005). Based on the ignition intensities and the
gas dispersion simulation results, the ignition probability is determined as 0.36%. The
explosion frequency is calculated by multiplying the leak frequency and ignition probability,
therefore, the total explosion frequency is approximated as 1.2 10-3
per year.

Table 3 Discrete and continuous ignition intensities for releases (> 6 kg/s)
Figure 21 Exceedance curve of overpressures around the living quarter for all leak rate scenarios
By summarizing all gas explosion simulation data around the living quarter, the probability of
exceedance curves with frequencies are shown in Figure 21. Unlike the integral overpressure
distribution on the entire FLNG platform in Section 5.2.2.1, the leak frequency and ignition
probability are considered in the explosion risk analysis on the specific target - the living
quarter. For each investigation on the blast wall designs, the overpressure occurring
frequencies can be read from Figure 21 and used as the index for engineers to choose the
Discrete Adjustment Factors for Ignition Source Categories # items or sq. meter Adjust Discrete
Gas Age Maintenance Manning Technology Overall Module Total
Pump 2.10E-07 Pump 16 0.46 1.54E-06
Compressor 5.10E-06 Compressor 4 0.46 9.36E-06
Generator 6.20E-06 Generator 0 0.46 0.00E+00
Electrical eq. * 2.70E-08 Electrical eq. 0.90 0.90 1.00 0.60 0.49 Electrical eq. * 16486 0.49 2.16E-04
Other equipment * 2.10E-09 Other eq. 0.90 0.90 1.00 0.60 0.49 Other eq. * 16486 0.49 1.68E-05
Other ** 1.70E-08 Other 1.00 1.00 1.00 1.00 1.00 Other ** 6882 1.00 1.17E-04
Personnel * 4.00E-08 Personnel 1.00 0.95 0.60 1.00 0.57 Personnel * 16486 0.57 3.76E-04
* per m2 exposed to gas SUM 7.37E-04
** per m2 exposed to gas - Only one deck level
Continuous Adjustment Factors for Ignition Source Categories # items or sq. meter Adjust Continuous
Gas Age Maintenance Manning Technology Overall Module Total
Hot work (# hours per 365*24h) 1.14E-02 - - - - - - - - - 1.14E-02
Pump 9.60E-05 Pump 16 0.46 7.05E-04
Compressor 2.30E-03 Compressor 4 0.46 4.22E-03
Generator 3.50E-03 Generator 0 0.46 0.00E+00
Electrical equipment * 2.60E-06 Electrical eq. 0.90 0.90 1.00 0.60 0.49 Electrical eq. * 16486 0.49 2.08E-02
Other equipment * 2.60E-06 Other eq. 0.90 0.90 1.00 0.60 0.49 Other eq. * 16486 0.49 2.08E-02
Other ** 1.30E-06 Other 1.00 1.00 1.00 1.00 1.00 Other ** 6882 1.00 8.95E-03
Personnel * 3.00E-06 Personnel 1.00 0.95 0.60 1.00 0.57 Personnel * 16486 0.57 2.82E-02
* per m2 exposed to gas SUM 9.51E-02
** per m2 exposed to gas - Only one deck level
0.46
Rotating
machinery0.90 0.85 1.00 0.60 0.46
Rotating
machinery0.90 0.85 1.00 0.60

appropriate blast wall design more confidently. For example, for 0.1 bar explosion design, it
is seen in Figure 21 that the overpressure exceedance frequency from the original platform
greatly falls from 4.5 10-5
per year to only 0.710-5
per year by using the optimal blast
wall design – layout No. 4. Overall, the explosion risk analysis in this paper provides a solid
explosion design process and the optimization of blast walls by comparing data of
overpressures and frequencies in the exceedance curves.
6. Conclusion
After investigating the safety gap effect on the cylindrical FLNG platform (Li et al., 2016a;
Li et al., 2016b), another gas explosion mitigating measure – blast wall is studied in this
paper. Both of deterministic and probabilistic studies on the blast wall layouts subjected to
gas dispersion and gas explosion have been conducted. The gas dispersion and gas explosion
simulations are performed by using CFD-based software – FLACS.
In the previous investigation of the cylindrical FLNG platform, safety gaps were placed in
North-South direction as the minimum required open space was sufficient exclusively in this
direction to interrupt the propagation of flammable gas and explosion overpressure (Li et al.,
2016a; Li et al., 2016b). However, the space between two adjacent modules in East-West
direction is limited. Therefore in this study, blast walls, which can be installed very close to
protecting modules to control and mitigate excessive overpressure loading, are installed in the
East-West direction to address the space limitation issue. Four sets of different blast wall
layouts plus the original no-blast-wall FLNG platform are modelled in FLACS.
Firstly, over 120 gas dispersion simulations with variables including 4 different leak rates, 3
different leak locations, 2 different leak orientations, and 5 layouts with and without blast
walls, are carried out. The results indicate that all blast wall designs are not beneficial for
reducing stoichiometric gas cloud size if the leakage rate is equal or below 24 kg/s, while

mitigation effect of blast wall is exclusively seen for blast wall layout No. 2 and No. 4 in
large rate scenarios ( leak rate > 24 kg/s).
Subsequently, the investigation of gas explosions with over 3200 scenarios for each blast wall
design scheme is performed, all gas cloud results from gas dispersion simulations are used as
the input in the explosion simulations. The gas explosion analysis includes both of the
integral study of all blast wall layouts on the cylindrical FLNG topside and individual safety
study on the living quarter, which has the highest level of potential risks (Huang et al.,
2016).
Globally, similar to the controversial results seen in gas dispersion simulations,
overpressures recorded on the integral FLNG platform with blast walls are enhanced in low-
leak-rate (12 kg/s and 24 kg/s) scenarios, while blast wall only plays positive role in
explosion overpressure mitigating in high-release-rate (48 kg/s and 96 kg/s) cases. It is worth
noting that overpressures in low-leak-rate scenarios are with low possibilities (e.g. below
10%) and below the thresholds of destructive overpressures (~ 0.1 bar) to fundamental
offshore structures, which are nearly negligible in offshore structural response study.
However, a certain level reduction of overpressures (i.e. >1 bar) by using blast wall in high-
release-rate scenarios can significantly improve structure’s safety. The results from the
integral analysis of gas explosion in high-release-rate scenarios show that more blast walls
mitigate more overpressures on the entire FLNG platform. Amongst all blast wall layouts,
No. 4 blast wall layout is the most ideal design that blast walls considerably decrease the
overpressures by more than 20% in high-release-rate (96 kg/s) scenario.
Locally, for the living quarter, the layout optimization of blast wall is further conducted by
summarizing explosion overpressure frequencies in the probabilistic study. The leak
frequencies and ignition probabilities are taken into account. The exceedance curves of

overpressures for the living quarter have further validated the effectiveness of overpressure
mitigation by using blast walls. Especially, the optimum design of blast wall layout No. 4 can
reduce more than 80% of the overpressure exceedance frequency (e.g. 4.5 10-5
per year to
0.710-5
per year ) for a safety design with maximum overpressures of 0.1 bar in the living
quarter.
To sum up, the optimization of the blast wall layout on the cylindrical FLNG platform has
been carried out globally and locally. The results from the gas dispersion and gas explosion
analysis indicate that blast wall, which requires little installation space, is an optimal
alternative to safety gap to mitigate flammable gas cloud and gas explosion overpressures,
particularly in high-leak-rate and space-limited scenarios. Comparing to the worst-scenario
study conducted previously, the probabilistic study in this paper has considered more
uncertainties and delivers more convincing CFD simulation data. Moreover, this paper
provides a comprehensive safety evaluation procedure for engineers to design the gas
dispersion and gas explosion mitigation system – blast wall layout on a cylindrical FLNG
platform.

References
Black&Veatch. 2016. Floating liquefied natural gas.
https://en.wikipedia.org/wiki/Floating_liquefied_natural_gas.
Boh, J., Louca, L.A., Choo, Y., 2007. Finite Element Analysis of Blast Resistant Structures in
the Oil and Gas Industry.
Daubech, J., Proust, C., Gentilhomme, O., Jamois, C., Mathieu, L., 2013. Hydrogen - air
vented explosion: new experimental data. Proc. of 5th ICHS, Brussels.
Gexcon. 2012. FLNG Concept Explosion Study - Explosion Risk Analysis. Ref. No.:
GexCon-2011-F40836-RA-01.
Gexcon. 2015. FLACS v10.4 User’s Manual (Doxygen: Norway).
Hansen, O.R., Gavelli, F., Ichard, M., Davis, S.G., 2010. Validation of FLACS against
experimental data sets from the model evaluation database for LNG vapor dispersion.
J Loss Prevent Proc. 23 (6), 857-77.
Hansen, O.R., Johnson, D.M., 2015. Improved far-field blast predictions from fast
deflagrations, DDTs and detonations of vapour clouds using FLACS CFD. J Loss
Prevent Proc. 35, 293-306.
Hetland, J., Kvamsdal, H.M., Haugen, G., Major, F., Karstad, V., Tjellander, G., 2009.
Integrating a full carbon capture scheme onto a 450 MWe NGCC electric power
generation hub for offshore operations: Presenting the Sevan GTW concept. Appl
Energ. 86 (11), 2298-307.
HSE. 2006. Structural strengthening of offshore topsides structures as part of explosion risk
reduction methods. In Research Report 489. UK: Health & Safety Executive
Huang, Y.M., Ma, G.W., Li, J.D., Hao, H., 2016. Multi-level explosion risk analysis
(MLERA) for accidental gas explosion events in super-large FLNG facilities. J Loss
Prevent Proc. In Press.
Kang, K.-Y., Choi, K.-H., Choi, J., Choi, Y., Choi, J.-M., 2016. Explosion induced dynamic
responses of blast wall on FPSO topside: Blast loading application methods
International Journal of Naval Architecture and Ocean Engineering. In Press.
Kuznetsov, M., Friedrich, A., Stern, G., Kotchourko, N., Jallais, S., L'Hostis, B., 2015.
Medium-scale experiments on vented hydrogen deflagration. J Loss Prevent Proc. 36,
418-30.
Langdon, G.S., Schleyer, G.K., 2005. Inelastic deformation and failure of profiled stainless
steel blast wall panels. Part I: experimental investigations. Int J Impact Eng. 31 (4),
341-69.
Langdon, G.S., Schleyer, G.K., 2006. Deformation and failure of profiled stainless steel blast
wall panels. Part III: finite element simulations and overall summary. Int J Impact
Eng. 32 (6), 988-1012.
Li, J.D., Abdel-jawad, M., Ma, G.W., 2014. New correlation for vapor cloud explosion
overpressure calculation at congested configurations. J Loss Prevent Proc. 31, 16-25.
Li, J.D., Ma, G.W., Abdel-Jawad, M., Huang, Y.M., 2016a. Gas dispersion risk analysis of
safety gap effect on the innovating FLNG vessel with a cylindrical platform. J Loss
Prevent Proc. 40, 304-16.
Li, J.D., Ma, G.W., Hao, H., Huang, Y.M., 2016b. Gas explosion analysis of safety gap effect
on the innovating FLNG vessel with a cylindrical platform. J Loss Prevent Proc. 44,
263-74.

Lobato, J., Rodriguez, J.F., Jimenez, C., Llanos, J., Nieto-Marquez, A., Inarejos, A.M., 2009.
Consequence analysis of an explosion by simple models: Texas refinery gasoline
explosion case. Afinidad. 66 (543), 372-79.
Louca, L.A., Boh, J.W., Choo, Y.S., 2004. Design and analysis of stainless steel profiled
blast barriers. Journal of Constructional Steel Research. 60 (12), 1699-723.
Louca, L.A., Punjani, M., Harding, J.E., 1996. Non-linear analysis of blast walls and
stiffened panels subjected to hydrocarbon explosions. Journal of Constructional Steel
Research. 37 (2), 93-113.
Naciri, M., Waals, O., de Wilde, J., 2007. Time domain simulations of side-by-side moored
vessels lessons learnt from a benchmark test. Proceedings of the 26th International
Conference on Offshore Mechanics and Arctic Engineering, Vol 1, 801-11.
Norsok. 2001. Norsok Standard - Risk and emergency preparedness analysis Z-013 (Norway:
Norwegian Technology Centre).
Santamaría, J.M., Braña, P.A., 1998. Risk analysis and reduction in the chemical process
industry (Blackie academic Professional, London).
Schleyer, G.K., Lowak, M.J., Polcyn, M.A., Langdon, G.S., 2007. Experimental investigation
of blast wall panels under shock pressure loading. Int J Impact Eng. 34 (6), 1095-118.
Shariff, A.M., Rusli, R., Leong, C.T., Radhakrishnan, V.R., Buang, A., 2006. Inherent safety
tool for explosion consequences study. J Loss Prevent Proc. 19 (5), 409-18.
Shell-Global. 2016. Prelude FLNG – overview. http://www.shell.com/about-us/major-
projects/prelude-flng/prelude-flng-an-overview.html.
Silvestrini, M., Genova, B., Trujillo, F.J.L., 2008. Correlations for flame speed and explosion
overpressure of dust clouds inside industrial enclosures. J Loss Prevent Proc. 21 (4),
374-92.
Sohn, J.M., Kim, S.J., Kim, B.H., Paik, J.K., 2013. Nonlinear structural consequence analysis
of FPSO topside blastwalls. Ocean Engineering. 60, 149-62.
Songhurst, B., 2016. Floating Liquefaction (FLNG): Potential for Wider Deployment
(University of Oxford).
Suardin, J.A., McPhate, A.J., Sipkema, A., Childs, M., Mannan, M.S., 2009. Fire and
explosion assessment on oil and gas floating production storage offloading (FPSO):
An effective screening and comparison tool. Process Saf Environ. 87 (3), 147-60.
Syed, Z.I., Mohamed, O.A., Rahman, S.A., Non-linear Finite Element Analysis of Offshore
Stainless Steel Blast Wall under High Impulsive Pressure Loads Procedia
Engineering. 145, 1275-82.
Uijt, P.A.M., Ale, B.J.M., 2005. Guidelines for quantitative risk assessment. Ministerie van
Verkeer en Waterstaat, VROM.
Vyazmina, E., Jallais, S., 2016. Validation and recommendations for FLACS CFD and
engineering approaches to model hydrogen vented explosions: Effects of
concentration, obstruction vent area and ignition position. Int J Hydrogen Energ. 41
(33), 15101-09.
White, J., Longley, H., 2009. FLNG technology shows promise for stranded gas fields.
Offshore. 69 (11), 78-79.