optimal allocation of capacitor for iraqi distribution ... allocation of capacitor for iraqi...
TRANSCRIPT
International Journal of Computer Applications (0975 – 8887)
Volume 143 – No.3, June 2016
39
Optimal Allocation of Capacitor for Iraqi Distribution
Network using FLC-PSO Controller
Afaneen Anwar Abbood Asst. professor,
Electrical Engineering Dep. Faculty of Enginnering,
University of Technology, Baghdad, Iraq
Abbas Kadhim Dhaher Master Student Course
Electrical Engineering Dep. Faculty of Enginnering,
University of Technology, Baghdad, Iraq
ABSTRACT The aim of this work is obtaining the optimal power flow for
the Iraqi distribution network represented by Al-
RUSTAMIYA_Feeder09, through adding the capacitors to the
system in order to reach the best improvement of voltage
profile and power losses reduction. . A Fuzzy Logic (FLC)-
Particle Swarm Optimization (PSO) controller was proposed
to detect the optimal location and size of the capacitor banks
in electrical distribution system. Three load variation levels
were considered during the study those are 60%, 80%, and
100% load variation. From the obtained results it was very
clear that the proposed intelligent algorithm was very accurate
and efficient for obtaining the optimal location and size of the
capacitors in the system.
Keywords Reactive power control; Capacitor Placement and Sizing;
FLC-PSO Approach, Iraqi distribution network
1. INTRODUCTION The power supplied from electrical distribution system is
composed of both active and reactive components. Overhead
lines, transformers and loads consume the reactive power. The
distribution network is always suffering from load demand
growing; this lead to increase the burden on the power system
and reduces the voltage levels. In order to improve the
efficiency of any power system, the losses at the distribution
level must be reduced. The reactive power control will
improve the voltage profile, reduces the system losses and
improves the system efficiency.
Many solutions have been used to reduce these losses and
improves the voltage profiles such as network reconfiguration,
installing shunt capacitor, voltage regulators placement, etc.
In this work, locating the optimal location and size of
capacitors were considered for achieving voltage profile
improvement and losses reduction in the distribution system.
Even though considerable amount of research work was done
in the area of optimal capacitor placement [2 to 13], there is
still a need to develop more suitable and effective methods for
the optimal capacitor placement.
In this work, a controller combining two intelligent algorithms
FLC-PSO was proposed. The FLC algorithm provides a
remedy for any lack of uncertainty in the data. It has the
advantage of including heuristics and representing
engineering judgments into the optimal capacitor placement
problem, so the solutions from this approach can be easily
analyzed to determine optimal capacitor locations. On the
other hand, PSO algorithm is more useful in obtaining the
optimal capacitor sizes. The proposed FLC-PSO controller
was implemented on Iraq practical rural 62-node distribution
system. Fixed capacitors were used because they are already
installed in Iraqi distribution system.
2. PROBLEM FORMULATION Shunt capacitor banks connected to a power system are the
most economical source to meet the reactive power
requirement of inductive loads and transmission lines
operating at lagging power factor. By using shunt capacitor,
the magnitude of the source current can be reduced; the power
factor improved, and reduce the voltage drop between the
sending end and the load end. The main problem of capacitor
placement is to determine the location, type, and size of
capacitors to be placed on a system, the problem includes the
following inserting constraints:
1. Bus Voltage Limits:
The bus voltage magnitudes are to be kept within acceptable
operating limits throughout the optimization process:
𝑉𝑚𝑖𝑛 . ≤ 𝑉𝑖 ≤ 𝑉𝑚𝑎𝑥 . …..…………..(1)
2. The number and sizes of permissible capacitor banks
constraint:
The number of capacitor banks can be expressed to satisfy the
following expression:
𝑄𝑐 ≤ 𝑄𝑡𝑚𝑖=1 ………………..……..…(2)
3. The line current (I) should be less than the line rated
current (Irated).
I ≤ Irated …………………………………..(3)
4. Power losses after the capacitor placement must less or
equal to Power losses before the capacitor placement
Ploss (q+1) ≤ Ploss (q) …………………….(4)
Where:
Ploss (q+1): Power losses after the capacitor placement
Ploss (q) : Power losses before the capacitor placement
The total I2R losses (PL) for a distribution system with n
number of branches is given by:
𝑃𝐿= 𝐼𝑖2𝑛
𝑖=1 𝑅𝑖 …….5
Where 𝐼𝑖 is the magnitude of the branch current. 𝑅𝑖 is the
resistance of the 𝑖𝑡ℎ branch . Since the branch current has two
components 𝐼𝑎 and 𝐼𝑟 , then the losses of the active and
reactive components of the current can be calculated as:
𝑃𝐿𝑎 = 𝐼𝑎𝑖2𝑛
𝑖=1 𝑅𝑖 …….6

International Journal of Computer Applications (0975 – 8887)
Volume 143 – No.3, June 2016
40
𝑃𝐿𝑟= 𝐼𝑟𝑖2𝑛
𝑖=1 𝑅𝑖 …….7
Where PLa associated with the active component of branch
currents, PLa cannot be reduced because all active power
must be supplied by the source at the root bus, supplying part
of the reactive power demand locally can minimize the loss
PLr associated with the reactive component of branch
currents. The estimation of candidate nodes to place the
capacitors helps in reduction in the search space for the
optimization procedure, Power Losses Indices method is used
for capacitors placement.
Capacitors can be placed on the nodes with the highest
suitability. A load flow solution for the original system is
required to obtain the initial real and reactive power losses.
By compensating the total reactive load at every node of the
distribution system, the power loss reduction is obtained using
the load flow program. The loss reductions are then, linearly
normalized into a (0-1) range with the largest loss reduction
having a value of 1 and the smallest one having a value of 0,
The power Loss Index value for nth node was calculated using
the equation:
𝑃𝐿𝐼 𝑛
= 𝐿𝑜𝑠𝑠𝑒𝑠 𝑟𝑒𝑑𝑢𝑐𝑡𝑖𝑜𝑛 𝑛 − 𝐿𝑜𝑠𝑠𝑒𝑠 𝑟𝑒𝑑𝑢𝑐𝑡𝑖𝑜𝑛 𝑚𝑖𝑛
(𝐿𝑜𝑠𝑠𝑒𝑠 𝑟𝑒𝑑𝑢𝑐𝑡𝑖𝑜𝑛 𝑚𝑎𝑥 − 𝐿𝑜𝑠𝑠𝑒𝑠 𝑟𝑒𝑑𝑢𝑐𝑡𝑖𝑜𝑛 𝑚𝑖𝑛 … (8)
3. THE PROPOSED INTELLIGENT
CONTROLLER The main benefit of the intelligent methods is their flexibility
for handling different qualitative limitation. These methods
can obtain several optimal solutions by doing a single
simulation run. Therefore, they are relatively suitable for
overcoming optimization problems. The techniques are in
general based on biologically inspired strategies for solving
problems. In this work, a combined FL-PSO controller is used
to obtain optimal placement and sizing for the Iraqi
distribution system. Figure (1) shows a block diagram for the
proposed FLC-PSO.
Load
flowNodes
Voltage
Power losses index
FL (optimal location for capacitor )
PSO (optimal size for capactior)
Input
data
Output
Optimal placement
for capacitorsOptimal Size
for capacitors
Figure (1) Block diagram of intelligent FL-PSO approach
As shown from the figure, the controller contains two parts,
the FLC and the PSO part. Two objectives are considered in
designing the FLC approach for identifying the optimal
capacitor locations, those are: (i) minimize the real power
loss. (ii) Maintain the voltage within the permissible limits.
The voltages and the power loss indices of the system nodes
under consideration are modeled by fuzzy membership
functions. The set of rules are then used to determine the
capacitor placement suitability of each node in the distribution
system.
The power loss reduction indices along with the p.u. nodal
voltages were the inputs for the FLC, which determines the
suitable node for capacitor installation. Two input and one
output variables are selected. The first input variable is the
power loss index (PLI) and the second one is the per unit
nodal voltage (V).The output variable is the Capacitor
suitability Index (CSI). Power Loss Index range varies from 0
to 1, P.U. nodal voltage range varies from 0.88 to 1.1 and
Capacitor Suitability Index range varies from 0 to 1.
Five membership functions are selected for PLI. Those are: L,
LM, M, HM and H. All the five membership functions are
triangular as shown in Figure (2), for the selected voltage: L,
LN, N, HN and H. These membership functions are
trapezoidal and triangular as shown in Figure (3) and for the
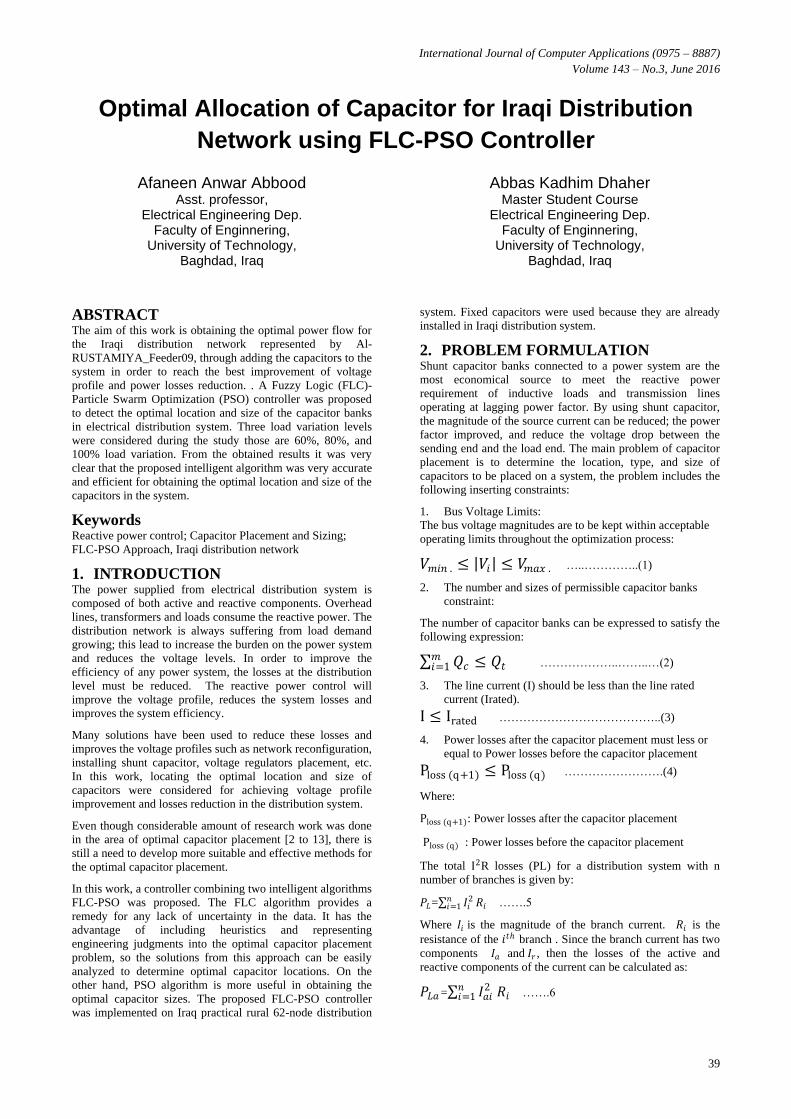
CSI are: L, LM, M, HM and H, the membership functions are
triangular also. See figure (4)
For determining the suitability of capacitor placement at a
particular node, a set of multiple-antecedent fuzzy rules has
been established. The rules are summarized in the fuzzy
decision matrix in Table-1. The consequents of the rules.
Optimal capacitor locations are identified based on the highest
Capacitor Suitability Index values.
Figure-2. Membership function plot for P.L.I
Figure-3. Membership function plot for p.u. nodal voltage
International Journal of Computer Applications (0975 – 8887)
Volume 143 – No.3, June 2016
41
Figure-4. Membership function plot for C.S.I.
Table-1. Decision matrix for determining the optimal
capacitor locations.
L LN N HN H
PLI
L LM LM L L L
LM M LM LM L L
M HM M LM L L
HM HM HM M LM L
H H HM M LM LM
For calculating the optimal size of the inserted capacitor, the
PSO was used were the swarm consists of individuals called
particles. Each particle in the swarm represents a potential
solution of the optimization problem. Each particle moves
through a D-dimensional search space at a random velocity.
Each particle updates its velocity and position according to
the following equations:
vj+1i
= vji + c1 r1 (pj
i - xj
i) +c2 r2 (pj
g - xj
i) j=1,..n …9
xj+1i
= xji + vj+1
i j=1,…,n ….10
Where
c1 and c2 are acceleration constants;
r1 and r2 are uniformly distributed random numbers
In the range 0 and 1.
pji Best position ever visited by the
Particle at the ith iteration;
pjg
Global best position in the entire
swarm;
4. THE STRUCTURE OF THE
PROPOSED PROGRAM Step1: schedule PLI for capacitor and Voltage in per unit.
Step2: Set the PLI as input1 and the per-unit voltage as input2
Step3: Fuzzified the inputs at Fuzzification unit.
Step4: Fuzzified Inputs process at Fuzzy logic-reasoning unit
Step5: deffuzzified Fuzzy controller outputs to classify the
suitable Index (SI). The nodes, which have the greatest value
of CSI, will be appropriate for placing the capacitor. Output of
FLC is input for PSO determine the optimal size.
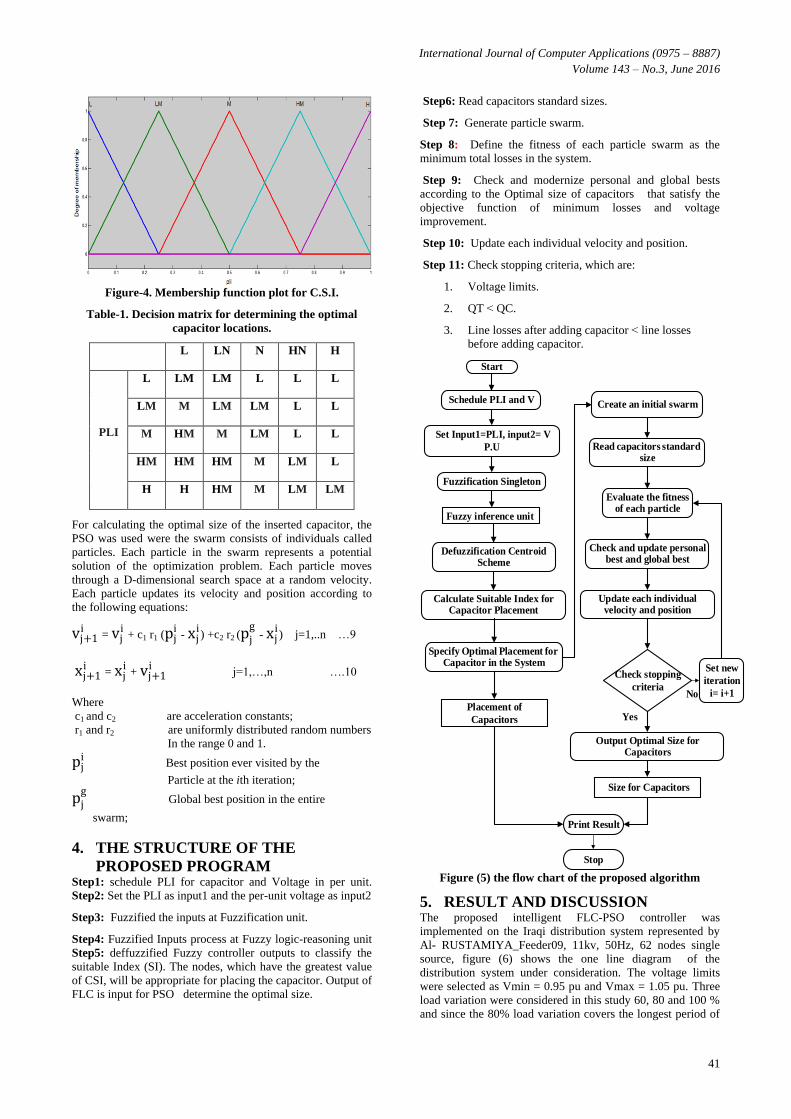
Step6: Read capacitors standard sizes.
Step 7: Generate particle swarm.
Step 8: Define the fitness of each particle swarm as the
minimum total losses in the system.
Step 9: Check and modernize personal and global bests
according to the Optimal size of capacitorsD that satisfy the
objective function of minimum losses and voltage
improvement.
Step 10: Update each individual velocity and position.
Step 11: Check stopping criteria, which are:
1. Voltage limits.
2. QT > QC.
3. Line losses after adding capacitor > line losses
before adding capacitor.
Start
Schedule PLI and V
Set Input1=PLI, input2= V
P.U
Fuzzification Singleton
Defuzzification Centroid Scheme
Calculate Suitable Index for Capacitor Placement
Evaluate the fitness of each particle
Check and update personal best and global best
Update each individual velocity and position
Check stopping
criteria
Output Optimal Size for Capacitors
Set new
iteration
i= i+1
Fuzzy inference unit
Specify Optimal Placement for Capacitor in the System
No
Yes
Read capacitors standard size
Create an initial swarm
Print Result
Stop
Placement of
Capacitors
Size for Capacitors
Figure (5) the flow chart of the proposed algorithm
5. RESULT AND DISCUSSION The proposed intelligent FLC-PSO controller was
implemented on the Iraqi distribution system represented by
Al- RUSTAMIYA_Feeder09, 11kv, 50Hz, 62 nodes single
source, figure (6) shows the one line diagram of the
distribution system under consideration. The voltage limits
were selected as Vmin = 0.95 pu and Vmax = 1.05 pu. Three
load variation were considered in this study 60, 80 and 100 %
and since the 80% load variation covers the longest period of

International Journal of Computer Applications (0975 – 8887)
Volume 143 – No.3, June 2016
42
the load cure of the system under consideration, then it was
considered in the calculations of the optimal location and size
of capacitors for the system. The input data represents the
annual load curve for the system for the year 2014. See the
appendix A.
1
2
3
5
67
8
4
9
10
11
12
13
14
15
16
17
18
19
20
21
22
23
24
25
26
27
2829303132
33
34
35
37
38
474849
39404142
36
50
51
46454443
52
53
54
55
60
61
62
56
57
58
59
Figure (6) Al- RUSTAMIYA_Feeder09 distribution
system
Table (2) shows the optimal locations of capacitor which have
capacitor suitable index (CSI) more than 0.75 using FLC, and
optimal size of capacitors using PSO. Table (3) show the real
and reactive power losses before and after the installation for
the Three-load variation.
Table (2) the optimal sizes of capacitor
Location by FES Size by PSO-KVAR
24 1200
39 600
52 450
Total sizes 2250
Table (3) losses and voltage after and before capacitors
100% Before After Improve%
KW loss 411.37 248.6174 39.563
KVAR loss 409.28 246.8701 39.681
Min voltage 0.88532 0.9318 5.25
80% Before After
KW loss 250.6816 149.5314 40.35
KVAR loss 249.3294 148.6792 40.368
Min voltage 0.9104 0.9539 4.8
60% Before After
KW loss 159.8883 98.6114 38.324
KVAR loss 158.9907 98.3128 38.164
Min voltage 0.9284 0.9699 4.47
Figures (7, 8. And 9) shown in appendix B show that the
voltage, the real power losses, and the reactive power losses
improvement at 80% load level respectively. The red curve
represents the base case and the blue one represents the vales
after adding the capacitors.
The execution time for FLC-PSO is 21.571947 seconds.
From the tables it is clear that adding the capacitors reduces
the real losses, reactive losses and improves the voltage
profile by (38.324% –to- 39.563% ) (38.164% - 39.681%) and
(4.47% - 5.25%) respectively for the three cases(60%-100%)
of the load variation.
6. CONCLUSION This paper introduced an intelligent FLC-PSO approach
method to determine the optimal location and size of
capacitors in Iraqi distribution power system. This
combination reduced active power losses and improved the
bus voltage levels in an efficient way .The main advantage of
this approach was clarifying the robustness of intelligent
systems over the conventional systems in flexibility,
robustness of the complex combination problem, sure and fast
convergence. The obtained results declared the effectiveness
of the proposed method.
7. REFERENCES [1] D. Das .1994. Novel method for solving radial
distribution networks IEEE, 1994 Paper 9966C
[2] Duran H. 1968. Optimum number, location and size of
shunt capacitors in radial distribution feeders: A dynamic
programming approach. IEEE Transactions on Power
Apparatus and Systems. 87(9): 1769-1774 September.

International Journal of Computer Applications (0975 – 8887)
Volume 143 – No.3, June 2016
43
[3] Bae Y.G. 1978. Analytical method of capacitor
allocation on distribution primary feeders. IEEE
Transactions on Power Apparatus and Systems. PAS-
97(4): 1232-1238, July.
[4] Grainger J.J and S.H. Lee. 1981. Optimum size and
location of shunt capacitors for reduction of losses on
distribution feeders. IEEE Transactions on Power
Apparatus and Systems. PAS-100(3): 1105-1118, March.
[5] Baran M.E. and Wu F.F. 1989. Optimal capacitor
placement on radial distribution systems.
IEEETransactions on Power Delivery. 4(1): 725-734
January.
[6] Baran M.E. and Wu F.F. 1989. Optimal sizing of
Capacitors placed on a radial distribution system. IEEE
Transactions on Power Delivery. 4(1): 735743, January.
[7] Sundhararajan S. and Pahwa A. 1994. Optimal selection
of capacitors for radial distribution systems using a
genetic algorithm. IEEE Transactions on Power Systems.
9(3): 1499-1507, August.
[8] Chis M., Salama M.M.A. and Jayaram S. 1997.Capacitor
placement in distribution systems using heuristic search
strategies. IEE proceedings onGeneration, Transmission
and Distribution. 144(3): 225-230, May.
[9] Haque M.H. 1999. Capacitor placement in radial
distribution systems for loss reduction. IEE Proceedings
on Generation, Transmission and Distribution. 146(5):
501-505, September.
[10] Ng H.N., Salama M.M.A. and Chikhani A.Y. 2000.
Capacitor allocation by approximate reasoning: fuzzy
capacitor placement. IEEE Transactions on Power
Delivery. 15(1): 393-398, January.
[11] Prakash K. and Sydulu M. 2007. Particle swarm
optimization based capacitor placement on radial
distribution systems. IEEE Power Engineering Society
general meeting. pp. 1-5, June.
[12] M. Damodar Reddy and V.C. Veera Reddy. 2008.
Optimal capacitor placement using fuzzy and real coded
genetic algorithm for maximum savings. Journal of
Theoretical and Applied Information Technology. 4(3):
219-226.
[13] M. Damodar Reddy and V.C. Veera Reddy. 2008.
Capacitor placement using fuzzy and particle swarm
optimization method for maximum annual savings.
ARPN Journal of Engineering and Applied Sciences.
3(3): 25-30.
[14] Timothy J. Ross "FUZZY LOGIC WITH
ENGINEERING APPLICATIONS" Book University of
New Mexico, USA, 2004.
[15] James Kennedy and Russell Eberhart "Particle Swarm
Optimization" book, IEEE 1995.
8. APPENDIX A V = 11 KV P.F. = 0.8
LINE DATA
Node data
11kV Feeder data
Main
feeder
Node
No.
Trans.
Rating
(kVA)
Feeder
section
Kind of
feeder Length (km) R () X ()
2 - s.s-2 3150
UGC 2.133
0.29464
0.230703
3 400 2-3 Al-95 0.1 0.04184 0.044302
4 250 3-4 Al-95 0.216 0.03146 0.03331
5 250 4-5 Al-95 0.216 0.06795 0.07194
6 250 5-6 Al-95 0.15 0.06795 0.07194
7 250 6-7 Al-95 0.15 0.04719 0.049965
8 250 7-8 Al-95 0.066 0.04719 0.049965
9 250 8-9 Al-95 0.466 0.020763 0.021984
10 250 9-10 Al-95 0.266 0.146603 0.155224
11 250 10-11 Al-95 0.233 0.083683 0.088604
12 250 11-12 Al-95 0.183 0.073301 0.077612
13 250 12-13 Al-95 0.3 0.05757 0.06095
14 250 13-14 Al-95 0.133 0.09438 0.09993
15 250 14-15 Al-95 0.066 0.041841 0.044302
16 250 15-16 Al-95 0.266 0.020763 0.02198
17 250 16-17 Al-95 0.5 0.020763 0.02198
18 250 17-18 Al-95 0.4 0.1573 0.16655
19 250 18-19 Al-95 0.166 0.12584 0.13324

International Journal of Computer Applications (0975 – 8887)
Volume 143 – No.3, June 2016
44
18 250
17-18 Al-95 0.4 0.1573 0.16655
19 250 18-19 Al-95 0.166 0.12584 0.13324
20 250 19-20 Al-95 0.3 0.052223 0.055294
21 250 20-21 Al-95 0.5 0.09438 0.09993
22 250 21-22 Al-95 0.15 0.17303 0.183205
23 250 22-23 Al-95 0.166 0.036493 0.038639
24 630 23-24 Al-95 2.1 0.18876 0.19986
25 250 24-25 Al-95 2.3 0.026111 0.027647
26 400 25-26 Al-95 0.15 0.16768 0.177542
27 250 26-27 Al-95 0.3 0.262061 0.277472
Lateral 1
28 630 2-28 Al-95 0.416 0.34718 0.28633
29 250 28-29 Al-95 0.233 0.04719 0.049965
30 250 29-30 Al-95 0.3 0.09438 0.088604
31 250 30-31 Al-95 0.1 0.130873 0.138569
32 250 31-32 Al-95 0.766 0.073301 0.077612
sub
Lateral 1
33 250 30-33 Al-95 0.433 0.09438 0.09993
34 250 33-34 Al-95 0.2 0.03146 0.03331
35 250 34-35 Al-95 0.65 0.240983 0.255154
Lateral 2 36 250 2-36 Al-95 0.2 0.28426 0.21971
Lateral 3
37 250 21-37 Al-95 0.333 0.136221 0.144232
38 250 37-38 Al-95 0.65 0.06292 0.06662
Lateral 4
39 630 21-39 Al-95 0.55 0.20449 0.216515
40 400 39-40 Al-95 0.116 0.06292 0.06662
41 250 40-41 Al-95 0.6 0.104762 0.110922
42 400 41-42 Al-95 0.083 0.20449 0.216515
Lateral 5
43 250 22-43 Al-95 0.533 0.17303 0.183205
44 250 43-44 Al-95 0.833 0.115143 0.121914
45 250 44-45 Al-95 0.55 0.115143 0.121914
46 250 45-46 Al-95 0.366 0.12584 0.13324
Lateral 6
47 630 21-47 Al-95 0.366 0.1573 0.16655
48 400 47-48 Al-95 0.4 0.04719 0.049965
49 250 48-49 Al-95 0.766 0.036493 0.038639
Sub
lateral2
50 250 48-50 Al-95 0.6 0.240983 0.255154
51 250 50-51 Al-95 0.766 0.18876 0.19986
52 630 24-52 Al-95 0.466 0.240983 0.255154

International Journal of Computer Applications (0975 – 8887)
Volume 143 – No.3, June 2016
45
55 400 54-55 Al-95 1.033 0.262061 0.277472
Lateral 8
56 250 26-56 Al-95 0.1666 0.324981 0.344092
57 250 56-57 Al-95 0.583 0.052223 0.055294
Lateral 9
58 630 26-58 Al-95 0.3 0.183411 0.194197
59 250 58-59 Al-95 1.4 0.09438 0.09993
60 250 26-60 Al-95 1.166 0.44044 0.46634
61 400 60-61 Al-95 1.6 0.366823 0.388394
62 250 61-62 Al-95 1.166 0.44054 0.46644
9. APPENDIX B
Figure (7) the voltage levels improvements
Figure (8) the active power losses improvements
0 1 2 3 4 5 6 7 8 9 10 11121314151617 181920212223242526 272829303132333435 363738394041424344 454647484950515253 545556575859606162 630.9
0.95
1
1.05
Nodes number
vo
ltag
e m
ag
nit
ud
e / p
.u.
80% Base case
after cap.
0 1 2 3 4 5 6 7 8 9 10 11 1213 141516 1718 1920 2122 232425 2627 2829 303132 3334 3536 373839 4041 4243 4445 464748 4950 5152 535455 5657 5859 6061 620
10
20
30
40
50
Branch number
Lin
es lo
sses / K
W
80% Base case
after cap.
Lateral 7 53 400 52-53 Al-95 0.266 0.146603 0.155224
54 250 53-54 Al-95 0.8333 0.083683 0.088605

International Journal of Computer Applications (0975 – 8887)
Volume 143 – No.3, June 2016
46
Figure (9) the reactive power losses improvements
0 1 2 3 4 5 6 7 8 9 10 11 1213 141516 1718 1920 2122 232425 2627 2829 303132 3334 3536 373839 4041 4243 4445 464748 4950 5152 535455 5657 5859 6061 620
5
10
15
20
25
30
35
40
45
Branch number
Lin
es lo
sses / K
VA
R
80% Base case
after cap.
IJCATM : www.ijcaonline.org