optical properties and thermal response of copper …mtt.missouri.edu/pubs/135_1.3662897.pdfoptical...
TRANSCRIPT

Optical properties and thermal response of copper films induced by ultrashort-pulsedlasersYunpeng Ren, J. K. Chen, and Yuwen Zhang Citation: Journal of Applied Physics 110, 113102 (2011); doi: 10.1063/1.3662897 View online: http://dx.doi.org/10.1063/1.3662897 View Table of Contents: http://scitation.aip.org/content/aip/journal/jap/110/11?ver=pdfcov Published by the AIP Publishing Articles you may be interested in Thermal response of double-layered metal films after ultrashort pulsed laser irradiation: The role of nonthermalelectron dynamics Appl. Phys. Lett. 104, 051603 (2014); 10.1063/1.4863959 Optical properties of β -Sn films J. Appl. Phys. 105, 073520 (2009); 10.1063/1.3106528 Periodic lines and holes produced in thin Au films by pulsed laser irradiation J. Appl. Phys. 100, 044317 (2006); 10.1063/1.2234548 Time resolved evolution of structural, electrical, and thermal properties of copper irradiated by an intenseultrashort laser pulse J. Appl. Phys. 97, 023526 (2005); 10.1063/1.1834726 Production of relativistic electrons by irradiation of 43-fs-laser pulses on copper film Appl. Phys. Lett. 79, 1234 (2001); 10.1063/1.1396311
[This article is copyrighted as indicated in the article. Reuse of AIP content is subject to the terms at: http://scitation.aip.org/termsconditions. Downloaded to ] IP:
128.206.26.105 On: Sat, 16 Jan 2016 21:41:39

Optical properties and thermal response of copper films inducedby ultrashort-pulsed lasers
Yunpeng Ren, J. K. Chen,a) and Yuwen ZhangDepartment of Mechanical and Aerospace Engineering, University of Missouri, Columbia,Missouri 65211, USA
(Received 1 September 2011; accepted 16 October 2011; published online 1 December 2011)
A critical point model with three Lorentzian terms for interband transition was proposed to describe
temperature-dependent reflectivity (R) and absorption coefficient (a) for copper irradiated by
ultrashort-pulsed lasers of wavelength 200–1000 nm. After validated with experimental data at room
temperature, it was incorporated into a two-temperature model to study ultrafast laser-material
interactions. The dynamic changes of optical properties R and a, distributions of laser heat density,
electron and lattice temperature, and phase changes of a copper film were investigated. Comparing
with the experimental data of average absorption showed that the proposed two-temperature model
together with the critical point model can simulate satisfying results for temperature-dependent R and
a. The drastic changes in R and a could alter laser energy deposition in a heated target, leading to
different thermal responses than those predicted with constant R and a at room temperature. VC 2011American Institute of Physics. [doi:10.1063/1.3662897]
I. INTRODUCTION
In the last two decades, a new wave of research in
physics, chemistry, bioscience, and materials science has been
driven by the rapid advancement of ultrashort-pulsed laser
technology.1–5 Among the theoretical studies on ultrafast
laser-material interaction, the two-temperature model (TTM)
pioneered by Anisimov6 has been widely employed or
modified7–9 for simulating non-equilibrium thermal transport.
In addition to models themselves, thermophysical and optical
properties are the key factor that governs solution accuracy.
The former controls thermal transport and temperature distri-
butions in a heated medium, while the latter dictates laser
energy deposition that influences the thermal response.
The three thermophysical properties of electrons
involved in TTMs reported for a wide range of temperature
so far are quite convincing. For example, Anisimov and
Rethfeld10 proposed a semiempirical formula for electron
thermal conductivity (ke) adequate even for temperatures
greater than Fermi temperature. Based on the electron density
of state (DOS) and the effect of thermal excitation of elec-
trons,11 Lin and Zhigilei12,13 calculated electron heat capacity
(Ce) and electron-phonon coupling factor (G) up to
50� 103 K. On the other hand, the optical properties, surface
reflectivity (R), and absorption coefficient (a), have received
less attention. Either the values at room temperature (RT) or
arbitrarily assumed were frequently applied in TTM model-
ing. To calculate temperature-dependent R and a, Eesley14
and later Jiang and Tsai15 included the Fermi smearing effect
in the Drude model.16 To improve the Drude model for the
dielectric permittivity, Sim et al.17 adjusted the electron colli-
sion rate to match R at RT for wavelength (k) 1053 nm.
Fisher et al.18,19 modified the Drude model by including
interband transition effect to evaluate R and a for aluminum18
and copper.19 Fairly good comparisons of their model with
experimental data for average absorption were demonstrated.
Recently, Ren et al.20 employed a Lorentz-Drude oscillator
model with one Lorentzian term to study temperature-
dependent R and a for gold. They pointed out that use of con-
stant R and a at RT in a TTM could significantly underesti-
mate laser energy deposition in a metal target when laser
fluence exceeds the melting threshold. In addition, the result-
ing laser heat density would not follow exponential decay
dictated by Beer’s law.
In this paper, a critical point model21 with three Lorent-
zian terms for interband transition is proposed to evaluate the
dielectric permittivity of copper for wavelength 200–1000 nm.
After the model is validated by comparing R and a with experi-
mental data at RT,22 it is incorporated into a TTM to study the
transient optical and thermal response for a copper film irradi-
ated by an ultrashort laser pulse. The temperature-dependent
thermophysical properties employed are suitable over a wide
range of temperature. The average values of the simulated
absorption are compared with experiment data.19 The laser
heat density, the non-equilibrium evolutions of electron and
lattice temperature, and the rapid solid-liquid (S-L) and liquid-
vapor (L-V) phase change are investigated and discussed.
II. DIELECTRIC FUNCTION MODELS
Attempts have been made to determine optical proper-
ties R and a at RT in the range from UV to near infrared. For
example, Rakic et al.23 employed a Lorentz-Drude model
with five Lorentzian terms to reflect interband transition
effect. Comparing with experimental data indicated their
model was not precise enough in the vicinity of 2.2 eV for
copper where the interband transition takes place. Based on
the Drude model, Etchegoin21 proposed a critical point
model with two Lorentzian terms to calculate the permittiv-
ity for gold. Later, Vial et al.24 found that the critical point
model can be fairly good for silver also.
a)Author to whom correspondence should be addressed. Electronic mail:
0021-8979/2011/110(11)/113102/7/$30.00 VC 2011 American Institute of Physics110, 113102-1
JOURNAL OF APPLIED PHYSICS 110, 113102 (2011)
[This article is copyrighted as indicated in the article. Reuse of AIP content is subject to the terms at: http://scitation.aip.org/termsconditions. Downloaded to ] IP:
128.206.26.105 On: Sat, 16 Jan 2016 21:41:39

In the present work, the critical point model with three
Lorentzian terms is proposed to evaluate temperature-
dependent R and a for copper. The critical point model with
interband transition is written as24
eðxÞ ¼ e1 �x2
D
x2 þ icx
þXn
p¼1
BpXpei/p
Xp � x� iCpþ e�i/p
Xp þ xþ iCp
� �
¼ e1ðx; tÞ þ ie2ðx; tÞ; (1)
where e1 is dielectric constant, xD plasma frequency, xlaser frequency, c damping coefficient which equals recipro-
cal of electron relaxation time (se), n number of oscillators,
B a weighting factor, and X, /, and C energy of gap, phase,
and broadening, respectively.
The parameters in Eq. (1) for copper with n¼ 3 are best
fitted with se¼ 10.0 fs using a simulated annealing method.25
The results are listed in Table I. Figures 1 and 2 compare Rand a at RT obtained by the three optical models with experi-
mental data22 for k¼ 200–1000 nm. Apparently, the pro-
posed critical point model with three Lorentzian terms
computes quite satisfying results, compared to the Drude
model16 and Rakic et al.23
The electron relaxation time is often expressed in the form
se ¼1
BlTl þ AeT2e
; (2)
where Te and Tl are electron and lattice temperature, respec-
tively; Ae and Bl are constants to be determined. The first
term in the denominator represents electron-phonon collision
rates (te, ph), and the second term the electron-electron colli-
sion rates (te, e). In fact, the electron-phonon collision rate
depends on both Te and Tl:18
te;ph ¼N2
8peFkFqs
mopt
me
�ðqb
0
e/l þ e/e
ðe/l � 1Þðe/e þ 1Þq4dq
þ gðq
b
0
e/l � e/e
ðe/l � 1Þðe/e þ 1Þq3dqþ qb
eul þ eue
ðeul � 1Þðeue þ 1Þ
� ð2kFÞ4� q4b
4� 4gq2
bk2F
eul � eue
ðeul � 1Þðeue þ 1Þ
�;
(3)
where /l ¼ bl�hqs; /e ¼ be�hqs; ul ¼ bl�hqbs; ue ¼ be�hqbs;eF is Fermi energy, kF Fermi velocity, q density, s longitudi-
nal sound velocity, mopt effective electron mass, me mass of
an electron, q the phonon wave vector, bl¼Tl/kB, be¼Te/kB, and g ¼ 2mopts=�h. The first two terms on the right-hand
side of Eq. (3) are only significant for low temperature and
can be neglected for RT and above. Using the similar
method as Fisher et al.,18 the two parameters are found
to be: N¼ 3.99 eV, qb¼ 8.97� 109 m�1 for copper with
mopt¼ 1.39 me. In this work, the term BlTl in Eq. (2) is
replaced with the above collision rate te, ph multiplied by a
factor of 3.54 for which the electron relaxation time is 10.0
fs at RT.
TABLE I. Parameters in the critical point model fitted for copper.
e1 xD(rad�s�1) C(rad�s�1) B1 U1 X1(rad�s�1) C1(rad�s�1) B2
3.686 1.34� 1016 0.99� 1014 0.562 � 8.185 3.205� 1015 0.404� 1015 27.36
U2 X2(rad�s�1) C2(rad�s�1) B3 U3 X3(rad�s�1) C3(rad�s�1)
0.226 3.43� 1015 0.77� 1016 0.242 � 0.516 7.33� 1015 1.12� 1015
FIG. 1. (Color online) Reflectivity at RT versus wavelength calculated by
different models.
FIG. 2. (Color online) Absorption coefficient at RT versus wavelength cal-
culated by different models.
113102-2 Ren, Chen, and Zhang J. Appl. Phys. 110, 113102 (2011)
[This article is copyrighted as indicated in the article. Reuse of AIP content is subject to the terms at: http://scitation.aip.org/termsconditions. Downloaded to ] IP:
128.206.26.105 On: Sat, 16 Jan 2016 21:41:39

The optical properties R and a can be determined from
Fresnel function16
Rðx; tÞ ¼ ðf1ðx; tÞ � 1Þ2 þ f 22 ðx; tÞ
ðf1ðx; tÞ þ 1Þ2 þ f 22 ðx; tÞ
; aðx; tÞ ¼ 2xf2ðx; tÞc
;
(4)
where c is light speed in vacuum, and the normal refractive
index f1 and extinction coefficient f2 are functions of e1
and e2:
f1ðx; tÞ ¼
ffiffiffiffiffiffiffiffiffiffiffiffiffiffiffiffiffiffiffiffiffiffiffiffiffiffiffiffie1 þ
ffiffiffiffiffiffiffiffiffiffiffiffiffiffie2
1 þ e22
p2
s; f2ðx; tÞ ¼
ffiffiffiffiffiffiffiffiffiffiffiffiffiffiffiffiffiffiffiffiffiffiffiffiffiffiffiffiffiffiffiffi�e1 þ
ffiffiffiffiffiffiffiffiffiffiffiffiffiffie2
1 þ e22
p2
s:
(5)
Figure 3 shows the calculated reflectivity R as a function of
temperature (T¼ Tl¼ Te) for copper. The reflectivity Rdecreases with temperature, especially for longer wave-
lengths. The monotonic trend is not always found for a as
shown in Fig. 4. In the ultrafast laser heating the values of Rand a are determined by nonequilibrium electron and lattice
temperatures.
III. TWO-TEMPERATURE MODEL
Consider a free standing copper film of thickness L and
initial temperature Ti irradiated by a flat-top laser pulse of
fluence Jo on the front surface (x¼ 0). The laser pulse is
Gaussian in time with full width at half maximum (FWHM)
tp. For simplicity, the problem is approximated to be one
dimensional.
Thermal conductivity of lattice is usually neglected in a
TTM for pure metals due to the fact that it is much smaller
than that of electrons. When a phase change from solid to
liquid occurs, the lattice thermal conductivity, however,
should be considered. Thus, the TTM is given as follows:8
Ce@Te
@t¼ @
@xðke
@Te
@xÞ � GðTe � TlÞ þ Sðx; tÞ; (6)
Cl@Tl
@t¼ @
@xðkl@Tl
@xÞ þ GðTe � TlÞ; (7)
where C is heat capacity, k thermal conductivity, G electron-
phonon coupling factor, and S laser heat density. The sub-
script e and l denote electron and lattice, respectively. The
laser heat density in Eq. (6) is given by20
Sðx; tÞ ¼ 0:94½1� Rð0; tÞ�Jo
tpaðx; tÞ
� exp �ðx
0
aðx; tÞdx� 2:77t
tp
� �2" #
; (8)
in which x is spatial coordinate, t is time, and R(0, t) is sur-
face reflectivity.
To model melting and evaporation in metals, all the
electron thermophysical properties should be valid over a
wide range of temperature. Figure 5 shows the data13 of heat
capacity for copper calculated by taking the derivative of the
FIG. 3. (Color online) Reflectivity versus temperature for different
wavelengths.
FIG. 4. (Color online) Absorption coefficient versus temperature for differ-
ent wavelengths.
FIG. 5. (Color online) Temperature-dependent electron heat capacity of
copper.
113102-3 Ren, Chen, and Zhang J. Appl. Phys. 110, 113102 (2011)
[This article is copyrighted as indicated in the article. Reuse of AIP content is subject to the terms at: http://scitation.aip.org/termsconditions. Downloaded to ] IP:
128.206.26.105 On: Sat, 16 Jan 2016 21:41:39

total electron energy density with respect to electron temper-
ature.12 In numerical analysis, an explicit function that can
accurately describe properties would be more useful. Thus,
we fit the data as
CeðTeÞ ¼117:47Te; Te < 2� 103 K�2:049� 104 � 26:64Te þ 0:0996T2
e � 1:122� 10�5T3e þ 5:735� 10�10T4
e
�1:524� 10�14T5e þ 2:044� 10�19T6
e � 1:094� 10�24T7e ; 2� 103 K � Te � 50� 103 K
8<: ; (9)
with units in Jm�3 K�1. The accuracy of the curve-fitted
polynomial function can be seen in Fig. 5.
Figure 6 shows the data13 of electron-phonon coupling
factor for copper, computed based on the assumption that the
square of the absolute electron-phonon scattering matrix ele-
ment, when summed over scattering angles, is independent
of the electron states.11,12 Again, the data are curve-fitted
to be
GðTeÞ ¼0:56� 1017; Te < 2; 750 K1:341� 1017 � 1:407� 1014Te þ 5:988� 1010T2
e � 7:93� 106T3e
þ 555:2T4e � 0:023272T5
e þ 6:041� 10�7T6e � 9:529� 10�12T7
e
þ 8:377� 10�17T8e � 3:15� 10�22T9
e ; 2; 750K � Te � 50� 103 K
8>><>>: ; (10)
with units in Wm�3 K�1. The results are shown in Fig. 6.
The electron thermal conductivity proposed by Anisi-
mov and Rethfeld10 is in the form
ke ¼ vð#2
e þ 0:16Þ5=4ð#2e þ 0:44Þ#e
ð#2e þ 0:092Þ1=2ð#2
e þ g#lÞ; (11)
where #e ¼ Te=TF and #l ¼ Tl=TF with TF denoting Fermi
temperature; v and g are constant. For copper,
TF¼ 8.16� 104 K, v¼ 377 Wm�1 K�1, and g¼ 0.139.26
From solid state, the bulk thermal conductivity (keq) is
the sum of electronic component (ke) and lattice component
(kl). For pure metals, kl is much smaller than ke because free
electrons conduct the majority part of heat. In this work, kl is
taken to be 1% of keq for copper.27 The temperature-
dependent bulk thermal conductivity, specific heat, and mass
density of copper in solid and liquid phase are listed in
Table II.
The rapid melting induced by ultrashort pulse laser is
controlled by nucleation dynamics at the interface, as oppose
to by interfacial energy balance for conventional melting pro-
cess. The S-L interface can be heated well above the melting
point during a rapid melting process, in which case the solid
becomes superheated. Similarly, the interface can be cooled
far below the melting point in the rapid solidification process,
in which case the liquid becomes undercooled. It is assumed
that the maximum S-L interface velocity is equal to the speed
of sound of the liquid phase and that the fraction of the sites
on interface where rearrangement of atoms can occur is unity.
These two assumptions are valid for metals.28,29 For ultrafast
evaporation, the velocity of dynamic evaporation is limited
by the characteristic speed of sound on the liquidus line
according to superheating kinetics of volume vaporization
and shock wave theory. To simulate those phase changes, the
numerical algorithms proposed by Zhang and Chen30 for
rapid melting/re-solidification processes and those proposed
by Huang et al.31 for non-equilibrium, superheating process
of evaporation are adopted.
The initial temperature of electrons and lattice are set
to be
Teðx;�2tpÞ ¼ Tlðx;�2tpÞ ¼ Ti: (12)
Adiabatic boundary conditions on both sides of a heated tar-
get have been assumed in most of the existing works for
ultrafast laser heating. In this paper, radiation heat loss on
the front surface is considered. The boundary conditions are
as follows:
@Teð0; tÞ@x
¼ @TeðL; tÞ@x
¼ @TlðL; tÞ@x
¼ 0; kl@Tlð0; tÞ@x
¼ reðT4sur � T4
1Þ; (13)FIG. 6. (Color online) Temperature-dependent electron-phonon coupling
factor of copper.
113102-4 Ren, Chen, and Zhang J. Appl. Phys. 110, 113102 (2011)
[This article is copyrighted as indicated in the article. Reuse of AIP content is subject to the terms at: http://scitation.aip.org/termsconditions. Downloaded to ] IP:
128.206.26.105 On: Sat, 16 Jan 2016 21:41:39

where r is Stefan-Boltzmann constant, e is emissivity, and
Tsur is surface temperature of lattice which becomes L-V
interface temperature when evaporation takes place.
IV. NUMERICAL RESULTS AND DISCUSSION
The electron energy equation, lattice energy equation,
and equations for the rapid S-L and L-V phase change are
solved using a finite difference method. The iteration solu-
tion procedures can be found in reference 30 for the S-L
phase change and 31 for the L-V phase change. The numeri-
cal simulations are performed for a copper film of 1 -lm
thickness irradiated by a laser pulse of k¼ 800 nm. The ini-
tial temperature is set at 300 K. A value of 0.12� 106 K�2
s�1 is chosen for Ae to fit the experimental data for the 50-fs
laser pulse,19 and then is used for all the simulations.
Figure 7 shows the average absorption for four pulse
lengths, 50 fs, 150 fs, 500 fs, and 1 ps, where the average
absorption of the target is calculated by18
A ¼Ð 2tp�2tp
dtÐ L
0Sðx; tÞdxÐ 2tp
�2pIðtÞdt
; (14)
with I(t) being the laser intensity before it reaches the target
IðtÞ ¼ 0:94Jo
tpexp �2:77
t
tp
� �2" #
: (15)
It can be seen from Fig. 7 that the present approach corre-
lates the average absorption quite well with experimental
data,19 compared to the other theoretical result.19 The laser
intensity at which the average surface absorption begins to
significantly change depends on laser pulse length; for exam-
ple, about 1.0� 1012 W/cm2 for the 500-fs pulse and
4.0� 1013 W/cm2 for the 50-fs pulse. Under the same peak
laser intensity (Io), a longer laser pulse would have higher
absorption because it contains more laser energy. However,
the difference becomes inconsequential when intensities are
low, for example, Io< 1.0� 1011 W/cm2 for the four pulses.
At those intensities the induced electron and lattice tempera-
ture would not be high enough to significantly alter R and a.
Variations of R and a at the front surface during the laser
irradiation are illustrated in Fig. 8. The normalized laser pro-
file and electron relaxation time are also presented in the fig-
ure for convenience. In this simulation, the pulse length is
TABLE II. Thermophysical and optical properties of copper.
Properties Solid (s) Liquid (l)
Specific heat, cp (J/kg�K) 313.7þ 0.324Tl� 2.687� 10�4
�Tl2þ 1.257� 10�7Tl
3
510.1
Bulk conductivity, keq (W/m�K) 407.9� 0.0272Tl� 2.658� 10�5
�Tl2� 3.0� 10�9Tl
3
62.47þ 0.123Tl� 4.02
� 10�5�Tl2þ 4.855� 10�9Tl
3
Latent heat of fusion, hm (kJ/kg) 206.8
Molar weight, M (kg/kmol) 63.55
Boiling temperature, Tb (K) 2835
Melting temperature, Tm (K) 1357
R at RT for k¼ 800 nm 0.958
a at RT for k¼ 800 nm (mm�1) 78.80
Density, q (kg/m3) 8.94� 103 8.02� 103
FIG. 7. (Color online) Average absorption for different laser pulse lengths
with k¼ 800 nm.
FIG. 8. (Color online) Variations of reflectivity and absorption coefficient at
the front surface during laser irradiation: tp¼ 150 fs, k¼ 800 nm, and
Io¼ 6.0� 1013 W/cm2.
113102-5 Ren, Chen, and Zhang J. Appl. Phys. 110, 113102 (2011)
[This article is copyrighted as indicated in the article. Reuse of AIP content is subject to the terms at: http://scitation.aip.org/termsconditions. Downloaded to ] IP:
128.206.26.105 On: Sat, 16 Jan 2016 21:41:39
150 fs and the peak laser intensity is 6.0� 1013 W/cm2. It
appears that the electron relaxation time decreases with time
due to the electron and lattice temperature rise. As a result,
both R and a decrease during laser irradiation. The decrease
in R makes the target absorb more laser energy while the
decrease in a alters the distribution of laser heat density
inside the target, see Eq. (8).
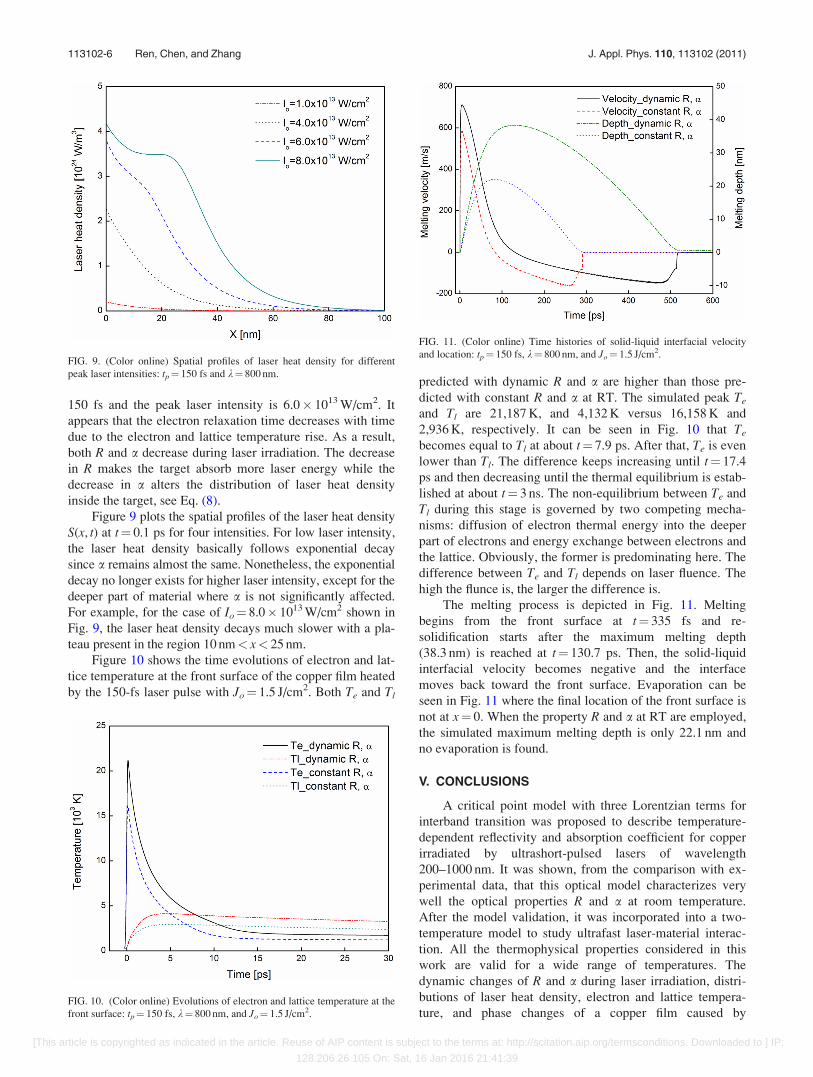
Figure 9 plots the spatial profiles of the laser heat density
S(x, t) at t¼ 0.1 ps for four intensities. For low laser intensity,
the laser heat density basically follows exponential decay
since a remains almost the same. Nonetheless, the exponential
decay no longer exists for higher laser intensity, except for the
deeper part of material where a is not significantly affected.
For example, for the case of Io¼ 8.0� 1013 W/cm2 shown in
Fig. 9, the laser heat density decays much slower with a pla-
teau present in the region 10 nm< x< 25 nm.
Figure 10 shows the time evolutions of electron and lat-
tice temperature at the front surface of the copper film heated
by the 150-fs laser pulse with Jo¼ 1.5 J/cm2. Both Te and Tl
predicted with dynamic R and a are higher than those pre-
dicted with constant R and a at RT. The simulated peak Te
and Tl are 21,187 K, and 4,132 K versus 16,158 K and
2,936 K, respectively. It can be seen in Fig. 10 that Te
becomes equal to Tl at about t¼ 7.9 ps. After that, Te is even
lower than Tl. The difference keeps increasing until t¼ 17.4
ps and then decreasing until the thermal equilibrium is estab-
lished at about t¼ 3 ns. The non-equilibrium between Te and
Tl during this stage is governed by two competing mecha-
nisms: diffusion of electron thermal energy into the deeper
part of electrons and energy exchange between electrons and
the lattice. Obviously, the former is predominating here. The
difference between Te and Tl depends on laser fluence. The
high the flunce is, the larger the difference is.
The melting process is depicted in Fig. 11. Melting
begins from the front surface at t¼ 335 fs and re-
solidification starts after the maximum melting depth
(38.3 nm) is reached at t¼ 130.7 ps. Then, the solid-liquid
interfacial velocity becomes negative and the interface
moves back toward the front surface. Evaporation can be
seen in Fig. 11 where the final location of the front surface is
not at x¼ 0. When the property R and a at RT are employed,
the simulated maximum melting depth is only 22.1 nm and
no evaporation is found.
V. CONCLUSIONS
A critical point model with three Lorentzian terms for
interband transition was proposed to describe temperature-
dependent reflectivity and absorption coefficient for copper
irradiated by ultrashort-pulsed lasers of wavelength
200–1000 nm. It was shown, from the comparison with ex-
perimental data, that this optical model characterizes very
well the optical properties R and a at room temperature.
After the model validation, it was incorporated into a two-
temperature model to study ultrafast laser-material interac-
tion. All the thermophysical properties considered in this
work are valid for a wide range of temperatures. The
dynamic changes of R and a during laser irradiation, distri-
butions of laser heat density, electron and lattice tempera-
ture, and phase changes of a copper film caused byFIG. 10. (Color online) Evolutions of electron and lattice temperature at the
front surface: tp¼ 150 fs, k¼ 800 nm, and Jo¼ 1.5 J/cm2.
FIG. 11. (Color online) Time histories of solid-liquid interfacial velocity
and location: tp¼ 150 fs, k¼ 800 nm, and Jo¼ 1.5 J/cm2.FIG. 9. (Color online) Spatial profiles of laser heat density for different
peak laser intensities: tp¼ 150 fs and k¼ 800 nm.
113102-6 Ren, Chen, and Zhang J. Appl. Phys. 110, 113102 (2011)
[This article is copyrighted as indicated in the article. Reuse of AIP content is subject to the terms at: http://scitation.aip.org/termsconditions. Downloaded to ] IP:
128.206.26.105 On: Sat, 16 Jan 2016 21:41:39

ultrashort-pulsed lasers were investigated. Comparing the
model prediction with experimental data for the average
absorption reveals that the proposed TTM model along with
the critical point model can simulate satisfying results for
temperature-dependent R and a. Under the same peak laser
intensity, a longer laser pulse results in higher energy absorp-
tion, except for very low intensity. For an ultrashort laser
pulse with high laser fluence, both R and a could drastically
decrease, leading to different laser energy deposition, both in
magnitude and spatial distribution. As a result, the simulated
thermal responses could be different than those predicted
with constant R and a at RT. Therefore, transient R and ashould be considered in the modeling of ultrshort laser heat-
ing, especially when melting in the material occurs. This
study can be extended to other pure metals since their optical
and thermophysical behaviors are similar, respectively.
1A. V. Borovsky, A. L. Galkin, O. B. Shiryaev, and T. Auguste, LaserPhysics at Relativistic Intensities (Springer, New York, 2010).
2M. Braun, P. Gilch, and W. Zinth, Ultrashort Laser Pulses in Biology andMedicine (Springer, New York, 2010).
3P.-H. Barret and M. Palmer, High-Power and Femtosecond Lasers: Prop-erties (Materials and Applications, Nova, New York, 2009).
4K. Sugioka, M. Meunier, and A. Pique, Laser Precision Microfabrication(Springer, New York, 2010).
5A. Miotello and P. M. Ossi, Laser-Surface Interactions for New MaterialsProduction (Springer, New York, 2010).
6S. I. Anisimov, B. L. Kapeliovich, and T. L. Perel’man, Sov. Phys. JETP
39, 375 (1974).7T. Q. Qiu and C. L. Tien, J. Heat Transfer 115, 835 (1993).8J. K. Chen and J. E. Beraun, Numer. Heat Transfer Part A 40, 1 (2001).
9J. K. Chen, J. E. Beraun, and D. Y. Tzou, Int. J. Heat Mass Transfer 49,
307 (2006).10S. I. Anisimov and B. Bethreld, SPIE 3093, 192 (1997).11X. Y. Wang, D. M. Riffe, Y. S. Lee, and M. C. Downer, Phys. Rev. B 50,
8016 (1994).12Z. Lin and L. V. Zhigilei, Phys. Rev. B 77, 075133 (2008).13See http://www.faculty.virginia.edu/CompMat/index.html for the data of
Ce and G.14G. L. Eesley, Phys. Rev. B 33, 2144 (1986).15L. Jiang and H. L. Tsai, Int. J. Heat Mass Transfer 50, 3461 (2007).16M. Fox, Optical Properties of Solids (Oxford University Press, Oxford,
2010).17H. S. Sim, S. Park, T.-H. Kim, Y. K. Choi, J. S. Lee, and S. H. Lee, Mater.
Transfer 51, 1156 (2010).18D. Fisher, M. Fraenkel, Z. Henis, E. Moshe, and S. Eliezer, Phys. Rev. E
65, 016409 (2001).19D. Fisher, M. Fraenkel, Z. Zinamon, Z. Henis, E. Moshe, Y. Horovitz,
E. Luzon, S. Maman, and S. Eliezer, Laser Part. Beams 23, 391
(2005).20Y. Ren, J. K. Chen, Y. Zhang, and J. Huang, Appl. Phys. Lett. 98, 191105
(2011).21P. G. Etchegoin, E. C. L. Ru, and M. Meyer, J. Chem. Phys. 125, 164705
(2006).22P. B. Johnson and R. W. Christy, Phys. Rev. B 6, 4370 (1972).23A. D. Rakic, A. B. Djurisic, J. M. Elazar, and M. L. Majewski, Appl. Opt.
37, 5271 (1998).24A. Vial and T. Laroche, Appl. Phys. B 93, 139 (2008).25S. Kirkpatrick, C. D. Gelatt, and M. P. Vecchi, Science 220, 671 (1983).26J. K. Chen and J. E. Beraun, J. Directed Energy 1, 261 (2005).27G. Klemens and R. K. Williams, Int. Met. Rev. 31, 197 (1986).28M. J. Aziz, J. Appl. Phys. 53, 1158 (1982).29K. A. Jackson, Liquid Metal and Solidification (ASM, Cleveland, Ohio,
1958).30Y. Zhang and J. K. Chen, J. Heat Transfer 130, 062401 (2008).31J. Huang, Y. Zhang, and J. K. Chen, Appl. Phys. A 102, 1 (2011).
113102-7 Ren, Chen, and Zhang J. Appl. Phys. 110, 113102 (2011)
[This article is copyrighted as indicated in the article. Reuse of AIP content is subject to the terms at: http://scitation.aip.org/termsconditions. Downloaded to ] IP:
128.206.26.105 On: Sat, 16 Jan 2016 21:41:39