optical measuring technologies in sheet metal processing · optical measuring technologies in sheet...
TRANSCRIPT
Optical Measuring Technologies in Sheet Metal Processing
Konstantin Galanulis GOM Gesellschaft für Optische Messtechnik mbH
Mittelweg 7 38106 Braunschweig, Germany
Keywords: Measuring instrument, Sheet metal, 3D digitizing, Material properties
Abstract. During recent years, optical measuring technologies in sheet metal forming and tooling have been used more and more in the industry. Main applications are the digitizing of metal sheet parts and tools, forming analysis of metal sheets as well as the determination of material properties. Good interfaces to conventional CAD/CAM and numerical simulation systems made such optical measuring systems a part of complex process chains. These process chains mainly focus on optimizing the development of products and production processes and on improving the product quality. Using optical systems considerably decreases the development time for products and production while improving the quality.
Introduction
This paper presents three optical measuring technologies which became a part of sheet metal forming in many industrial applications during the past years.
Digitizing by ATOS provides the geometrical information of the complete shape of parts. This technology is mainly used in the automotive industry in reverse engineering, analysis and quality control applications, like first article inspection, assembly control, tool manufacturing and optimization, production monitoring and incoming components inspection.
Forming analysis by ARGUS delivers the full field distribution of major and minor strain, the thickness reduction as well as the forming limit diagram for stamped metal sheet parts. The main applications include the verification of numerical simulations, the fast and robust evaluation of forming processes in the stamping area.
In a further stage of system expansion, material properties like forming limit curves or flow curves can be determined accurately and independently of the operator. The main advantages of these relatively new technologies are:
a) coverage and visualization of the complete parts in 3D as well as comparison with CAD or numerical simulation data
b) fast measuring process in comparison with traditional single point based measuring systems c) high resolution and accuracy which exceed the demands in related applications and d) system mobility which allows the measurement of parts at different places.
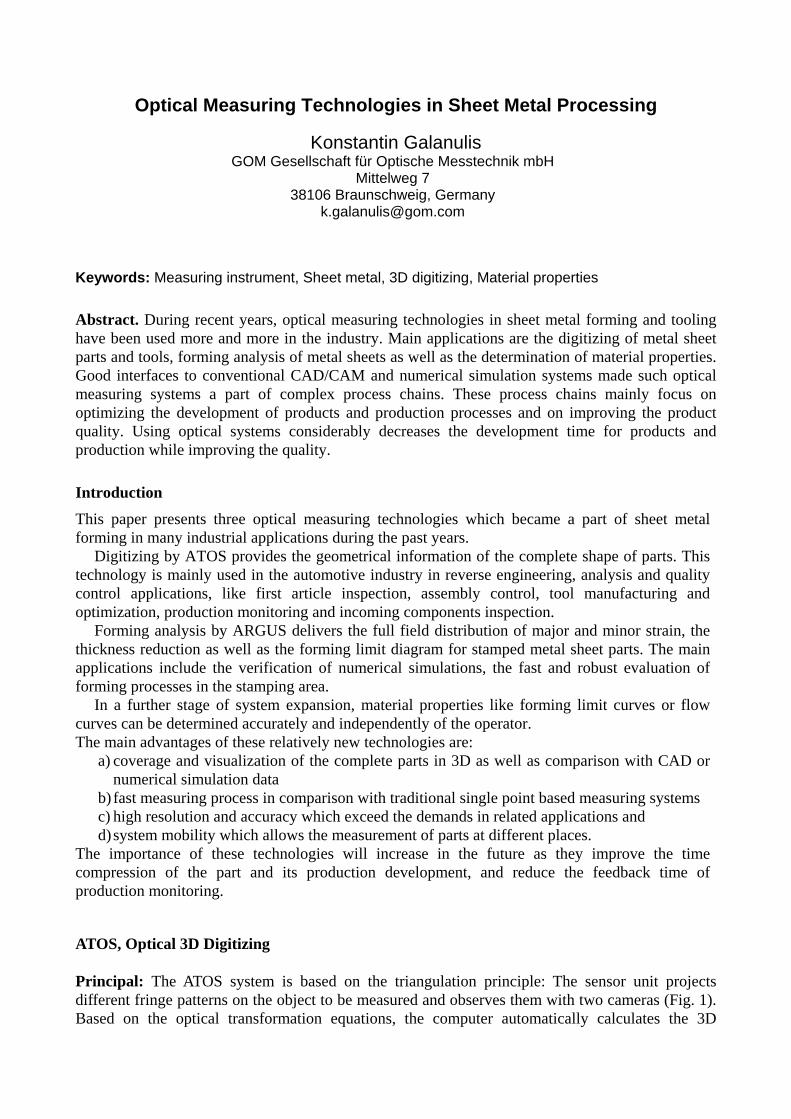
The importance of these technologies will increase in the future as they improve the time compression of the part and its production development, and reduce the feedback time of production monitoring. ATOS, Optical 3D Digitizing Principal: The ATOS system is based on the triangulation principle: The sensor unit projects different fringe patterns on the object to be measured and observes them with two cameras (Fig. 1). Based on the optical transformation equations, the computer automatically calculates the 3D
coordinates for each camera pixel with high precision, [1]. Depending on the camera resolution, a point cloud of up to 4 million surface points results for each individual measurement.
Fig. 1. Fringe projection and triangulation
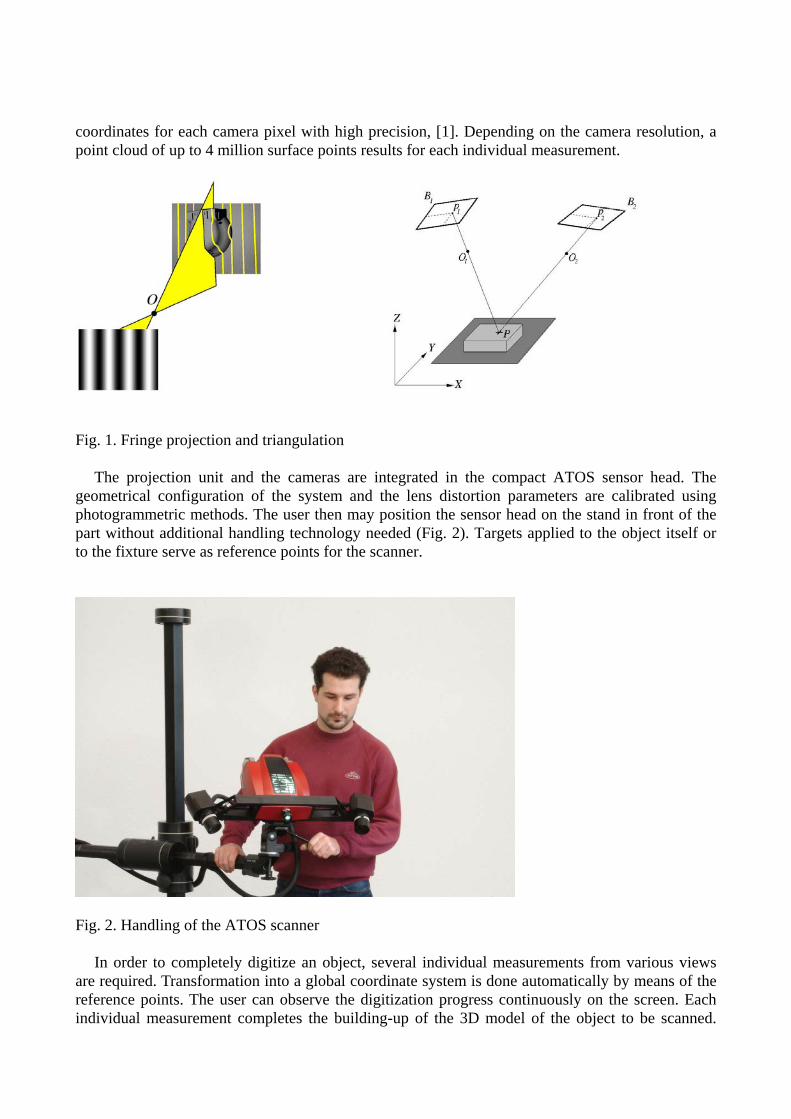
The projection unit and the cameras are integrated in the compact ATOS sensor head. The geometrical configuration of the system and the lens distortion parameters are calibrated using photogrammetric methods. The user then may position the sensor head on the stand in front of the part without additional handling technology needed (Fig. 2). Targets applied to the object itself or to the fixture serve as reference points for the scanner.
Fig. 2. Handling of the ATOS scanner
In order to completely digitize an object, several individual measurements from various views are required. Transformation into a global coordinate system is done automatically by means of the reference points. The user can observe the digitization progress continuously on the screen. Each individual measurement completes the building-up of the 3D model of the object to be scanned.
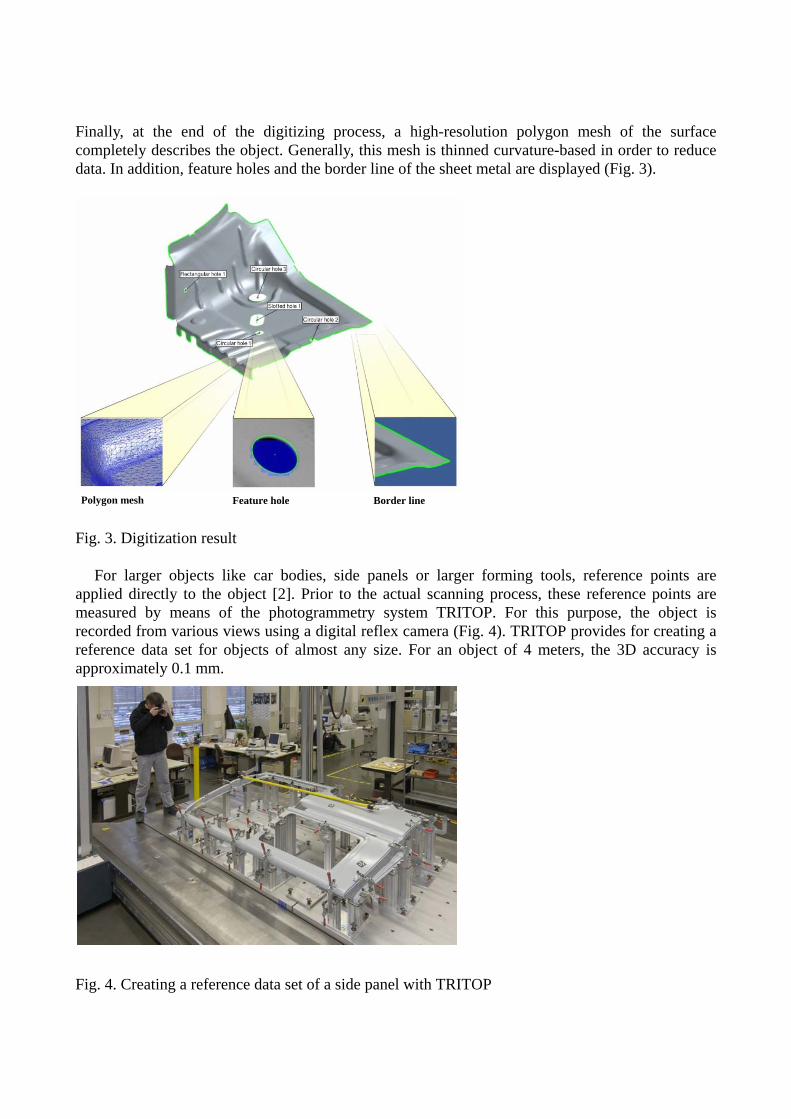
Finally, at the end of the digitizing process, a high-resolution polygon mesh of the surface completely describes the object. Generally, this mesh is thinned curvature-based in order to reduce data. In addition, feature holes and the border line of the sheet metal are displayed (Fig. 3).
Fig. 3. Digitization result
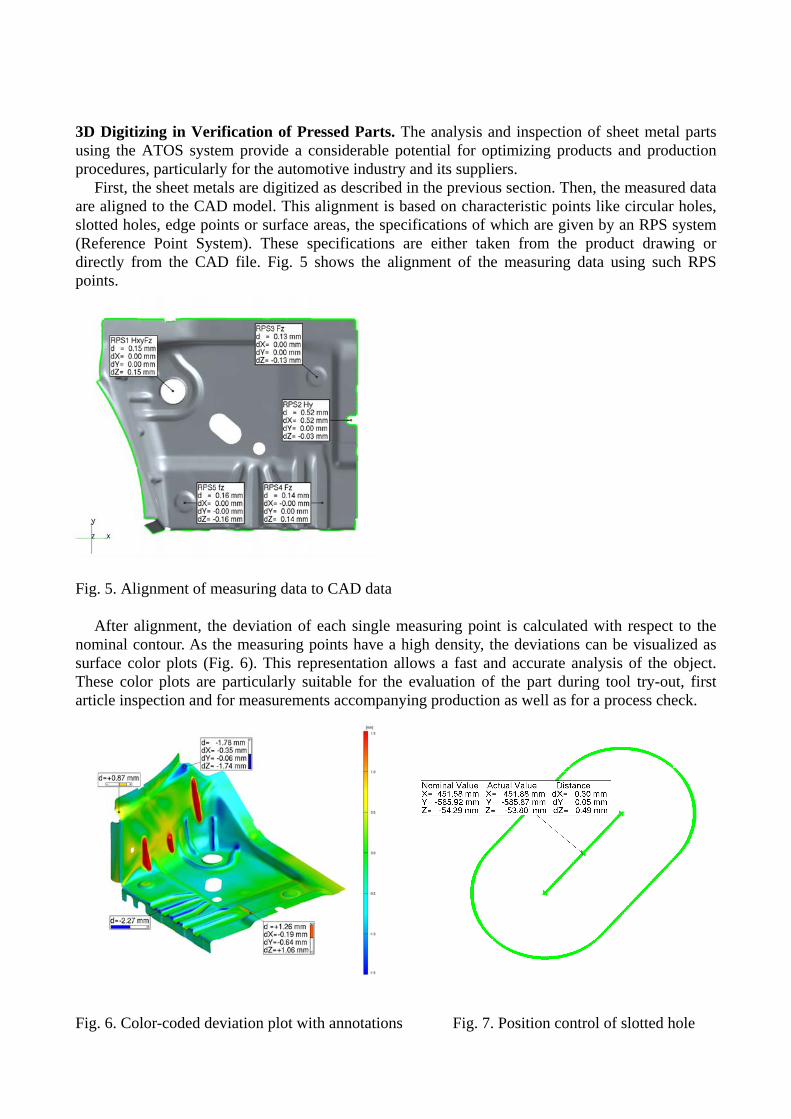
For larger objects like car bodies, side panels or larger forming tools, reference points are applied directly to the object [2]. Prior to the actual scanning process, these reference points are measured by means of the photogrammetry system TRITOP. For this purpose, the object is recorded from various views using a digital reflex camera (Fig. 4). TRITOP provides for creating a reference data set for objects of almost any size. For an object of 4 meters, the 3D accuracy is approximately 0.1 mm. Fig. 4. Creating a reference data set of a side panel with TRITOP
Polygon mesh Feature hole Border line
3D Digitizing in Verification of Pressed Parts. The analysis and inspection of sheet metal parts using the ATOS system provide a considerable potential for optimizing products and production procedures, particularly for the automotive industry and its suppliers.
First, the sheet metals are digitized as described in the previous section. Then, the measured data are aligned to the CAD model. This alignment is based on characteristic points like circular holes, slotted holes, edge points or surface areas, the specifications of which are given by an RPS system (Reference Point System). These specifications are either taken from the product drawing or directly from the CAD file. Fig. 5 shows the alignment of the measuring data using such RPS points.
Fig. 5. Alignment of measuring data to CAD data
After alignment, the deviation of each single measuring point is calculated with respect to the nominal contour. As the measuring points have a high density, the deviations can be visualized as surface color plots (Fig. 6). This representation allows a fast and accurate analysis of the object. These color plots are particularly suitable for the evaluation of the part during tool try-out, first article inspection and for measurements accompanying production as well as for a process check.
Fig. 6. Color-coded deviation plot with annotations Fig. 7. Position control of slotted hole
In addition to the surface representation, the position of holes, slotted holes, border lines etc. can be determined. The deviation in space with respect to the nominal values can be displayed in form of labels or tables (Fig. 7). Frequently, tolerance values are specified which have to be complied with when comparing the nominal and the actual value.
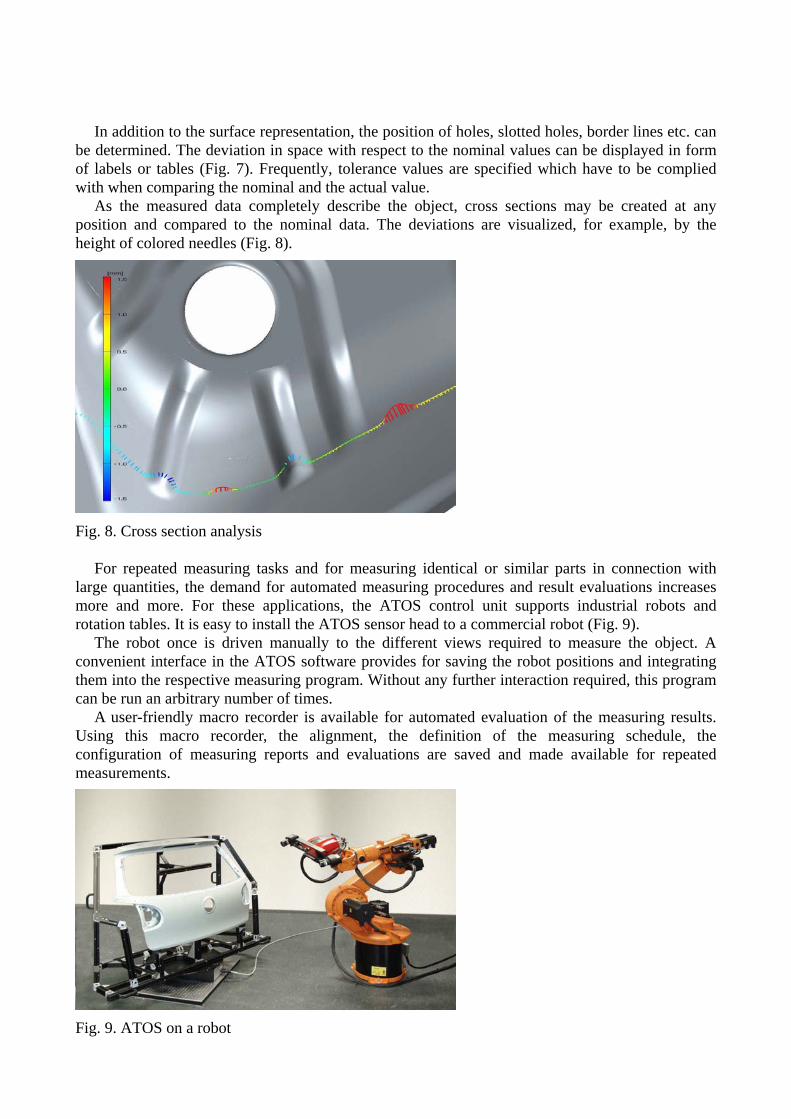
As the measured data completely describe the object, cross sections may be created at any position and compared to the nominal data. The deviations are visualized, for example, by the height of colored needles (Fig. 8).
Fig. 8. Cross section analysis
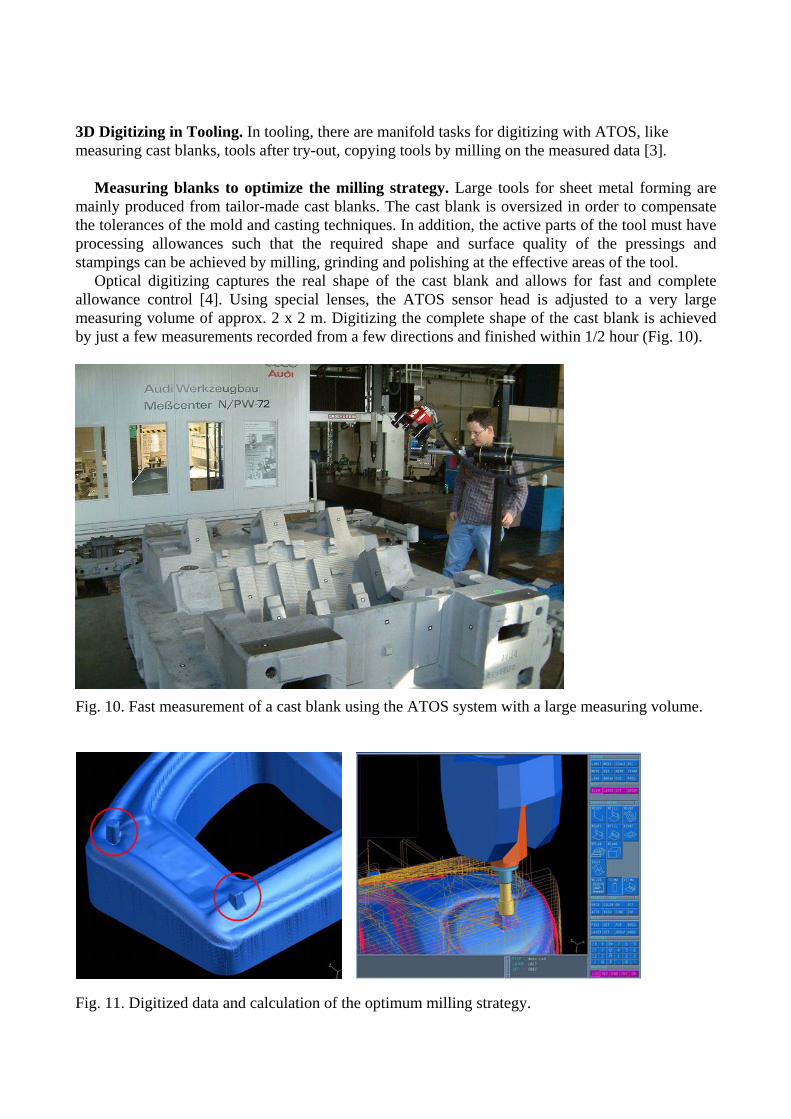
For repeated measuring tasks and for measuring identical or similar parts in connection with large quantities, the demand for automated measuring procedures and result evaluations increases more and more. For these applications, the ATOS control unit supports industrial robots and rotation tables. It is easy to install the ATOS sensor head to a commercial robot (Fig. 9).
The robot once is driven manually to the different views required to measure the object. A convenient interface in the ATOS software provides for saving the robot positions and integrating them into the respective measuring program. Without any further interaction required, this program can be run an arbitrary number of times.
A user-friendly macro recorder is available for automated evaluation of the measuring results. Using this macro recorder, the alignment, the definition of the measuring schedule, the configuration of measuring reports and evaluations are saved and made available for repeated measurements.
Fig. 9. ATOS on a robot
3D Digitizing in Tooling. In tooling, there are manifold tasks for digitizing with ATOS, like measuring cast blanks, tools after try-out, copying tools by milling on the measured data [3].
Measuring blanks to optimize the milling strategy. Large tools for sheet metal forming are mainly produced from tailor-made cast blanks. The cast blank is oversized in order to compensate the tolerances of the mold and casting techniques. In addition, the active parts of the tool must have processing allowances such that the required shape and surface quality of the pressings and stampings can be achieved by milling, grinding and polishing at the effective areas of the tool.
Optical digitizing captures the real shape of the cast blank and allows for fast and complete allowance control [4]. Using special lenses, the ATOS sensor head is adjusted to a very large measuring volume of approx. 2 x 2 m. Digitizing the complete shape of the cast blank is achieved by just a few measurements recorded from a few directions and finished within 1/2 hour (Fig. 10).
Fig. 10. Fast measurement of a cast blank using the ATOS system with a large measuring volume. Fig. 11. Digitized data and calculation of the optimum milling strategy.
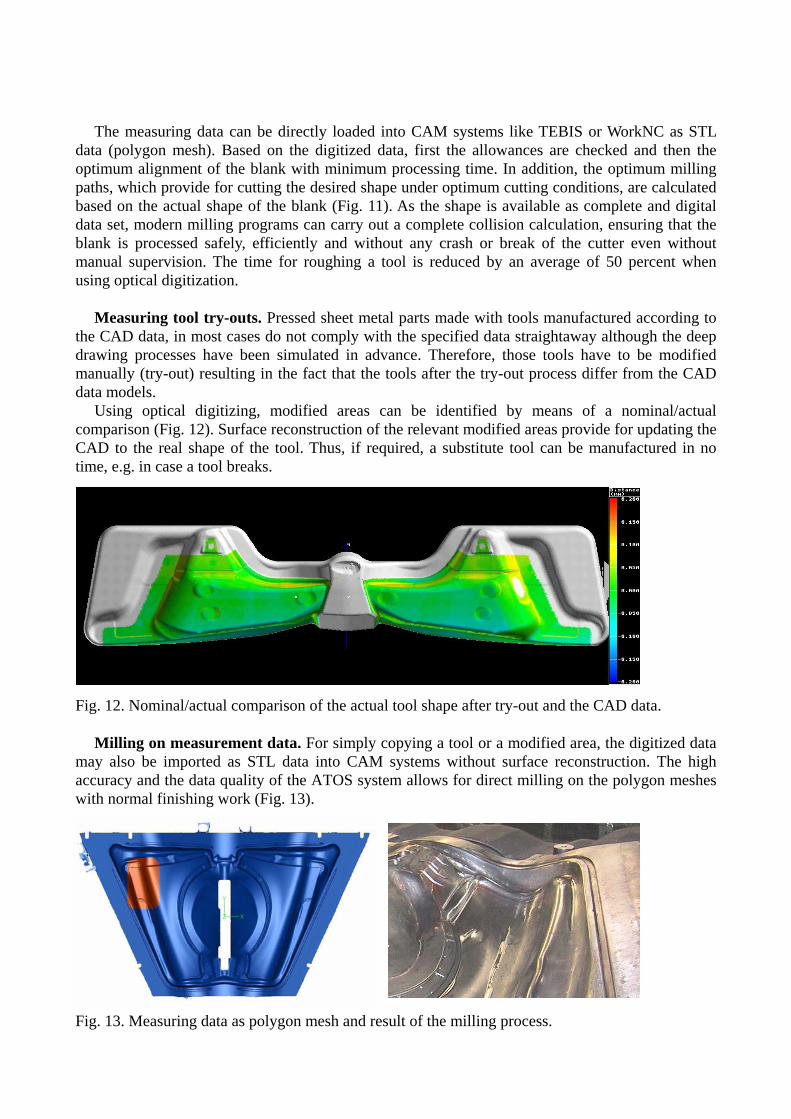
The measuring data can be directly loaded into CAM systems like TEBIS or WorkNC as STL data (polygon mesh). Based on the digitized data, first the allowances are checked and then the optimum alignment of the blank with minimum processing time. In addition, the optimum milling paths, which provide for cutting the desired shape under optimum cutting conditions, are calculated based on the actual shape of the blank (Fig. 11). As the shape is available as complete and digital data set, modern milling programs can carry out a complete collision calculation, ensuring that the blank is processed safely, efficiently and without any crash or break of the cutter even without manual supervision. The time for roughing a tool is reduced by an average of 50 percent when using optical digitization.
Measuring tool try-outs. Pressed sheet metal parts made with tools manufactured according to the CAD data, in most cases do not comply with the specified data straightaway although the deep drawing processes have been simulated in advance. Therefore, those tools have to be modified manually (try-out) resulting in the fact that the tools after the try-out process differ from the CAD data models.
Using optical digitizing, modified areas can be identified by means of a nominal/actual comparison (Fig. 12). Surface reconstruction of the relevant modified areas provide for updating the CAD to the real shape of the tool. Thus, if required, a substitute tool can be manufactured in no time, e.g. in case a tool breaks.
Fig. 12. Nominal/actual comparison of the actual tool shape after try-out and the CAD data.
Milling on measurement data. For simply copying a tool or a modified area, the digitized data may also be imported as STL data into CAM systems without surface reconstruction. The high accuracy and the data quality of the ATOS system allows for direct milling on the polygon meshes with normal finishing work (Fig. 13). Fig. 13. Measuring data as polygon mesh and result of the milling process.
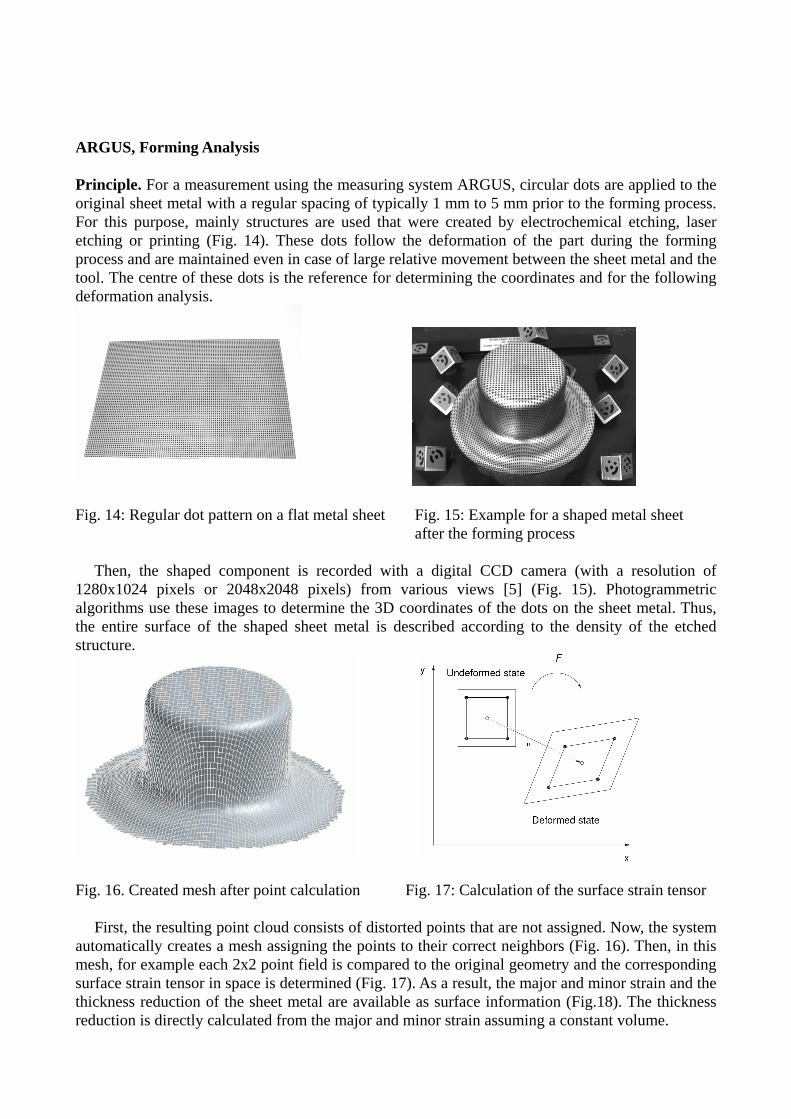
ARGUS, Forming Analysis Principle. For a measurement using the measuring system ARGUS, circular dots are applied to the original sheet metal with a regular spacing of typically 1 mm to 5 mm prior to the forming process. For this purpose, mainly structures are used that were created by electrochemical etching, laser etching or printing (Fig. 14). These dots follow the deformation of the part during the forming process and are maintained even in case of large relative movement between the sheet metal and the tool. The centre of these dots is the reference for determining the coordinates and for the following deformation analysis.
Fig. 14: Regular dot pattern on a flat metal sheet Fig. 15: Example for a shaped metal sheet
after the forming process Then, the shaped component is recorded with a digital CCD camera (with a resolution of
1280x1024 pixels or 2048x2048 pixels) from various views [5] (Fig. 15). Photogrammetric algorithms use these images to determine the 3D coordinates of the dots on the sheet metal. Thus, the entire surface of the shaped sheet metal is described according to the density of the etched structure.
Fig. 16. Created mesh after point calculation Fig. 17: Calculation of the surface strain tensor
First, the resulting point cloud consists of distorted points that are not assigned. Now, the system automatically creates a mesh assigning the points to their correct neighbors (Fig. 16). Then, in this mesh, for example each 2x2 point field is compared to the original geometry and the corresponding surface strain tensor in space is determined (Fig. 17). As a result, the major and minor strain and the thickness reduction of the sheet metal are available as surface information (Fig.18). The thickness reduction is directly calculated from the major and minor strain assuming a constant volume.
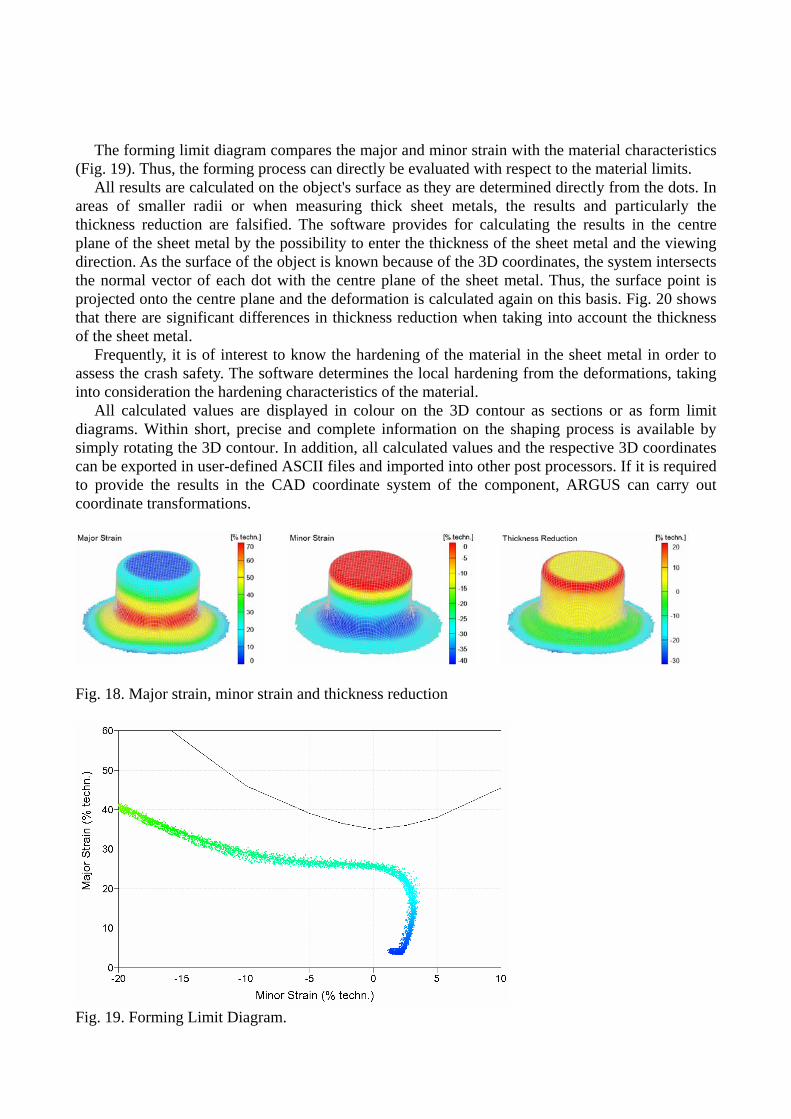
The forming limit diagram compares the major and minor strain with the material characteristics
(Fig. 19). Thus, the forming process can directly be evaluated with respect to the material limits. All results are calculated on the object's surface as they are determined directly from the dots. In
areas of smaller radii or when measuring thick sheet metals, the results and particularly the thickness reduction are falsified. The software provides for calculating the results in the centre plane of the sheet metal by the possibility to enter the thickness of the sheet metal and the viewing direction. As the surface of the object is known because of the 3D coordinates, the system intersects the normal vector of each dot with the centre plane of the sheet metal. Thus, the surface point is projected onto the centre plane and the deformation is calculated again on this basis. Fig. 20 shows that there are significant differences in thickness reduction when taking into account the thickness of the sheet metal.
Frequently, it is of interest to know the hardening of the material in the sheet metal in order to assess the crash safety. The software determines the local hardening from the deformations, taking into consideration the hardening characteristics of the material.
All calculated values are displayed in colour on the 3D contour as sections or as form limit diagrams. Within short, precise and complete information on the shaping process is available by simply rotating the 3D contour. In addition, all calculated values and the respective 3D coordinates can be exported in user-defined ASCII files and imported into other post processors. If it is required to provide the results in the CAD coordinate system of the component, ARGUS can carry out coordinate transformations.
Fig. 18. Major strain, minor strain and thickness reduction
Fig. 19. Forming Limit Diagram.
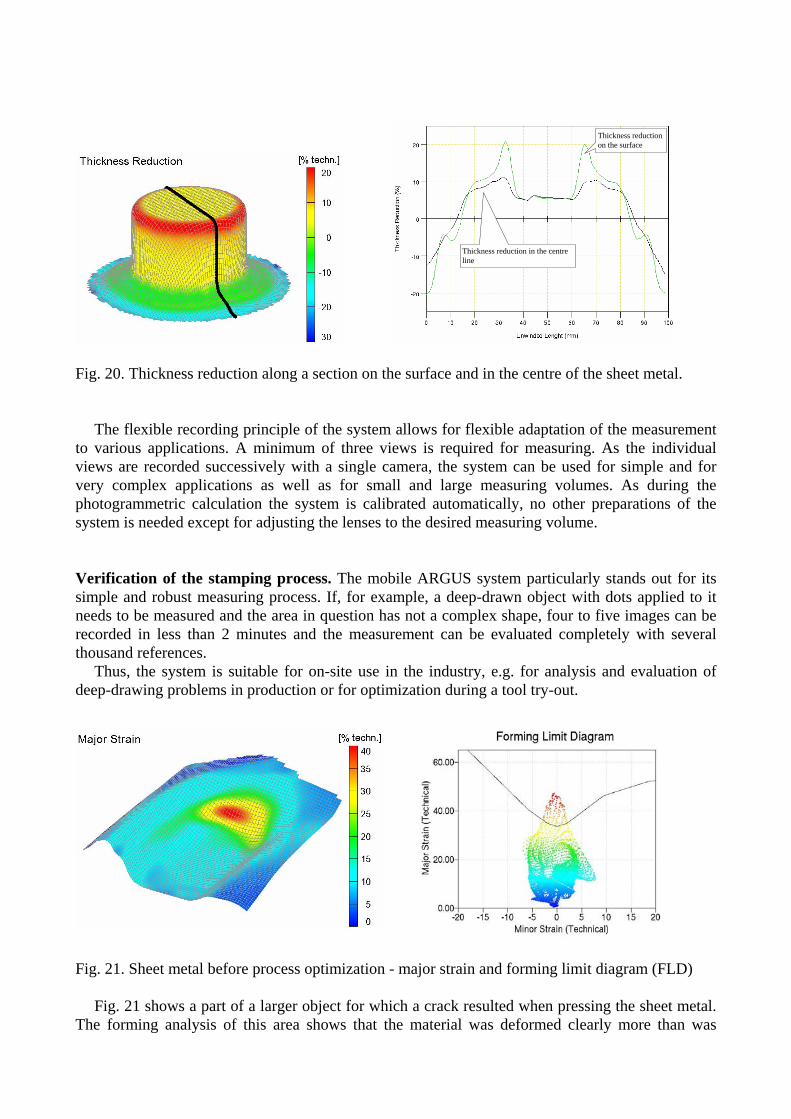
Fig. 20. Thickness reduction along a section on the surface and in the centre of the sheet metal.
The flexible recording principle of the system allows for flexible adaptation of the measurement
to various applications. A minimum of three views is required for measuring. As the individual views are recorded successively with a single camera, the system can be used for simple and for very complex applications as well as for small and large measuring volumes. As during the photogrammetric calculation the system is calibrated automatically, no other preparations of the system is needed except for adjusting the lenses to the desired measuring volume. Verification of the stamping process. The mobile ARGUS system particularly stands out for its simple and robust measuring process. If, for example, a deep-drawn object with dots applied to it needs to be measured and the area in question has not a complex shape, four to five images can be recorded in less than 2 minutes and the measurement can be evaluated completely with several thousand references.
Thus, the system is suitable for on-site use in the industry, e.g. for analysis and evaluation of deep-drawing problems in production or for optimization during a tool try-out. Fig. 21. Sheet metal before process optimization - major strain and forming limit diagram (FLD)
Fig. 21 shows a part of a larger object for which a crack resulted when pressing the sheet metal. The forming analysis of this area shows that the material was deformed clearly more than was
Thickness reduction in the centre line
Thickness reduction on the surface
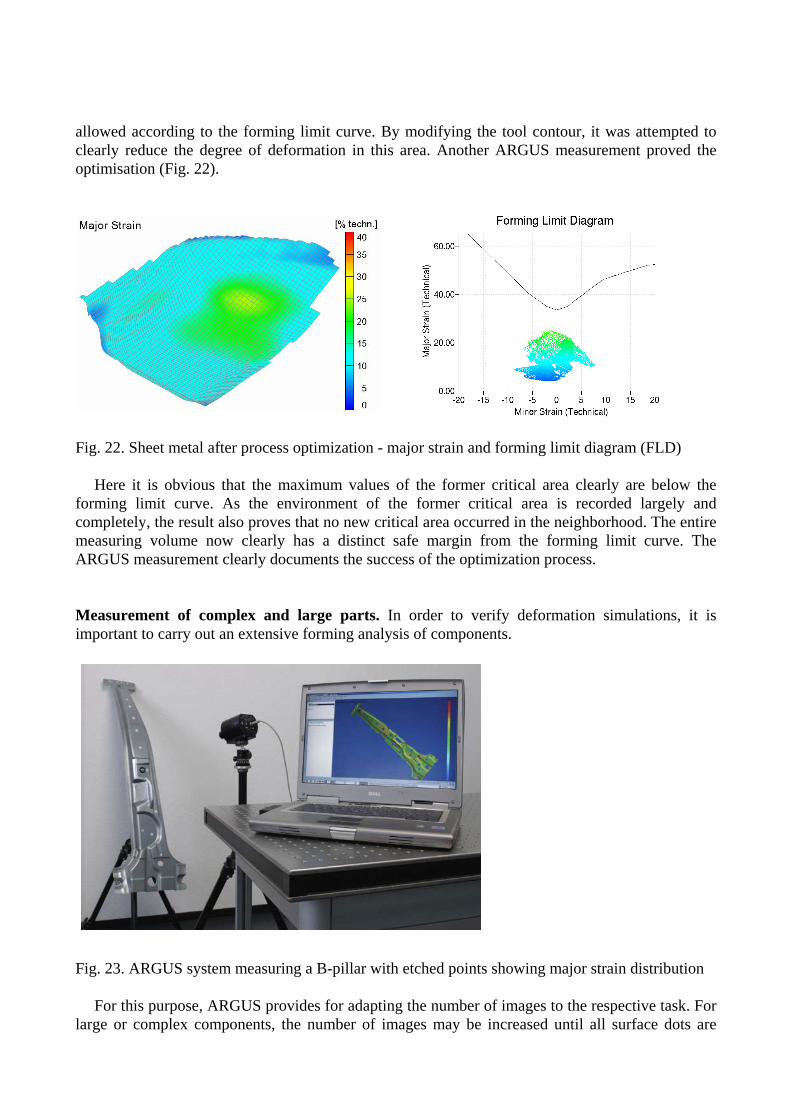
allowed according to the forming limit curve. By modifying the tool contour, it was attempted to clearly reduce the degree of deformation in this area. Another ARGUS measurement proved the optimisation (Fig. 22).
Fig. 22. Sheet metal after process optimization - major strain and forming limit diagram (FLD)
Here it is obvious that the maximum values of the former critical area clearly are below the forming limit curve. As the environment of the former critical area is recorded largely and completely, the result also proves that no new critical area occurred in the neighborhood. The entire measuring volume now clearly has a distinct safe margin from the forming limit curve. The ARGUS measurement clearly documents the success of the optimization process. Measurement of complex and large parts. In order to verify deformation simulations, it is important to carry out an extensive forming analysis of components. Fig. 23. ARGUS system measuring a B-pillar with etched points showing major strain distribution
For this purpose, ARGUS provides for adapting the number of images to the respective task. For large or complex components, the number of images may be increased until all surface dots are
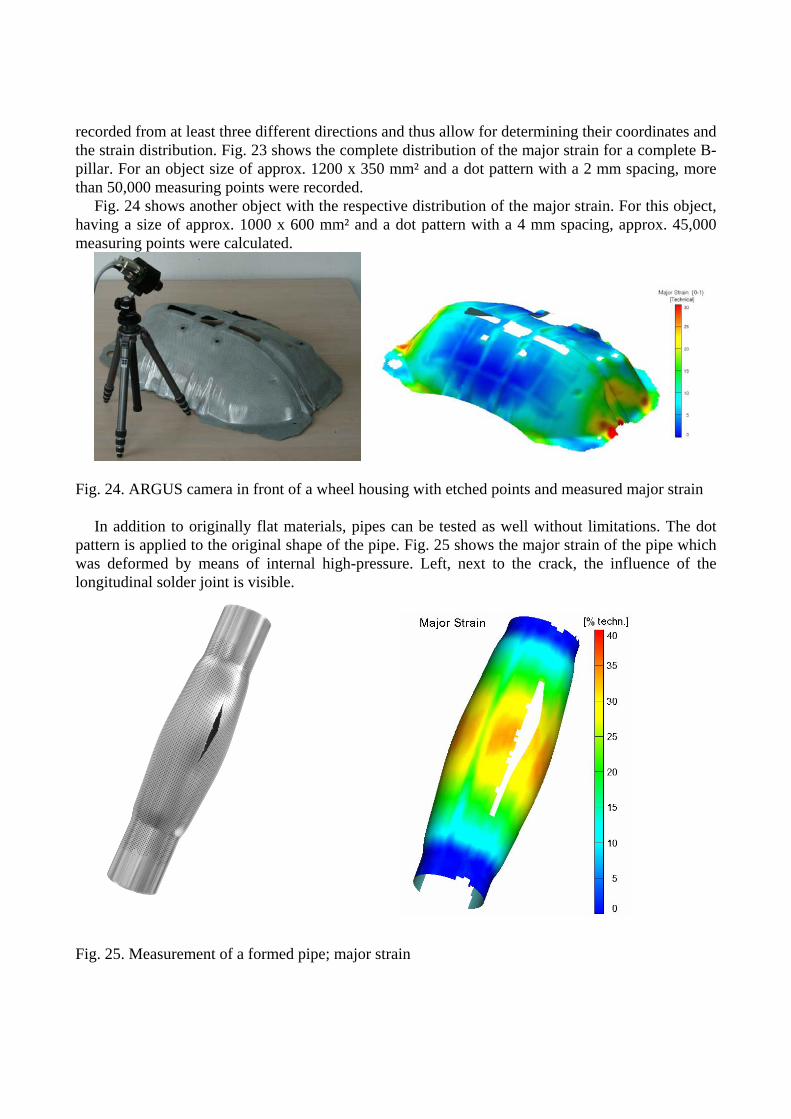
recorded from at least three different directions and thus allow for determining their coordinates and the strain distribution. Fig. 23 shows the complete distribution of the major strain for a complete B-pillar. For an object size of approx. 1200 x 350 mm² and a dot pattern with a 2 mm spacing, more than 50,000 measuring points were recorded.
Fig. 24 shows another object with the respective distribution of the major strain. For this object, having a size of approx. 1000 x 600 mm² and a dot pattern with a 4 mm spacing, approx. 45,000 measuring points were calculated.
Fig. 24. ARGUS camera in front of a wheel housing with etched points and measured major strain
In addition to originally flat materials, pipes can be tested as well without limitations. The dot pattern is applied to the original shape of the pipe. Fig. 25 shows the major strain of the pipe which was deformed by means of internal high-pressure. Left, next to the crack, the influence of the longitudinal solder joint is visible. Fig. 25. Measurement of a formed pipe; major strain
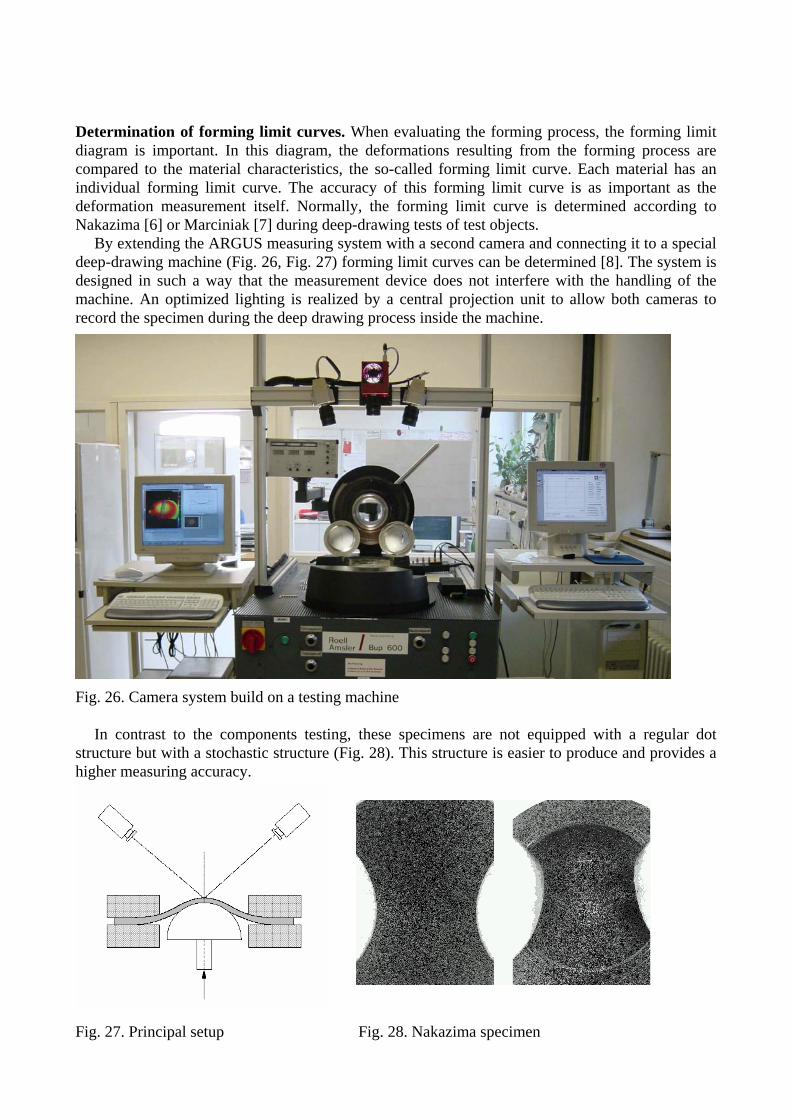
Determination of forming limit curves. When evaluating the forming process, the forming limit diagram is important. In this diagram, the deformations resulting from the forming process are compared to the material characteristics, the so-called forming limit curve. Each material has an individual forming limit curve. The accuracy of this forming limit curve is as important as the deformation measurement itself. Normally, the forming limit curve is determined according to Nakazima [6] or Marciniak [7] during deep-drawing tests of test objects.
By extending the ARGUS measuring system with a second camera and connecting it to a special deep-drawing machine (Fig. 26, Fig. 27) forming limit curves can be determined [8]. The system is designed in such a way that the measurement device does not interfere with the handling of the machine. An optimized lighting is realized by a central projection unit to allow both cameras to record the specimen during the deep drawing process inside the machine.
Fig. 26. Camera system build on a testing machine
In contrast to the components testing, these specimens are not equipped with a regular dot structure but with a stochastic structure (Fig. 28). This structure is easier to produce and provides a higher measuring accuracy.
Fig. 27. Principal setup Fig. 28. Nakazima specimen
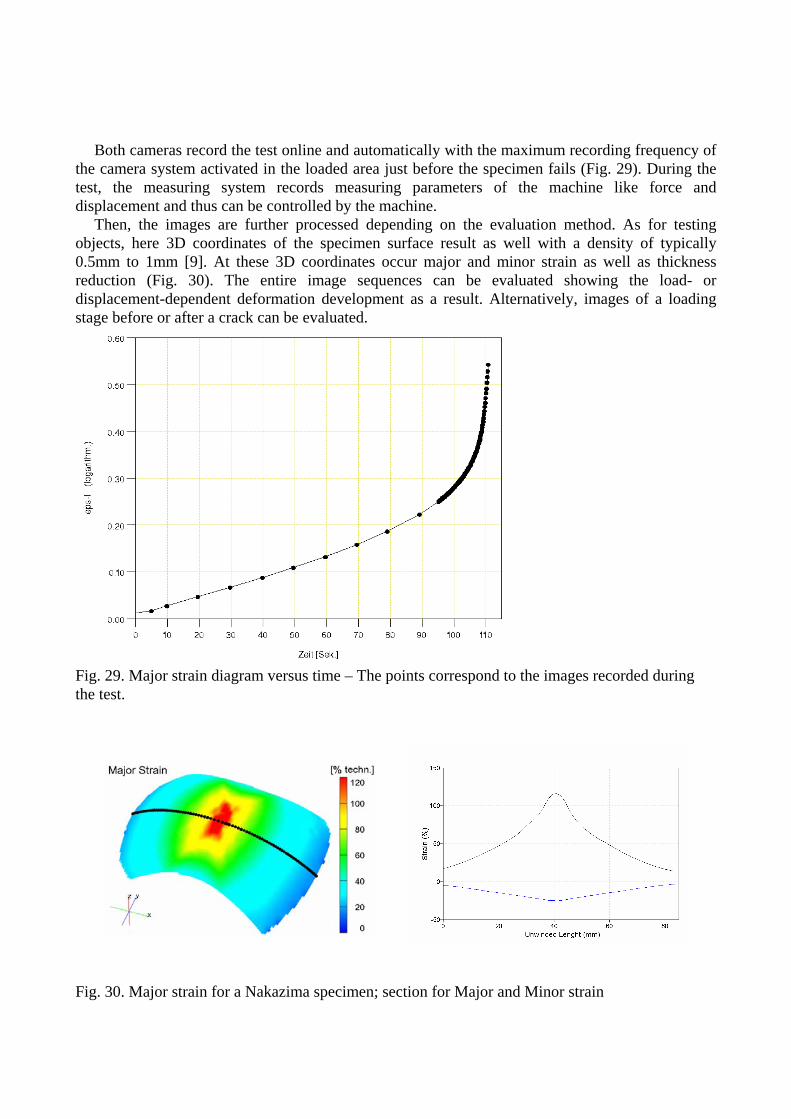
Both cameras record the test online and automatically with the maximum recording frequency of
the camera system activated in the loaded area just before the specimen fails (Fig. 29). During the test, the measuring system records measuring parameters of the machine like force and displacement and thus can be controlled by the machine.
Then, the images are further processed depending on the evaluation method. As for testing objects, here 3D coordinates of the specimen surface result as well with a density of typically 0.5mm to 1mm [9]. At these 3D coordinates occur major and minor strain as well as thickness reduction (Fig. 30). The entire image sequences can be evaluated showing the load- or displacement-dependent deformation development as a result. Alternatively, images of a loading stage before or after a crack can be evaluated.
Fig. 29. Major strain diagram versus time – The points correspond to the images recorded during the test. Fig. 30. Major strain for a Nakazima specimen; section for Major and Minor strain
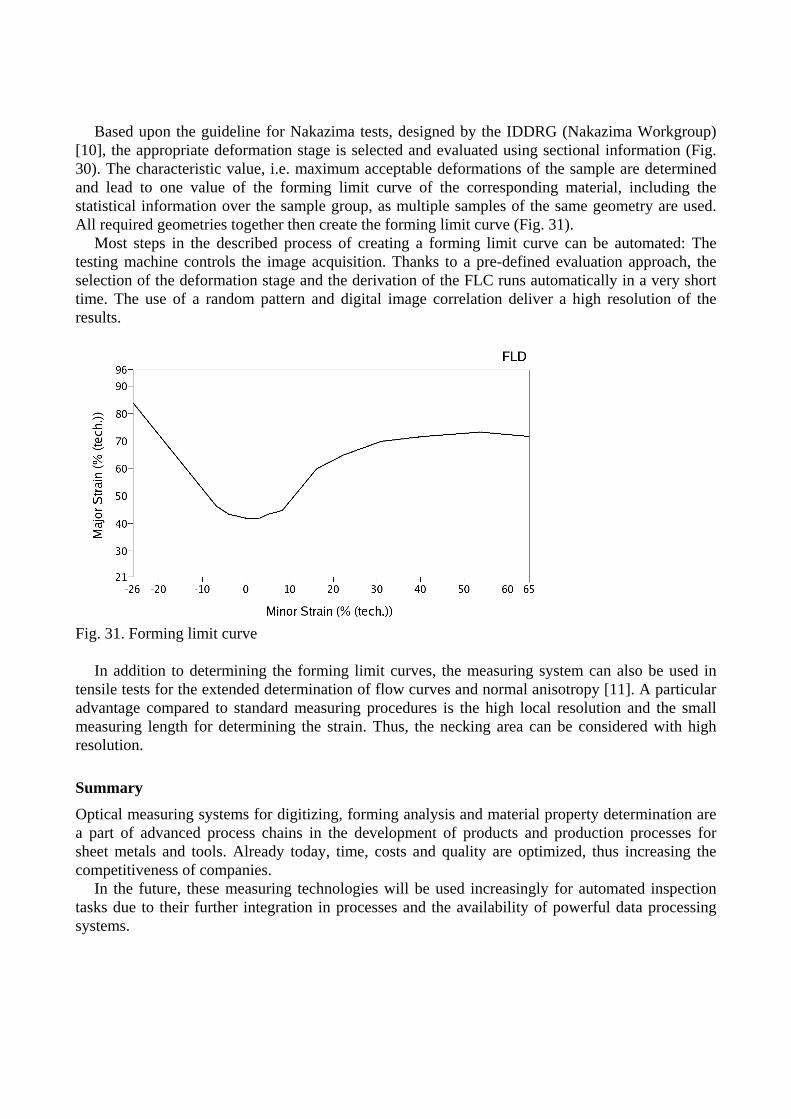
Based upon the guideline for Nakazima tests, designed by the IDDRG (Nakazima Workgroup) [10], the appropriate deformation stage is selected and evaluated using sectional information (Fig. 30). The characteristic value, i.e. maximum acceptable deformations of the sample are determined and lead to one value of the forming limit curve of the corresponding material, including the statistical information over the sample group, as multiple samples of the same geometry are used. All required geometries together then create the forming limit curve (Fig. 31).
Most steps in the described process of creating a forming limit curve can be automated: The testing machine controls the image acquisition. Thanks to a pre-defined evaluation approach, the selection of the deformation stage and the derivation of the FLC runs automatically in a very short time. The use of a random pattern and digital image correlation deliver a high resolution of the results.
Fig. 31. Forming limit curve
In addition to determining the forming limit curves, the measuring system can also be used in tensile tests for the extended determination of flow curves and normal anisotropy [11]. A particular advantage compared to standard measuring procedures is the high local resolution and the small measuring length for determining the strain. Thus, the necking area can be considered with high resolution.
Summary
Optical measuring systems for digitizing, forming analysis and material property determination are a part of advanced process chains in the development of products and production processes for sheet metals and tools. Already today, time, costs and quality are optimized, thus increasing the competitiveness of companies.
In the future, these measuring technologies will be used increasingly for automated inspection tasks due to their further integration in processes and the availability of powerful data processing systems.
References
[1] Reich, C., Ritter, R., Thesing, J. 3D-shape measurement of complex objects by combining photogrammetry and fringe projection. Optical Engineering, 39(1), 2000, 224-231.
[2] Winter, D., Bergmann, D., Galanulis, K., Thesing, J. Qualitätssicherung und Digitalisierung mit Photogrammetrie und Streifenprojektion. In Fachtagung Optische Formerfassung, Berichtsband 70, 45-53. VDI/DVE - GMA und Deutsche Gesellschaft für Zerstörungsfreie Prüfung e.V., Stuttgart, 1999.
[3] Röder, M., Winter, D., 3D-Digitalisierung im Werkzeug und Formenbau. VDI-Z 145 (2003) Nr. 10 Oktober, 62-65
[4] Werkzeuge digitalisieren. VDWF aktuell, Ausgabe 01/2004
[5] Alpers, B., Bergmann, D., Galanulis, K., Winter, D.: Advanced deformation measurement in sheet metal forming, Proceedings of the 6th ICTP, September 1999
[6] Nakazima, K., Kikuma, T., Asaku, K.: Study on the formability of steel sheet. Yawata Technical Reports 264, 1968.
[7] Marciniak, Z., Kuczynski, K., Limit Strains in the process of stretch-forming sheet metal. Int. Journal of Mech. Science 9, 1967: 609-620.
[8] Galanulis, K., and Hofmann, A., Determination of Forming Limit Diagrams Using an Optical Measurement System, Proceedings of Shetmet 99, Braunschweig, Germany, October 1999.
[9] Tyson, J., Schmidt, T., Galanulis, K. Advanced Photogrammetry for Robust Deformation and Strain Measurement, Proceedings of the 2002 SEM Annual Conference & Exhibition of Experimental and Applied Mechanics, June 2002
[10] Liebertz, H., Keller, S., Merklein, M., Illig, R., Koehler, A., Kröff, A., Rauer, J., Staubwasser, L., Steinbeck, G.., Hotz, W., Vegter, A., Duwel, A. Guidline for the Determination of Forming Limit Curves IDDRG May 2004
[11] Hoffmann, H., Vogl, C., Determination of True Stress-Strain-Curves and Normal Anisotropy in Tensile Tests with Optical Strain Measurement STC F, 52/1/2003, p.217 CIRP Annals - 2003