optical instrumentation for shock tube and ballistic range ... · optical instrumentation for shock...
TRANSCRIPT

RTO-EN-AVT-186 6 - 1
Advanced Spectroscopic and Thermal Imaging Instrumentation for Shock Tube and Ballistic Range Facilities
Jay H. Grinstead, Michael C. Wilder, and Daniel C. Reda NASA Ames Research Center Moffett Field, CA 94035 USA
Brett A. Cruden and David W. Bogdanoff ELORET, Inc.
Moffett Field, CA 94035 USA
ABSTRACT
The Electric Arc Shock Tube (EAST) facility and Hypervelocity Free Flight Aerodynamic Facility (HFFAF, an aeroballistic range) at NASA Ames support basic research in aerothermodynamic phenomena of atmospheric entry, specifically shock layer radiation spectroscopy, convective and radiative heat transfer, and transition to turbulence. Innovative optical instrumentation has been developed and implemented to meet the challenges posed from obtaining such data in these impulse facilities. Spatially and spectrally resolved measurements of absolute radiance of a travelling shock wave in EAST are acquired using multiplexed, time-gated imaging spectrographs. Nearly complete spectral coverage from the vacuum ultraviolet to the near infrared is possible in a single experiment. Time-gated thermal imaging of ballistic range models in flight enables quantitative, global measurements of surface temperature. These images can be interpreted to determine convective heat transfer rates and reveal transition to turbulence due to isolated and distributed surface roughness at hypersonic velocities. The focus of this paper is a detailed description of the optical instrumentation currently in use in the EAST and HFFAF.
1.0 INTRODUCTION
Using advanced experimental techniques, simulation, and innovative test planning strategies, researchers and engineers at NASA Ames have pursued an approach to ground testing that maximizes the utility of Ames’ unique shock tube and ballistic range facilities. The Electric Arc Shock Tube (EAST) facility was developed to simulate high-enthalpy flows with real gas radiative and kinetic phenomena encountered by hypersonic vehicles entering planetary atmospheres. The facility has the capability to generate shock-heated gas mixtures at velocities and pressures representative of entry trajectories. The Hypervelocity Free Flight Aerodynamic Facility (HFFAF) is an aeroballistic range that enables small-scale supersonic and hypersonic flight experiments in a disturbance-free, quiescent, real-gas environment. The HFFAF can operate under a variety of test gas pressures, up to one atmosphere, and compositions to simulate prescribed altitudes in different planetary atmospheres. Current research initiatives that utilize the EAST and HFFAF address shock radiation [1-4] and roughness-induced transition to turbulence [5-7], respectively. The instrumentation developed for these initiatives has been designed to yield accurate, quantitative data for validation of computational simulations and development of correlations for engineering and high fidelity design tools.

Report Documentation Page Form ApprovedOMB No. 0704-0188
Public reporting burden for the collection of information is estimated to average 1 hour per response, including the time for reviewing instructions, searching existing data sources, gathering andmaintaining the data needed, and completing and reviewing the collection of information. Send comments regarding this burden estimate or any other aspect of this collection of information,including suggestions for reducing this burden, to Washington Headquarters Services, Directorate for Information Operations and Reports, 1215 Jefferson Davis Highway, Suite 1204, ArlingtonVA 22202-4302. Respondents should be aware that notwithstanding any other provision of law, no person shall be subject to a penalty for failing to comply with a collection of information if itdoes not display a currently valid OMB control number.
1. REPORT DATE 2010 2. REPORT TYPE
3. DATES COVERED
4. TITLE AND SUBTITLE Advanced Spectroscopic and Thermal Imaging Instrumentation forShock Tube and Ballistic Range Facilities
5a. CONTRACT NUMBER
5b. GRANT NUMBER
5c. PROGRAM ELEMENT NUMBER
6. AUTHOR(S) 5d. PROJECT NUMBER
5e. TASK NUMBER
5f. WORK UNIT NUMBER
7. PERFORMING ORGANIZATION NAME(S) AND ADDRESS(ES) RTO/NATO, , , , ,
8. PERFORMING ORGANIZATIONREPORT NUMBER
9. SPONSORING/MONITORING AGENCY NAME(S) AND ADDRESS(ES) 10. SPONSOR/MONITOR’S ACRONYM(S)
11. SPONSOR/MONITOR’S REPORT NUMBER(S)
12. DISTRIBUTION/AVAILABILITY STATEMENT Approved for public release; distribution unlimited.
13. SUPPLEMENTARY NOTES The original document contains color images.
14. ABSTRACT Programming embedded and cyber-physical systems requires attention not only to functional behavior andcorrectness, but also to non-functional aspects and specifically timing and performance constraints. Astructured, compositional, model-based approach based on stepwise re nement and abstraction techniquescan support the development process, increase its quality and reduce development time throughautomation of synthesis, analysis or verification. For this purpose, we introduce in this paper a generaltheory of timed actor interfaces. Our theory supports a notion of refinement that is based on the principleof worst-case design that permeates the world of performance-critical systems. This is in contrast with theclassical behavioral and functional refinements based on restricting or enlarging sets of behaviors. Animportant feature of our refinement is that it allows time-deterministic abstractions to be made oftime-non-deterministic systems, improving efficiency and reducing complexity of formal analysis. We alsoshow how our theory relates to, and can be used to reconcile a number of existing time and performancemodels and how their established theories can be exploited to represent and analyze interface specificationsand refinement steps.
15. SUBJECT TERMS
16. SECURITY CLASSIFICATION OF: 17. LIMITATION OF ABSTRACT
18. NUMBEROF PAGES
24
19a. NAME OFRESPONSIBLE PERSON
a. REPORT unclassified
b. ABSTRACT unclassified
c. THIS PAGE unclassified
Standard Form 298 (Rev. 8-98) Prescribed by ANSI Std Z39-18

Optical Instrumentation for Shock Tube and Ballistic Range Facilities
6 - 2 RTO-EN-AVT-186
Because of the high temperatures involved, aerothermodynamic phenomena create gas and surface radiation that can be interpreted to yield properties of interest, such as temperatures, convective and radiative heat fluxes, kinetic rates, species composition or electron densities. The types of instrumentation that most readily lend themselves to successful non-intrusive, off-body application are optically based. Decades of research in hypervelocity and high enthalpy facilities have left a legacy of optical instrumentation techniques that continues to mature through adoption of advanced photonic technologies. The nature of impulse facilities requires the use of instrumentation that can capture the necessary data in only a short period of time – typically on the order of one microsecond or less.
Besides spark shadowgraph and schlieren photography, an early (1960s) use of optical technologies in shock tubes, shock tunnels, and ballistic ranges was for radiometry [8]. These first radiometers often utilized photomultipler tubes as detectors. New solid-state infrared detectors were becoming available at the time and were also used for radiometry. Broadband radiometers were characterized by the extent of their spectral response, which was defined by the photocathode material and window transmission. Narrowband radiometers used band pass filters or monochromators between the source and detectors as spectral resolving elements. The attainable spectral range reached from the infrared (IR) down to the vacuum ultraviolet (VUV). Power sources, signal amplifiers, and signal filters were optimized to meet requirements for sensitivity and temporal response. At the time, the only method available for recording transient signals was the use of a film camera coupled to an oscilloscope.
Radiometers were used for shock radiance measurements in the ballistic range and shock tube facilities at Ames [8] during the 1960s and 1970s. These radiometers collected light through windows, and spatial filters restricted the field of view to a narrow region normal to the shock tube axis. Typically several radiometers at once were employed to increase the spectral resolution and coverage. One ballistic range application utilized 18 monochromator-radiometers – 9 on each side of the facility – to collect the bow shock radiation as the model traversed a short flight distance. Each instrument had a different pass band [8]. A novel approach for spectroradiometry was used in a ballistic range experiment in which the motion of the model itself functioned as the scanning element to realize spectral resolution [9].
By the 1980s, time-gated optical multichannel analyzers (OMA) and microchannel plate (MCP) intensifiers became available, enabling spectroscopy measurements with greater sensitivity and higher spectral and temporal resolution. The electronic shuttering capability of an MCP photocathode allows exposure times as short as tens of nanoseconds – sufficiently short to “freeze” any spatial translation or gas-kinetic relaxation events. Monochromators became spectrographs as photomultipliers and exit slits were replaced by OMAs. Charge-coupled device arrays mated to MCP image intensifiers, also known as intensified charge-coupled device (ICCD) detectors, further opened new avenues for spectroscopy in impulse facilities. The optical designs of some contemporary spectrographs have been optimized to enable spatially resolved imaging over the length of the instrument’s entrance slit. Spatial resolution is preserved at the exit plane, thereby providing dispersed spectra at multiple points simultaneously. The spatially and spectrally resolved image at the exit plane is recorded by an ICCD – at a single time instant. Known as imaging spectroscopy, the technique has been implemented and matured over the last several years in the EAST facility [1-4].
Global surface temperature imaging of ballistic range models in flight enables quantitative and qualitative assessment of aerothermodynamic phenomena affecting heating rates. Spatially and temporally resolved surface temperatures can also reveal critical performance parameters of thermal protection materials under real-gas, hypersonic flow conditions [10]. For example, a sudden rise in surface temperature vs. axial location can indicate the presence and location of a boundary layer transition front due to surface roughness [5-7].

Optical Instrumentation for Shock Tube and Ballistic Range Facilities
RTO-EN-AVT-186 6 - 3
The importance of global surface temperature imaging in ballistic range experiments was identified in the 1970s, primarily to enable the study of roughness-induced transition on ablative re-entry vehicle nosetips [11,12]. The challenges of imaging a projectile at hypersonic speeds, with sufficient temporal, spatial, and intensity resolution to determine global surface temperatures, were met with innovative uses of film photography and emerging electro-optical technologies. The required spatial and temporal resolution for ballistic range experiments was realized using an image converter [13], a precursor of today’s MCP image intensifiers. The re-emitted image from the image converter’s phosphor was relayed to film. Just as the ICCD detector has transformed spectroscopy in shock tube facilities, it has also improved the technique of quantitative thermal imaging of ballistic range models in flight.
Currently available ICCD detectors span the spectrum from approximately 900 nm in the near infrared (NIR) down to approximately 120 nm in the VUV. For thermal imaging, the near infrared cutoff places a lower limit on temperatures that can be resolved with ICCD cameras. Mid-wave infrared (MWIR) cameras, sensitive at wavelengths between 3 µm and 5 µm, enable imaging at temperatures below that achievable with ICCD cameras; however, the spatial and temporal resolutions of ICCD cameras exceed that available with MWIR cameras.
The following sections describe the test methodologies and optical instrumentation used in the EAST and HFFAF. Recent test programs, example results, and their impact on NASA missions are also summarized.
2.0 EAST FACILITY EMISSION SPECTROSCOPY
Radiation transport codes such as NEQAIR [14], Specair [15], and HARA [16] simulate nonequilibrium radiation in gases, chiefly at low densities and high temperatures. High-fidelity computational fluid dynamics (CFD) [17] or direct simulation Monte Carlo (DSMC) [18,19] codes compute the hypersonic flow environments and provide the necessary populations of chemical species that constitute a shock-heated mixture. Equilibrium, quasi-equilibrium, or nonequilibrium kinetic models are combined with line-by-line spectral models to compute the spectrally resolved radiative power emitted by a gas. Such simulations can become computationally intensive when strong coupling between the flow and radiative environments exists. Validation of these radiation transport codes relies on scarce data from ground test and flight experiments. The data requirements are legion: relevant thermochemical conditions, spectral range and resolution, spatial and temporal resolution, absolute radiance.
The flow on the stagnation line in the shock layer of a blunt-body entry vehicle in flight through an atmosphere is most closely replicated on the ground by the conditions behind a shock wave travelling at the same speed as the entry vehicle through quiescent gas in a shock tube. The similitude in flow density, velocity, and chemical kinetics behind the travelling shock in a shock tube and in the shock layer ahead of the forebody aeroshell of an entry vehicle enables simulations of the flight environment to be anchored to ground-based experimental data.
The capability to capture more than the time-resolved emission of a single spectral feature is realized with a time-gated imaging spectrograph. An imaging spectrograph spatially resolves the emission from an extended region, acquiring individual spectra at multiple points within the instrument’s field of view. By using a detector with a short exposure time, spectrally resolved emission from multiple points can be acquired at one time instant. In recent years, the EAST facility has been used exclusively for time-gated, spatially resolved measurements of shock radiance using multiple imaging spectrographs [1-4]. A new test section and imaging spectroscopy instrumentation were designed and implemented as part of the major upgrade of the EAST

Optical Instrumentation for Shock Tube and Ballistic Range Facilities
6 - 4 RTO-EN-AVT-186
facility in 2008 [4]. The new design includes collection optics that are contained within a vacuum enclosure coupled to the test section. The optical design also allows for simultaneous imaging of one axial location with four different spectrographs. The following sections describe the optical, mechanical, and calibration components currently in use.
2.1 Test section and vacuum enclosures The test section was designed for compatibility with vacuum spectroscopy instrumentation. The optical path from the test section window to the instrument’s detector must be kept under vacuum at pressures below 0.13 mPa (10-5 torr) to reduce significant absorption by air at wavelengths below approximately 195 nm. The test section, shown in Fig. 1a, has two slot windows, 121 mm long x 12.5 mm high, for imaging spectroscopy. The window ports are located on opposite sides of the test section at the same axial location. The ports were designed to reduce the recess between the inner surface of the window and tube wall by using tapered
windows. A two part (primary and secondary) assembly enables the window’s vacuum seal to be moved away from the window’s inner surface. The primary is inserted into the tube and provides a seating face for the window. The secondary, shown in Fig. 1b, supports the window, provides the vacuum-sealing surface, and also retains the window when removed from the primary. Available windows are made from lithium fluoride (LiF) for measurement in the VUV down to wavelengths of 120 nm, or fused silica for measurements between 165 nm and 1700 nm.
Two identical vacuum enclosures house the imaging optics that direct emitted radiation from the shock tube to the spectrographs. The enclosures, shown in Fig. 2, are located on opposite sides of the test section
Figure 2: Vacuum enclosures attached
to test section.
Figure 1: (a) EAST test section showing slot window primary. (b) Slot window secondary
(a ) (b )
Optical Instrumentation for Shock Tube and Ballistic Range Facilities
RTO-EN-AVT-186 6 - 5
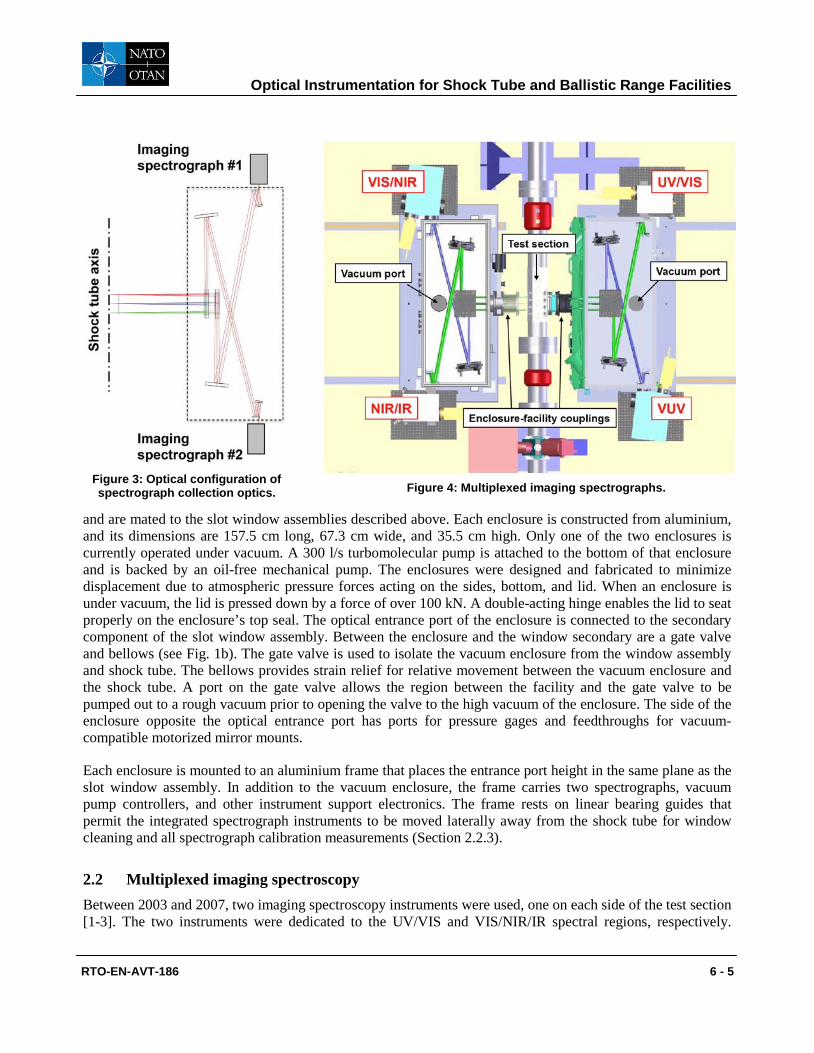
and are mated to the slot window assemblies described above. Each enclosure is constructed from aluminium, and its dimensions are 157.5 cm long, 67.3 cm wide, and 35.5 cm high. Only one of the two enclosures is currently operated under vacuum. A 300 l/s turbomolecular pump is attached to the bottom of that enclosure and is backed by an oil-free mechanical pump. The enclosures were designed and fabricated to minimize displacement due to atmospheric pressure forces acting on the sides, bottom, and lid. When an enclosure is under vacuum, the lid is pressed down by a force of over 100 kN. A double-acting hinge enables the lid to seat properly on the enclosure’s top seal. The optical entrance port of the enclosure is connected to the secondary component of the slot window assembly. Between the enclosure and the window secondary are a gate valve and bellows (see Fig. 1b). The gate valve is used to isolate the vacuum enclosure from the window assembly and shock tube. The bellows provides strain relief for relative movement between the vacuum enclosure and the shock tube. A port on the gate valve allows the region between the facility and the gate valve to be pumped out to a rough vacuum prior to opening the valve to the high vacuum of the enclosure. The side of the enclosure opposite the optical entrance port has ports for pressure gages and feedthroughs for vacuum-compatible motorized mirror mounts.
Each enclosure is mounted to an aluminium frame that places the entrance port height in the same plane as the slot window assembly. In addition to the vacuum enclosure, the frame carries two spectrographs, vacuum pump controllers, and other instrument support electronics. The frame rests on linear bearing guides that permit the integrated spectrograph instruments to be moved laterally away from the shock tube for window cleaning and all spectrograph calibration measurements (Section 2.2.3).
2.2 Multiplexed imaging spectroscopy Between 2003 and 2007, two imaging spectroscopy instruments were used, one on each side of the test section [1-3]. The two instruments were dedicated to the UV/VIS and VIS/NIR/IR spectral regions, respectively.
Figure 3: Optical configuration of spectrograph collection optics.
Figure 4: Multiplexed imaging spectrographs.

Optical Instrumentation for Shock Tube and Ballistic Range Facilities
6 - 6 RTO-EN-AVT-186
Shortcomings in the optical design, the lack of imaging capability in the VUV, cumbersome calibration procedures, and low duty cycle of the facility (typically two shots per week) motivated the design requirements for the upgraded spectroscopy instrumentation and associated systems. The most significant improvement was the implementation of two additional spectrographs, one of which operates in the VUV – the first known application of VUV imaging spectroscopy in a shock tube [4]. Doubling the number of instruments enabled shock radiance measurements from the VUV to the NIR to be acquired in a single experiment. Paired with improvements in facility availability, the data rate is now 4-5 times greater than prior to the upgrades.
2.2.1 Optical design
A travelling shock wave in a shock tube is ideally planar and normal to the shock tube axis. The nonequilibrium relaxation region behind a shock exhibits strong gradients in spectral radiance normal to the shock front. The lines of sight through the shock-heated region that are not parallel to the shock front will traverse regions of varying properties; optimum imaging performance is realized with lines of sight parallel to the shock front and thus normal to the shock tube axis. In order to maintain lines of sight parallel to the shock wave, thus minimizing the bias caused by integrating across gradients, a telecentric configuration was chosen for the collection optics design [20]. With a telecentric configuration, the chief rays from all object points within the field of view are normal to the shock tube axis, thus reducing spatial blur from non-normal rays.
Each of the two vacuum enclosures contains the collection optics for two independent optical channels (four total) that image two nearly overlapping spatial regions through the slot window from slightly different azimuthal angles (Fig. 3). Flat mirrors and spherical and cylindrical powered mirrors focus and direct the imaged light onto each channel’s spectrograph. Two flat mirrors for each channel rotate the horizontal imaged region by 90̊ in order to order align the image with the vertical entrance slit of the spectrograph. Figure 4 shows the optical configuration of the four channels within the two vacuum enclosures.
The mirror sets for the four channels were fabricated to operate over different spectral ranges, enabling complete coverage from the vacuum ultraviolet through the near infrared. Table 1 lists the spectral ranges and magnifications of the mirror sets. The magnifications were chosen to conform to the array dimensions of the detectors.
2.2.2 Imaging spectrographs and detectors
The four Princeton Instruments (PI)/Acton imaging spectrographs selected for the facility have fully motorized gratings on triple-grating
Table 1: Imaging spectrograph specifications.

Optical Instrumentation for Shock Tube and Ballistic Range Facilities
RTO-EN-AVT-186 6 - 7
turrets. The grating turrets enable characterization at different spectral resolutions and wavelength ranges with a single instrument. With four instruments, spectral data can be collected over a wide range of wavelengths at low resolution. Complementary low- and high-resolution spectra can also be collected simultaneously. This approach reduces uncertainties arising from comparison of different spectra under nominally identical shot conditions where random experimental variations in shock speed would otherwise make direct comparison invalid. Presently, three of the spectrographs are SpectraPro SP2500i units. The three individually cover the ultraviolet to visible (UV/VIS), visible to near infrared
(VIS/NIR), and near infrared to infrared (NIR/IR) regions, respectively. The fourth spectrograph, a VM-504, is for the VUV. A small 70 l/s turbomolecular pump is attached to the bottom of the VM-504, and a vacuum gage is attached on the top. The three SP2500i units are equipped with motorized entrance slits and motorized filter wheels. Motorized diverter mirrors also allow use of secondary entrance/exit slits. The motorized functions are generally controllable via software. The VM-504 operates with manual entrance/exit slits and diverter mirror.
Time-gated focal plane array detectors are used to acquire the axially resolved spectra present at the exit planes of the spectrographs. Three ICCD arrays, optimized for different regions of the spectrum, cover the VUV through NIR. An unintensified “VisGaAs” array detector from FLIR Systems covers the NIR and IR out to 1700 nm. Figure 4 shows the arrangement of the two vacuum enclosures, the four imaging spectrographs, and labels identifying the spectral ranges each covers. Details of the spectrographs, their grating, and associated detectors are listed in Table 1. The ICCD detector mated to the VM-504 has purge port to introduce dry nitrogen that keeps the camera free of VUV-absorbing molecular oxygen. The purge is controlled by a flowmeter and interlocked to the ICCD power via a time-delay relay. This is to ensure that the camera is not powered on while the cavity contains significant moisture or oxygen, which can permanently damage the camera.
The four spectrograph detectors are triggered simultaneously to capture the shock wave as it passes along the window. The short exposure time (0.1-1.0 μs for the ICCD cameras, 1 μs for the NIR/IR InGaAs camera) reduces blur (spatial smearing) due to shock motion and allows for interpretation of the shock radiation image as spatiotemporal data. An example spectrum of air at 10 km/s is shown in Fig. 5. The image shows radiance as a function of position (y-axis) and wavelength (x-axis). In the spatial direction, the shock wave and contact surface (interface between driver and driven gases) are easily identified by the onset of radiation at ~3 cm and the appearance of contaminant species in the driver gas at ~10.5 cm, respectively. Between the shock wave and contact surface, presumed equilibrium and non-equilibrium regions are clearly observed.
Figure 5: Example spectrograph image with spatial and
spectral profiles. Test conditions were air at 26.7 Pa and shock velocity of 10 km/s.

Optical Instrumentation for Shock Tube and Ballistic Range Facilities
6 - 8 RTO-EN-AVT-186
2.3 Instrument calibration The spectrograph images are calibrated to enable comparison with simulations. The two pixel dimensions of the focal plane arrays are mapped to wavelength and distance. The pixel magnitude is mapped to absolute spectral radiance. Wavelength calibration is accomplished using line source lamps such as Hg, Ne, and Ar. The procedure is performed through the detector’s data acquisition and instrument control software. It uses the grating dispersion relation to calibrate each grating over the entire range it covers. The calibration is performed for each of the three gratings in the spectrograph. A line source lamp, appropriate for the targeted spectral range, is used to illuminate the secondary entrance slit of the spectrograph and produces an image of the line spectrum. The calibration procedure involves measuring the pixel coordinates of known atomic emission lines in the image at different ends of the grating operation range. The control software computes the algebraic relationship between the wavelength of the known line features and the measured pixel coordinates.
The spatial dimensions of the camera arrays were calibrated in an analogous manner. A transparent Plexiglas sheet was scribed at 1 cm increments with dark ink, creating a ruled scale for the spatial reference. The Plexiglas sheet is then mounted to a fixture such that the markings lie at the focal plane of the imaging optics. An illumination source is placed on the opposite side of the markings, and images are collected on the spectrograph detectors. The center of each scribed line is identified, and the pixel spacing is fit with a linear trend to obtain a calibrated mm/pixel value.
The emission magnitudes are calibrated to absolute radiance. Radiance and spectral radiance typically refer to light reflected from or passing through an area, with (SI) units of W/cm2-sr and W/cm2-nm-sr, respectively. The emission collected and measured in the shock tube is integrated through a volumetric region – a narrow column between the windows of the shock tube. While this is the fundamental quantity that is measured, it is often useful to convert the radiance to a volumetric radiance by normalizing the radiance by the diameter of the shock tube, 10.16 cm, giving the result as volumetric spectral radiance, W/cm3-sr-nm. In the optically thin limit, normalization allows for results from other facilities and models to be compared directly to each other and related to the fundamental radiation characteristics of atoms and molecules. If not optically thin, radiation transport calculations are necessary to enable these comparisons.
Two calibration sources are employed: an integrating sphere for wavelengths above 300 nm, and a deuterium (D2) lamp for wavelengths below 300 nm. The spectral radiances of the two sources are shown in Fig. 6. The response functions of the spectrographs, measured for each grating and wavelength configuration, are determined using these reference sources. Each measured shock radiance spectrum is divided by a response function to convert the spectrum to absolute spectral radiance. The sources and their associated fixtures are designed such that they couple directly to the vacuum enclosures of the integrated spectroscopy instruments. Calibration with these sources is a straightforward, single-step process that can be performed on a daily basis or as required. The interface hardware between the source and the enclosure mimics the slot window primary (see Section 2.1). The window secondary, attached to the vacuum enclosure, is inserted into the interface coupling. The seal between the interface coupling and the window secondary allows high vacuum to be maintained on the vacuum enclosure side of the window.
The custom integrating sphere was manufactured by SphereOptics, Inc. The sphere has an outside diameter of 305 mm and a 101 mm diameter exit port. The sphere uses five lamp sources: four quartz-tungsten-halogen (QTH) lamps and one xenon arc lamp. The xenon arc lamp is UV-filtered to prevent excess energy deposition into the integrating sphere. The total possible lamp power is 1.2 kW. The peak spectral radiance of the sphere is approximately 1.1 mW/cm2-sr-nm over a spectral range from 300-2400 nm. The manufacturer provides calibration data for the integrating sphere operated at various lamp combinations and power levels. The

Optical Instrumentation for Shock Tube and Ballistic Range Facilities
RTO-EN-AVT-186 6 - 9
integrating sphere is also equipped with calibrated, NIST-traceable performance-monitoring instruments: a fiber optic-coupled spectrometer with sensitivity from 300-900 nm, a photopic detector with visible-IR sensitivity, and a germanium/silicon photodiode sandwich detector. The spectrometer monitors the absolute spectral radiance of the sphere, while the other sensors measure a spectrally weighted total radiance. Filters are selected to bias the detection toward particular wavelength regions. Due to possible drifts in lamp output, these detectors are deemed to provide more reliable radiance values than the manufacturer-supplied radiance curves. The primary advantage of the integrating sphere is the dimension of the luminous region. The 101 mm dia. exit port extends over most of
the 121 mm-wide field-of-view (FOV) of the imaging spectrograph instruments. The manufacturer’s quoted uniformity of the spectral radiance at the exit port exceeds 98%. Only two images of the source are required for full-field calibration – a significant improvement in efficiency over a source with a comparatively small spatial extent.
The deuterium lamp used for calibration at UV and VUV wavelengths is a low-pressure arc source (model 632 from McPherson, Inc.). The lamp was calibrated for absolute spectral radiance at the BESSY synchrotron facility. Unlike the integrating sphere, however, the luminous region of the deuterium lamp is small relative to the FOV of the spectrographs. In order to measure the deuterium lamp spectrum over the spectrographs’ FOV, a translating mechanism was constructed that moves the lamp across the FOV. The mechanism is attached to the window secondary, which, in turn, is coupled to the vacuum enclosure of the integrated spectrograph instruments (Fig. 1b). The region between the lamp window and the slot window in the secondary is purged with argon or nitrogen to remove oxygen and preclude absorption along the light path. The motion of the lamp across the FOV is under computer control and is coordinated with operation of the ICCD detectors for the UV/VIS and VUV spectrographs, enabling automated and repeatable acquisition of calibration spectra.
Because of the diffuse characteristics of the arc source and the defocus within the lamp mount, the manufacturer-supplied spectral radiance curve is not treated as absolute but rather as relative spectral radiance. In order to convert to absolute units, the deuterium lamp spectra are collected in a region that overlaps with the integrating sphere spectra (300-410 nm). The (relative) response function obtained with the deuterium lamp is scaled to match the absolute response function obtained with the integrating sphere within the overlap region. The scale factor is applied at wavelengths below 300 nm, which extends the absolute calibration down to the short wavelength limits of the UV/VIS and VUV instruments – 185 nm and 120 nm, respectively.
The shock radiance is three to five orders of magnitude brighter than the radiances of the calibration sources. At the short exposure times used for the shock radiance measurements, emission from the comparatively dim calibration sources does not exceed the detection thresholds of the spectrographs. Longer exposure times are necessary in order to obtain viable spectra from the calibration sources. However, the response of the instruments does not follow a reciprocal relationship as the product of source brightness and exposure time.
Figure 6: Spectral radiances of the two
calibration sources.

Optical Instrumentation for Shock Tube and Ballistic Range Facilities
6 - 10 RTO-EN-AVT-186
The deviation from the reciprocal relationship can be quantified, however, enabling valid calibration of the shock radiance images obtained at short exposure times.
The uncertainty in absolute spectral radiance varies with instrument, configuration, spectral range, and emission magnitude. Typical values may range from approximately 15% to 40%.
2.4 Recent results Current research in the EAST facility is directed towards shock radiation spectroscopy for Earth and planetary entry
radiative heating. Examples of the most recent investigations for Earth and Mars atmospheres will be discussed in the following sections.
2.4.1 Earth: lunar return
NASA’s Crew Exploration Vehicle (CEV) Orion Aerosciences Project sponsored ground testing for the development of Earth re-entry aerodynamic and aerothermal databases for the Orion crew vehicle. For missions returning from the moon, shock layer radiation will constitute 30–50% of the total heat flux to the vehicle surface in the peak heating region of the entry trajectory. Peak heating occurs between entry velocities of 9 km/s and 11 km/s and at altitudes between 50 km and 70 km. The primary radiating species for shock-heated air are N2, N2
+, N, and O. The emitting band and line systems with significant radiative power span the VUV to NIR spectral range, approximately 80 nm to 1.5 µm. The first two phases of testing in support of Orion were conducted in mid-2006 through late 2007 [1-3], prior to completion of the major EAST facility upgrade in late 2008. The new capabilities of EAST have enabled spatially resolved measurements of VUV radiance and derived electron densities [4].
As an example of recent results, Fig. 7 shows a composite air radiation spectrum at a nominal shock velocity of 10 km/s and a (pre-shock) pressure of 26.7 Pa (0.2 torr). The test gas was hydrocarbon-free synthetic air – 79% N2 and 21% O2 by volume. The spectrum spans almost the full range possible with the four imaging spectrographs. The data from 170 nm to 1100 nm were obtained with all four instruments from a single shot at 9.94 km/s. While the NIR/IR instrument has response out to 1700 nm, three shots were required to cover the remaining spectral range between 1100 nm to 1700 nm. The spectra were averaged from the equilibrium region behind the shock. The most prominent features are atomic N and O lines in the visible and near infrared regions, an atomic N line at 174 nm in the vacuum ultraviolet, and N2 second positive (2+, C 3Π – B 3Π) and N2
+ first negative (1–, B 2Σ+ – X 2Σ+) bands in the ultraviolet.
Figure 7: Composite air radiation spectrum at a pressure
of 26.7 Pa and shock velocity of 10 km/s.
Optical Instrumentation for Shock Tube and Ballistic Range Facilities
RTO-EN-AVT-186 6 - 11
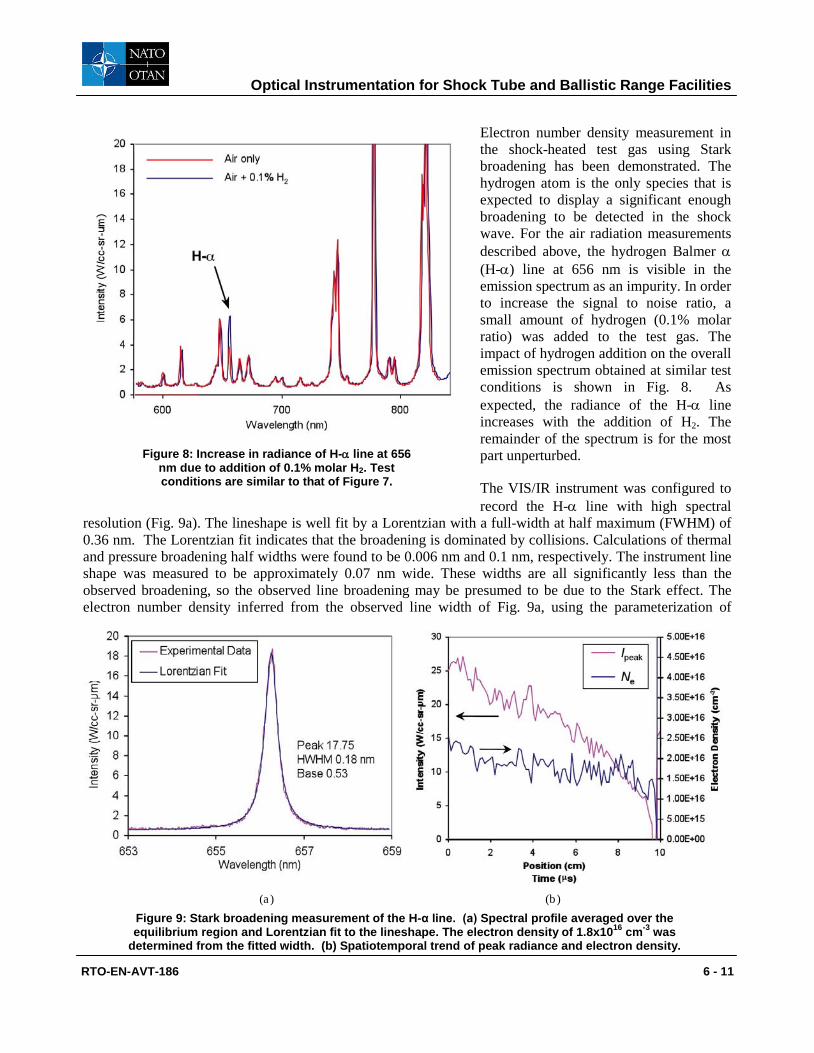
Electron number density measurement in the shock-heated test gas using Stark broadening has been demonstrated. The hydrogen atom is the only species that is expected to display a significant enough broadening to be detected in the shock wave. For the air radiation measurements described above, the hydrogen Balmer α (H-α) line at 656 nm is visible in the emission spectrum as an impurity. In order to increase the signal to noise ratio, a small amount of hydrogen (0.1% molar ratio) was added to the test gas. The impact of hydrogen addition on the overall emission spectrum obtained at similar test conditions is shown in Fig. 8. As expected, the radiance of the H-α line increases with the addition of H2. The remainder of the spectrum is for the most part unperturbed.
The VIS/IR instrument was configured to record the H-α line with high spectral
resolution (Fig. 9a). The lineshape is well fit by a Lorentzian with a full-width at half maximum (FWHM) of 0.36 nm. The Lorentzian fit indicates that the broadening is dominated by collisions. Calculations of thermal and pressure broadening half widths were found to be 0.006 nm and 0.1 nm, respectively. The instrument line shape was measured to be approximately 0.07 nm wide. These widths are all significantly less than the observed broadening, so the observed line broadening may be presumed to be due to the Stark effect. The electron number density inferred from the observed line width of Fig. 9a, using the parameterization of
Figure 8: Increase in radiance of H-α line at 656
nm due to addition of 0.1% molar H2. Test conditions are similar to that of Figure 7.
Figure 9: Stark broadening measurement of the H-α line. (a) Spectral profile averaged over the equilibrium region and Lorentzian fit to the lineshape. The electron density of 1.8x1016 cm-3 was
determined from the fitted width. (b) Spatiotemporal trend of peak radiance and electron density.
(a ) (b )

Optical Instrumentation for Shock Tube and Ballistic Range Facilities
6 - 12 RTO-EN-AVT-186
Gigosos and Cardenoso [21], is 1.8 x 1016 cm-3. This parameterization has been applied to the spatiotemporal spectrum of the spectrograph image to extract electron density as a function of position in the through the shock (Fig. 9b). The exposure time of this high-resolution measurement was 1 µs, so the trace is averaged over a spatial region of 1 cm at 10 km/s. Equilibration of electron density is attained within this time period.
2.4.2 Mars: aerocapture
Aerocapture has been studied extensively as an alternative means for orbital insertion of exploration spacecraft for Mars [22], Titan [23], Venus [24], and Neptune [25] missions. In each case, it was found that significant gains in payload mass are possible by obviating the need for the spacecraft to carry chemical propulsion used for deceleration to secure orbit capture. The mission design challenge shifts to the vehicle aeroshell, which protects the spacecraft during the pass through the atmosphere to realize the required deceleration. Shock radiation has been known to be of significant importance for the design of aeroshells for these atmospheres – specifically due to the presence of carbon-bearing species and N2 that form CN within the shock layer. NASA’s In-Space Propulsion Technology program supported shock radiation testing in EAST to characterize the potential radiative heating environments for Mars, Titan, and Venus. The studies for Titan and Mars were conducted in from 2004 through 2007 – prior to the major EAST upgrade of 2008. The imaging spectroscopy instruments and calibration sources used in these tests differ from those described above. Two, rather than the present four, imaging spectrographs were in use. Detailed descriptions are available in the primary references [1-3].
The condition chosen for the Mars aerocapture test was a nominal shock velocity of 8.5 km/s and a pre-shock pressure of 13.3 Pa (0.1 torr). The test gas was synthesized to a prescribed composition of 96% CO2 and 4% N2 by volume. Facility variability caused an approximate ± 8% deviation from the target shock velocity over the course of the test series. Figure 10 shows a composite spectrum assembled from two shots at the same nominal condition; two shots were necessary to obtain complete coverage with the four low-resolution spectrograph configurations. Each spectral subregion was extracted from its image at the peak nonequilibrium radiance of the shock front. Because of the highly nonlinear dependence of absolute radiance magnitude on shock velocity and the difference of shock velocity between the two shots, the relative radiance values
Figure 10: Composite Mars atmosphere radiation spectrum at a pressure of
13.3 Pa and shock velocity of 8.5 km/s.

Optical Instrumentation for Shock Tube and Ballistic Range Facilities
RTO-EN-AVT-186 6 - 13
between subregions are not directly comparable. The major features evident in the spectrum are the CN violet system (CNV, B 2Σ+ – X 2Σ+), C2 Swan system (d 3Πg – a 3Πu), N2
+ first negative system (1–, B 2Σu+ – X 2Σg
+), CO fourth positive system (4+, A 1Π – X 1Σ+), and several atomic carbon and oxygen lines. The CO 4+ system radiates in the VUV portion of the spectrum and peaks at approximately 160 nm.
3.0 HFFAF THERMAL IMAGING
The challenge in ballistic range experiments is to obtain quantitative data from a model travelling at hypersonic speeds. Optical measurement techniques are the most practical means since surface-mounted sensors would require telemetry to transmit the data. The sensors and telemetry electronics would have to survive large launch acceleration loads (approaching half a million g). All on-board instrumentation would be lost, along with the model, at the terminal wall of the range. Thermal imaging using high-speed infrared and intensified CCD cameras has been successfully employed in the Ames ballistic range to measure global surface temperature distributions on the forward regions of hypersonic blunt bodies. The use of these techniques to measure convective heat transfer rates and to locate the onset and progression of boundary layer transition on blunt bodies in hypersonic flight in the ballistic range has been demonstrated [5-7]. Aerothermodynamic data of this nature, obtained during carefully designed ballistic-range experiments, can provide valuable experimental data for bridging the gap between other hypersonic ground-test facilities and full-scale flight, as well as for validating computational tools.
3.1 Thermal imaging instrumentation The primary requirements for the HFFAF thermal imaging instrumentation are to image the incandescent thermal emission from the model at a nearly head-on view of the surface and in a spectral range appropriate for the temperatures realized by models in flight. Short exposure times are necessary to minimize motion blur. Challenges to implementation include event timing to capture the model in the field of view and reduction of shocked gas radiation at visible and near infrared wavelengths. The latter obscures a clear view of the model surface, biasing surface temperature measurements.
3.1.1 Camera systems
The facility uses two types of cameras for time-gated thermal imaging. Three of each type are dedicated to the facility. The first is an intensified CCD camera similar to the VIS/NIR detectors used with the imaging spectrographs of the EAST facility (see Table 1). Each ICCD camera typically employs a 300 mm f/4 prime-focus photography lens, giving a spatial resolution of approximately 0.2 mm/pixel on an object 2.5 m from the camera. The cameras are thermoelectrically cooled to reduce thermal noise. For a 0.5 µs integration time, the temperature measurement accuracy is ±10 K, and the dynamic range is about 600 degrees. At maximum gain, the minimum detectable temperature is between 850 K and 900 K. The second type is a mid-wave infrared (MWIR) camera that covers the spectral range between 3 µm and 5 µm using an InSb detector array. Each MWIR camera employs a 100 mm f/2.3 fixed-aperture lens, giving a spatial resolution of approximately 0.8 mm/pixel on an object 2.5 m from the camera. The cameras are cooled by Stirling-cycle coolers (or by liquid nitrogen, in one case) to reduce thermal noise. For a 1 µs integration time, the temperature measurement accuracy is ±2 K. Sensitivity is controlled through the addition of neutral density filters in the optical path. The dynamic range is between 300 and 1000 K, and the minimum detectable temperature is typically around 500 K, but can be as low as room temperature, depending on the filter combination.

Optical Instrumentation for Shock Tube and Ballistic Range Facilities
6 - 14 RTO-EN-AVT-186
3.1.2 Optical configuration and camera triggering
The cameras can be independently placed at any optical station. Each camera images the model from an angle between 9̊ and 15˚ off the flight path, and at a distance of 2.4 m. This nearly head-on view angle was obtained by placing a mirror inside the test section opposite one of the shadowgraph station windows, as illustrated in Fig. 11. All cameras use aluminized first-surface mirrors to provide the required view angle. Exposure times of 0.5 to 1 µs were typically
used. At a speed of 4.5 km/s the model would move approximately 4.5 mm in this time, resulting in less than 1 pixel of motion blur in the images. The optical stations for the ICCD and MWIR cameras use BK7 glass and silicon windows, respectively.
The facility has a detection system at each optical station to record the arrival time of the projectile and to trigger the station’s shadowgraph camera. The same system is used to trigger the thermal imaging cameras. There are, however, times when it is necessary to image the projectile when it is between shadowgraph stations. For example, it is necessary to eliminate the shocked gas radiation in order to perform surface temperature measurements at the visible and near infrared wavelengths. As described in Section 3.3, special hardware is placed in the ballistic range test section to generate a local plume of helium to accomplish this, but the hardware cannot be located at the shadowgraph station. In these cases, a proportional delay generator is used to estimate the arrival time of the projectile at the imaging location, based on the time of flight between the two previous shadowgraph stations, as illustrated in Fig. 11.
3.2 Instrument calibration The response of each camera is calibrated against NIST-traceable blackbody standards by imaging the blackbody source on an optical path equivalent to that of the ballistic-range tests. Prior to use in the facility, the cameras were calibrated for high-temperature response with a dual-cavity blackbody source capable of producing temperatures between 1000 K and 3200 K. The cavity and aperture were 1.58 cm in diameter. The temperature was controlled manually and monitored with a transfer-standard pyrometer. The cameras were also calibrated against a different blackbody cavity capable of producing temperatures between ambient and 1473 K. This source had a cavity 2.54 cm in diameter; the aperture was restricted to 2.22 cm in diameter for the calibrations. The source is electronically controlled with a factory-calibrated thermocouple to a reported accuracy of ±3 K.
Figure 11: Event timing and triggering for thermal image acquisition.

Optical Instrumentation for Shock Tube and Ballistic Range Facilities
RTO-EN-AVT-186 6 - 15
Typical calibration data for one of the ICCD cameras is shown in Fig. 12a. This figure shows two sets of calibration data obtained approximately two years apart using two different calibration sources, illustrating the stability of the ICCD cameras. The symbols represent the mean intensity, in digitizer counts, for each blackbody temperature point. Six of the data points using the single-cavity source were used to generate the response function for this camera. Figure 12b shows the measured temperature, calculated using this response function, versus the blackbody set-point temperature for all the data in Fig. 12a. The measured temperatures were within ±6 K of the blackbody temperature. The standard deviation, both frame-to-frame for a single pixel and pixel-to-pixel within a single frame, was between 5 and 6 K for temperatures above 900 K for the ICCD cameras at the gain setting and optical configuration used in these experiments. Camera parameters are adjusted to maximize the signal counts without saturation at the peak expected temperature for a given shot condition. As a result, the minimum detectable temperatures are typically around 950 K with the ICCD cameras.
3.3 Reduction of shocked gas radiation The shock layer ahead of a ballistic range model in flight can radiate intensely in the visible region, primarily from dissociated oxygen and nitrogen. For tests in which thermal imaging of the model surface at visible wavelengths is conducted, the emission has the potential to bias surface temperature measurements or even obscure the surface from view. A technique to remove the visible gas-cap radiation has been developed and implemented at each imaging station for which an ICCD camera is used. A localized volume of helium that displaces the air in the flight path, thus temporarily quenching this gas-cap radiation. The helium is issued from a “chimney” below the flight path of the model. These chimneys are located between optical stations to avoid interfering with the photo-beam trigger system, as shown in Fig. 11. The proportional delay trigger system, described in Section 3.1.2, determines, in real time, the arrival time of the model in the helium plume and triggers the camera accordingly. The model traverses the helium plume in less than 0.5% of the total flight time, thus its effect on the integrated convective heating over the entire trajectory is minimal. There is no
1 0
1 0 0
1 0 0 0
1 0 0 0 0
1 0 0 0 0 0
8 0 0 1 0 0 0 1 2 0 0 1 4 0 0 1 6 0 0T (K
D a ta f r o m s in g le - c a v i t
D a ta f r o m d u a l -c a v i ty te m p e r a tu r e ) s o u r c e
8 0 0
1 0 0 0
1 2 0 0
1 4 0 0
1 6 0 0
8 0 0 1 0 0 0 1 2 0 0 1 4 0 0 1 6 0 0
b l a c k b o d y t e m p e r a
C a lib r a t io n a g a in s t s in gs o u r c e
A d d it io n a l m e a s u r m e n t s in g le - c a v ity s o u r c e
D a ta f r o m d u a l- c a v ity (t e m p e r a tu r e ) s o u r c e
Figure 12: (a) Blackbody calibration data for an ICCD camera; (b) Response calibration applied to additional blackbody data.
(b) (a)

Optical Instrumentation for Shock Tube and Ballistic Range Facilities
6 - 16 RTO-EN-AVT-186
Figure 13: (a) Schematic of helium chimney showing operating principle. (b) Photograph of helium chimney in ballistic range test section.
(a) (b)
appreciable gas-cap radiation in the mid-wave infrared waveband, so no helium plumes are required at the infrared camera stations.
The helium chimney is approximately 20 cm in diameter and 30 cm tall and sits on the floor of the test section. Helium is introduced into the bottom of the chimney and passes through various flow-restricting elements and porous media layers to produce nearly uniform flow at the exit of the chimney (Fig. 13a). A
Figure 14: Copper hemispherical nosetip model at 50.7 kPa and 4.5 km/s. (a) Image of model in air (top) and in helium plume (bottom). (b) Intensity profiles across model surface in (a) compared
with camera dark-image response. Colored lines in (a) denote location of intensity profiles.
(a ) (b )

Optical Instrumentation for Shock Tube and Ballistic Range Facilities
RTO-EN-AVT-186 6 - 17
photograph of the helium chimney in the ballistic range test section is shown in Fig. 13b. The flat mirror that directs the nearly head-on image out of the test section through a window can be seen in the photograph. The helium flow to the chimney is initiated 1-3 seconds prior to the shot.
The effectiveness of the helium plume to remove the gas-cap radiation is illustrated in Fig. 14. Models with a hemispherical, copper nosetip were flown at 4.5 km/s in air at 50.7 kPa pressure. The copper acts as a heat sink, thus preventing the surface from heating appreciably, and has a low emissivity. Together, these characteristics result in a surface that should appear dark (cold) to the ICCD camera, even after flying the full length of the test section. The top image in Fig. 14a shows the copper model in air. The bright region over the nose is due to the gas-cap radiation. An intensity profile across this region is plotted as the upper curve in Fig. 14b. The bottom image in Fig. 14a is of a similar copper-tipped model, also flown at 4.5 km/s in air at 50.7 kPa pressure, but imaged after entering the helium plume. The contrast has been enhanced in this image to make the model surface visible. As a result, the luminous wake, barely visible in the top image, appears white in this image. The intensity profile across the copper nose in the helium plume is also plotted in Fig. 14b, and is equivalent in magnitude to a dark-response image taken with no illumination on the ICCD sensor. The results of Fig. 14 confirm that the helium plume displaces a sufficient amount of ambient air to diminish the visible gas-cap radiation and enable surface imaging at visible wavelengths.
3.4 Example results Surface temperatures revealed by the thermal imaging technique enable quantitative measurements of heat transfer rates and transition to turbulence at quiescent conditions matching hypersonic flight. Over the last several years, NASA’s Fundamental Aeronautics Program/Hypersonics Project has supported ballistic range experiments that have both matured the thermal imaging technique and yielded data for advancing our understanding of these aerothermal phenomena. The measurements of heat transfer rates enable comparison with and validation of real-gas Navier-Stokes computational tools. Modelling of roughness-dominated transition is an important design issue for many reusable and ablating thermal protection systems (TPS). Highlights of recent testing for heat transfer rates and transition due to roughness are described in the following sections.
3.4.1 Heat transfer rates
Quantitative convective heat transfer rates over a ballistic range model in flight have been determined using thermal imaging and unsteady heat conduction analyses [10]. Heat conduction into the projectile’s surface was modelled by the one-dimensional heat conduction equation using principles detailed in reference [26]. The analysis allowed for temperature-dependent material properties and unsteady heat transfer rates at the surface. Thermal imaging measurements were made in air and in nitrogen on titanium alloy hemispheres at velocities up to 4.5
Figure 15: Titanium alloy hemisphere in flight in air at a pressure of 25.3 kPa and a velocity of 4.0 km/s. (a) ICCD camera image.
(b) global surface temperature distribution.
(b ) (a )
Optical Instrumentation for Shock Tube and Ballistic Range Facilities
6 - 18 RTO-EN-AVT-186
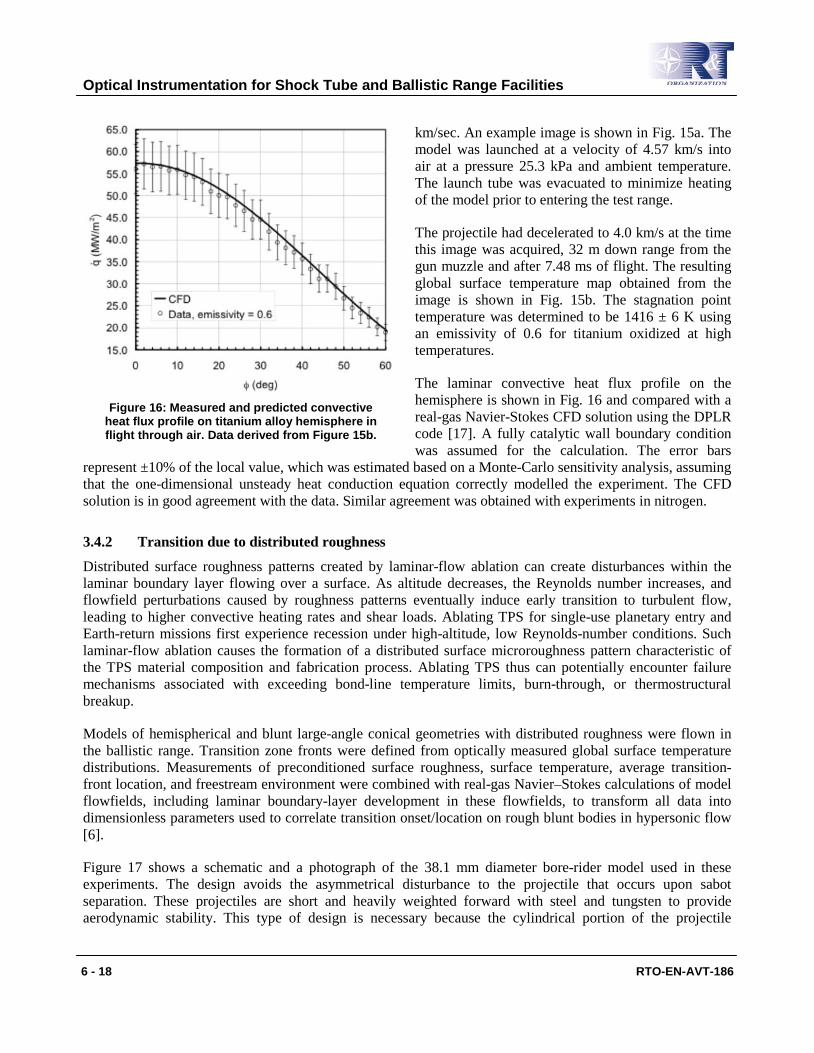
km/sec. An example image is shown in Fig. 15a. The model was launched at a velocity of 4.57 km/s into air at a pressure 25.3 kPa and ambient temperature. The launch tube was evacuated to minimize heating of the model prior to entering the test range.
The projectile had decelerated to 4.0 km/s at the time this image was acquired, 32 m down range from the gun muzzle and after 7.48 ms of flight. The resulting global surface temperature map obtained from the image is shown in Fig. 15b. The stagnation point temperature was determined to be 1416 ± 6 K using an emissivity of 0.6 for titanium oxidized at high temperatures.
The laminar convective heat flux profile on the hemisphere is shown in Fig. 16 and compared with a real-gas Navier-Stokes CFD solution using the DPLR code [17]. A fully catalytic wall boundary condition was assumed for the calculation. The error bars
represent ±10% of the local value, which was estimated based on a Monte-Carlo sensitivity analysis, assuming that the one-dimensional unsteady heat conduction equation correctly modelled the experiment. The CFD solution is in good agreement with the data. Similar agreement was obtained with experiments in nitrogen.
3.4.2 Transition due to distributed roughness
Distributed surface roughness patterns created by laminar-flow ablation can create disturbances within the laminar boundary layer flowing over a surface. As altitude decreases, the Reynolds number increases, and flowfield perturbations caused by roughness patterns eventually induce early transition to turbulent flow, leading to higher convective heating rates and shear loads. Ablating TPS for single-use planetary entry and Earth-return missions first experience recession under high-altitude, low Reynolds-number conditions. Such laminar-flow ablation causes the formation of a distributed surface microroughness pattern characteristic of the TPS material composition and fabrication process. Ablating TPS thus can potentially encounter failure mechanisms associated with exceeding bond-line temperature limits, burn-through, or thermostructural breakup.
Models of hemispherical and blunt large-angle conical geometries with distributed roughness were flown in the ballistic range. Transition zone fronts were defined from optically measured global surface temperature distributions. Measurements of preconditioned surface roughness, surface temperature, average transition-front location, and freestream environment were combined with real-gas Navier–Stokes calculations of model flowfields, including laminar boundary-layer development in these flowfields, to transform all data into dimensionless parameters used to correlate transition onset/location on rough blunt bodies in hypersonic flow [6].
Figure 17 shows a schematic and a photograph of the 38.1 mm diameter bore-rider model used in these experiments. The design avoids the asymmetrical disturbance to the projectile that occurs upon sabot separation. These projectiles are short and heavily weighted forward with steel and tungsten to provide aerodynamic stability. This type of design is necessary because the cylindrical portion of the projectile
Figure 16: Measured and predicted convective
heat flux profile on titanium alloy hemisphere in flight through air. Data derived from Figure 15b.

Optical Instrumentation for Shock Tube and Ballistic Range Facilities
RTO-EN-AVT-186 6 - 19
provides very little aerodynamic restoring moment. The graphite noses for the models were pre-ablated in one of the Ames arc jet facilities [27] under laminar flow conditions for various lengths of time, producing varying degrees of surface recession. The surface roughness of the graphite noses following exposure was characterized by sectioning one model sample and examining its roughness distribution under a microscope.
Figure 18a shows the end-on-view surface intensity distribution of a pre-
ablated graphite hemisphere recorded by one of the ICCD cameras. The test gas was air at a pressure of 32.1 kPa. The velocity at the measurement station was 4.5 km/s. The image was acquired with the model traversing the helium plume to eliminate gas-cap radiation. Figure 18b shows the resultant measured global surface temperature distribution. Transition to turbulence along any ray emanating from the stagnation point is defined by an abrupt positive change in slope of the temperature-vs-location curve. Analyses of these data enable development of critical roughness Reynolds number correlations for transition [6].
3.4.3 Transition due to isolated roughness
Isolated roughness elements on entry vehicles represent localized disturbance sources within the laminar boundary layer. They may result, for example, from protrusions due to misaligned surface components, gap fillers between segmented TPS materials, or at the interface between dissimilar materials experiencing differential recession. Transition to turbulence behind any such discrete element occurs in a narrow, flow-aligned zone, its lateral extent usually spreading at shallow angles as the turbulent zone convects downstream. The consequences of transition induced by isolated roughness will influence the design of both ablating and non-ablating TPS. As with distributed roughness, physics-based models characterizing the correlation between isolated roughness and transition will improve the validity of simulation tools used for the design and analysis
of entry vehicles.
Smooth titanium hemispheres with isolated three-dimensional surface roughness elements were flown in the ballistic range through quiescent CO2 and air environments [7]. Global surface intensity (temperature) distributions were optically measured and thermal wakes behind individual roughness elements were analyzed to define how effective the
Figure 17: Engineering drawing and photograph of pre-
ablated graphite hemispherical nosetip model.
Figure 18: Pre-ablated graphite hemispherical model in flight in air at a pressure of 32.1 kPa and a velocity of 4.5 km/s. (a) ICCD camera image. (b) global surface temperature distribution.
(a ) (b )

Optical Instrumentation for Shock Tube and Ballistic Range Facilities
6 - 20 RTO-EN-AVT-186
roughness elements were in triggering transition to turbulence.
Figure 19 shows a photograph of a hemispherical model and its launch sabot used in the isolated roughness experiments. The hemispheres were made from commercially available titanium alloy (Ti-6Al-4V) ball bearings with a diameter of 2.86 cm. The ball bearings were cut in half using an electrical discharge machining (EDM) wire. The arithmetical average surface roughness was 0.2 μm, giving an aerodynamically smooth surface finish. Isolated, disk-like surface roughness elements were created by drilling holes perpendicular to the model surface and press-fitting cylindrical silicon carbide (SiC) pins into each hole. The exposed heights of the pins define the roughness elements. Four such pins were located on each model, all at the same arc length from the
stagnation point, and separated by 90˚ circumferentially. For the model in Fig. 19, the pins are positioned 10˚ from the stagnation point.
An example ICCD image of a model in flight through CO2 at 20.3 kPa is shown in Fig. 20a. The model velocity was 4.0 km/s, and the exposure time of the image was 0.5 µs. The image was captured with the model transiting the helium plume. The luminous wake of the model can be seen in this image. The global surface temperature images (Fig. 20b) were converted to 3D surface temperature maps, as shown in Fig. 20c. The rise in temperature at the individual roughness elements and its persistence along the downstream streamlines indicates the influence of the element in effecting transition to turbulence. Analyses of these persistence patterns and parametric variations in flight conditions and roughness element geometries enable development of correlations of transition due to isolated roughness [7].
Figure 19: Titanium hemispherical model with
isolated roughness elements.
Figure 20: Hemispherical model with isolated roughness in flight through CO2 at a pressure of 20.3 kPa and velocity 4.0 km/s. (a)
ICCD image, (b) global surface temperature distribution with coordinate grid mapping, (c) temperature image after resection to
3D coordinate grid.
(a ) (b )
(c )

Optical Instrumentation for Shock Tube and Ballistic Range Facilities
RTO-EN-AVT-186 6 - 21
4.0 CONCLUSION
The Ames EAST and HFFAF have supported many NASA basic research and technology development initiatives in hypersonic aerothermodynamics since the late 1960s. Research topics that motivated the construction of these facilities are still relevant today – convective and radiative heating, radiative transport, and roughness-induced transition to turbulence. In the EAST facility, multiplexed, time-gated imaging spectroscopy has enabled absolute measurements of shock radiance at superorbital entry velocities for Earth and planetary atmospheres. The multi-point imaging capability simultaneously captures nonequilibrium post-shock excitation and relaxation dynamics of dispersed spectral features from the VUV through the NIR. For the HFFAF, thermal imaging of ballistic range models in flight has enabled measurements of global surface temperature for quantitative and qualitative assessment of aerothermodynamic phenomena affecting heating rates.
Advances in optical instrumentation technologies and computer-aided design tools since the facilities became operational have enabled measurements with greater spatial, spectral, temporal, and radiometric resolution. A major modernization and upgrade of the EAST facility was completed in 2008. The most significant improvements in instrumentation were in the imaging spectrographs and their calibration. Following the upgrade, four integrated imaging spectroscopy instruments permit simultaneous measurements from the near infrared to the vacuum ultraviolet. Each of the four channels has optimized collection optics, detectors, and spectrograph grating configurations. New calibration sources and procedures have improved facility throughput and reduced uncertainties in absolute spectral radiance measurements. At present, the EAST facility provides most reliable and comprehensive shock radiance data available.
Thermal imaging techniques in the HFFAF have also matured since they were first introduced in the 1970s. Intensified CCD and MWIR cameras are now routinely used to image the incandescent surface emission of ballistic range models in flight. The short exposure times (0.5-1.0 µs) effectively freeze the motion of the hypersonic projectile. Gas cap radiation in air that biases thermal images at visible wavelengths is suppressed with a plume of helium in the flight path – the image is acquired as the model transits the localized volume of helium that displaces air. The thermal images are calibrated to yield global surface temperature maps. Up to six thermal imaging cameras are available for use in any single experiment.
The imaging spectroscopy technique of the EAST facility is currently being adapted to the HFFAF as a means to capture bow shock and wake radiation of a ballistic range model in flight. Spectroradiometry in ballistic range facilities is not new – efforts in the 1960s at Ames demonstrated that spectrally resolved gas cap radiation could be measured. The use of an imaging spectrograph, however, will enable multi-point, spatially resolved spectra to be acquired from the gas cap and through the wake region simultaneously. Recent demonstration measurements proved the viability of the approach, and future work is planned to refine the implementation.
ACKNOWLEDGMENTS
This research was funded by NASA’s Orion Aerosciences Project, In-Space Propulsion Technology Program, and the Fundamental Aeronautics Program/Hypersonics Project. Support for B.A. Cruden and D.W. Bogdanoff was provided under NASA contract NNA04BC25C to the ELORET Corporation.

Optical Instrumentation for Shock Tube and Ballistic Range Facilities
6 - 22 RTO-EN-AVT-186
REFERENCES
[1] Bose, D., Wright, M., Bogdanoff, D., Raiche, G.A., and Allen, G.A., “Modeling and Experimental Assessment of CN Radiation Behind a Strong Shock Wave”, Journal of Thermophysics and Heat Transfer, Vol. 20, No. 2, pp. 220-230, 2006.
[2] Grinstead, J.H., Wilder, M.C., Olejniczak, J., Bogdanoff, D.W., Allen, G.A., Dang, K., and Forrest, M.J. "Shock-heated Air Radiation Measurements at Lunar Return Conditions," AIAA Paper No. 2008-1244, Jan. 2008.
[3] Grinstead, J.H., Wright, M.J., Bogdanoff, D.W., and Allen, G.A., “Shock Radiation Measurements for Mars Aerocapture Radiative Heating Analysis,” Journal of Thermophysics and Heat Transfer, Vol. 23, No. 2, pp. 249-255, 2009.
[4] Cruden, B.A, Martinez, R., Grinstead, J.H., and Olejniczak, J., “Simultaneous Vacuum Ultraviolet through Near IR Absolute Radiation Measurement with Spatiotemporal Resolution in an Electric Arc Shock Tube,” AIAA Paper No. 2009-4240, June 2009.
[5] Reda, D.C., Wilder, M.C., Bogdanoff, D.W., and Olejniczak, J., “Aerothermodynamic Testing of Ablative Reentry Vehicle Nosetip Materials in Hypersonic Ballistic-Range Environments,” AIAA Paper No. 2004-6829, Nov. 2004.
[6] Reda, D.C., Wilder, M.C., Bogdanoff, D.W., and Prabhu, D.K., “Transition Experiments on Blunt Bodies with Distributed Roughness in Hypersonic Free Flight, Journal of Spacecraft and Rockets, Vol. 45, No. 2, pp. 210-215, 2008.
[7] Reda, D.C, Wilder, M.C., and Prabhu, D.K., “Transition Experiments on Blunt Bodies with Isolated Roughness Elements in Hypersonic Free Flight,” AIAA Paper No. 2010-1367, Jan. 2010.
[8] Craig, R.A., and Davy, W.C., “Absolute Radiometers for Use in Ballistic-Range and Shock-Tube Experiments,” TN D-5360, NASA, Oct. 1969.
[9] Whiting, E.E., “A New Four-Channel Scanning Spectrometer for Ballistic-Range Radiometry,” TM X-57935, NASA, 1964.
[10] Wilder, M.C., Reda, D.C., Bogdanoff, D.W., and Prabhu, D.K., “Free-Flight Measurements of Convective Heat Transfer in Hypersonic Ballistic-Range Environments,” AIAA Paper No. 2007-4404, Jun. 2007.
[11] Reda, D.C., “Correlation of Nosetip Boundary-Layer Transition Data Measured in Ballistics-Range Experiments,” AIAA Journal, Vol. 18, No. 3, 1981.
[12] Reda, D.C. and Leverance, R.A., "Boundary-Layer Transition Experiments on Pre-Ablated Graphite Nosetips in a Hyperballistics Range," Naval Surface Weapons Center, White Oak Laboratory Technical Report NSWC/WOL/TR 76-71, Jun. 1976.

Optical Instrumentation for Shock Tube and Ballistic Range Facilities
RTO-EN-AVT-186 6 - 23
[13] Reda, D.C., Leverance, R.A., and Longas, S.A., "Aerothermodynamic Testing and Analyses of Reentry Vehicle Nosetips in Hypersonic Ballistics-Range Flight," 22nd International Instrumentation Symposium, Instrument Society of America, San Diego, Calif., May 1976.
[14] Whiting, E.E., Park, C., Liu, Y., Arnold, J.O., and Paterson, J.A., “NEQAIR96, Nonequilibrium and Equilibrium Radiative Transport and Spectra Program: User’s Manual,” NASA Reference Publication 1389, Dec. 1996.
[15] Laux, C.O., “Radiation and Nonequilibrium Collisional-Radiative Models,” von Karman Institute Lecture Series 2002-07, Physico-Chemical Modeling of High Enthalpy and Plasma Flows, eds. Fletcher, D., Charbonnier, J.-M., Sarma, G.S.R. and Magin, T., Rhode-Saint-Genèse, Belgium, 2002.
[16] Johnston, C.O., “A Comparison of EAST Shock-Tube Radiation Measurements with a New Air Radiation Model,” AIAA Paper No. 2008-1245, Jan. 2008.
[17] Wright, M.J., Candler, G.V., and Bose, D., “Data-Parallel Line Relaxation Method for the Navier-Stokes Equations,” AIAA Journal, Vol. 36, No. 9, pp. 1603-1609, 1998.
[18] Sohn, I., Levin, D.A., and Modest, M.F., “Closely Coupled DSMC Hypersonic Reentry Flow Simulations with Photon Monte Carlo Radiation,” AIAA Paper No. 2010-819, Jan. 2010.
[19] Schwartzentruber, T.E., Scalabrin, L.C., and Boyd, I.D., “Modular Implementation of a Hybrid DSC-NS Algorithm for Hypersonic Non-Equilibrium Flows,” AIAA Paper No. 2007-613, Jan. 2007.
[20] Greenberg, R.B., Cruden, B.A, Grinstead, J.H., Yeung, D., “Collection Optics for Imaging Spectroscopy of an Electric Arc Shock Tube,” Proccedings of the SPIE, Novel Optical Systems Design and Optimization XII, Vol. 7429, Koshel, R.J., and Gregory, G.G., eds., Aug. 2009
[21] Gigosos, M.A., and Cardeñoso, V. "New Plasma Diagnosis Tables of Hydrogen Stark Broadening Including Ion Dynamics," Journal of Physics B-Atomic Molecular and Optical Physics, Vol. 29, No. 20, pp. 4795-4838, 1996.
[22] Vaughn, D., Miller, H.C., Griffin, B., James, B.F., and Munk, M.M., “A Comparative Study of Aerocapture Missions with a Mars Destination,” AIAA Paper No., 2005-4110, Jul. 2005.
[23] Lockwood, M.K., “Titan Aerocapture Systems Analysis,” AIAA Paper No. 2003-4799, Jul. 2003.
[24] Craig, S., and Lyne, J.E., “Parametric Study of Aerocapture for Missions to Venus,” Journal of Spacecraft and Rockets, Vol. 42, No. 6, pp. 1035-1038, 2005.
[25] Lockwood, M.K., “Neptune Aerocapture Systems Analysis,” AIAA Paper No. 2004-4951, Aug. 2004.
[26] Schultz, D.L., and Jones, T.V., “Heat-transfer Measurements in Short-duration Hypersonic Facilities,” AGARDograph No. 165, AGARD, 1973.
[27] Grinstead, J.H., Stewart, D.A, and Smith, C.A, “High Enthalpy Test Methodologies for Thermal Protection Systems Development at NASA Ames Research Center”, AIAA Paper No. 2005-3326, May 2005.
Optical Instrumentation for Shock Tube and Ballistic Range Facilities
6 - 24 RTO-EN-AVT-186