optical effects of adsorption of dyes on pigment used in electrophoretic image displays
TRANSCRIPT
Optical effects of adsorption of dyes on pigment used inelectrophoretic image displays
B. Fitzhenry
The optical properties of an electrophoretic image display (EPID) are affected by the surface interaction be-tween pigment particles and dye used in the display. The amount of a particular dye adsorbed on the pig-ment surface has been determined quantitatively. The optical properties of suspensions have been im-proved through the use of sterically hindered dyes which reduce the extent of the surface interaction. Acomputer model of the optics of the system has shown that differences in the visible spectra of the dyes con-tribute negligibly to the improved optical properties.
Introduction
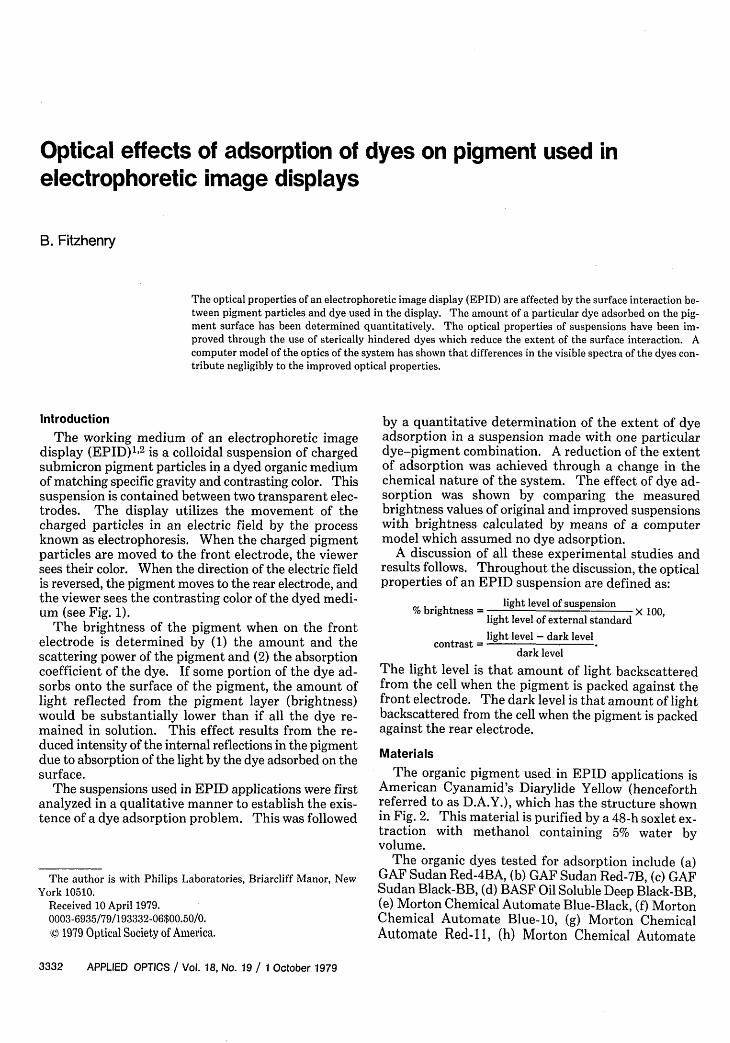
The working medium of an electrophoretic imagedisplay (EPID)1"2 is a colloidal suspension of chargedsubmicron pigment particles in a dyed organic mediumof matching specific gravity and contrasting color. Thissuspension is contained between two transparent elec-trodes. The display utilizes the movement of thecharged particles in an electric field by the processknown as electrophoresis. When the charged pigmentparticles are moved to the front electrode, the viewersees their color. When the direction of the electric fieldis reversed, the pigment moves to the rear electrode, andthe viewer sees the contrasting color of the dyed medi-um (see Fig. 1).
The brightness of the pigment when on the frontelectrode is determined by (1) the amount and thescattering power of the pigment and (2) the absorptioncoefficient of the dye. If some portion of the dye ad-sorbs onto the surface of the pigment, the amount oflight reflected from the pigment layer (brightness)would be substantially lower than if all the dye re-mained in solution. This effect results from the re-duced intensity of the internal reflections in the pigmentdue to absorption of the light by the dye adsorbed on thesurface.
The suspensions used in EPID applications were firstanalyzed in a qualitative manner to establish the exis-tence of a dye adsorption problem. This was followed
The author is with Philips Laboratories, Briarcliff Manor, NewYork 10510.
Received 10 April 1979.0003-6935/79/193332-06$00.50/0.0 1979 Optical Society of Amnerica.
by a quantitative determination of the extent of dyeadsorption in a suspension made with one particulardye-pigment combination. A reduction of the extentof adsorption was achieved through a change in thechemical nature of the system. The effect of dye ad-sorption was shown by comparing the measuredbrightness values of original and improved suspensionswith brightness calculated by means of a computermodel which assumed no dye adsorption.
A discussion of all these experimental studies andresults follows. Throughout the discussion, the opticalproperties of an EPID suspension are defined as:
% brightness
contrast
light level of suspension X 10,
light level of external standardlight level - dark level
dark level
The light level is that amount of light backscatteredfrom the cell when the pigment is packed against thefront electrode. The dark level is that amount of lightbackscattered from the cell when the pigment is packedagainst the rear electrode.
Materials
The organic pigment used in EPID applications isAmerican Cyanamid's Diarylide Yellow (henceforthreferred to as D.A.Y.), which has the structure shownin Fig. 2. This material is purified by a 48-h soxlet ex-traction with methanol containing 5% water byvolume.
The organic dyes tested for adsorption include (a)GAF Sudan Red-4BA, (b) GAF Sudan Red-7B, (c) GAFSudan Black-BB, (d) BASF Oil Soluble Deep Black-BB,(e) Morton Chemical Automate Blue-Black, (f) MortonChemical Automate Blue-10, (g) Morton ChemicalAutomate Red-li, (h) Morton Chemical Automate
3332 APPLIED OPTICS / Vol. 18, No. 19 / 1 October 1979
=
-- TRANSPARENT ELECTRODE
0-+ELECTRODE SEGMEh
-SUBSAT
IB S
I1 ..COLOR OF)
DYE j
LOLDOYE ° l --- C CHARGED PIGMENTPARTICLES -)
OBSERVER
-DYED SUSPENDINGMEDIUM
COLOR OFPIGMENT
-. .OELECTRODE SEGMEI
_-SPACER / SEAL
- ___.~ GLASS PLATE
Fig. 1. Cross section of electrophoretic image display cell.
C H5 ClI Cl0--
NH- C-CN- N N / N N-CH -C:O C :0CH3 C 3
H 5 C2 H N
N =N I N=ND
Fig. 3. GAF Sudan Red-7B, color index 26050.
Red-lOB, and (i) Morton Chemical Automate Red-13.All these dyes have a diazo-type structure. As an ex-ample, the structure of GAF's Sudan Red-7B is givenin Fig. 3. The reader is referred to the Colour Index 3
for the other structures that are in the public domain.All dyes were used as received from the manufacturerwithout further purification.
Analysis of Dye Adsorption Problem
Qualitative Analysis
Adsorption of dye on the surface of the pigment wastested qualitatively by centrifuging the pigment out ofa suspension after slightly mismatching the specificgravities of solvent and pigment. This procedure as-sumes that the pigment carries with it all the dye ad-
sorbed on its surface. The centrifuged pigment isIT darker than expected and remains dyed even after re-
peated washings with clean solvent. These resultsclearly indicate that dye adsorption occurs.
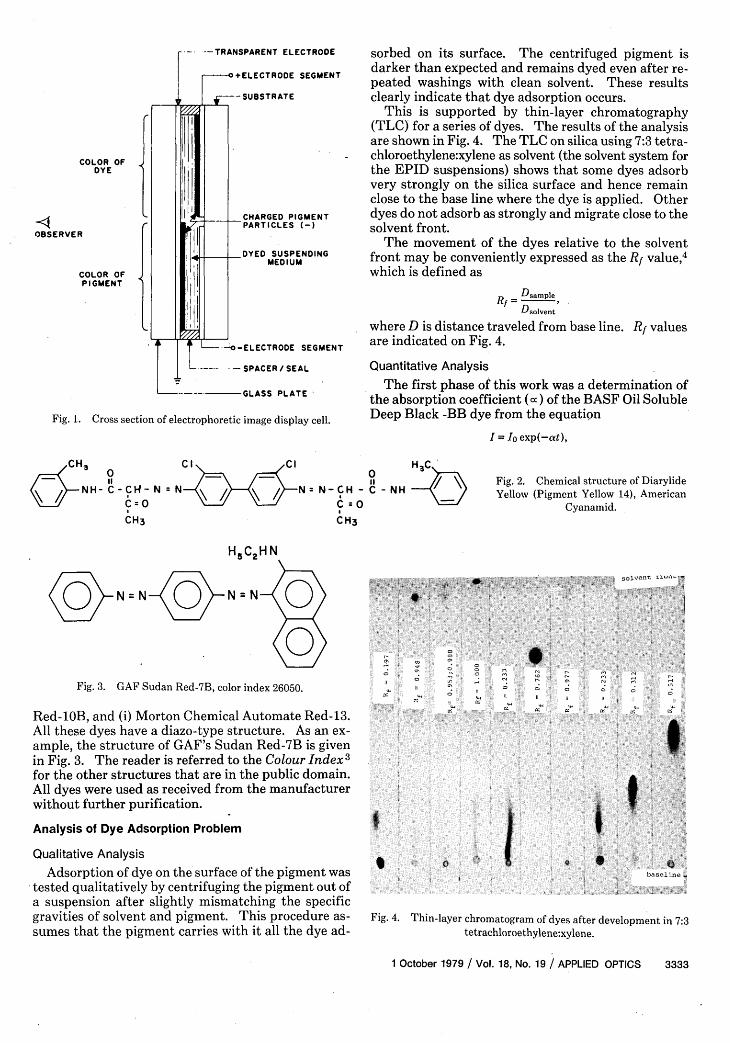
This is supported by thin-layer chromatography(TLC) for a series of dyes. The results of the analysisare shown in Fig. 4. The TLC on silica using 7:3 tetra-chloroethylene:xylene as solvent (the solvent system forthe EPID suspensions) shows that some dyes adsorbvery strongly on the silica surface and hence remainclose to the base line where the dye is applied. Otherdyes do not adsorb as strongly and migrate close to thesolvent front.
The movement of the dyes relative to the solventfront may be conveniently expressed as the Rf value,4
which is defined as
R = Dsample
Dsolvent
where D is distance traveled from base line. Rf valuesNT are indicated on Fig. 4.
Quantitative Analysis
The first phase of this work was a determination ofthe absorption coefficient (x) of the BASF Oil SolubleDeep Black -BB dye from the equation
I = Io exp(-at),
; C - H 1Cs- NH
Fig. 2. Chemical structure of DiarylideYellow (Pigment Yellow 14), American
Cyanamid.
Fig. 4. Thin-layer chromatogram of dyes after development in 7:3tetrachloroethylene:xylene.
1 October 1979 / Vol. 18, No. 19 / APPLIED OPTICS 3333
-------the
EPID
suspensions) shows that some dyes adsorb
very
strongly
on the silica surface and hence remain
close
to
the base line where the dye is applied. Other
dyes
do
not adsorb as strongly and migrate close to the
solvent front.The
movement
of the dyes relative to the solvent
front
may be conveniently expressed as the Rf value,4
E
10
In
zw
o 0
l .1 0
0
z
0
In
lo 0
CONCENTRATION (mg/ml) BASFOIL SOLUBLE DEEP LACK -BB
Fig. 5. Absorption coefficient of BASF dye as acentration at 570.0 nm.
function of cc
where I = intensity of the radiation emerging fromthe sample,
Io = intensity of incident radiation,cc = absorption coefficient, andt = path length through the sample.
The absorption coefficient was determined at 570 nthe peak reflectance point for D.A.Y. pigment (see Fi10), using a Beckman DK-2 visible spectrophotometThe results for a wide range of dye concentrations aplotted in Fig. 5.
Suspensions used in the second phase of the quanitative analysis contained 2% pigment and 1% of t]material used to generate a charge on the pigment suface (charging agent) in 7:3 tetrachloroethylene:xylenThe dye concentrations in these suspensions were varifover a range from 0.02 mg/ml to 10 mg/ml BASF CSoluble Deep Black-BB.
Suspensions were prepared for analysis by first ceitrifugally removing the pigment. The resulting sipernatant liquids were subjected to an electric fieldfurther remove any suspended particles. The resultiisolutions were clear after these procedures.
A suspension containing no dye was also put throujthe above procedure. This solution served as a contrto correct for any residual pigment not removed by tiprocesses of centrifugation and electrophoretic filtraticdescribed above.
The opacities of the supernatant solutions with tIoriginal dye concentrations of 0.0, 0.02, 0.2, 2.0, and 10mg/ml BASF dye were measured using a krypton asi(X = 570 nm). The absorption coefficients of the.solutions and of corresponding dye solutions which henever interacted with pigment were measured in tlsame fashion at 570 nm.
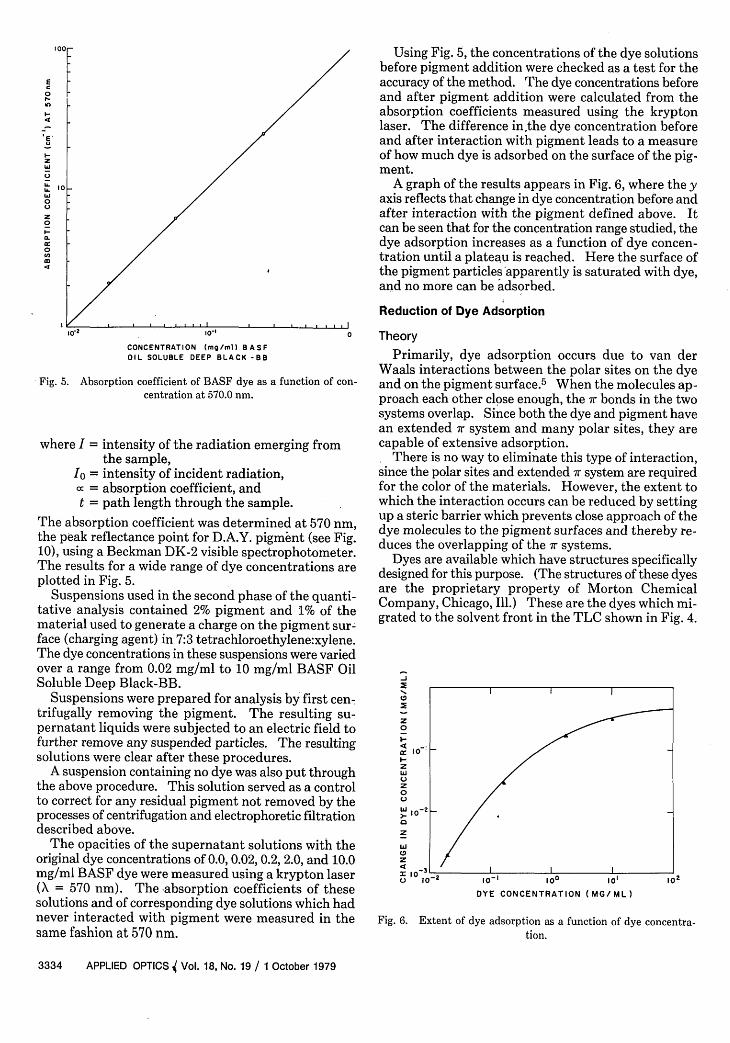
Using Fig. 5, the concentrations of the dye solutionsbefore pigment addition were checked as a test for theaccuracy of the method. The dye concentrations beforeand after pigment addition were calculated from theabsorption coefficients measured using the kryptonlaser. The difference in the dye concentration beforeand after interaction with pigment leads to a measureof how much dye is adsorbed on the surface of the pig-ment.
A graph of the results appears in Fig. 6, where the yaxis reflects that change in dye concentration before andafter interaction with the pigment defined above. Itcan be seen that for the concentration range studied, thedye adsorption increases as a function of dye concen-tration until a plateau is reached. Here the surface ofthe pigment particles apparently is saturated with dye,and no more can be adsorbed.
Reduction of Dye AdsorptionJO Theory
Primarily, dye adsorption occurs due to van derWaals interactions between the polar sites on the dye
on- and on the pigment surface.5 When the molecules ap-proach each other close enough, the 7r bonds in the twosystems overlap. Since both the dye and pigment havean extended 7r system and many polar sites, they arecapable of extensive adsorption.
There is no way to eliminate this type of interaction,since the polar sites and extended 7r system are requiredfor the color of the materials. However, the extent towhich the interaction occurs can be reduced by settingup a steric barrier which prevents close approach of the
,gm dye molecules to the pigment surfaces and thereby re-,r. duces the overlapping of the wr systems.
Dyes are available which have structures specificallyre designed for this purpose. (The structures of these dyes* are the proprietary property of Morton Chemical
Company, Chicago, Ill.) These are the dyes which mi-he grated to the solvent front in the TLC shown in Fig. 4.A -
ne.d
)il
n-
tonig
grholhe
on
he
.0erseadhe
-
z
I-0_
.4 -`a: 10
zIL)z0
0W -O0
z
I)J
z4 -10
U 10 lo,
DYE CONCENTRATION (MG/ ML)
Fig. 6. Extent of dye adsorption as a function of dye concentra-tion.
3334 APPLIED OPTICS l Vol. 18, No. 19 / 1 October 1979
* NON-ADSORBING DYEx ADSORBING DYES
3.0lo
252-_2.5 4
0 I
I I
In
toW 2.0~I-_z0 1C l
1.5
1.0_
O35 -\ \
J \~~~~~X \1 30
0~~~~~~~-x x
025
0~~~~~~~~~
20 0
15 ° 0
l0 - z ADSORBING DYES \* NON- ADSORBING DYE
2 4 6 a to 12 14 16 is
BRIGHTNESS ( BaSO4)
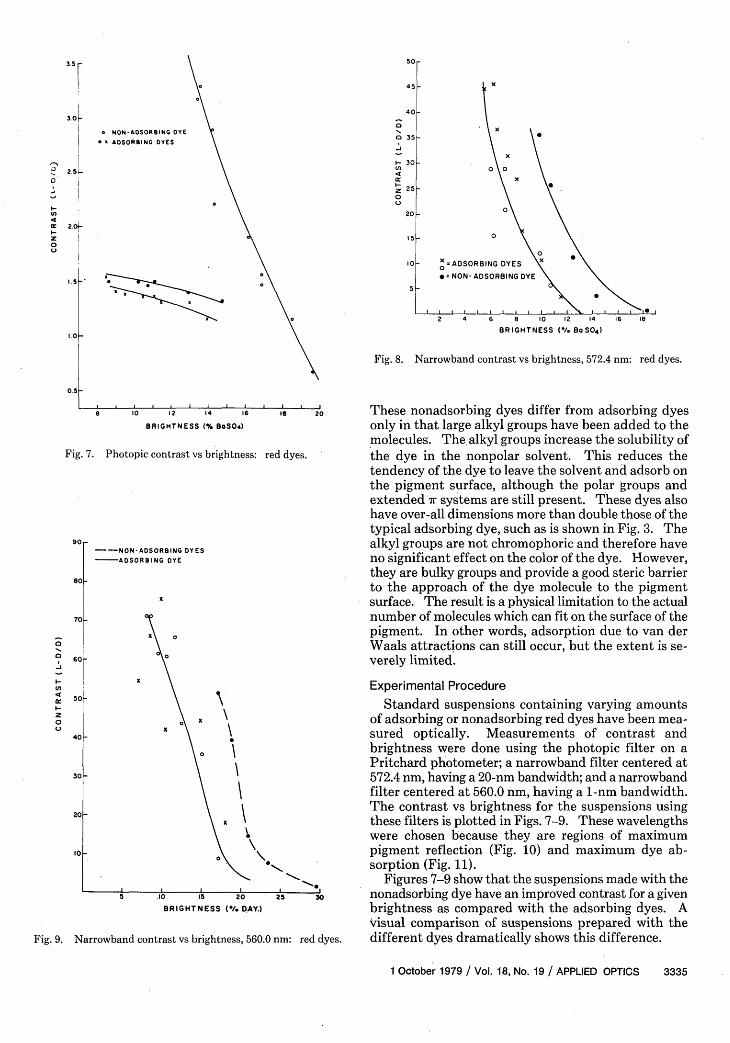
Fig. 8. Narrowband contrast vs brightness, 572.4 nm: red dyes.
8 10 12 14 16
BRIGHTNESS ( BSO4)
Fig. 7. Photopic contrast vs brightness:
90
Bo
70
0
I-
4t
I-z0C-
60
50
40
30
20
t0
-- NON ADSORBING DYES
-ADSORBING DYE
x
5 .10 15 20
BRIGHTNESS (/. D.AY,:
Fig. 9. Narrowband contrast vs brightness, 56(
I.18 1 20 These nonadsorbing dyes differ from adsorbing dyesonly in that large alkyl groups have been added to themolecules. The alkyl groups increase the solubility of
red dyes. the dye in the nonpolar solvent. This reduces thetendency of the dye to leave the solvent and adsorb onthe pigment surface, although the polar groups andextended r systems are still present. These dyes alsohave over-all dimensions more than double those of thetypical adsorbing dye, such as is shown in Fig. 3. Thealkyl groups are not chromophoric and therefore haveno significant effect on the color of the dye. However,they are bulky groups and provide a good steric barrierto- the approach of the dye molecule to the pigmentsurface. The result is a physical limitation to the actualnumber of molecules which can fit on the surface of thepigment. In other words, adsorption due to van derWaals attractions can still occur, but the extent is se-verely limited.
Experimental Procedure
Standard suspensions containing varying amountsof adsorbing or nonadsorbing red dyes have been mea-sured optically. Measurements of contrast andbrightness were done using the photopic filter on aPritchard photometer; a narrowband filter centered at572.4 nm, having a 20-nm bandwidth; and a narrowbandfilter centered at 560.0 nm, having a 1-nm bandwidth.The contrast vs brightness for the suspensions usingthese filters is plotted in Figs. 7-9. These wavelengthswere chosen because they are regions of maximumpigment reflection (Fig. 10) and maximum dye ab-sorption (Fig. 11).
. Figures 7-9 show that the suspensions made with the2'5 Nl0 nonadsorbing dye have an improved contrast for a given
brightness as compared with the adsorbing dyes. Avisual comparison of suspensions prepared with the
W nm: red dyes. different dyes dramatically shows this difference.
1 October 1979 / Vol. 18, No. 19 / APPLIED OPTICS 3335
35 As
To
x
0
I
X �I
1-11 __ I
REFLECTANCE SPECTRA
BsSO.
I I I I
DA.AY.
400 450 500 550 600 650 700
WAVELENGTH I)
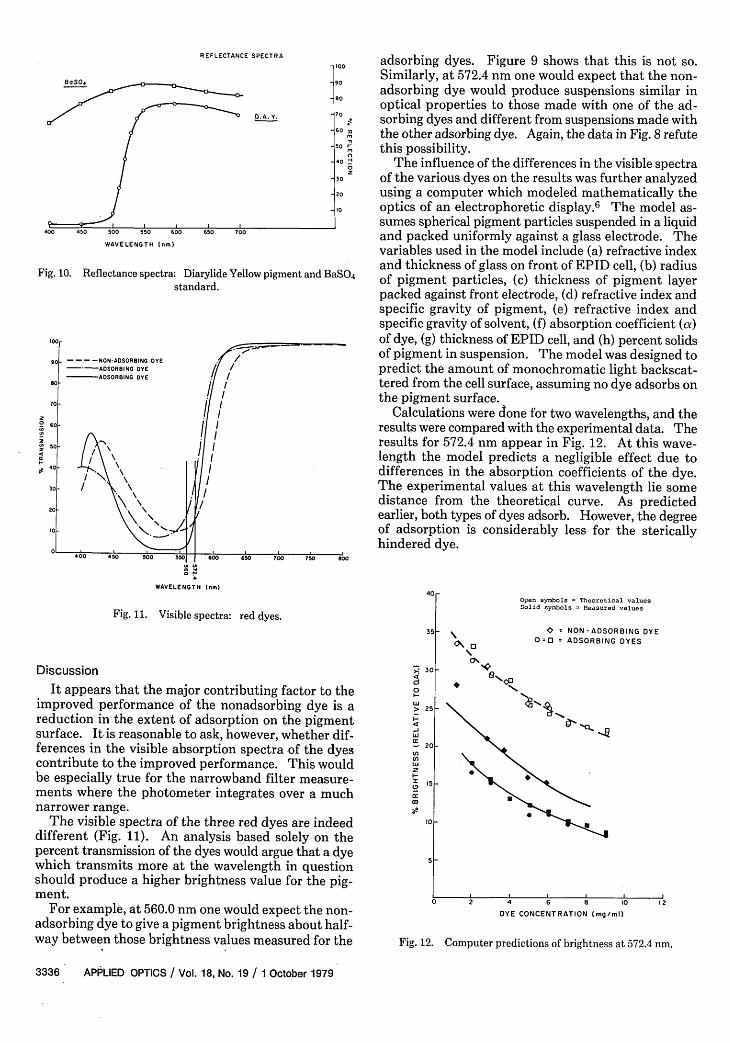
Fig. 10. Reflectance spectra: Diarylide Yellow pigment and BaSO4standard.
- ---- NON-ADSORBING DYE-'-ADSORBING DYE. ADSORBING DYE
// \ \\
X l / .\ /,
400 450 500 55
/ _,1,'il l
/ III
adsorbing dyes. Figure 9 shows that this is not so.Similarly, at 572.4 nm one would expect that the non-adsorbing dye would produce suspensions similar inoptical properties to those made with one of the ad-sorbing dyes and different from suspensions made withthe other adsorbing dye. Again, the data in Fig. 8 refutethis possibility.
The influence of the differences in the visible spectraof the various dyes on the results was further analyzedusing a computer which modeled mathematically theoptics of an electrophoretic display.6 The model as-sumes spherical pigment particles suspended in a liquidand packed uniformly against a glass electrode. Thevariables used in the model include (a) refractive indexand thickness of glass on front of EPID cell, (b) radiusof pigment particles, (c) thickness of pigment layerpacked against front electrode, (d) refractive index andspecific gravity of pigment, (e) refractive index andspecific gravity of solvent, (f) absorption coefficient (!)of dye, (g) thickness of EPID cell, and (h) percent solidsof pigment in suspension. The model was designed topredict the amount of monochromatic light backscat-tered from the cell surface, assuming no dye adsorbs onthe pigment surface.
Calculations were done for two wavelengths, and theresults were compared with the experimental data. Theresults for 572.4 nm appear in Fig. 12. At this wave-length the model predicts a negligible effect due todifferences in the absorption coefficients of the dye.The experimental values at this wavelength lie somedistance from the theoretical curve. As predictedearlier, both types of dyes adsorb. However, the degreeof adsorption is considerably less for the stericallyhindered dye.
Go 650 700 750 BOO
Iah .
WAVELENGTH n)40-
Fig. 11. Visible spectra: red dyes.
35
Discussion
It appears that the major contributing factor to theimproved performance of the nonadsorbing dye is areduction in the extent of adsorption on the pigmentsurface. It is reasonable to ask, however, whether dif-ferences in the visible absorption spectra of the dyescontribute to the improved performance. This wouldbe especially true for the narrowband filter measure-ments where the photometer integrates over a muchnarrower range.
The visible spectra of the three red dyes are indeeddifferent (Fig. 11). An analysis based solely on thepercent transmission of the dyes would argue that a dyewhich transmits more at the wavelength in questionshould produce a higher brightness value for the pig-ment.
For example, at 560.0 nm one would expect the non-adsorbing dye to give a pigment brightness about half-way between those brightness values measured for the
X; 3C4d0I-
> 25
I
- 20InI)wzI-
2CO
N..I~v
IN.
.
Fig. 12. Computer predictions of brightness at 572.4 nm.
3336 APPLIED OPTICS / Vol. 18, No. 19 / 1 October 1979
'00
80
to
LI 6(
2 RC
D, C
It4C
30
50
10
Open symbols = Theoretical valuesSolid symbols - Measured values
0 NON -ADSORBING DYE0=0 = ADSORBING DYES
2- 4 6 a toDYE CONCENTRATION (mg/ml)
12
_ _
_ _u
. . . . . .
I
5
Open symbols = theoretical valuesSolid ymb1s measured values
* NON -ADSORBING DYEOos ADSORBING DYES
0I \.
I I I I 2 4 6 8
DYE CONCENTRATION
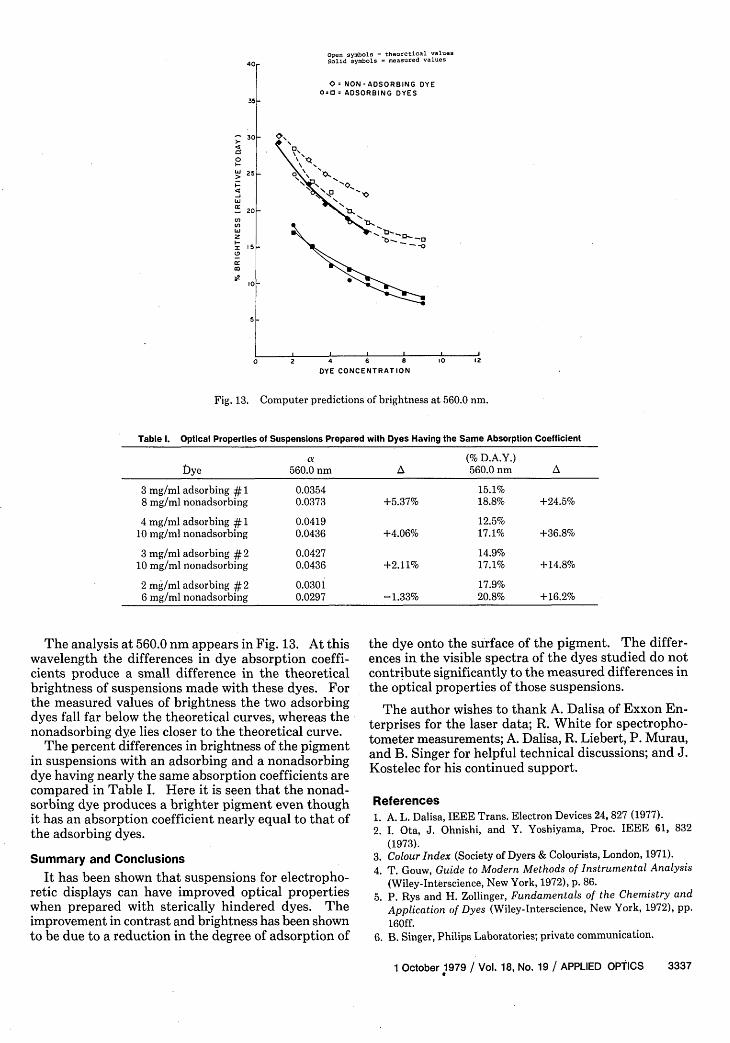
Fig. 13. Computer predictions of brightness at 560.0 nm.
Table 1. Optical Properties of Suspensions Prepared with Dyes Having the Same Absorption Coefficient
a (% D.A.Y.)bye 560.0 nm A 560.0 nm A
3 mg/ml adsorbing # 1 0.0354 15.1%8 mg/ml nonadsorbing 0.0373 +5.37% 18.8% +24.5%
4 mg/ml adsorbing # 1 0.0419 12.5%10 mg/ml nonadsorbing 0.0436 +4.06% 17.1% +36.8%
3 mg/ml adsorbing #2 0.0427 14.9%10 mg/ml nonadsorbing 0.0436 +2.11% 17.1% +14.8%
2 mg/ml adsorbing #2 0.0301 17.9%6 mg/ml nonadsorbing 0.0297 -1.33% 20.8% +16.2%
The analysis at 560.0 nm appears in Fig. 13. At thiswavelength the differences in dye absorption coeffi-cients produce a small difference in the theoreticalbrightness of suspensions made with these dyes. Forthe measured values of brightness the two adsorbingdyes fall far below the theoretical curves, whereas thenonadsorbing dye lies closer to the theoretical curve.
The percent differences in brightness of the pigmentin suspensions with an adsorbing and a nonadsorbingdye having nearly the same absorption coefficients arecompared in Table I. Here it is seen that the nonad-sorbing dye produces a brighter pigment even thoughit has an absorption coefficient nearly equal to that ofthe adsorbing dyes.
Summary and Conclusions
It has been shown that suspensions for electropho-retic displays can have improved optical propertieswhen prepared with sterically hindered dyes. Theimprovement in contrast and brightness has been shownto be due to a reduction in the degree of adsorption of
the dye onto the surface of the pigment. The differ-ences in the visible spectra of the dyes studied do notcontribute significantly to the measured differences in
-the optical properties of those suspensions.
The author wishes to thank A. Dalisa of Exxon En-terprises for the laser data; R. White for spectropho-tometer measurements; A. Dalisa, R. Liebert, P. Murau,and B. Singer for helpful technical discussions; and J.Kostelec for his continued support.
References1. A. L. Dalisa, IEEE Trans. Electron Devices 24, 827 (1977).2. I. Ota, J. Ohnishi, and Y. Yoshiyama, Proc. IEEE 61, 832
(1973).3. Colour Index (Society of Dyers & Colourists, London, 1971).4. T. Gouw, Guide to Modern Methods of Instrumental Analysis
(Wiley-Interscience, New York, 1972), p. 86.5. P. Rys and H. Zollinger, Fundamentals of the Chemistry and
Application of Dyes (Wiley-Interscience, New York, 1972), pp.
160ff.6. B. Singer, Philips Laboratories; private communication.
1 October 1979 / Vol. 18, No. 19 / APPLIED OPTICS 3337
40
35
Cf
0
-
-
=3
zI-
t:a)
30
25
20
1 5
ID
S
'0 12