optical clearing and fluorescence deep-tissue imaging for ... · medical center utrecht, utrecht,...
TRANSCRIPT
ORIGINAL PAPER
Optical clearing and fluorescence deep-tissue imaging for 3Dquantitative analysis of the brain tumor microenvironment
Tonny Lagerweij1,2,3 • Sophie A. Dusoswa1,2,3,4 • Adrian Negrean7 •
Esther M. L. Hendrikx4 • Helga E. de Vries4 • Jeroen Kole5 • Juan J. Garcia-Vallejo4 •
Huibert D. Mansvelder7 • W. Peter Vandertop2,3 • David P. Noske1,2,3 •
Bakhos A. Tannous9 • Rene J. P. Musters5 • Yvette van Kooyk4 • Pieter Wesseling1,2,6,8 •
Xi Wen Zhao1,2,3 • Thomas Wurdinger1,2,3,9
Received: 22 May 2017 / Accepted: 27 June 2017 / Published online: 11 July 2017
� The Author(s) 2017. This article is an open access publication
Abstract
Background Three-dimensional visualization of the brain
vasculature and its interactions with surrounding cells may
shed light on diseases where aberrant microvascular orga-
nization is involved, including glioblastoma (GBM).
Intravital confocal imaging allows 3D visualization of
microvascular structures and migration of cells in the brain
of mice, however, with limited imaging depth. To enable
comprehensive analysis of GBM and the brain microen-
vironment, in-depth 3D imaging methods are needed. Here,
we employed methods for optical tissue clearing prior to
3D microscopy to visualize the brain microvasculature and
routes of invasion of GBM cells.
Methods We present a workflow for ex vivo imaging of
optically cleared brain tumor tissues and subsequent com-
putational modeling. This workflow was used for quan-
tification of the microvasculature in relation to nuclear or
cellular density in healthy mouse brain tissues and in
human orthotopic, infiltrative GBM8 and E98 glioblastoma
models.
Results Ex vivo cleared mouse brain tissues had a[10-fold
imaging depth as compared to intravital imaging of mouse
brain in vivo. Imaging of optically cleared brain tissue
allowed quantification of the 3D microvascular character-
istics in healthy mouse brains and in tissues with diffuse,
infiltrative growing GBM8 brain tumors. Detailed 3D
visualization revealed the organization of tumor cells rel-
ative to the vasculature, in both gray matter and white
matter regions, and patterns of multicellular GBM net-
works collectively invading the brain parenchyma.
Conclusions Optical tissue clearing opens new avenues for
combined quantitative and 3D microscopic analysis of the
topographical relationship between GBM cells and their
microenvironment.
Keywords Vasculature � Imaging � 3D � CLARITY �iDISCO � Multicellular network
Electronic supplementary material The online version of thisarticle (doi:10.1007/s10456-017-9565-6) contains supplementarymaterial, which is available to authorized users.
Tonny Lagerweij and Sophie A. Dusoswa have contributed equally to
this work.
& Thomas Wurdinger
1 Neuro-oncology Research Group, VU University Medical
Center, CCA Room 3.60, De Boelelaan 1117,
1081 HV Amsterdam, The Netherlands
2 Brain Tumor Center Amsterdam, VU University Medical
Center, Amsterdam, The Netherlands
3 Department of Neurosurgery, VU University Medical Center,
Amsterdam, The Netherlands
4 Department of Molecular Cell Biology and Immunology, VU
University Medical Center, Amsterdam, The Netherlands
5 Department of Physiology, VU University Medical Center,
Amsterdam, The Netherlands
6 Department of Pathology, VU University Medical Center,
Amsterdam, The Netherlands
7 Integrative Neurophysiology, Centre for Neurogenomics and
Cognitive Research, VU University, Amsterdam, The
Netherlands
8 Princess Maxima Center for Pediatric Oncology, University
Medical Center Utrecht, Utrecht, The Netherlands
9 Department of Neurology, Massachusetts General Hospital,
Harvard Medical School, Boston, MA, USA
123
Angiogenesis (2017) 20:533–546
DOI 10.1007/s10456-017-9565-6
Introduction
Glioblastomas (GBMs) remain incurable, partly because of
extensive, diffuse infiltration of the GBM cells into their
surrounding microenvironment. GBM cell invasion and
proliferation leads to changes in the microvasculature,
tissue perfusion, and brain architecture. Increased aware-
ness of spatial heterogeneity of the GBM cells, in relation
to the microvasculature, and intervascular tissue microen-
vironment [1–4], has raised the need for 3D analyses of
brain tumor tissues.
Optical 3D analysis allows imaging of brain structures at
cellular resolution and may serve as a bridge between CT,
PET, or MRI and classical microscopic histology and
immunohistochemistry [5, 6]. Intravital confocal micro-
scopy enables 3D fluorescence imaging on a cellular level
[7, 8], but its use is hampered by sedation time of the
animal, limited imaging depth, small field of view, and
limitations associated with fluorescent labeling [8]. These
limitations do not apply to ex vivo optical imaging. For a
long time, optical imaging of 3D structures was dependent
on histological sectioning [3, 9, 10]. This sectioning is,
however, a laborious and challenging task, since at least
several dozens of histological slices have to be obtained
and properly aligned for the creation of an informative 3D
image. To avoid these laborious and error-prone approa-
ches, optical slicing methods were developed. Optical
slicing involves clearing of tissues to make them trans-
parent, thus enabling deep-tissue fluorophore excitation
and detection. Although optical clearing techniques were
described already more than a century ago [11], the interest
in this approach was boosted by the development of more
advanced clearing techniques such as 3DISCO/iDISCO/
uDISCO, Scale, SeeDB, and CLARITY [12–20], which all
have their specific advantages and disadvantages [18, 21].
Besides new clearing techniques, other major contributions
to optical slicing methods were the development and
improvement of equipment such as multi-photon micro-
scopes and light sheet microscopes. Furthermore, numer-
ous relevant software tools have been developed, including
ImageJ, Vaa3D, Farsight, NeuronStudio, Amira, and Imaris
[22–25].
Here, we employed optical clearance methods to study
GBM cells in the mouse brain microenvironment. We
demonstrate that optically cleared tissues can be imaged up
to at least 2000 lm depth, at subcellular resolution. This
allowed detailed 3D visualization of the brain tumor
microenvironment and revealed patterns of networks of
collectively invading GBM cells.
Methods
Animal care guidelines
All animal experiments were approved by the VU
University Medical Center Animal Welfare review board.
Female, specific pathogen-free, athymic nude-Foxn1nu
mice (6–8 weeks; Harlan/Envigo, The Netherlands) were
kept in filter top cages and received food and water
ad libitum.
Intravital confocal imaging
Application of a cranial window for intravital imaging of
the mouse brain was based on the method as described by
Mostany et al. [26]. Three mice were anesthetized by
isoflurane inhalation and received temgesic (0.05 mg/kg)
preoperatively and dexamethasone (0.2 mg/kg) with car-
prufen (5 mg/kg) postoperatively to prevent edema. With a
0.8-mm cutter, an area with a diameter of 5 mm in the skull
was opened at the designated location. After hemostasis, a
drop of silicon oil was placed onto the dura and a glass
coverslip was glued on top of the craniotomy. Blood ves-
sels were fluorescently stained by intravenous injection of
Lycopersiconesculentum (tomato) lectintomato-FITC. Ima-
ges with a diameter of 350 lm were captured at 50-lmdepth intervals.
Orthotopic GBM xenograft models
Human GBM8 glioblastoma cells [27] and human E98
glioblastoma cells were lentivirally transduced with a
lentivirus vector to stably express the mCherry fluorescent
protein and firefly luciferase (Fluc) [28]. GBM8-FM cells
were cultured as neurospheres in serum-free medium,
supplemented with growth factors (2% of B27 supplement,
1% of N2 supplement, 2 lg/ml heparin, 20 ng/ml recom-
binant human EGF, 10 ng/ml recombinant human bFGF).
E98-FM cells were injected subcutaneously in a donor
mouse. When the tumor reached a diameter of 1 cm, the
tumor was removed and a single-cell suspension was pre-
pared. The harvested GBM cells were washed once with
PBS and concentrated by centrifugation to a concentration
of 1 9 105 cells per ll. Mice were stereotactically injected
with 5 9 105 tumor cells into the striatum. Intracranial
injections were performed under isoflurane anesthesia and
systemic and topical analgesia (buprenorphine, 0.1 mg/kg;
lidocaine 0.5%). The coordinates used for injections were
0.5 mm X, 2 mm Y, and -3 mm Z from the bregma [29].
534 Angiogenesis (2017) 20:533–546
123
Tumor progression was confirmed by Fluc in vivo biolu-
minescence imaging (BLI) after i.p. injection of D-luciferin
(100 mg/kg) and acquiring the photon flux (p/s) using the
Xenogen-IVIS Lumina system under isoflurane anesthesia.
Photoacoustic imaging (PAI)
Three mice with GBM8-FM tumors were used to evaluate
photoacoustic imaging. PAI was performed on a Vevo LAZR
imaging station (FUJIFILM Visualsonics Inc. Toronto, ON,
Canada)which features a hybrid ultrasoundandphotoacoustic
transducer with a tunable nanosecond pulsed laser. Photoa-
coustic oxygenation signals were collected at 750 and 850 nm
and with the provided FUJIFILM Visualsonics imaging
analysis software the average oxygen saturation of the
hemoglobulin was calculated and visualized [30].
CLARITY optical clearing and immunolabeling
Mice were perfused with CLARITY hydrogel according to
the protocol described by Chung et al. [15]. Animals were
deeply anesthetized with an overdose of ketamin/xylazin
and perfused with ice-cold PBS to remove highly auto-
fluorescent hemoglobin, followed by perfusion with
hydrogel solution (4% PFA, 4% acrylamide, 0.05% bis-
acrylamide, 0.25% VA044 initiator in PBS). Brains were
incubated for 24–72 h in hydrogel at 4 �C, and polymer-
ization of the hydrogel was accomplished by deoxygena-
tion, followed by thermal initiation of the polymerization
reaction. Polymerized mouse brains were cut into 3–5 mm
slices and washed to remove free monomers and PFA. An
electrophoretic tissue chamber (ETC) was made, based on
reported specifications [31] (Supplementary Figure S2A).
SDS-clearing buffer (200 mM sodium borate, 4% SDS,
pH8.5) was kept at 37 �C and pumped through the ETC
chamber at a speed of 0.6–1.2 l/min. Tissues were elec-
trophorized during 3–5 days at a constant voltage of 20 V.
The SDS-clearing solution was replaced if pH dropped
below pH 8. After electrophoretic lipid removal, tissues
were washed for 24 h in PBS containing 0.1% Triton X100
at 37 �C. Tissue samples were stained, depending on their
sizes, for 1–7 days in PBS containing DAPI and
lectintomato-DyLight488 or lectintomato-DyLight594 (Vector
Laboratories, dilution 1:500) or lectintomato-FITC (Vector
Laboratories, dilution 1:500). Subsequently, samples were
washed for 24 h in PBS and finally incubated for 6–24 h in
80% glycerol to match refractive indices, resulting in
transparency of the samples.
iDISCO immunolabeling and optical clearing
Brains of mice with established tumor progression were
fixed and stored in 4% buffered formalin for at least 24 h,
up to more than 2 years. These brains were sliced into
3–5 mm thick sections and processed for immunolabeling
and optical clearing with the methanol iDISCO procedure
[32]. Samples were permeabilized with increasing metha-
nol concentrations to a final concentration of 100%
methanol. Next, the brain sections were bleached overnight
at 4 �C in hydrogen peroxide/methanol (ratio of 1:5), after
which tissues were gradually rehydrated to PBS and
washed in PBS with 0.2% Triton X100. To block residual
binding sides, tissues were incubated for three days at room
temperature (RT) with antibody diluent (DAKO). Follow-
ing blocking, the samples were stained for seven days with
primary antibody (anti-RFP, which binds the mCherry
reporter protein expressed in tumor cells) and DyLight488-
conjugated lectintomato at RT. Excess primary antibodies or
lectins were washed away during 3 days. Tissues were
incubated with the secondary antibody (AlexaFluor594-
conjugated anti-rabbit) for seven days. Unbound antibody
was washed away with PBS–Triton during three days, after
which tissues were dehydrated by gradually increasing
methanol concentrations to a final solution of 100%
methanol. Next, remaining lipids were removed by incu-
bation in dichloromethane (DCM)/methanol and 1-h incu-
bation with 100% DCM. To make the samples transparent,
samples were incubated in dibenzyl ether (DBE) for
refractive index matching. It is important to use fresh DCM
and DBE as oxidation of these reagents may result in
suboptimal clearing and a brownish color of the tissues.
Transparent samples were stored in the dark in a closed vial
completely filled with DBE until image acquisition for a
period up to 6 months.
3D image acquisition
Intravital imaging was performed on a custom-built two-
photon laser scanning microscope using Olympus objec-
tives [33]. Ex vivo two-photon images were captured on a
LaVision BioTec microscope system, based on an Olym-
pus BX51WI microscope, connected to a pulsed tunable
(740–1070 nm) laser (Chameleon, Coherent). CLARITY-
cleared tissues were mounted in an imaging chamber filled
with 80% glycerol, whereas iDISCO-cleared tissues were
mounted in a flexible imaging chamber, created with
adhesive poster pads, which was filled with DBE (Sup-
plementary Fig. 3B). Images were acquired with a water
immersion objective (209 magnification, NA 1.00, maxi-
mum working distance 2000 lm) at a voxel size of
0.54 9 0.54 9 1–5 lm. Epifluorescence signals were
separated by dichroic mirrors and filters (DAPI: 420/50,
FITC/DyLight488: 525/50) and collected by a photomul-
tiplier tube (PMT). Laser power was set with an automatic
laser power increment, which increased laser power grad-
ually from 5 to 20% over a depth of maximum 2000 lm.
Angiogenesis (2017) 20:533–546 535
123
Lectintomato-labeled microvasculature and DAPI-stained
nuclei were imaged at an excitation wavelength of 800 nm,
which simultaneously excites all fluorophores. Alterna-
tively, images were acquired with a Leica SP8 confocal
microscope, equipped with a pulsed white light laser and a
10 9 0.4NA air objective or a Nikon A1R confocal
microscope with a 20 9 0.8NA air objective. These images
were taken with a voxel size of 1 lm3, and fluorescent
signals were recorded using gated hybrid detectors.
Data processing
Image reconstruction of the 2-photon images was per-
formed using FIJI with the ‘Stitch Sequence of Grids of
Images’ plugin of FIJI [34]. Background subtraction was
performed by application of a Gaussian filter. Images
obtained with the other microscopes were imported directly
into Imaris software (version 7, Bitplane) and stitched
automatically.
Quantification of signal intensity
Quantification of signal intensity was performed using FIJI.
Epifluorescent signal intensity as a function of imaging
depth was determined by measurement of median signal
intensity at all imaging depths. Median fluorescence was
normalized to the intensity of the most superficial slide.
3D modeling of the vasculature and cell density
Fluorescently stained vessel surfaces were detected and
converted into a mask. This mask was used to create a new,
binary, channel in which the voxels outside the mask were
set to zero and inside the mask to a fixed value. This binary
mask was used to trace blood vessels by the ‘Filaments
Tracer’ option of Imaris, which is a tool developed for the
automatic detection of filament-like structures. Although
this ‘Filaments Tracer’ tool is not completely compatible
for the detection of vessel structures, as it does not allow
the formation of loops, the detected structures co-localized
with most of the fluorescently labeled vessels. During the
detection process, vascular modeling required assignment
of minimal (2 lm) and maximal (10 lm) vessel diameter,
and manual definition of the thresholds for starting points
and seeding points. Nuclei or RFP-positive cells were
rendered using the ‘Spots Rendering’ application of Imaris.
This application visualized the nuclei or cells as artificial
solid objects, enabling quantification of number of nuclei
per ROI and distance of the cells to the nearest blood
vessel. All computational modeling was done ‘unbiased,’
e.g., without additional improvement of the modeling by
manual deletion or insertion of vessel parts.
2D immunohistochemistry
Sections of 5-lm FFPE tumor-containing brain tissues
were processed after heat-induced antigen retrieval with
Tris–EDTA (pH 9.0). Sections were stained with
DyLight488-labeled lectintomato together with rabbit anti-
CD31 antibody (Abcam, ab 28364; dilution 1:1000) or
rabbit anti-RFP antibody (Tebu-Bio, cat. no. 600-901-397;
dilution 1:500). The rabbit antibodies were detected with
AlexaFluor594-labeled anti-rabbit as secondary antibody.
Alternatively, slides were stained with hematoxylin/eosin.
Image acquisition was done with a Zeiss Axio Scan Z1
slide scanner.
Statistical analysis
Statistical analyses were performed using GraphPad Prism
5 (GraphPad Software). Data were presented as
mean ± SD. Unpaired student t tests were used to test
differences between spatial characteristics of different
ROIs. p values \0.05 were considered statistically
significant.
Results
High-resolution intravital imaging of the mouse
brain vasculature is limited to a depth of 200 lm
Intravital imaging of the mouse cerebral vasculature was
performed by two-photon imaging through a cranial window
as schematically shown in Fig. 1a. Through this window, the
superficial blood vessels, which can be used for orientation,
are easily recognized (Fig. 1b). Blood vessels, fluorescently
stained with lectintomato-FITC, were imaged at 50-lmintervals. Under these conditions, the maximal imaging
depth was limited to 200 lm (Fig. 1c, h). Because this
imaging depth was insufficient to image relevant locations
deep into the brain, we decided to further explore ex vivo
imaging methods for the visualization and quantification of
the relation between tumor cells and the brain microenvi-
ronment, with a focus on the brain tumor vasculature.
Ex vivo two-photon imaging of optically cleared
brain tissue
In order to microscopically visualize regions throughout
the entire mouse brain, optical clearing methods of mouse
brain tissue were employed. Brains were stained and
cleared by either the CLARITY [31] procedure or the
methanol-based iDISCO method [32]. Brain slides of
3–5 mm thickness were processed to render transparent
tissue, as shown for the iDISCO procedure in Figs. 1d, e.
536 Angiogenesis (2017) 20:533–546
123
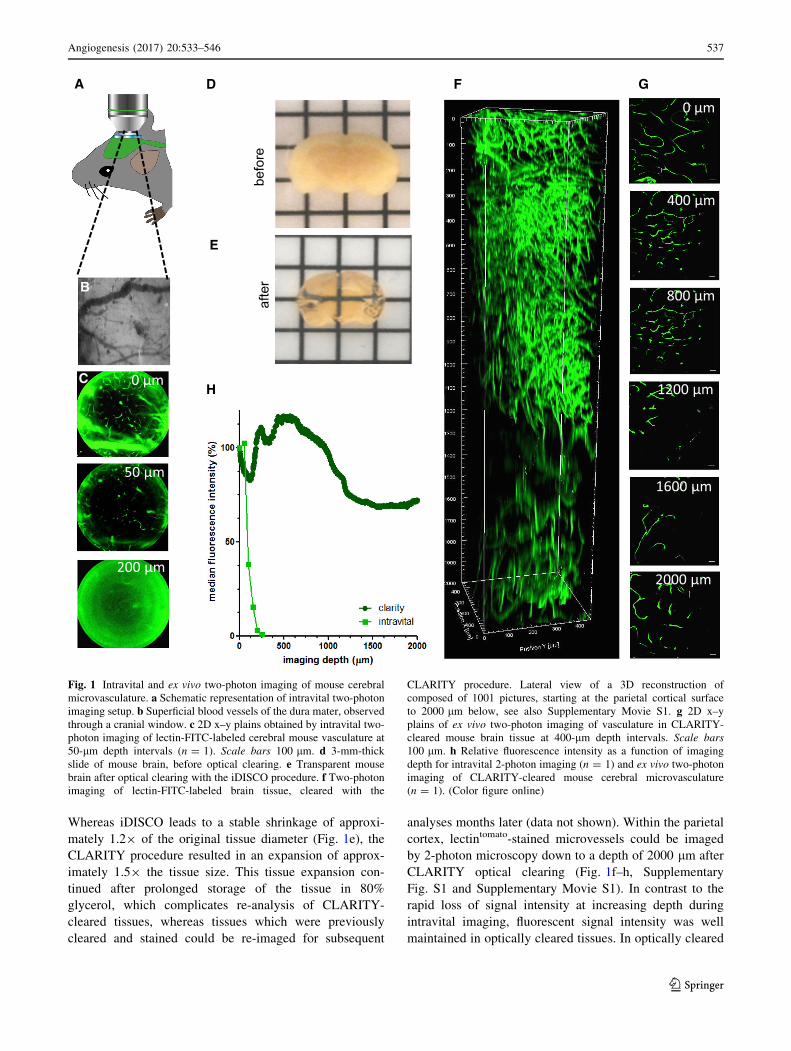
Whereas iDISCO leads to a stable shrinkage of approxi-
mately 1.29 of the original tissue diameter (Fig. 1e), the
CLARITY procedure resulted in an expansion of approx-
imately 1.59 the tissue size. This tissue expansion con-
tinued after prolonged storage of the tissue in 80%
glycerol, which complicates re-analysis of CLARITY-
cleared tissues, whereas tissues which were previously
cleared and stained could be re-imaged for subsequent
analyses months later (data not shown). Within the parietal
cortex, lectintomato-stained microvessels could be imaged
by 2-photon microscopy down to a depth of 2000 lm after
CLARITY optical clearing (Fig. 1f–h, Supplementary
Fig. S1 and Supplementary Movie S1). In contrast to the
rapid loss of signal intensity at increasing depth during
intravital imaging, fluorescent signal intensity was well
maintained in optically cleared tissues. In optically cleared
A
B
0 μm
50 μm
200 μm
E
D F
0 μm
400 μm
800 μm
1200 μm
1600 μm
2000 μm
G
befo
reaf
ter
HC
Fig. 1 Intravital and ex vivo two-photon imaging of mouse cerebral
microvasculature. a Schematic representation of intravital two-photon
imaging setup. b Superficial blood vessels of the dura mater, observed
through a cranial window. c 2D x–y plains obtained by intravital two-
photon imaging of lectin-FITC-labeled cerebral mouse vasculature at
50-lm depth intervals (n = 1). Scale bars 100 lm. d 3-mm-thick
slide of mouse brain, before optical clearing. e Transparent mouse
brain after optical clearing with the iDISCO procedure. f Two-photonimaging of lectin-FITC-labeled brain tissue, cleared with the
CLARITY procedure. Lateral view of a 3D reconstruction of
composed of 1001 pictures, starting at the parietal cortical surface
to 2000 lm below, see also Supplementary Movie S1. g 2D x–y
plains of ex vivo two-photon imaging of vasculature in CLARITY-
cleared mouse brain tissue at 400-lm depth intervals. Scale bars
100 lm. h Relative fluorescence intensity as a function of imaging
depth for intravital 2-photon imaging (n = 1) and ex vivo two-photon
imaging of CLARITY-cleared mouse cerebral microvasculature
(n = 1). (Color figure online)
Angiogenesis (2017) 20:533–546 537
123
Brain vasculature Computa�onal model
Brain vasculature Nuclei
ROI granular layer ROI molecular layer Brain vasculature Computa�onal model Nuclei
A B
D E
F
G
GLML
yz
xz
xy
Brain vasculature Computa�onal model
C
*** *** *** *** ** NS
GL ML GL ML GL ML GL ML GL ML GL ML
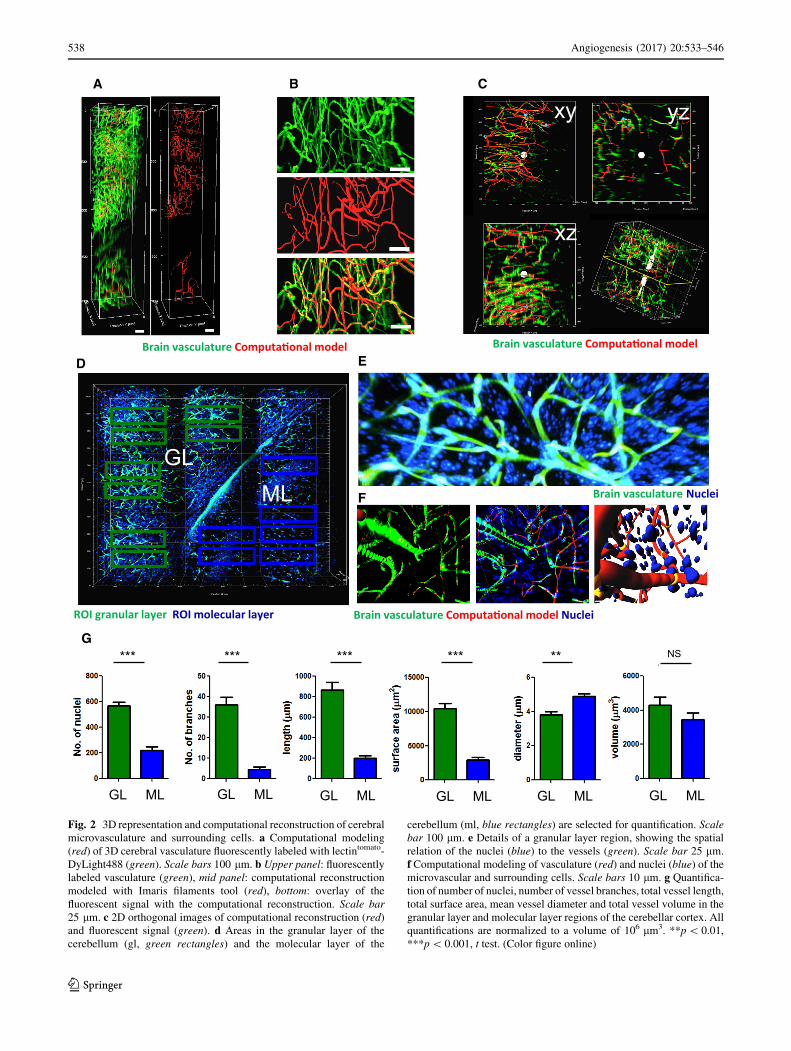
Fig. 2 3D representation and computational reconstruction of cerebral
microvasculature and surrounding cells. a Computational modeling
(red) of 3D cerebral vasculature fluorescently labeled with lectintomato-
DyLight488 (green). Scale bars 100 lm. b Upper panel: fluorescently
labeled vasculature (green), mid panel: computational reconstruction
modeled with Imaris filaments tool (red), bottom: overlay of the
fluorescent signal with the computational reconstruction. Scale bar
25 lm. c 2D orthogonal images of computational reconstruction (red)
and fluorescent signal (green). d Areas in the granular layer of the
cerebellum (gl, green rectangles) and the molecular layer of the
cerebellum (ml, blue rectangles) are selected for quantification. Scale
bar 100 lm. e Details of a granular layer region, showing the spatial
relation of the nuclei (blue) to the vessels (green). Scale bar 25 lm.
f Computational modeling of vasculature (red) and nuclei (blue) of the
microvascular and surrounding cells. Scale bars 10 lm. g Quantifica-
tion of number of nuclei, number of vessel branches, total vessel length,
total surface area, mean vessel diameter and total vessel volume in the
granular layer and molecular layer regions of the cerebellar cortex. All
quantifications are normalized to a volume of 106 lm3. **p\ 0.01,
***p\ 0.001, t test. (Color figure online)
538 Angiogenesis (2017) 20:533–546
123

tissues, signal intensity remained above 65% of superficial
signal intensity along the complete working distance of the
lens of 2000 lm (Fig. 1h).
Computational modeling of vasculature in healthy
mouse brain tissue
Understanding the relation between glioblastoma cells and
the vasculature would benefit from quantification of dif-
ferent aspects of their relationship. With the use of healthy
mouse brain tissue, a workflow for the quantification of the
vasculature was developed (Supplementary Fig. S2). In a
stack of lectintomato-FITC-stained vessels (Fig. 2a, green),
different regions of interest (ROIs) were selected for
computational modeling (Fig. 2a, red regions). Fluores-
cently stained blood vessels (Fig. 2b, green, upper panel)
were converted to computationally modeled vessels
(Fig. 2b, red, middle panel). Because these computational
models were unbiased, i.e., without manual postprocessing,
the overlay of the modeled vessels showed a high degree of
concordance, but was not perfect. (Figure 2b overlay,
bottom panel). By using 2D orthogonal planes, we esti-
mated the concordance of the fluorescently labeled vascu-
lature with the computational modeled vasculature to be
approximately 80% (Fig. 2c, Supplementary Fig. S4).
Next, the combination of lectintomato-FITC-labeled
A
αRFP-594lectin-488 αCD31-594
αCD31-594lectin-488
lectin-488
100%
0%
B
C
D
E
F
G
Fig. 3 Lectintomato binding to
the microvasculature in the
presence of tumor cells.
a Photoacoustic coronal image
of an intracranial GBM8-FM
tumor with highly oxygenated,
vascular regions indicated in
red. b BLI image showing the
presence of the GBM8-FM
tumor. c Hematoxylin/eosin-
stained section of the same
tumor as depicted in a,b showing the association
between highly vascularized/
oxygenated areas and the
presence of tumor. d Brain
tissue with GBM8-FM tumor
stained with lectintomato-
DyLight488 (green)-directed
against blood vessels, and with
an anti-RFP-AlexaFluor594
antibody directed against the
GBM8-FM cells. e–g Details of
(d) showing that in the presence
of tumor, lectintomato (green)
and anti-CD31 antibody (red)
stain the same microvessels.
Scale bars a, c, d 700 lm; Scale
bars e, f, g 10 lm. (Color
figure online)
Angiogenesis (2017) 20:533–546 539
123
*** *** ** *
* *
A B
CCCL
WMTC
DGM
C D
TC CL
E
** ns ns nsCL GBM8 CL E98
CL GBM8 CL E98CL GBM8 CL E98CL GBM8 CL E98
CL GBM8 CL E98
540 Angiogenesis (2017) 20:533–546
123
microvasculature and counterstained nuclei (DAPI) was
imaged using two-photon microscopy (Fig. 2d). These
large, tiled image files show a striking vignetting at the
borders of each acquired imaging field. This vignetting is
due to the fact that standard water immersion or air
objectives—which are not corrected for the high refractive
indexes of the embedding medium—were used for the
acquisition. Because this could potentially result in arti-
facts in the stitching and consequent quantification, selec-
ted ROIs were centered within the tiles. ROIs were selected
within the granular layer (GL, green rectangles) and in the
molecular layer (ML, blue rectangles) of the cerebellum
(Fig. 2d). The obtained 3D stack with lectintomato-stained
microvessels and DAPI-stained nuclei enabled detailed
fluorescently imaging (Fig. 2e) and allowed computational
modeling (Fig. 2f). After such computational modeling, the
number of DAPI-stained nuclei, and quantitative data of
the vasculature, such as number of branches, total vessel
length, volume, area, and diameter of single segments per
volume of 100 9 100 9 100 lm (=106 lm3), were calcu-
lated. These analyses revealed large differences in the
vasculature of the GL versus the ML of the cerebellum
(Fig. 2g, Supplementary Movie S2). These observed dif-
ferences corroborate findings of previous studies reporting
that, within different brain regions, large differences in
vasculature are present [35], thus emphasizing that only
identical, anatomically well-defined, areas should be
compared to evaluate spatial relations between cells and
their brain microenvironment.
The lectintomato-staining pattern
of the microvasculature is not affected by GBM cells
Because tumor cells are known to alter the endothelial
glycocalyx [36], we confirmed the binding of lectintomato to
blood vessels in tumor-containing tissue. Brain tumors
were induced by orthotopic xenograft transplantation of
human GBM8-FM cells into nude mice. First, the presence
of a GBM8-FM tumor was detected by photoacoustic
imaging, which revealed increased oxygenation levels in
the tumor areas, indicative for a change in the vasculature
(Fig. 3a). Tumor growth was confirmed by biolumines-
cence imaging (Fig. 3b), and H&E staining of the brain
clearly indicated the presence of tumor in the striatum
(Fig. 3c). Furthermore, tumor was easily identified on tis-
sue slides stained with lectintomato and anti-RFP antibody,
which stains the GBM8-FM cells (Fig. 3d). Combined
staining with lectintomato and anti-CD31 (Fig. 3e–g)
demonstrated overlay of lectintomato-stained and CD31-
stained microvasculature, indicating that tumor growth
does not significantly influence the lectin-binding pattern
of brain microvasculature.
Computational modeling of the GBM vasculature
in mouse brain
As the iDISCO method allowed easy processing of
already formalin-fixed materials, this method was
employed for optical clearing of the formalin-fixed tumor
bearing brain tissues. The optical clearing procedures
were performed with GBM8-FM xenografted brain tissues
which were fixed for less than 2 months and with E98-
FM xenografted brain tissues which were fixed for over
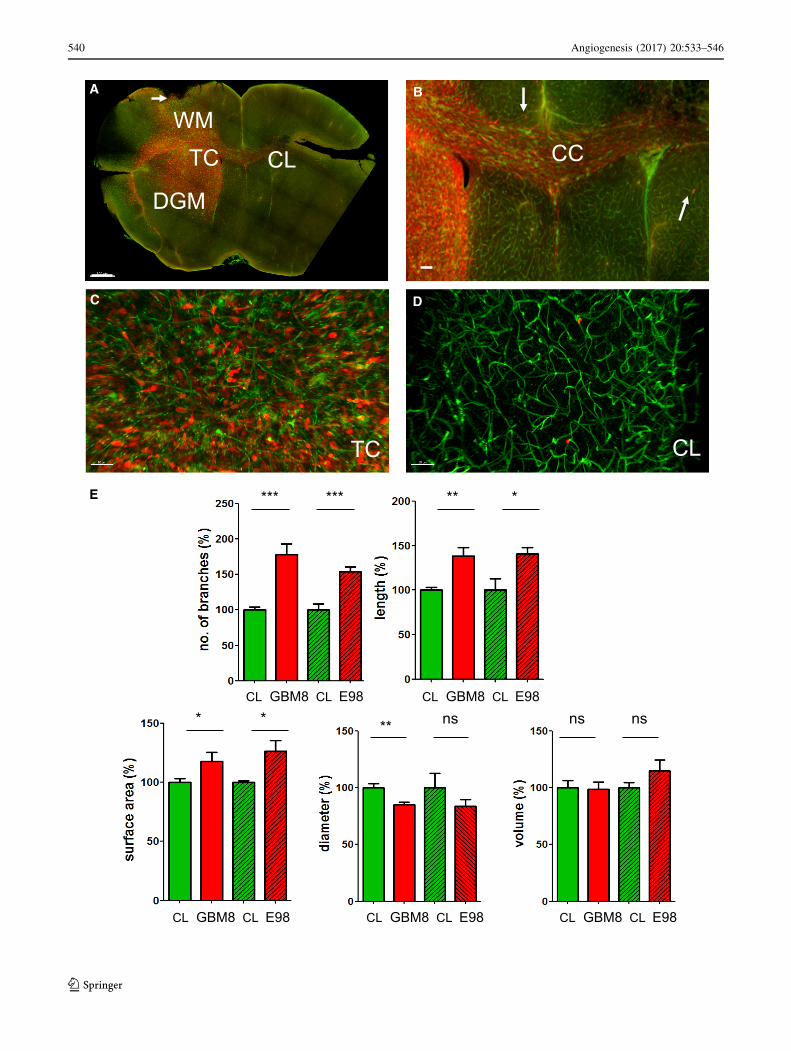
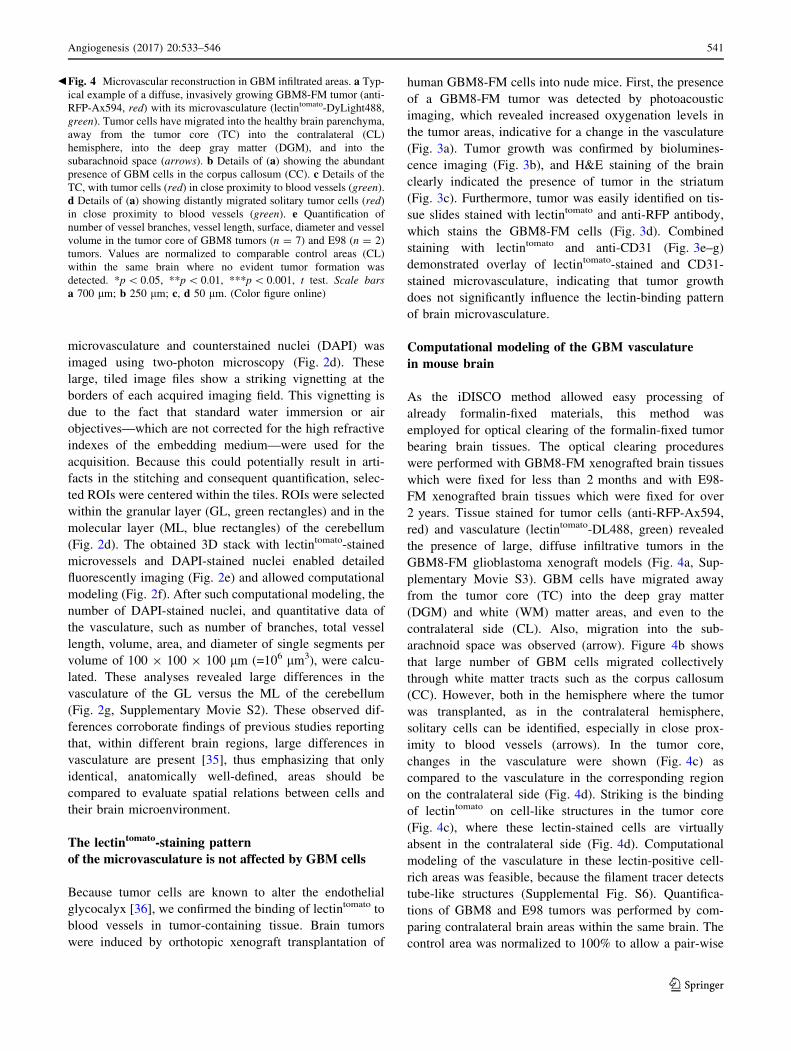
2 years. Tissue stained for tumor cells (anti-RFP-Ax594,
red) and vasculature (lectintomato-DL488, green) revealed
the presence of large, diffuse infiltrative tumors in the
GBM8-FM glioblastoma xenograft models (Fig. 4a, Sup-
plementary Movie S3). GBM cells have migrated away
from the tumor core (TC) into the deep gray matter
(DGM) and white (WM) matter areas, and even to the
contralateral side (CL). Also, migration into the sub-
arachnoid space was observed (arrow). Figure 4b shows
that large number of GBM cells migrated collectively
through white matter tracts such as the corpus callosum
(CC). However, both in the hemisphere where the tumor
was transplanted, as in the contralateral hemisphere,
solitary cells can be identified, especially in close prox-
imity to blood vessels (arrows). In the tumor core,
changes in the vasculature were shown (Fig. 4c) as
compared to the vasculature in the corresponding region
on the contralateral side (Fig. 4d). Striking is the binding
of lectintomato on cell-like structures in the tumor core
(Fig. 4c), where these lectin-stained cells are virtually
absent in the contralateral side (Fig. 4d). Computational
modeling of the vasculature in these lectin-positive cell-
rich areas was feasible, because the filament tracer detects
tube-like structures (Supplemental Fig. S6). Quantifica-
tions of GBM8 and E98 tumors was performed by com-
paring contralateral brain areas within the same brain. The
control area was normalized to 100% to allow a pair-wise
bFig. 4 Microvascular reconstruction in GBM infiltrated areas. a Typ-
ical example of a diffuse, invasively growing GBM8-FM tumor (anti-
RFP-Ax594, red) with its microvasculature (lectintomato-DyLight488,
green). Tumor cells have migrated into the healthy brain parenchyma,
away from the tumor core (TC) into the contralateral (CL)
hemisphere, into the deep gray matter (DGM), and into the
subarachnoid space (arrows). b Details of (a) showing the abundant
presence of GBM cells in the corpus callosum (CC). c Details of the
TC, with tumor cells (red) in close proximity to blood vessels (green).
d Details of (a) showing distantly migrated solitary tumor cells (red)
in close proximity to blood vessels (green). e Quantification of
number of vessel branches, vessel length, surface, diameter and vessel
volume in the tumor core of GBM8 tumors (n = 7) and E98 (n = 2)
tumors. Values are normalized to comparable control areas (CL)
within the same brain where no evident tumor formation was
detected. *p\ 0.05, **p\ 0.01, ***p\ 0.001, t test. Scale bars
a 700 lm; b 250 lm; c, d 50 lm. (Color figure online)
Angiogenesis (2017) 20:533–546 541
123
comparison of the tumor versus control area. The quan-
tifications revealed an increase in the number of vessel
branches, increase in total vessel length, and an increase
in surface area of these vessels within the tumor regions.
The mean vessel diameter was slightly lower in the tumor
core as compared to the same region of the contralateral
side, resulting in comparable vessel volume in both areas
for both the GBM8 tumor and the E98FM tumor
(Fig. 4e).
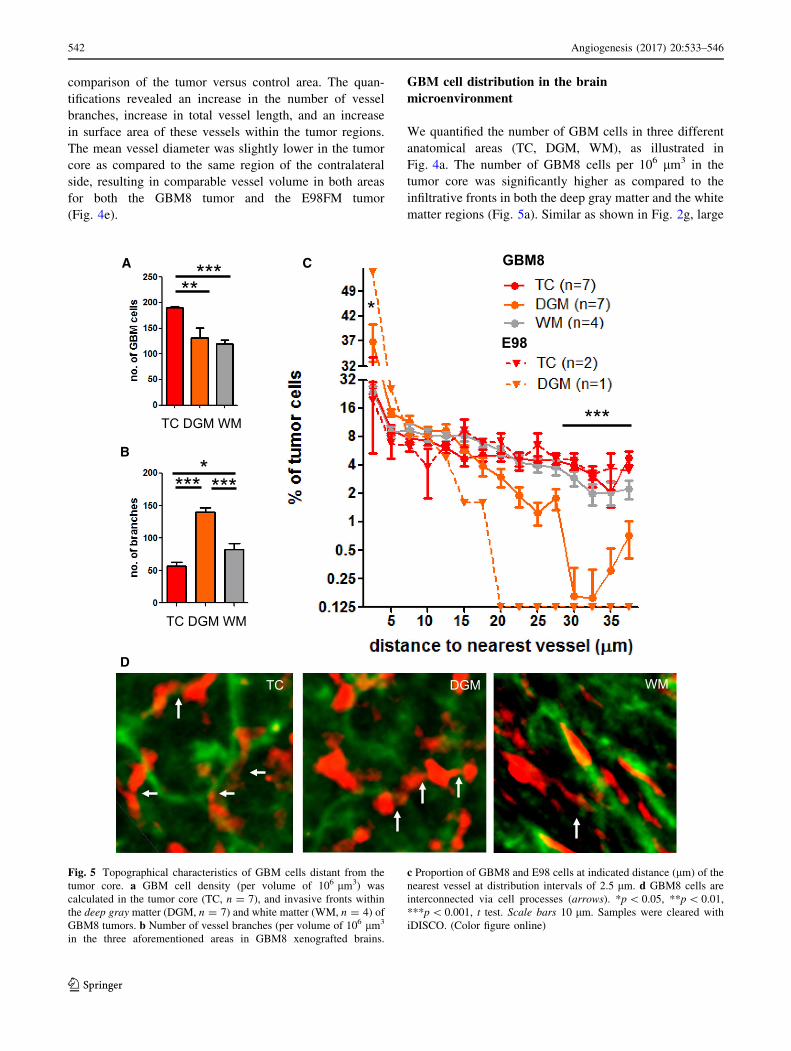
GBM cell distribution in the brain
microenvironment
We quantified the number of GBM cells in three different
anatomical areas (TC, DGM, WM), as illustrated in
Fig. 4a. The number of GBM8 cells per 106 lm3 in the
tumor core was significantly higher as compared to the
infiltrative fronts in both the deep gray matter and the white
matter regions (Fig. 5a). Similar as shown in Fig. 2g, large
*****
TC DGM WM
A
**** ***
B
D
TC DGM WM
TC DGM WM
C
***
*
GBM8
E98
Fig. 5 Topographical characteristics of GBM cells distant from the
tumor core. a GBM cell density (per volume of 106 lm3) was
calculated in the tumor core (TC, n = 7), and invasive fronts within
the deep gray matter (DGM, n = 7) and white matter (WM, n = 4) of
GBM8 tumors. b Number of vessel branches (per volume of 106 lm3
in the three aforementioned areas in GBM8 xenografted brains.
c Proportion of GBM8 and E98 cells at indicated distance (lm) of the
nearest vessel at distribution intervals of 2.5 lm. d GBM8 cells are
interconnected via cell processes (arrows). *p\ 0.05, **p\ 0.01,
***p\ 0.001, t test. Scale bars 10 lm. Samples were cleared with
iDISCO. (Color figure online)
542 Angiogenesis (2017) 20:533–546
123
differences in vessel characteristics were observed between
distinct anatomical regions, as shown for the number of
vessel branches (Fig. 5b), and other parameters (Supple-
mentary Fig. S7).
Next, we calculated the distance of the GBM8 tumor cells
to the microvessels in the three anatomical areas. In the
observed E98-FM tumor xenografts, infiltration was less
pronounced as compared to the GBM8 tumors (Supple-
mentary Fig. 5), which limited the quantitation of the E98
tumor cells to the tumor core and the graymatter areas. In the
tumor core, 29.8%of theGBM8 tumor cells were located at a
distance of[20 lm from the nearest blood vessel. Tumor
cells in the infiltrative front within the deep gray matter were
more closely located to the blood vessels; in this gray matter
area, only 9.5% of the GBM8 tumor cells was located at a
distance of[20 lmfrom their nearest blood vessel (Fig. 5c).
The E98 tumor cells were even more closely associated with
the vasculature, with[99% of the invasive GBM cells in the
deep gray matter located at a distance of\20 lm from the
nearest blood vessel (Fig. 5c). These results may suggest
some preference for perivascular migration of GBM cells in
the deep gray matter, whereas in the tumor core alternative
migration routes, such as through the brain parenchyma, are
used. An alternative explanation is that proliferation of the
GBM cells in the tumor core has resulted in an expansion of
the intervascular compartment, thus resulting in larger dis-
tances of the tumor cells from the microvasculature. Inter-
estingly, in thewhitematter regions, the distance distribution
of the GBM cells to the nearest blood vessels was compa-
rable to the tumor core regions, suggesting that tumor cell
migration in the white matter area does not solely depend on
blood vessel co-option, but may also occur via white matter
tracts. Another striking observation is the presence of a
subset of tumor cells that are interconnected by cellular
processes similar as the multicellular networks as postulated
by Osswald et al. [37]. Groups of approximately 4–6 cells
were interconnected by tubular, ‘dendrite-like’ structures
(Fig. 5d, arrows). These results demonstrate that optically
cleared tissues can be used to detect subtle changes in the
brain tumor microvasculature, and allow visualization and
quantitation of GBM cells, and quantitation of the relative
position of GBM cells to the brain microvasculature. The
proposed workflow (Supplementary Fig. S2) offers an
attractive additional method for 3D histology (Supplemen-
tary Movie S3), complementary to traditional histological
methods.
Discussion
In the present study, we show the use of optically cleared
brain tissues to allow visualization of cerebral microvas-
culature and the organization of nuclei or tumor cells in the
brain tumor microenvironment. For this, we developed an
effective workflow, which was explored to quantify subtle
changes in the vasculature, and moreover, to visualize and
measure the topographical relationship between GBM cells
and their microenvironment in an invasive orthotopic GBM
model in mice. Transparent adult mouse brain tissues were
prepared with the CLARITY protocol or the iDISCO
procedure. Both methods allowed detailed optical imaging
and 3D reconstruction of the microvasculature and distri-
bution of cells or nuclei. Computational modeling allowed
quantitative analysis, showing differences in the GBM cell
distribution in distinct regions of the brain.
Intravital imaging was not suitable to image relevant
regions of intracranial tumor due to its limited imaging
depth and small fields of view. Therefore, we extended our
methods to study the tumor microenvironment to ex vivo
3D imaging of transparent brain tissues. Ex vivo 3D whole-
tissue imaging has become a maturing field of research
[38], and many tissue-clearing protocols have been devel-
oped recently. Most of these clearing protocols focus on
improvement of fluorescence signal intensity because
conventional clearing protocols caused quenching of fluo-
rescence signal. CLARITY and iDISCO procedures have
been reported to be compatible with fluorescently stained
tissues [18, 20, 31, 32]. Both procedures remove the highly
abundant lipids in myelin-rich brain tissue [39], which is an
important step to obtain optically transparent tissues, but
also improves antibody penetration. Improvement of anti-
body penetration is important because immunofluorescent
staining of large tissues is still a challenge [40, 41]. Fur-
thermore, we noticed that certain antibodies require further
optimization for staining of large tissues. For example,
anti-vimentin staining, which was successfully used to
visualize E98FM tumor cells on traditional 5-lm sections
[42], did not result in detection of tumor cells in our
iDISCO processed samples, and the CD31 staining was
hampered by low signal-to-noise ratio (data not shown).
For the use of antibodies for additional markers, opti-
mization steps such as titration of the antibody concentra-
tions, and tissue pretreatment, needs to be validated for
each antibody [18]. Besides the use of antibodies to obtain
clear structure information, these antibodies could also be
validated for their use to provide functional information.
These could include the staining of IgG leakiness [43] or
the use of other proteins which leak out of the vasculature
after BBB disruption. To ensure complete and consistent
tissue staining, we limited the thickness of the tissue slides
to approximately 3–5 mm and explored the use of lectins,
which have a low molecular weight (71 kD), as compared
to antibodies (150 kD). The used lectin, isolated from
Lycopersiconesculentum (tomato), has a high affinity for
glycan epitopes on endothelial cells [43–45], and on ram-
ified and activated microglia [44, 46], which might explain
Angiogenesis (2017) 20:533–546 543
123
the observed binding of lectintomato to non-endothelial cells
within the brain tumor. In addition, to quantify the cerebral
vasculature and surrounding cells, we have extended the
possibilities of 3D visualization of cleared brain tissue by
the addition of computational modeling with the com-
mercial software package Imaris.
For imaging of optically cleared tissues, numerous
microscopical techniques have been developed, including
two-photon imaging, light sheet microscopy and confocal
imaging, which all have their own advantages and limita-
tions (Supplementary Fig. S8). All used microscopes in this
manuscript were equipped with standard air or water len-
ses. Hence, vignetting is visible on the edges of all acquired
images which leads to artifacts in the stitching of the tiled
images. To prevent these artifacts, special lenses tailored
for CLARITY are developed which could further improve
the quality of tiled images [47].
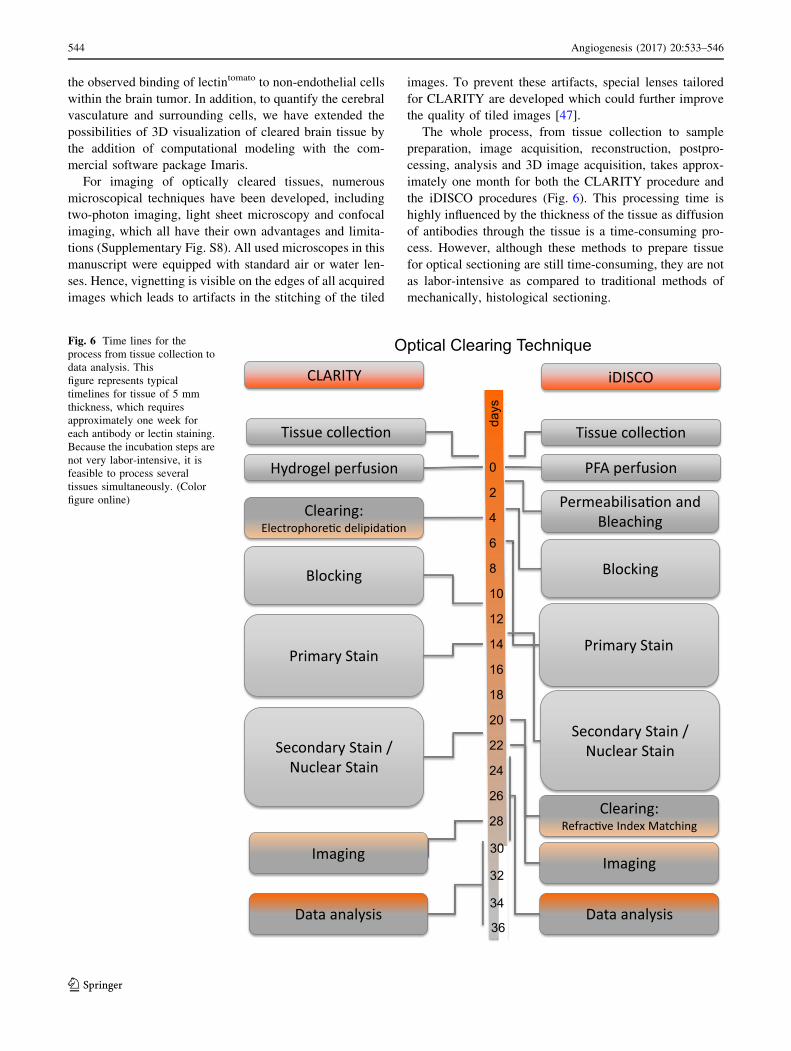
The whole process, from tissue collection to sample
preparation, image acquisition, reconstruction, postpro-
cessing, analysis and 3D image acquisition, takes approx-
imately one month for both the CLARITY procedure and
the iDISCO procedures (Fig. 6). This processing time is
highly influenced by the thickness of the tissue as diffusion
of antibodies through the tissue is a time-consuming pro-
cess. However, although these methods to prepare tissue
for optical sectioning are still time-consuming, they are not
as labor-intensive as compared to traditional methods of
mechanically, histological sectioning.
Hydrogel perfusion 0
2
4
6
8
10
12
14
16
18
20
22
24
26
28
Blocking
Primary Stain
PFA perfusion
Permeabilisa�on andBleaching
Clearing:Refrac�ve Index Matching
CLARITY iDISCO
Imaging
Data analysis
Clearing:Electrophore�c delipida�on
Optical Clearing Technique
Imaging 30
32
Data analysis
Tissue collec�on Tissue collec�on
days
Secondary Stain /Nuclear Stain
34
36
Blocking
Primary Stain
Secondary Stain /Nuclear Stain
Fig. 6 Time lines for the
process from tissue collection to
data analysis. This
figure represents typical
timelines for tissue of 5 mm
thickness, which requires
approximately one week for
each antibody or lectin staining.
Because the incubation steps are
not very labor-intensive, it is
feasible to process several
tissues simultaneously. (Color
figure online)
544 Angiogenesis (2017) 20:533–546
123
GBM is still incurable, partly because of its invasive
character, but also because interactions with its microen-
vironment and intra-tumoral communication. The invasive
character of GBM was already thoroughly described in the
1930s. In that work, four pathways of glioma cell invasion
were recognized: through the brain parenchyma, along
preexisting blood vessels, through white matter tracts and
via the subarachnoid space [48, 49]. The distribution of
GBM cells we observed is fully compatible with those four
migratory patterns. We hypothesized that these migration
patterns will be reflected by the distance of the tumor cells
to the microvasculature. Indeed, we found that in gray
areas, tumor cells migrated mainly in close proximity of
the vasculature. In contrast, in the white matter a bigger
proportion of the GBM cells were located at a larger dis-
tance from the microvasculature, suggestive for migration
following the tracts of the white matter. In GBM, intra-
tumoral communication may take place via secreted fac-
tors, including exosomes [50], or by direct cell–cell contact
of the tumor cells via an interconnected GBM cell network
[37, 51–53]. In line with this, we observed the presence of
interconnected GBM cells, similar as suggested by Oss-
wald et al. [51]. These cell clusters were present in the
tumor core, but also in the infiltrative fronts in the deep
gray matter and the white matter.
In conclusion, we demonstrate the use of optically
cleared, transparent tissues to study in 3D the architecture
of the brain microvasculature as well as the topographical
relationship of GBM cells to the microvasculature.
Detailed 3D visualization and quantitation revealed dif-
ferences in organization of tumor cells relative to the
vasculature in gray matter regions versus white matter
regions, and patterns of GBM cell networks collectively
invading the brain parenchyma. This deep-fluorescence
imaging and 3D quantitative approach opens new avenues
to study the pathobiology of brain cancer cells and their
microenvironment.
Importance of the study
Studying brain tumors in relation to the brain microenvi-
ronment requires in-depth 3D imaging techniques. The use
of optically cleared, transparent tissues may enable such
studies and supplement currently used laborious methods
of mechanically slicing and aligning of tissue slices. We
show that routes of glioblastoma invasion can be studied in
transparent mouse brain tissues. By quantitation of the
topological orientation of GBM cells to the microvascula-
ture we show the feasibility to visualize in high resolution
(organelle level) glioblastoma cells in the context of the
brain microenvironment. We identified GBM cells co-
opting the brain vasculature, GBM cells invading along
white matter tracts, and groups of infiltrated GBM cells
interconnected via ‘dendrite-like’ structures indicative of
collective invasion of the brain microenvironment.
Acknowledgements We thank the Technical Department of the VU
University for construction of the ETC chambers. Jithin Jose of FUJI
FILM Visualsonics for support with photoacoustic imaging and Johan
van Meerlo of VU University Medical Center for assistance with
confocal imaging. Financial support was provided by the European
Research Council 336540 (TW) and the Dutch Organization of Sci-
entific Research 91711366 (TW).
Compliance with ethical standards
Conflict of interest The authors declare that they have no competing
interests.
Open Access This article is distributed under the terms of the Creative
Commons Attribution 4.0 International License (http://creative
commons.org/licenses/by/4.0/), which permits unrestricted use, distri-
bution, and reproduction in anymedium, provided you give appropriate
credit to the original author(s) and the source, provide a link to the
Creative Commons license, and indicate if changes were made.
References
1. Achyut BR, Shankar A, Iskander ASM et al (2016) Chimeric
mouse model to track the migration of bone marrow derived cells
in glioblastoma following anti-angiogenic treatments. Cancer
Biol Ther 17:280–290. doi:10.1080/15384047.2016.1139243
2. Lu KV, Chang JP, Parachoniak CA et al (2012) VEGF inhibits
tumor cell invasion and mesenchymal transition through a MET/
VEGFR2 complex. Cancer Cell 22:21–35. doi:10.1016/j.ccr.
2012.05.037
3. Wu J, He Y, Yang Z et al (2014) 3D BrainCV: simultaneous
visualization and analysis of cells and capillaries in a whole
mouse brain with one-micron voxel resolution. Neuroimage
87:199–208. doi:10.1016/j.neuroimage.2013.10.036
4. Walchli T, Mateos JM, Weinman O et al (2015) Quantitative
assessment of angiogenesis, perfused blood vessels and
endothelial tip cells in the postnatal mouse brain. Nat Protoc
10:53–74. doi:10.1038/nprot.2015.002
5. Weissleder R (2002) Scaling down imaging: molecular mapping
of cancer in mice. Nat Rev Cancer 2:11–18. doi:10.1038/nrc701
6. Helmchen F, Denk W (2005) Deep tissue two-photon micro-
scopy. Nat Methods 2:932–940. doi:10.1038/nmeth818
7. Kobat D, Durst ME, Nishimura N et al (2009) Deep tissue
multiphoton microscopy using longer wavelength excitation. Opt
Express 17:13354. doi:10.1364/OE.17.013354
8. Kobat D, Horton NG, Xu C (2011) In vivo two-photon micro-
scopy to 1.6-mm depth in mouse cortex. J Biomed Opt
16:106014. doi:10.1117/1.3646209
9. Gilhuis HJ, van der Laak JAWM, Pomp J et al (2006) Three-
dimensional (3D) reconstruction and quantitative analysis of the
microvasculature in medulloblastoma and ependymoma subtypes.
Angiogenesis 9:201–208. doi:10.1007/s10456-006-9054-9
10. Gijtenbeek JMM, Wesseling P, Maass C et al (2005) Three-di-
mensional reconstruction of tumor microvasculature: simultane-
ous visualization of multiple components in paraffin-embedded
tissue. Angiogenesis 8:297–305. doi:10.1007/s10456-005-9019-4
11. Spalteholz W (1914) Uber das Durchsichtigmachen von men-
schlichen und tierischen Praparaten und seine theoretischen
Bedingungen. Hierzel S, Leipzig, Leipzig
Angiogenesis (2017) 20:533–546 545
123
12. Hama H, Kurokawa H, Kawano H et al (2011) Scale: a chemical
approach for fluorescence imaging and reconstruction of trans-
parent mouse brain. Nat Neurosci 14:1481–1488. doi:10.1038/nn.
2928
13. Erturk A, Becker K, Jahrling N et al (2012) Three-dimensional
imaging of solvent-cleared organs using 3DISCO. Nat Protoc
7:1983–1995. doi:10.1038/nprot.2012.119
14. Ke M-T, Fujimoto S, Imai T (2013) SeeDB: a simple and mor-
phology-preserving optical clearing agent for neuronal circuit
reconstruction. Nat Neurosci 16:1154–1161. doi:10.1038/nn.3447
15. Liu H, Kao WWY (2009) A novel protocol of whole mount
electro-immunofluorescence staining. Mol Vis 15:505–517.
doi:10.1038/nature12107
16. Chung K, Deisseroth K (2013) CLARITY for mapping the ner-
vous system. Nat Methods 10:508–513. doi:10.1038/nmeth.2481
17. Tomer R, Ye L, Hsueh B, Deisseroth K (2014) Advanced
CLARITY for rapid and high-resolution imaging of intact tissues.
Nat Protoc 9:1682–1697. doi:10.1038/nprot.2014.123
18. Renier N, Wu Z, Simon DJ et al (2014) Resource iDISCO: a
simple, rapid method to immunolabel large tissue samples for
volume imaging. Cell Im. doi:10.1016/j.cell.2014.10.010
19. Costantini I, Ghobril J-P, Di Giovanna AP et al (2015) A versatile
clearing agent for multi-modal brain imaging. Sci Rep 5:9808.
doi:10.1038/srep09808
20. Pan C, Cai R, Quacquarelli FP et al (2016) Shrinkage-mediated
imaging of entire organs and organisms using uDISCO. Nat
Methods. doi:10.1038/nmeth.3964
21. Azaripour A, Lagerweij T, Scharfbillig C et al (2016) A survey of
clearing techniques for 3D imaging of tissues with special ref-
erence to connective tissue. Prog Histochem Cytochem. doi:10.
1016/j.proghi.2016.04.001
22. Peng H, Bria A, Zhou Z et al (2014) Extensible visualization and
analysis for multidimensional images using Vaa3D. Nat Protoc
9:193–208. doi:10.1038/nprot.2014.011
23. Bjornsson CS, Lin G, Al-Kofahi Y et al (2008) Associative image
analysis: a method for automated quantification of 3D multi-pa-
rameter images of brain tissue. J Neurosci Methods 170:165–178.
doi:10.1016/j.jneumeth.2007.12.024
24. de Chaumont F, Dallongeville S, Chenouard N et al (2012) Icy:
an open bioimage informatics platform for extended reproducible
research. Nat Methods 9:690–696. doi:10.1038/nmeth.2075
25. Kutzing MK, Langhammer CG, Luo V et al (2010) Automated
Sholl analysis of digitized neuronal morphology at multiple
scales. J Vis Exp. doi:10.3791/2354
26. Mostany R, Portera-Cailliau C (2008) A craniotomy surgery pro-
cedure for chronic brain imaging. J Vis Exp 5:2–3. doi:10.3791/680
27. Wakimoto H, Kesari S, Farrell CJ et al (2009) Human glioblas-
toma-derived cancer stem cells: establishment of invasive glioma
models and treatment with oncolytic herpes simplex virus vectors.
Cancer Res 69:3472–3481. doi:10.1158/0008-5472.CAN-08-3886
28. Wurdinger T, Badr C, Pike L et al (2008) A secreted luciferase
for ex vivo monitoring of in vivo processes. Nat Methods
5:171–173. doi:10.1038/nmeth.1177
29. Paxinos GKF (2008) The mouse brain in stereotaxic coordinates,
compact, 3rd Edn. George Paxinos, Keith Franklin. ISBN
9780123742445
30. Scheepbouwer C, Meyer S, Burggraaf MJ et al (2016) A multi-
modal imaging approach for longitudinal evaluation of bladder
tumor development in an orthotopic murine model. PLoS ONE.
doi:10.1371/journal.pone.0161284
31. Chung K, Wallace J, Kim S-Y et al (2013) Structural and
molecular interrogation of intact biological systems. Nature
497((supp)):332–337. doi:10.1038/nature12107
32. Renier N, Adams EL, Kirst C et al (2016) Mapping of brain
activity by automated volume analysis of immediate early genes.
Cell 165:1789–1802. doi:10.1016/j.cell.2016.05.007
33. Negrean A, Mansvelder HD (2014) Optimal lens design and use
in laser-scanning microscopy. Biomed Opt Express 5:1588.
doi:10.1364/BOE.5.001588
34. Preibisch S, Saalfeld S, Tomancak P (2009) Globally optimal
stitching of tiled 3D microscopic image acquisitions. Bioinfor-
matics 25:1463–1465. doi:10.1093/bioinformatics/btp184
35. Wesseling P, van der Laak JA, Link M et al (1998) Quantitative
analysis of microvascular changes in diffuse astrocytic neoplasms
with increasing grade of malignancy. Human Pathol 29:352–358
36. Rai S, Nejadhamzeeigilani Z, Gutowski NJ, Whatmore JL (2015)
Loss of the endothelial glycocalyx is associated with increased
E-selectin mediated adhesion of lung tumour cells to the brain
microvascular endothelium. J Exp Clin Cancer Res. doi:10.1186/
s13046-015-0223-9
37. Osswald M, Jung E, Sahm F et al (2015) Brain tumour cells
interconnect to a functional and resistant network. Nature
528:93–98. doi:10.1038/nature16071
38. Vogt N (2015) Transparency in large tissue samples. Nat Meth-
ods 12:2015
39. Yang B, Treweek JB, Kulkarni RP et al (2014) Single-cell phe-
notyping within transparent intact tissue through whole-body
clearing. Cell. doi:10.1016/j.cell.2014.07.017
40. Hiromitsu S, Jin K, Emiko S et al (2015) Novel method for
immunofluorescence staining of mammalian eggs using non-
contact alternating-current electric-field mixing of microdroplets.
Sci Rep 5:15371. doi:10.1038/srep15371
41. Kim S-Y, Cho JH, Murray E et al (2015) Stochastic electro-
transport selectively enhances the transport of highly electro-
mobile molecules. Proc Natl Acad Sci USA 112:E6274–E6283.
doi:10.1073/pnas.1510133112
42. Caretti V, Sewing ACPCP, Lagerweij T et al (2014) Human
pontine glioma cells can induce murine tumors. Acta Neuropathol
127:897–909. doi:10.1007/s00401-014-1272-4
43. Michalak Z, Lebrun A, Di Miceli M et al (2012) IgG leakage may
contribute to neuronal dysfunction in drug-refractory epilepsies
with blood-brain barrier disruption. J Neuropathol Exp Neurol
71:826–838. doi:10.1097/NEN.0b013e31826809a6
44. Jahrling N, Becker K, Dodt H (2009) 3D-reconstruction of blood
vessels by ultramicroscopy. Organogenesis 5:227–230. doi:10.
4161/org.5.4.10403
45. Minamikawa T, Miyake T, Takamatsu T, Fujita S (1987) A new
method of lectin histochemistry for the study of brain angio-
genesis—lectin angiography. Histochemistry 87:317–320. doi:10.
1007/BF00492584
46. Robertson RT, Levine ST, Haynes SM et al (2014) Use of labeled
tomato lectin for imaging vasculature structures. Histochem Cell
Biol 143:225–234. doi:10.1007/s00418-014-1301-3
47. Villacampa N, Almolda B, Gonzalez B, Castellano B (2013)
Tomato lectin histochemistry formicroglial visualization.Methods
Mol Biol 1041:261–279. doi:10.1007/978-1-62703-520-0_23
48. Marx V (2014) Microscopy: seeing through tissue. Nat Methods
11:1209–1214. doi:10.1038/nmeth.3181
49. Scherer HJ (1938) Structural development in gliomas. Am J
Cancer 34:333–351
50. Cuddapah VA, Robel S, Watkins S, Sontheimer H (2014) A
neurocentric perspective on glioma invasion. Nat Rev Neurosci
15:455–465. doi:10.1038/nrn3765
51. Zomer A, Maynard C, Verweij FJ et al (2015) In vivo imaging
reveals extracellular vesicle-mediated phenocopying of metastatic
behavior. Cell 161:1046–1057. doi:10.1016/j.cell.2015.04.042
52. Osswald M, Solecki G, Wick W, Winkler F (2016) A malignant
cellular network in gliomas: potential clinical implications. Neuro
Oncol 18:479–485. doi:10.1093/neuonc/now014
53. Friedl P, Alexander S (2011) Cancer invasion and the microen-
vironment: plasticity and reciprocity. Cell 147:992–1009. doi:10.
1016/j.cell.2011.11.016
546 Angiogenesis (2017) 20:533–546
123