ops for developers monitoring with prometheus for java ... · 5/22/2017 · ops for developers...
TRANSCRIPT

.consulting .solutions .partnership
Ops for DevelopersMonitoring with Prometheus for Java DevelopersAlexander Schwartz, Principal IT Consultant
Entwicklertag Karlsruhe 22 May 2017

Ops for Developers – Monitoring with Prometheus for Java Developers
2© msg | May 2017 | Ops for Developers – Monitoring with Prometheus for Java Developers | Alexander Schwartz
Prometheus Manifesto1
Setup2
How to...3
Prometheus works for Developers (and Ops)4
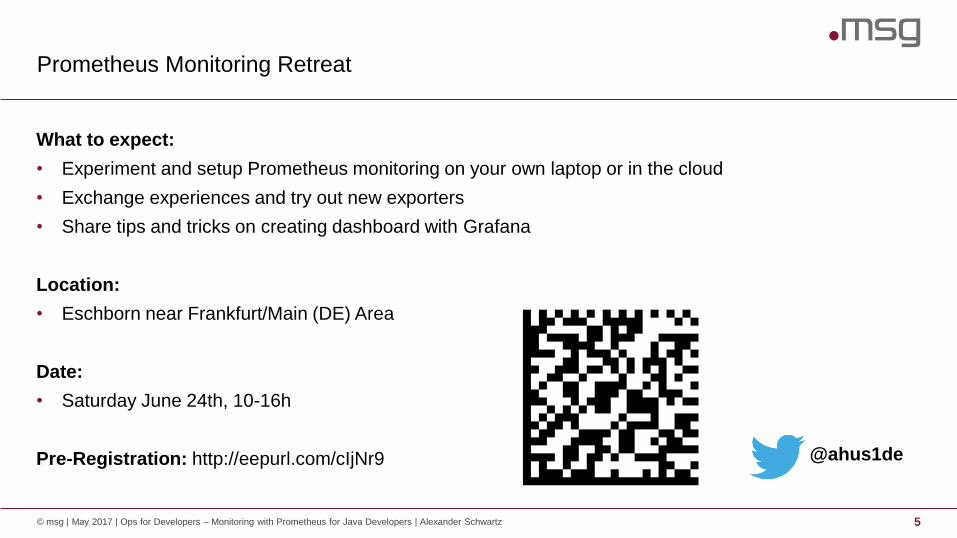
Prometheus Monitoring Retreat
© msg | May 2017 | Ops for Developers – Monitoring with Prometheus for Java Developers | Alexander Schwartz 5
What to expect:
• Experiment and setup Prometheus monitoring on your own laptop or in the cloud
• Exchange experiences and try out new exporters
• Share tips and tricks on creating dashboard with Grafana
Location:
• Eschborn near Frankfurt/Main (DE) Area
Date:
• Saturday June 24th, 10-16h
Pre-Registration: http://eepurl.com/cIjNr9 @ahus1de

Ops for Developers – Monitoring with Prometheus for Java Developers
6© msg | May 2017 | Ops for Developers – Monitoring with Prometheus for Java Developers | Alexander Schwartz
Prometheus Manifesto1
Setup2
How to...3
Prometheus works for Developers (and Ops)4

Prometheus Manifesto
Monitoring
© msg | May 2017 | Ops for Developers – Monitoring with Prometheus for Java Developers | Alexander Schwartz 7
Host & Application
Metrics
Alerts
Dashboards

Prometheus Manifesto
Prometheus is a Monitoring System and Time Series Database
© msg | May 2017 | Ops for Developers – Monitoring with Prometheus for Java Developers | Alexander Schwartz 8
Prometheus is an opinionated solution
for
instrumentation, collection, storage
querying, alerting, dashboards, trending

Prometheus Manifesto
1. PromCon 2016: Prometheus Design and Philosophy - Why It Is the Way It Is - Julius Volz
https://youtu.be/4DzoajMs4DM / https://goo.gl/1oNaZV
Prometheus values …
© msg | May 2017 | Ops for Developers – Monitoring with Prometheus for Java Developers | Alexander Schwartz 9
operational systems monitoring
(not only) for the cloud
simple single node
w/ local storage for a few weeks
horizontal scaling, clustering,
multitenancy
raw logs and events, tracing of requests, magic
anomaly detection, accounting, SLA reporting
over
over
over
over
over
configuration files Web UI, user management
pulling data from single processespushing data from processes
aggregation on nodes
NoSQL query & data massaging
multidimensional data
everything as float64
point-and-click configurations
data silos
complex data types
Ops for Developers – Monitoring with Prometheus for Java Developers
10© msg | May 2017 | Ops for Developers – Monitoring with Prometheus for Java Developers | Alexander Schwartz
Prometheus Manifesto1
Setup2
How to...3
Prometheus works for Developers (and Ops)4
Dashboards
Setup
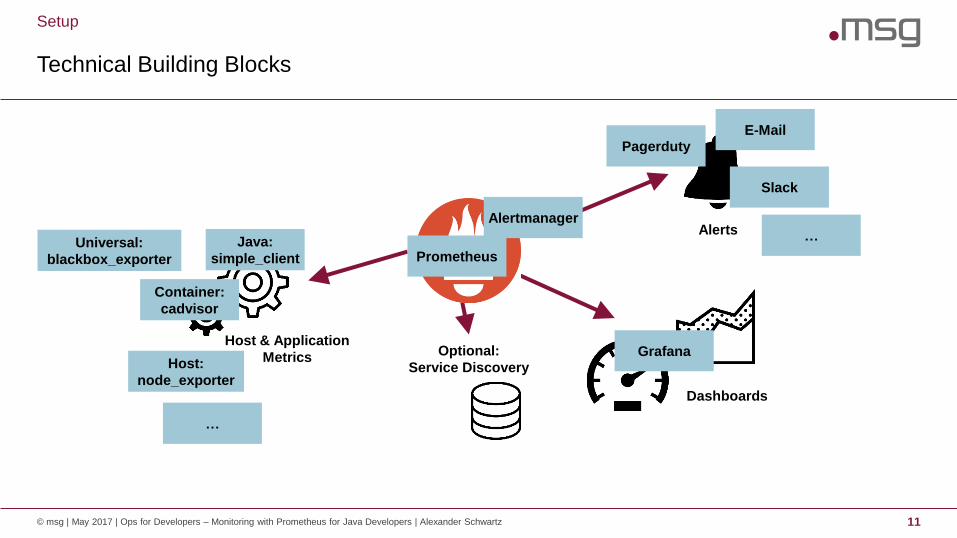
Technical Building Blocks
© msg | May 2017 | Ops for Developers – Monitoring with Prometheus for Java Developers | Alexander Schwartz 11
Host & Application
Metrics
Alerts
Grafana
Slack
Pagerduty
Container:
cadvisor
Java:
simple_client
Host:
node_exporter
…
Optional:
Service Discovery
…
Prometheus
Alertmanager
Universal:
blackbox_exporter

Setup
Targets as configured in Prometheus Configuration
© msg | May 2017 | Ops for Developers – Monitoring with Prometheus for Java Developers | Alexander Schwartz 12
scrape_configs:
- job_name: 'node-exporter'
scrape_interval: 5s
static_configs:
- targets: ['172.17.0.1:9100']

Setup
CPU Metric as exported by the Node Exporter
© msg | May 2017 | Ops for Developers – Monitoring with Prometheus for Java Developers | Alexander Schwartz 13
# HELP node_cpu Seconds the cpus spent in each mode.
# TYPE node_cpu counter
node_cpu{cpu="cpu0",mode="guest"} 0
node_cpu{cpu="cpu0",mode="idle"} 4533.86
node_cpu{cpu="cpu0",mode="iowait"} 7.36
...
node_cpu{cpu="cpu0",mode="user"} 445.51
node_cpu{cpu="cpu1",mode="guest"} 0
node_cpu{cpu="cpu1",mode="idle"} 4734.47
...
node_cpu{cpu="cpu1",mode="iowait"} 7.41
node_cpu{cpu="cpu1",mode="user"} 576.91
...

Setup
Multidimensional Metric as stored by Prometheus
© msg | May 2017 | Ops for Developers – Monitoring with Prometheus for Java Developers | Alexander Schwartz 14
576.91
cpu: cpu1
instance: 172.17.0.1:9100
job: node-exporter
__name__: node_cpu
mode: user

Setup
Calculations based on metrics
© msg | May 2017 | Ops for Developers – Monitoring with Prometheus for Java Developers | Alexander Schwartz 15
Metric:
node_cpu: Seconds the CPUs spent in each mode (Type: Counter).
What percentage of a CPU is used per core?
1 - rate(node_cpu{mode='idle'} [5m])
What percentage of a CPU is used per instance?
avg by (instance) (1 - rate(node_cpu{mode='idle'} [5m]))
function filter parametermetric
Ops for Developers – Monitoring with Prometheus for Java Developers
16© msg | May 2017 | Ops for Developers – Monitoring with Prometheus for Java Developers | Alexander Schwartz
Prometheus Manifesto1
Setup2
How to...3
Prometheus works for Developers (and Ops)4

How to…
Information about your node
© msg | May 2017 | Ops for Developers – Monitoring with Prometheus for Java Developers | Alexander Schwartz 17
Presented by: node_exporter
Free disk space:
Variable: node_filesystem_free
Expression: node_filesystem_free{fstype =~ '(xfs|vboxsf)', device !~ '/dev/mapper/.*' }
Additional Options: Axis / Left Y -> Unit bytes
Percent free:
Variables: node_filesystem_free, node_filesystem_size
Expression: node_filesystem_free / node_filesystem_size {fstype =~ '(xfs|vboxsf)'}
How to…
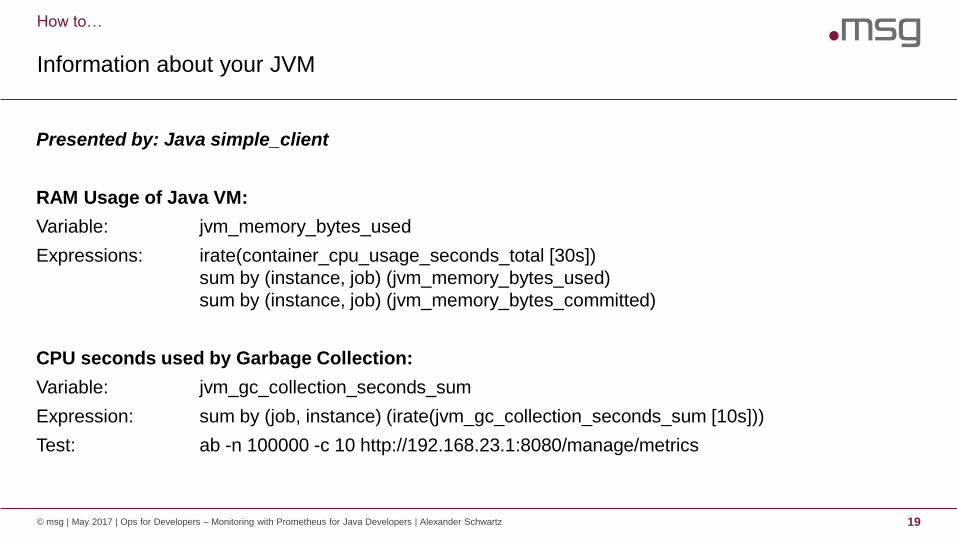
Information about your JVM
© msg | May 2017 | Ops for Developers – Monitoring with Prometheus for Java Developers | Alexander Schwartz 19
Presented by: Java simple_client
RAM Usage of Java VM:
Variable: jvm_memory_bytes_used
Expressions: irate(container_cpu_usage_seconds_total [30s])
sum by (instance, job) (jvm_memory_bytes_used)
sum by (instance, job) (jvm_memory_bytes_committed)
CPU seconds used by Garbage Collection:
Variable: jvm_gc_collection_seconds_sum
Expression: sum by (job, instance) (irate(jvm_gc_collection_seconds_sum [10s]))
Test: ab -n 100000 -c 10 http://192.168.23.1:8080/manage/metrics

How to…
Information about your JVM
© msg | May 2017 | Ops for Developers – Monitoring with Prometheus for Java Developers | Alexander Schwartz 20
Add a Configuration to Spring Boot to serve standard JVM metrics using a custom URL.
@Configuration
public class MetricsApplicationConfig {
@Bean
public synchronized ServletRegistrationBean metrics() {
DefaultExports.initialize();
return new ServletRegistrationBean(new MetricsServlet(),
"/manage/metrics");
}
}

How to…
Information about your Application Metrics
© msg | May 2017 | Ops for Developers – Monitoring with Prometheus for Java Developers | Alexander Schwartz 21
Presented by: Java simple_client, Dropwizard Metrics/Spring
Timings of a method call:
Java Annotation: @Timed
Variables: countedCallExample_snapshot_mean
countedCallExample_snapshot_75thPercentile
countedCallExample_snapshot_98thPercentile
Test: ab -n 10000 -c 10 http://192.168.23.1:8080/api/countedCall

How to…
Information about your JVM
© msg | May 2017 | Ops for Developers – Monitoring with Prometheus for Java Developers | Alexander Schwartz 22
Add a Configuration to Spring Boot to serve standard JVM metrics using a custom URL.
@Configuration
@EnableMetrics(proxyTargetClass = true)
public class MetricsApplicationConfig extends MetricsConfigurerAdapter {
/* ... */
}
How to…
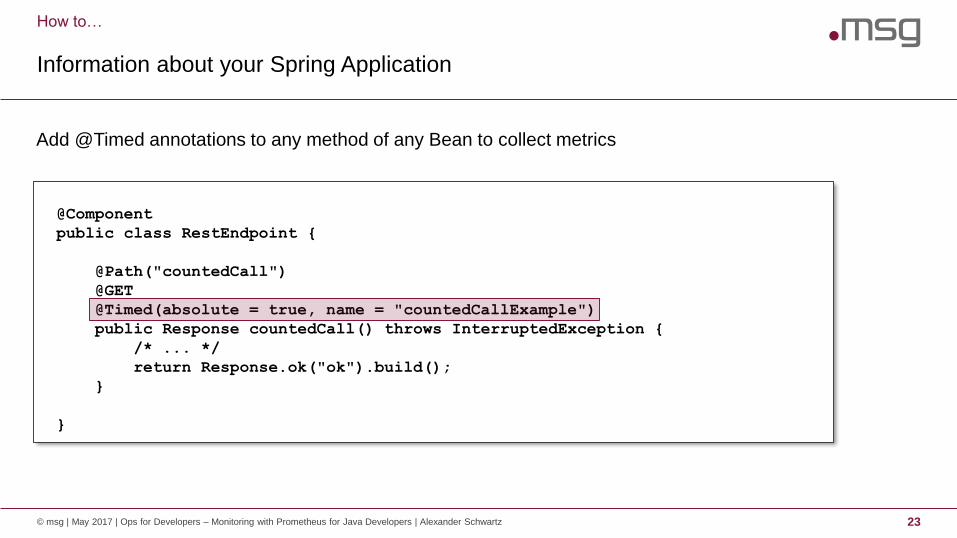
Information about your Spring Application
© msg | May 2017 | Ops for Developers – Monitoring with Prometheus for Java Developers | Alexander Schwartz 23
Add @Timed annotations to any method of any Bean to collect metrics
@Component
public class RestEndpoint {
@Path("countedCall")
@GET
@Timed(absolute = true, name = "countedCallExample")
public Response countedCall() throws InterruptedException {
/* ... */
return Response.ok("ok").build();
}
}

How to…
Information about your External Interfaces
© msg | May 2017 | Ops for Developers – Monitoring with Prometheus for Java Developers | Alexander Schwartz 24
Presented by: Java simple_client, Hystrix/Spring
Hystrix Metrics:
Java Annotation: @HystrixCommand
Test: ab -n 10000 -c 10 http://192.168.23.1:8080/api/externalCall
Variables: hystrix_command_count_success, hystrix_command_count_exceptions_thrown
hystrix_command_latency_total_*
Expressions: irate(hystrix_command_count_success [15s])
irate(hystrix_command_count_exceptions_thrown [15s])
hystrix_command_latency_total_mean
hystrix_command_latency_total_percentile_90
hystrix_command_latency_total_percentile_99

How to…
Information about your External Interfaces – Hystrix Metrics
© msg | May 2017 | Ops for Developers – Monitoring with Prometheus for Java Developers | Alexander Schwartz 25
Register the Hystrix Publisher and add @HystrixCommand for resilience and timing of external calls.
HystrixPrometheusMetricsPublisher.register();
@Component
public class ExternalInterfaceAdapter {
@HystrixCommand(commandKey = "externalCall", groupKey = "interfaceOne")
public String call() {
/* ... */
}
}

How to…
Information about your Spring Servlet Container
© msg | May 2017 | Ops for Developers – Monitoring with Prometheus for Java Developers | Alexander Schwartz 27
Presented by: your own Java metric provider
Tomcat Connector:
Java Class: Write your own: TomcatStatisticsCollector
Variables: tomcat_thread_pool_current_thread_count
tomcat_thread_pool_current_threads_busy
Tomcat DB Connection Pool:
Java Class: Write your own: DatasourceStatisticsCollector
Variables: tomcat_datasource_active
tomcat_datasource_idle
tomcat_datasource_max_idle

How to…
Information about your Spring Servlet Container
© msg | May 2017 | Ops for Developers – Monitoring with Prometheus for Java Developers | Alexander Schwartz 28
public class DatasourceStatisticsCollector extends Collector {
/* ... */
@Override
public List<MetricFamilySamples> collect() {
/* ... */
result.add(buildGauge("active", "number of connections in use",
labelNames, labelValues, tomcatDS.getActive()));
return result;
}
}
new DatasourceStatisticsCollector(dataSource).register();

How to…
Information about your Vert.x application
© msg | May 2017 | Ops for Developers – Monitoring with Prometheus for Java Developers | Alexander Schwartz 29
Presented by: Java Simple Client for Vert.x
Internal Event Bus:
Variables: vertx_eventbus_messages_sent_total
vertx_eventbus_messages_pending
vertx_eventbus_messages_delivered_total
vertx_eventbus_messages_reply_failures_total
HTTP Server metrics:
Variables: vertx_http_servers_requests_count
vertx_http_servers_open_netsockets
Test: ab -n 100000 -c 100 http://192.168.23.1:8081/manage/metrics

How to…
Information about your Vert.x application
© msg | May 2017 | Ops for Developers – Monitoring with Prometheus for Java Developers | Alexander Schwartz 30
// During Setup
vertx = Vertx.vertx(new VertxOptions().setMetricsOptions(
new DropwizardMetricsOptions()
.setRegistryName("vertx")
.addMonitoredHttpClientEndpoint(
new Match().setValue(".*").setType(MatchType.REGEX))
.setEnabled(true)
));
DefaultExports.initialize();
new DropwizardExports(SharedMetricRegistries.getOrCreate("vertx")).register();
// When starting up Routes and a HTTP Server
final Router router = Router.router(vertx);
router.route("/metrics").handler(new MetricsHandler());

How to…
Federation of Prometheus
© msg | May 2017 | Ops for Developers – Monitoring with Prometheus for Java Developers | Alexander Schwartz 31
Any Metric can be exported to other Prometheus instances
http://localhost/prometheus/federate?match[]={job=%22prometheus%22}

How to…
Alerting with Prometheus
© msg | May 2017 | Ops for Developers – Monitoring with Prometheus for Java Developers | Alexander Schwartz 32
Any expression can be used for alerting
ALERT HDD_Alert_warning
IF (1 - node_filesystem_free{mountpoint=~".*"} / node_filesystem_size{mountpoint=~".*"}) * 100 > 70
FOR 5m
LABELS {severity="warning"}
ANNOTATIONS {summary=“High disk usage on {{ $labels.instance }}: filesystem {{$labels.mountpoint}}
more than 70 % full."}
Ops for Developers – Monitoring with Prometheus for Java Developers
34© msg | May 2017 | Ops for Developers – Monitoring with Prometheus for Java Developers | Alexander Schwartz
Prometheus Manifesto1
Setup2
How to...3
Prometheus works for Developers (and Ops)4
Prometheus works for Developers (and Ops)
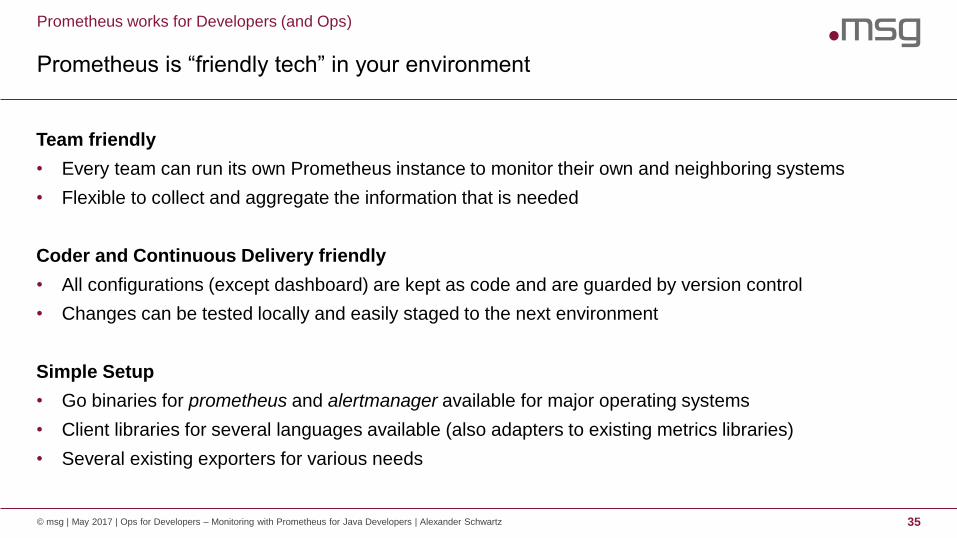
Prometheus is “friendly tech” in your environment
© msg | May 2017 | Ops for Developers – Monitoring with Prometheus for Java Developers | Alexander Schwartz 35
Team friendly
• Every team can run its own Prometheus instance to monitor their own and neighboring systems
• Flexible to collect and aggregate the information that is needed
Coder and Continuous Delivery friendly
• All configurations (except dashboard) are kept as code and are guarded by version control
• Changes can be tested locally and easily staged to the next environment
Simple Setup
• Go binaries for prometheus and alertmanager available for major operating systems
• Client libraries for several languages available (also adapters to existing metrics libraries)
• Several existing exporters for various needs

Links
© msg | May 2017 | Ops for Developers – Monitoring with Prometheus for Java Developers | Alexander Schwartz 36
Prometheus:
https://prometheus.io
Hystrix
https://github.com/Netflix/Hystrix
Dropwizard Metrics
http://metrics.dropwizard.io
@ahus1de
Prometheus on Kubernetes @ fabric8
https://github.com/fabric8io/fabric8-devops
Julius Volz @ PromCon 2016
Prometheus Design and Philosophy - Why It Is the Way It Is
https://youtu.be/4DzoajMs4DM
https://goo.gl/1oNaZV

.consulting .solutions .partnership
Alexander Schwartz
Principal IT Consultant
+49 171 5625767
@ahus1de
msg systems ag (Headquarters)
Robert-Buerkle-Str. 1, 85737 Ismaning
Germany
www.msg-systems.com